v.1

Experiment to grow your product

devtodev is a universal analytics platform that allows you to interact with your users, influence their behavior, and keep experimenting to grow the product.

App traffic analysis - solution for f2p games – photo 1

Engage your audience with push notifications

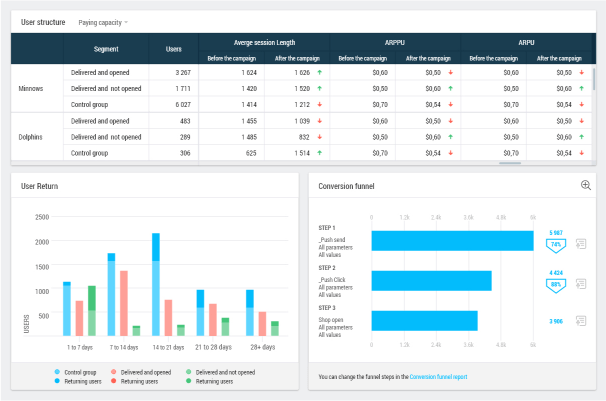
Straight from the devtodev interface, you can set up and launch push campaigns and send triggered push notifications.

Also, you can create dynamic user segments by the install date, user device, country and so on, and add rules for user activities. For example, you can send a push notification to those who opened the store in the app and haven’t made a purchase yet.

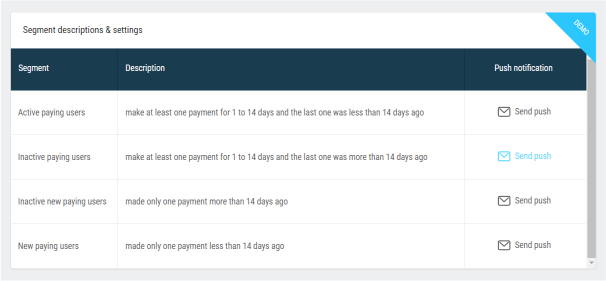
Create rules for your push campaigns and analyze their effectiveness

Triggered push notifications allow you to create rules by which the notifications will be sent automatically, for example, when the user's currency balance is 0, they get a notification to top it up in the store.

When a push campaign is over, you can see and analyze all the results in the devtodev interface.

Choose the best time for sending push notifications

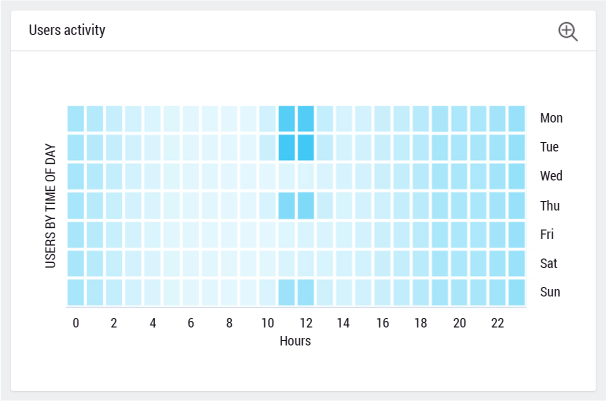
With devtodev, you can figure out the time when users are the most active, send the notifications at that moment and later on analyze how they respond to the different kinds of push campaigns.

Segment users and find best strategies with RFM analysis

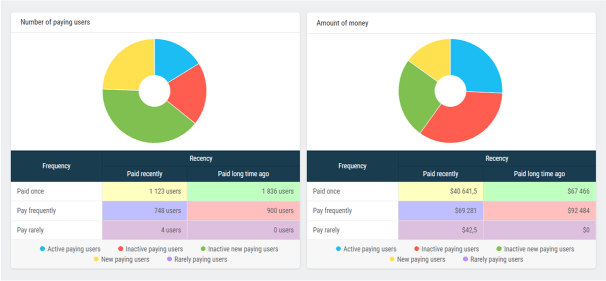
RFM analysis allows you to segment users based on how often they use the product and make in-app purchases to find those users who pay the most money. With RFM analysis, you can find the best retention and monetization strategies for users in different segments.

Compare versions of your app or game and make sure that your project is improving

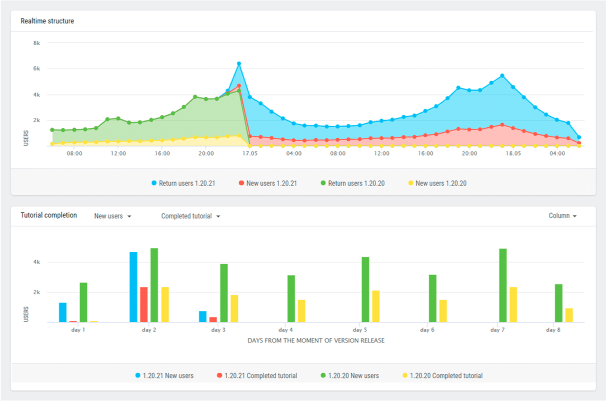
For example, if you decided to improve your game tutorial, i.e. change the number of the matches or add new tutorial steps, you can see how these changes affect the success rate of your tutorial in the App Version report.

Besides that, you’ll be able to compare the retention metrics, number of users, revenue for different updates.

Check how your loyal users behave

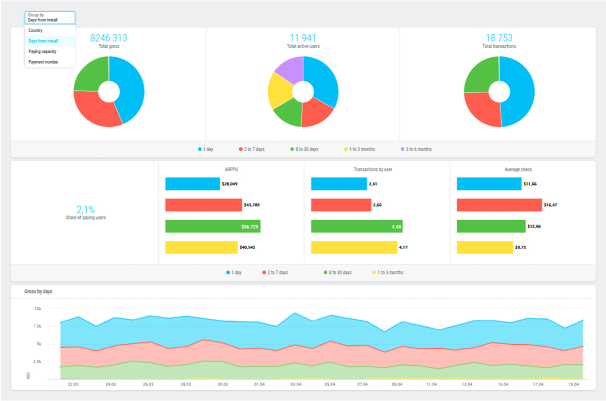
After your new update is live, you saw that Gross is slightly decreasing, but you can’t tell why.

You can check your revenue structure by advanced and new users, number of payments, countries, etc. It’s possible that your loyal users didn’t like one of the minor improvements and they stopped paying.

Build your payment conversion funnel

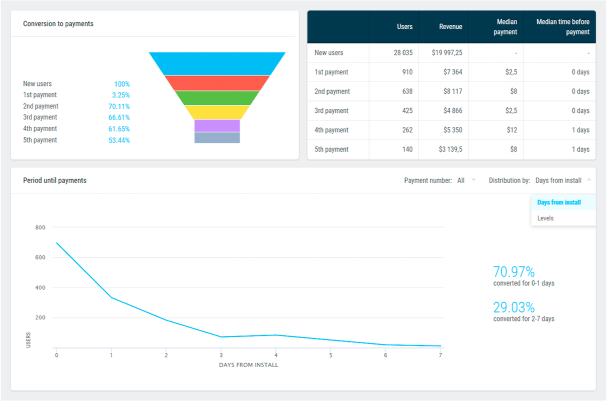
Furthermore, you would like to compare your payment conversion funnel after any changes. You don’t want to lose any point of payment funnel neither from non-paying users to 1st payment nor from 4th to 5th payment.

Also, you can analyze how much it takes to convert to any number of payments or even at which moment your users start to pay more.

Figure out why metrics change and mark the updates

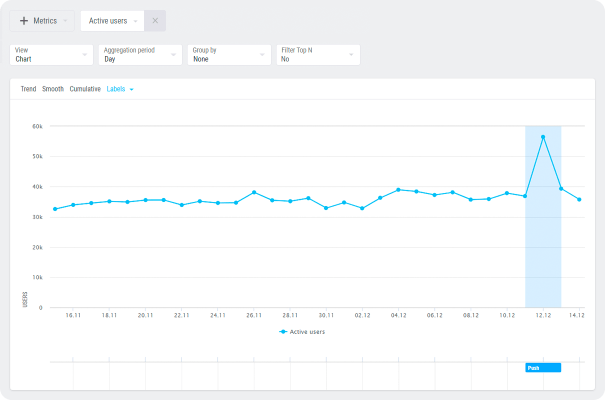
This feature will be vital for the project where you launch a lot of experiments and need to know which one influences the metrics.

In the Labels section, you can mark major (or all) updates, experiments, releases, sales on a timeline. Then you can turn them on for any chart to see the correlation between these actions and abnormal metrics changes.