In analytics, there is a “classic” retention metric, that shows the percentage of users opening the project on a particular day. We can calculate it using the following formula:
Day N Retention = Number of users logging in per day N / Number of users installing the application N days ago * 100%
There are several special cases of this metric. Let’s take a look at the four most-used.
Four varieties of retention
-
Day N rolling retention. This is the percentage of users who returned to the application on day N from the time of installation or later. For example, one user returned to the application on the 14th day, and on the 45th day, and the second user returned on the 44th day, then when calculating the day 14 rolling retention, they will be considered as two users who returned on the 14th day.
-
Day N return retention. This is the percentage of users who returned at least once in N days. For example, when calculating day 21 return retention, all users who opened the application at least once on any day from the first to the twenty-first will be taken into account.
-
Day N bracket-dependent return retention. This is the percentage of users who returned to the application at least once from day M to day N, where parameter M limits the user return time. For example, if M is 14, then day 20 bracket-dependent return retention will show the percentage of users who opened the application from 14 to 20 days from the moment of installation. In fact, this is a special case of the day N return retention.
-
Day N full retention. This is the percentage of users who were opening the application every day until day N. For example, day 5 full retention is the percentage of users who opened the application on the 1st, 2d, 3d, 4th, and 5th day from the date of installation.
Enroll in Edvice's free online course on Game Analytics: From Basics to Advanced Strategies
Rolling retention
Rolling retention is the most commonly used variety out of the four metrics listed above. We calculate it using the following formula:
Day N rolling retention = Number of users who opened the application on day N or later / Number of users who installed the application N days ago * 100%
An example of calculation.
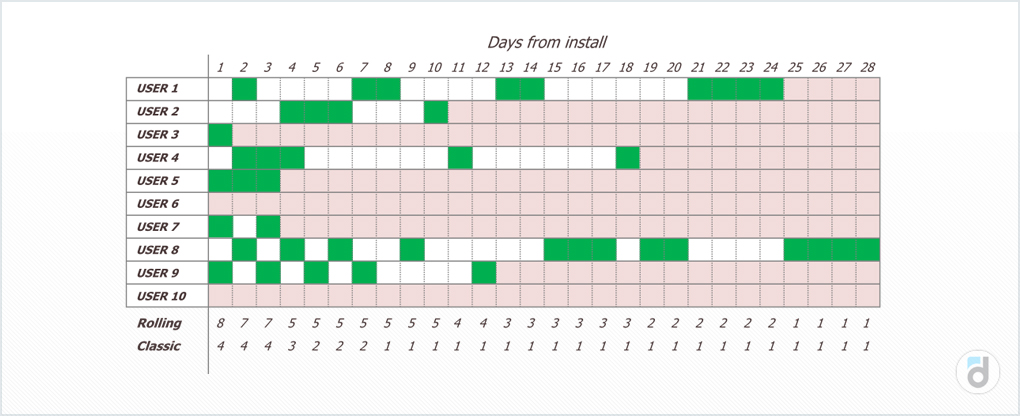
Let's say we have data on ten users for 28 days.
Read more: Game Analytics Metrics Glossary
Here, the days when users opened the application are highlighted in green, and the days from the moment of the last visit, when there were no visits anymore, are highlighted in pink.
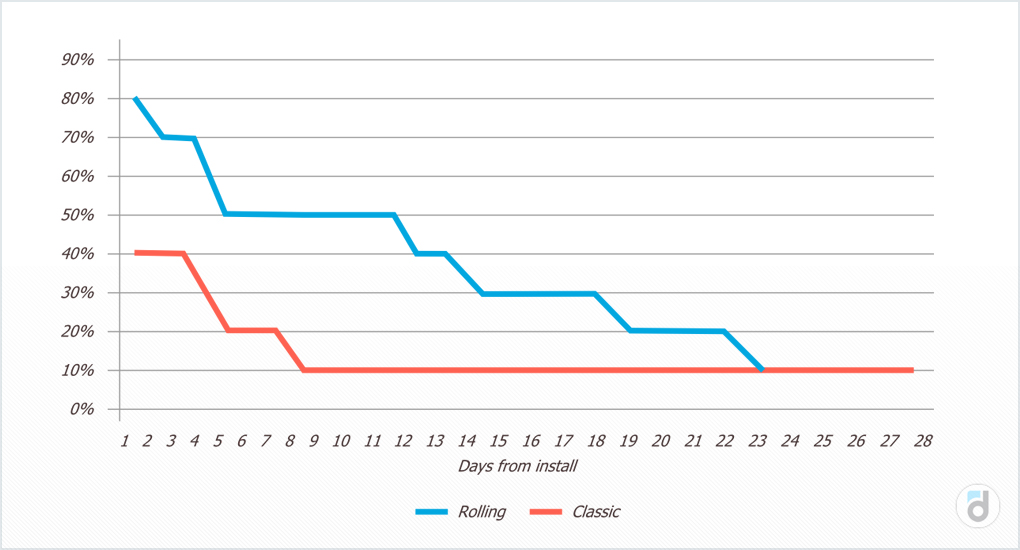
Day N rolling retention counts users who opened the application on that day or later (green or white cell). If we calculate the values of the “classic” retention and the values of the rolling retention for this example, we get the following graph:
Read more: Main Metrics. FTUE
Rolling retention is always higher than the “classic” one because it takes into account not only users who opened the application on one specific day, but also all those users who opened it later. As a result, the rolling retention graph is smoother.
Calculate everything by yourself using free devtodev DEMO
The main problem with rolling retention is the complexity of its use in practice. Unlike the standard retention metric, it needs to be recounted daily, because those users who have not opened the application for a while and have already been considered as churned, can start using it again. Because of this, the rolling retention values of all previous days change.
For example, the last time a user opened the application happened on the tenth day after installation. Then we calculated day 25 rolling retention while no longer considering this user. However, that user reopened the application on day 30. And to take them into account, we should recalculate the rolling retention for all days from the 11th to the 30th.
Read more: Main Metrics. Active Users (DAU, WAU, MAU)
Why use rolling retention?
Rolling retention can provide a fuller picture of user numbers. So, measuring the “classical” day 7 retention, we automatically consider that all people who did not open the application on that day had churned. However, they may not have left the application for good, and opened it again, for example, on the next day.
We at devtodev believe that this metric can be useful for applications that are not meant to be opened daily. For example, games where you need to wait a certain time in order for something to be built or to accumulate certain resources.
Do not forget that retention is the inverse churn metric. As a result, the great advantage of rolling retention is that you can use it to calculate user churn more accurately and more simply than you would do with the “classic” retention. On the graph above, the area below the blue curve represents the returning users (who opened the application on a given day or later), and the area above the curve represents the users who churned (who did not open the application starting from the given day). As you can see, it gives you a more objective picture of user retention than the “classic” retention (red curve).
Start using our great analytics platform today! devtodev is a full-cycle analytics solution developed specifically for game developers that helps you convert players into paying users, improve in-game economics, and more. See our prices
Key takeaways
Rolling retention is a useful metric that you can use to evaluate the value of your project for users, to find the point of no return, and also to calculate indicators such as lifetime and churn.
This metric is best used in applications that do not require daily use. In the projects that are meant to be opened daily, it can mislead the developer by showing them higher retention values and a smoother decrease.
In any case, to make informed decisions, it is better to focus on both retention metrics - the “classic” one and the rolling one.


