devtodev is helping you keep in touch with what’s happening in the game market. Every month we publish an overview of reports on the most popular games worldwide, top-grossing games, successful releases, favorite video game types, trends, etc. This overview is prepared by Dmitriy Byshonkov - the author of the GameDev Reports by devtodev Telegram channel. You can read the August and October reports.
Table of Content
- App Annie: Asphalt 9: Legends surpassed the $100M revenue plank
- Sensor Tower: Among Us led Imposter-themed games to 2,554% growth in H1 2021
- Newzoo: About Finnish Gamers & Gaming Market
- Videogames collected $13M on Kickstarter in H1 2021
- AppMagic: Top Mobile Games by Revenue and Downloads in August 2021
- Sensor Tower: Top Mobile Games by Revenue in August 2021
- GameAnalytics: iOS 14.5+ Opt-in for Games is 43%
- Honor of Kings became the first mobile game to reach $10B in lifetime revenue
- Adjust: Mobile APAC Market 2021 Overview
- StreamElements & Rainmaker.gg: Twitch views increased by 27% in August
- Sensor Tower: Update 2.1 for Genshin Impact boosted revenue by 5x times
- Niko Partners: Total Addressable Market of Cloud Gaming in China will reach 150M by the end of the year
- Omdia: Cloud Gaming market will reach $4B in 2021
- Sensor Tower: Top Mobile Games by Downloads in August 2021
- NPD: The US citizens spent $4.4B on gaming products in August 2021
- Sensor Tower: Casino Games earned $4.8B in the US during the past year
- AppMagic: Top-10 Turkish publishers by Revenue and Downloads in H1 2021
- AppsFlyer: Mobile Landscape in Nordics
- Naavik & BITKRAFT: In reality, the Gaming Market valuation is $336B, not $176B
- Sonic Dash is the most popular Sonic game on Mobile
- Sensor Tower: Casual Puzzle genre Overview in Last 18 Months
- Sensor Tower: Sports & Racing games Report
- Omdia: Ad Revenue is growing much faster than in-app Purchases
- Newzoo: Mobile Gaming Market will reach $116.4B in 2024
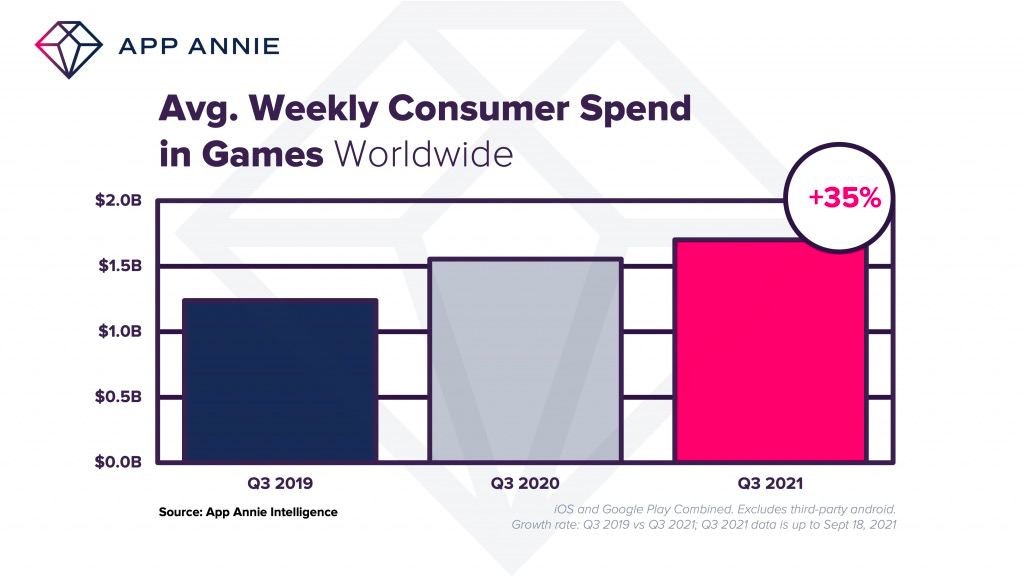
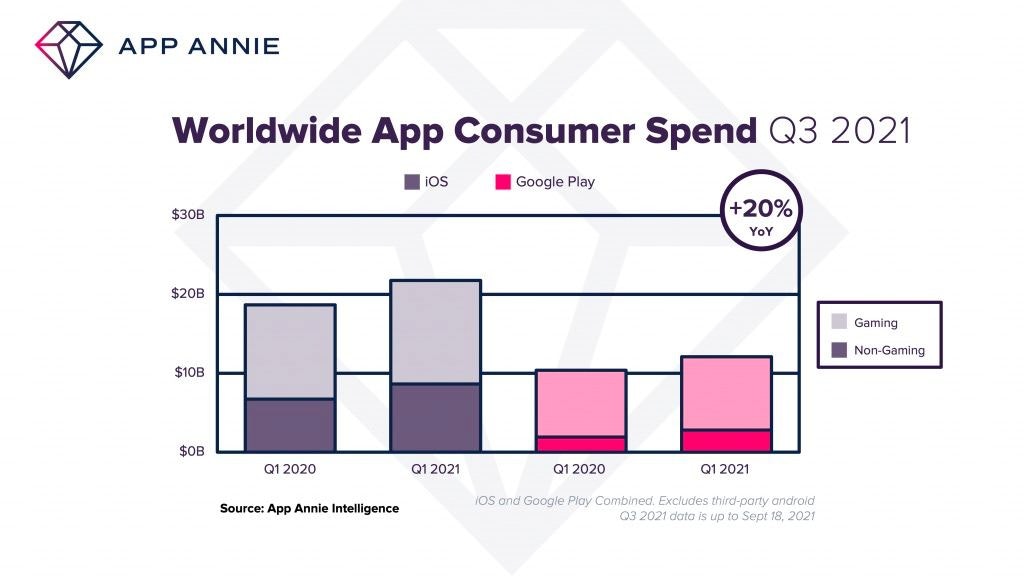
- App Annie: Spent on Mobile Games in Q3 2021 will overcome pandemic-2020 level and reach $22B
- Sensor Tower: Apps User Engagement Report
- App Annie: LATAM Mobile Market Report
- AppMagic: Top-10 Games in Argentina by Downloads and Revenue in H1 2021
- App Magic: Pokemon UNITE earned $1.7M in 5 days after release
- App Annie: Candy Crush Jelly Saga reached $500M Revenue
- Sensor Tower: Top Mobile Publishers in Various Genres from 1 January to 31 August 2021
- Adjust: Games are responsible for 50% of all UA spendings
- Sensor Tower: Genshin Impact earned $2B on Mobile during the first year
- Sensor Tower: Mobile MOBA Landscape in 2021
App Annie: Asphalt 9: Legends surpassed the $100M revenue plank
-
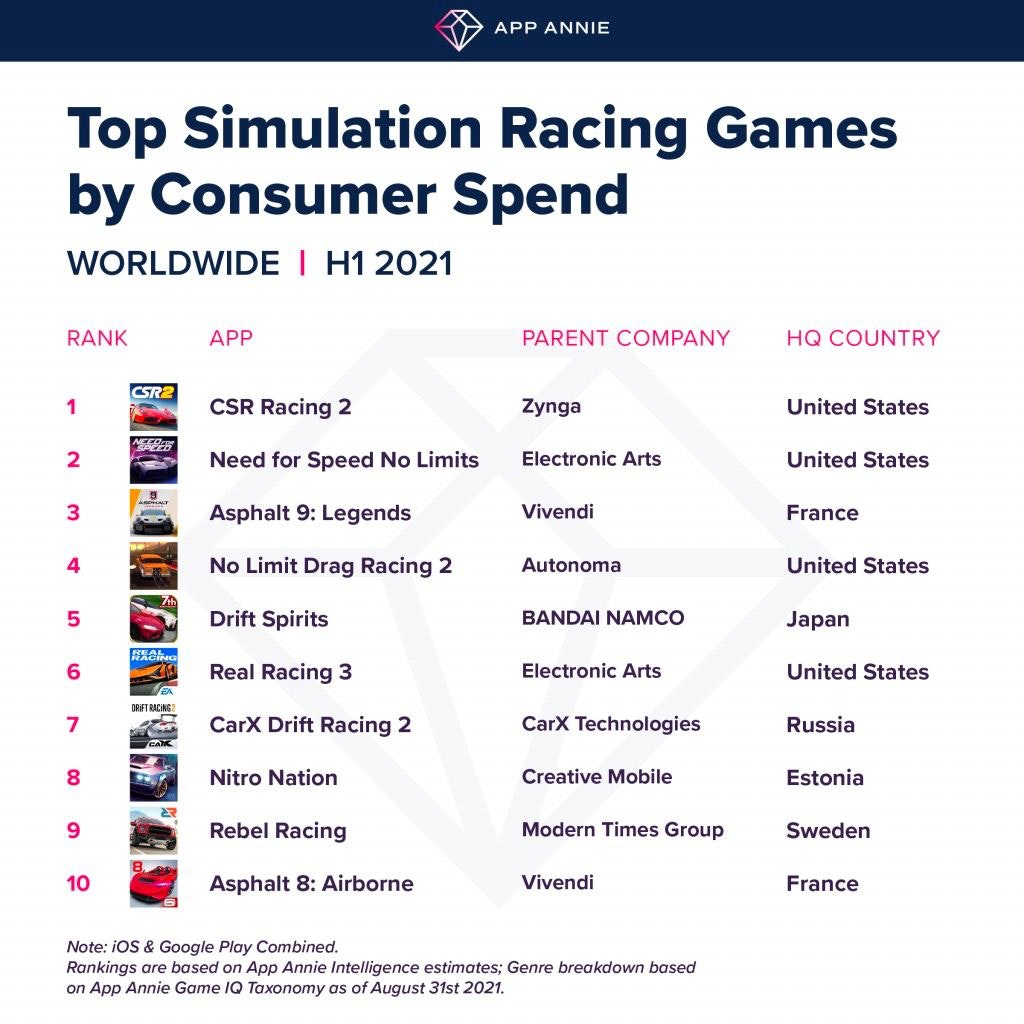
3 years were required to reach this result. The main countries by revenue are the US, South Korea, China, Japan, and Germany.
-
Asphalt 9: Legends is at third place in the most successful Racing games of H1 2021. CSR Racing 2 by Zynga is first, Need for Speed: No Limits from EA is second.
Sensor Tower: Among Us led Imposter-themed games to 2,554% growth in H1 2021
-
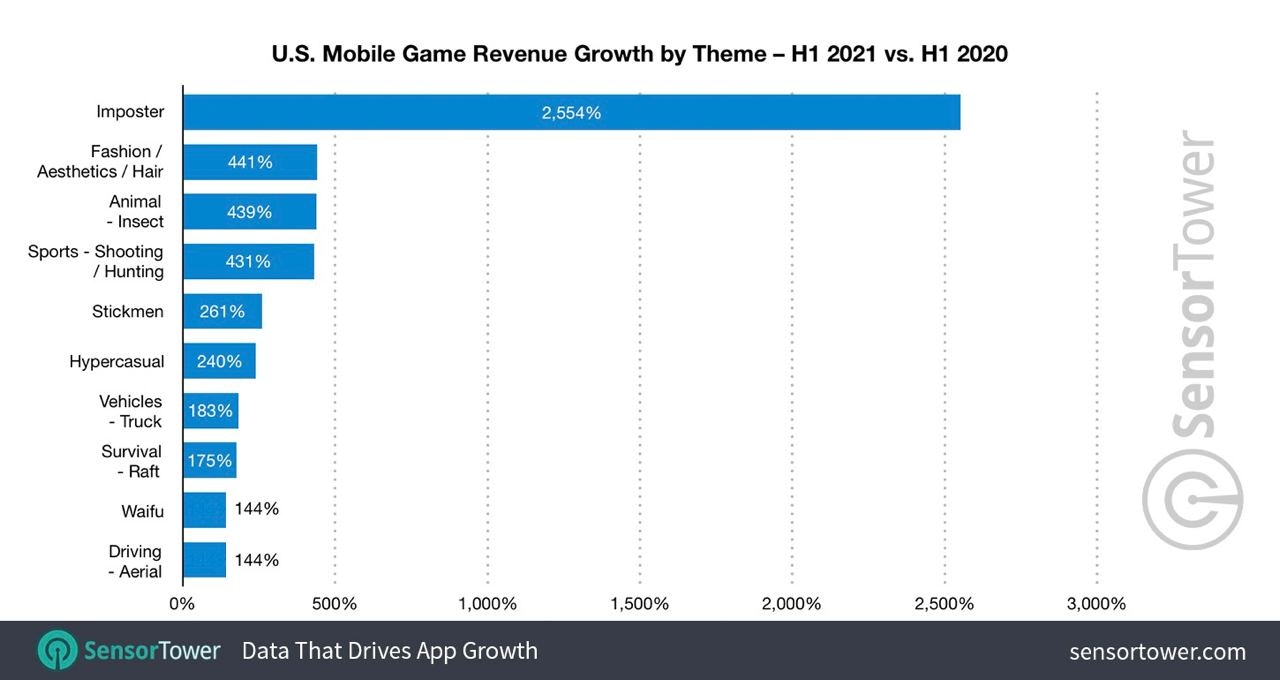
This theme showed the highest growth in H1 2021 compared to H1 2020 - startling 2,554%. Games of the Imposter theme earned $8.4M, and 94.3% of this sum belongs to Among Us.
-
The highest revenue shows Money/Treasure-themed games, which consist of Coin Master and Bingo Blitz.
-
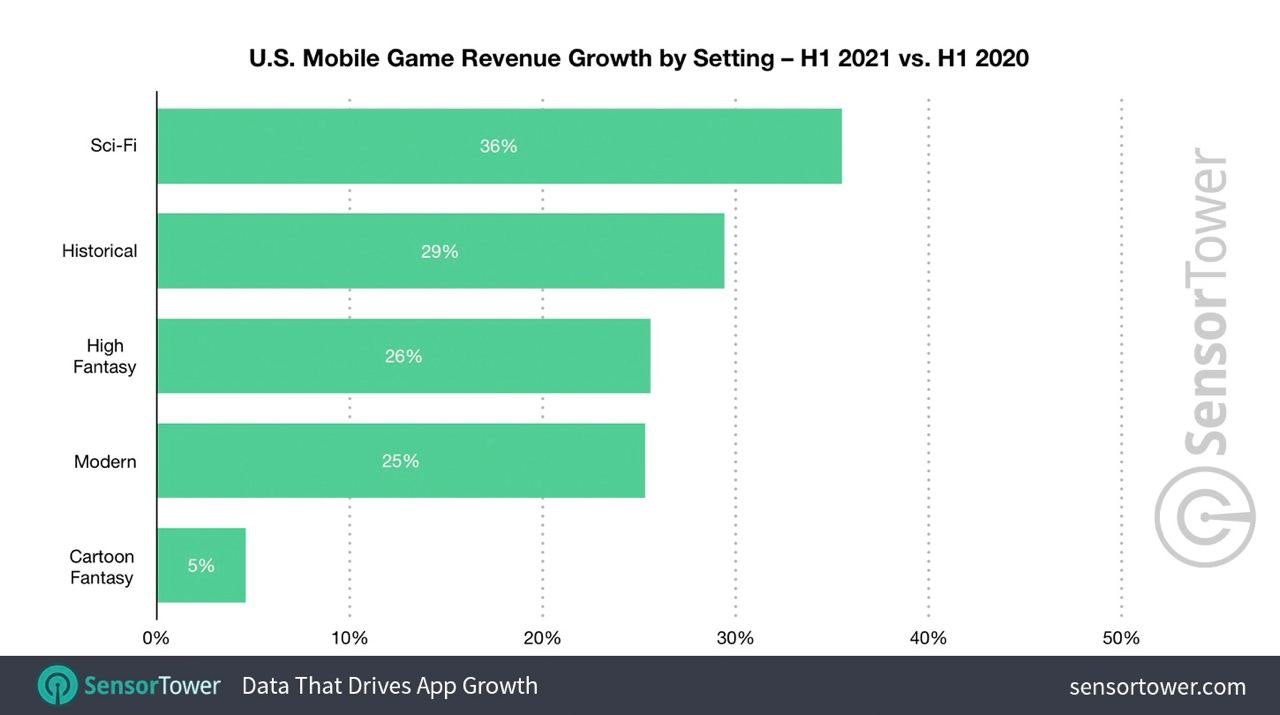
Sci-Fi setting showed the top dynamic of growth in H1 2021 - by 36% YoY. Setting revenue resulted in $1.2B.
-
Second by growth setting is History (+29.4% YoY - $651.7M in revenue); third - High Fantasy (+25,6% YoY - $2.8B in revenue).
-
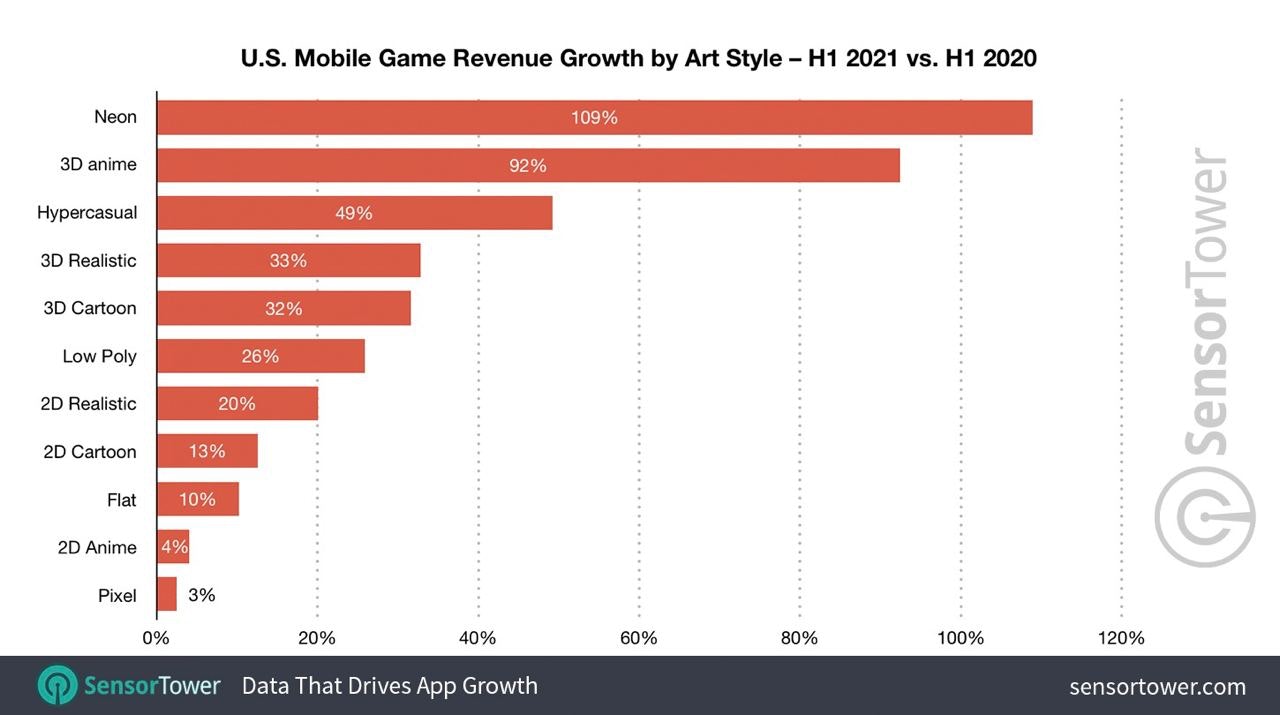
The most profitable Art Style in H1 2021 was Cartoon 2D art. Games, using this visual style (Candy Crush Saga, Coin Master), earned $6B.
-
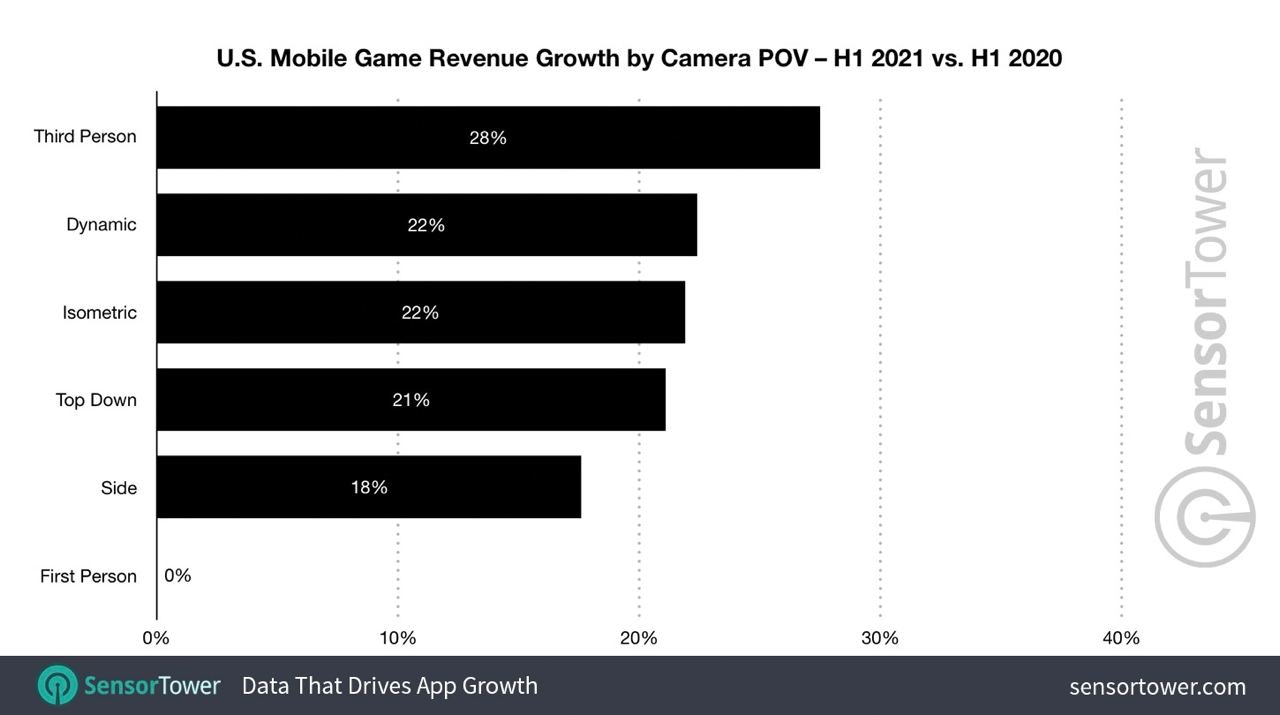
Third-person POV popularity increased by 28% in H1 2021 - thanks to Garena Free Fire & Genshin Impact. Users have spent more than $1B in games with this camera.
Newzoo: About Finnish Gamers & Gaming Market
-
By the end of 2020, 2.8M gamers lived in Finland.
-
The gaming market size is about $435M.
-
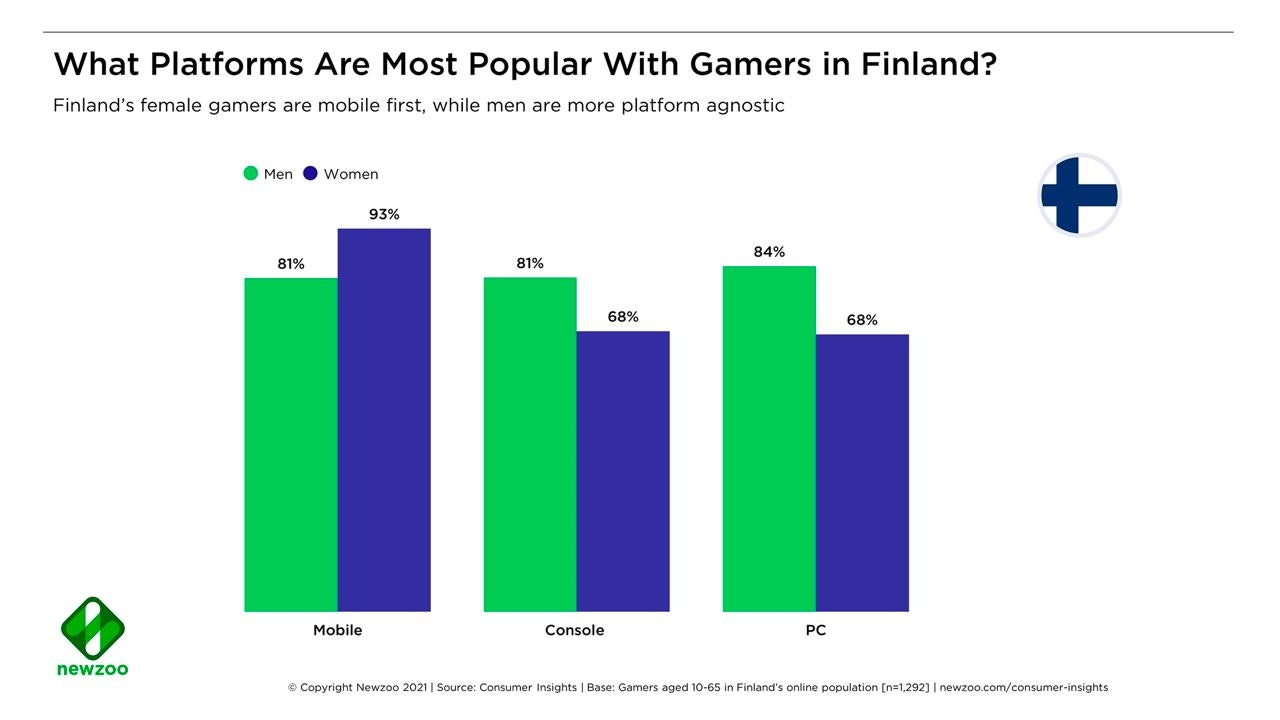
86% of users are playing on mobile devices, 77% are using PC, 76% playing on consoles. Male audiences prefer PC & Console to mobile, while 93% of females using mobile as the primary gaming device.
-
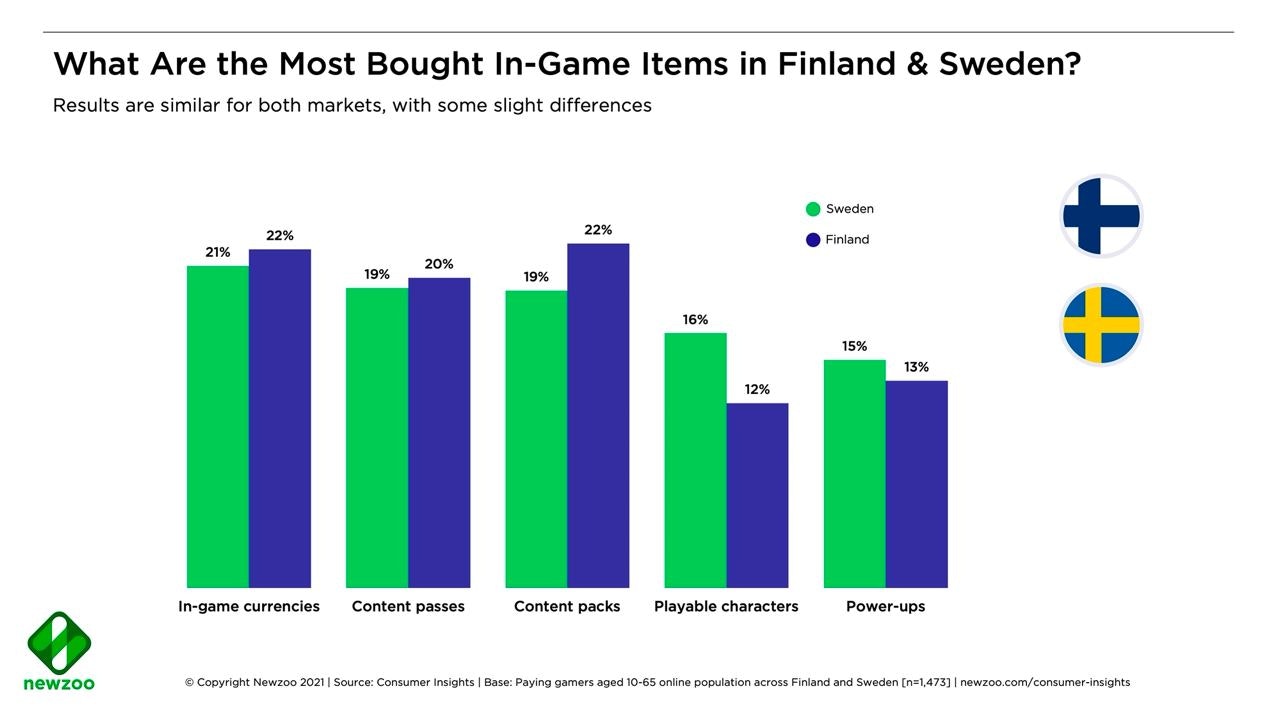
69% of those, who are paying for in-apps in games, made purchases in the last 6 months. Women are more tend to buy in-game currency than men.
-
Candy Crush Saga, Grand Theft Auto, Minecraft & Call of Duty are the most popular franchises in Finland.
Videogames collected $13M on Kickstarter in H1 2021
-
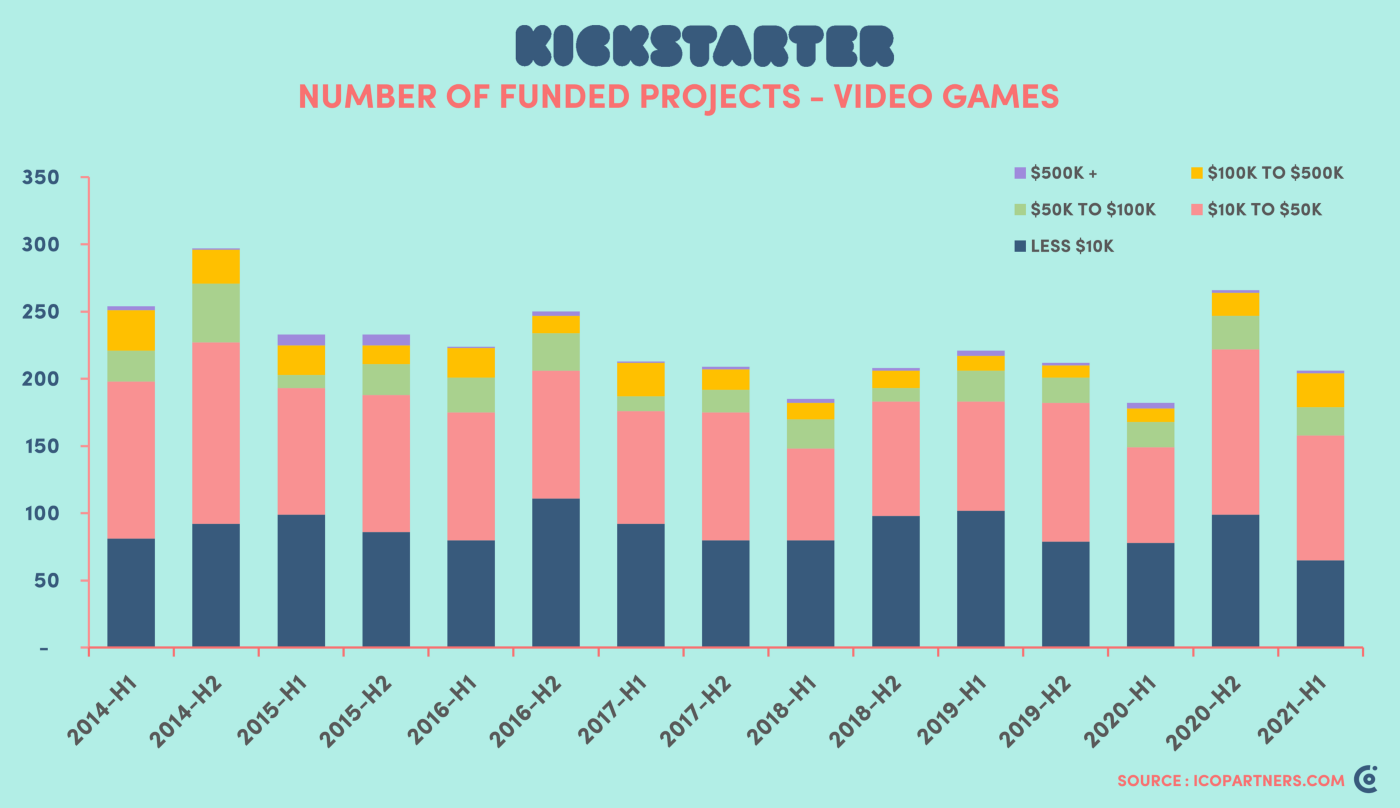
It’s the best half of a year since 2015. Better was only H2 2020.
-
In H1 2021 649 projects were published on Kickstarter. 184 of them reached their financial goals, while 465 remained under-sponsored.
-
The two most successful titles in H1 2021 are Friday Night Funkin ($2.2M), and Coral Island ($1.6M).
AppMagic: Top Mobile Games by Revenue and Downloads in August 2021
-
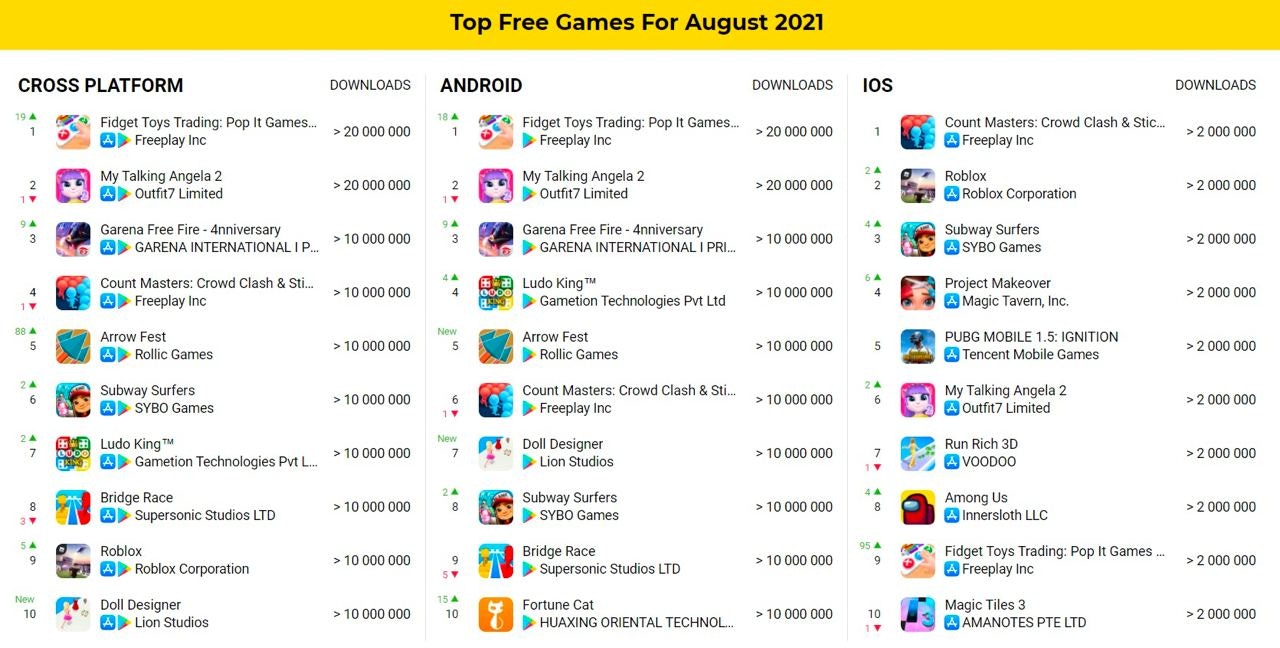
Fidget Toys Trading from Freeplay was the top downloaded game of the previous month. It had 48 million downloads: 44.8 million on Google Play, the remaining part on iOS.
-
Same studio Freeplay made the top downloaded game on iOS - Count Masters (4.9 million downloads). Across all platforms, the game generated 18.7 million downloads.
Revenue:
-
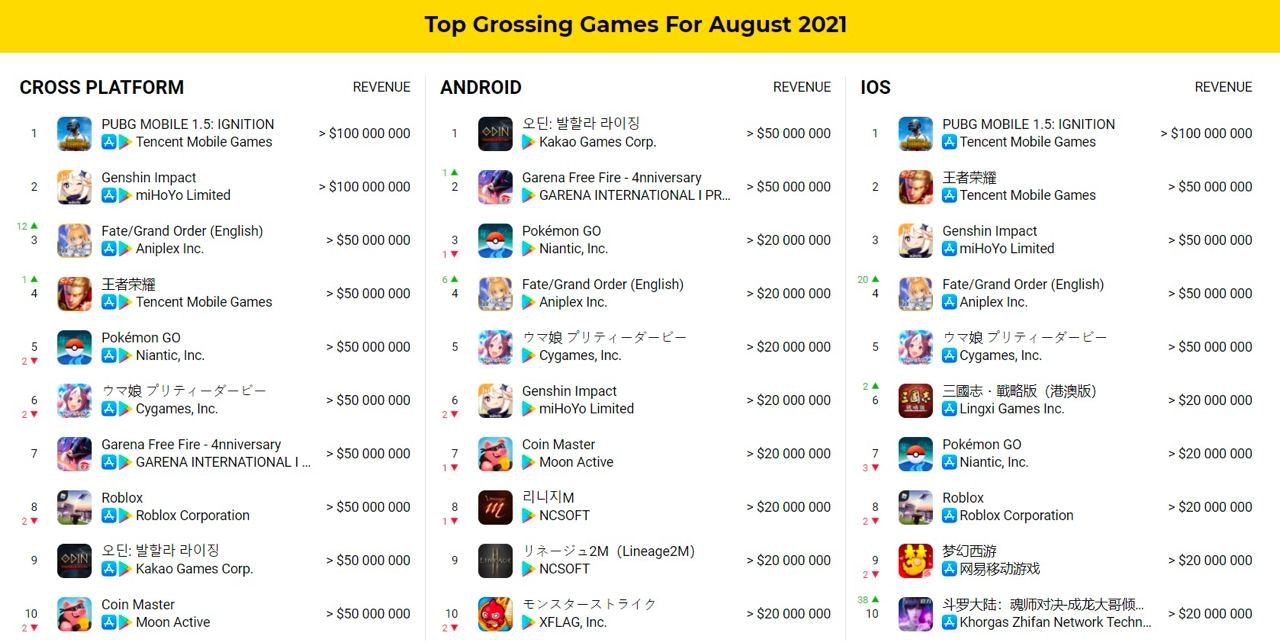
PUBG Mobile was the best game of the previous month in terms of revenue - $131.9 million.
-
Great results showed the Fate/Grand Order (Aniplex) with $96.4 million of revenue, and Doula Continent: Soul Master Showdown (Khorgas Zhifan Network Technology) with $36.9 million. Latter was on the 48 places in July and managed to get to the top-10 the previous month.
-
The best revenue on Google Play showed ODIN: Valhalla Rising (Kakao Games), reached $68.1 million result.
Sensor Tower: Top Mobile Games by Revenue in August 2021
-
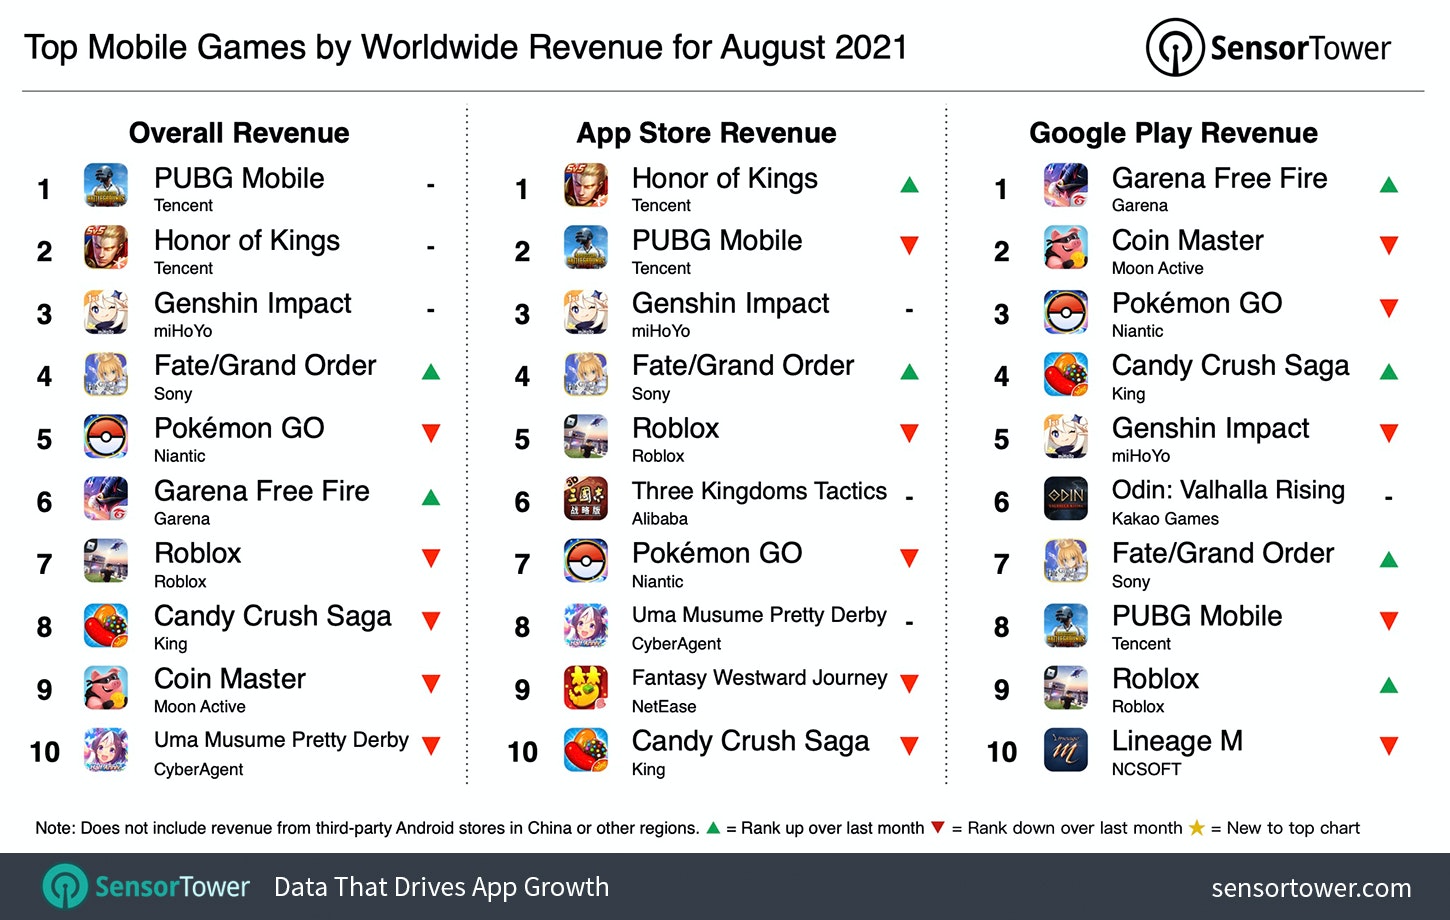
PUBG Mobile was a leader (again). The project earned $270M last month and showed 4.7% growth YoY. 61.4% of all revenue came from China.
-
Honor of Kings ended last month in second place with $256.2M and 3% growth YoY.
-
Fate/Grand Order had the best month in the last 2 years with $133.8M of players spending. The project showed 13.6% growth from August 2020. For the last 6 years, players spent $5.5B.
-
In August gaming apps earned $7.7B, which is 8.6% higher, than a year before.
-
The US is first by revenue ($2.1B; 28% of all revenue); Japan is second (20.8% of all revenue); China is third (17.5% of all revenue). But Sensor Tower is not tracking the third-party stores, which are very popular in China.
GameAnalytics: iOS 14.5+ Opt-in for Games is 43%
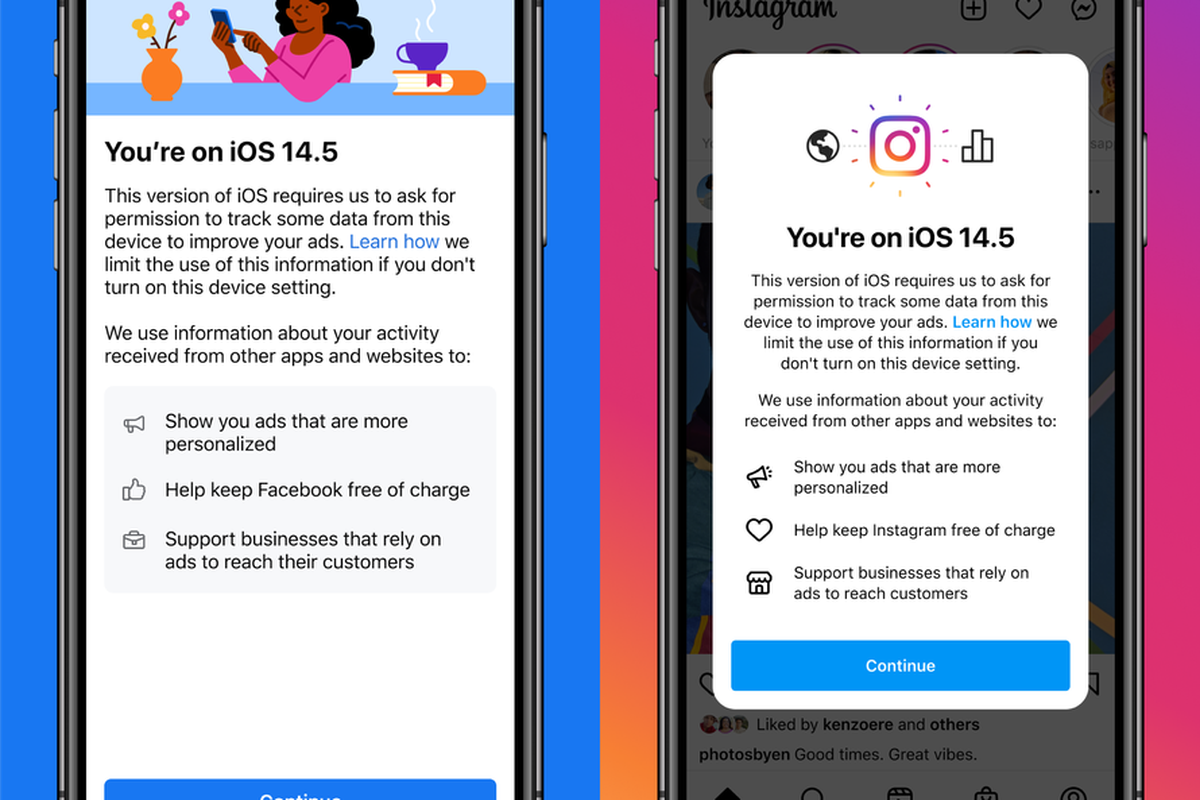
-
It’s important to mention that 31.5% of users worldwide still undecided whether they want to opt-in the data or not.
-
In the US number of users, agreed to share personal information is lower - 36%.
-
GameAnalytics methodology reviewing only games with MAU higher than 1,000. There are other parameters as well. 121M users were researched.
Honor of Kings became the first mobile game to reach $10B in lifetime revenue

-
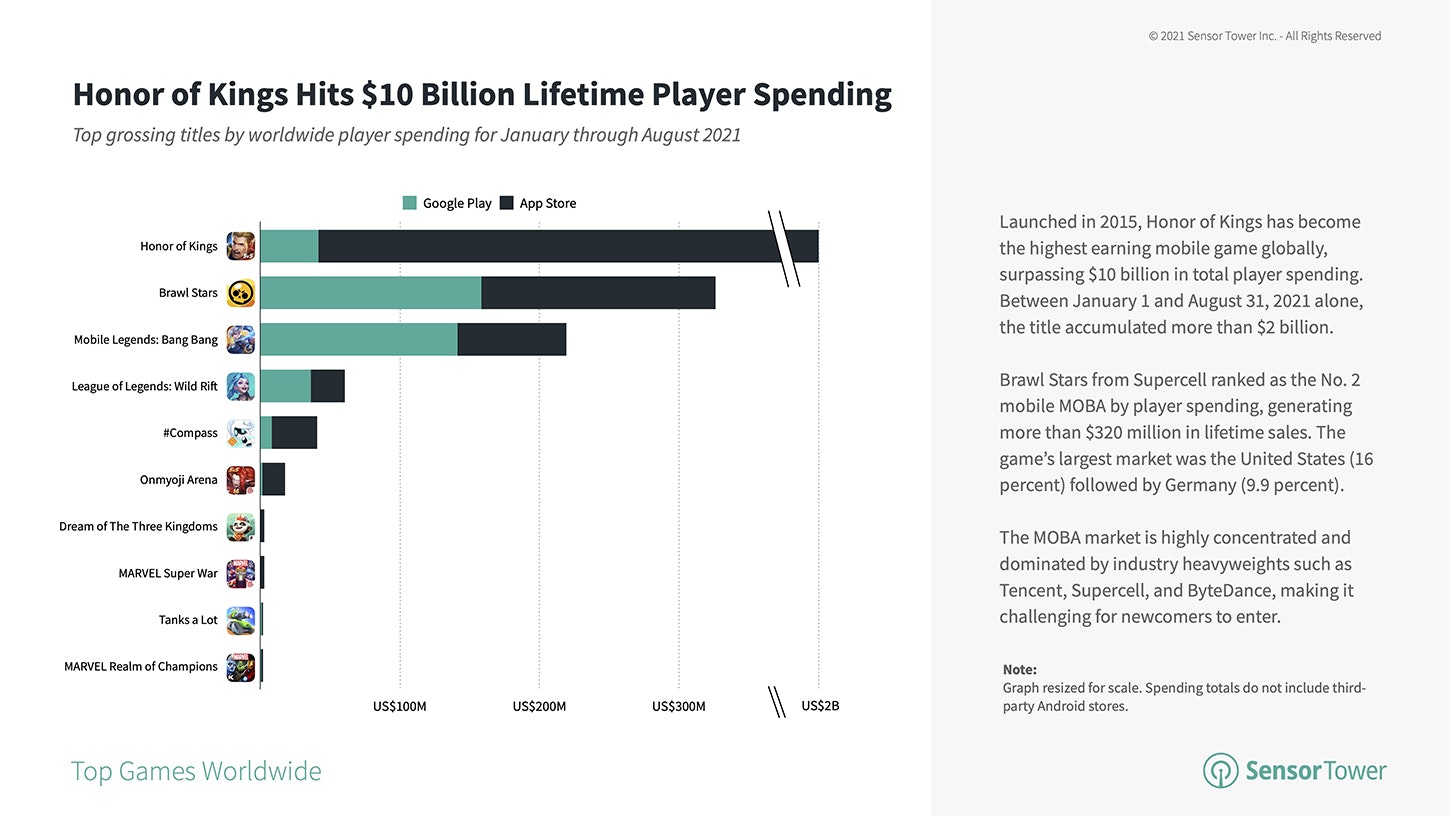
The game was launched in November 2015.
-
The majority of the revenue comes from China (more than 90%).
Adjust: Mobile APAC Market 2021 Overview
-
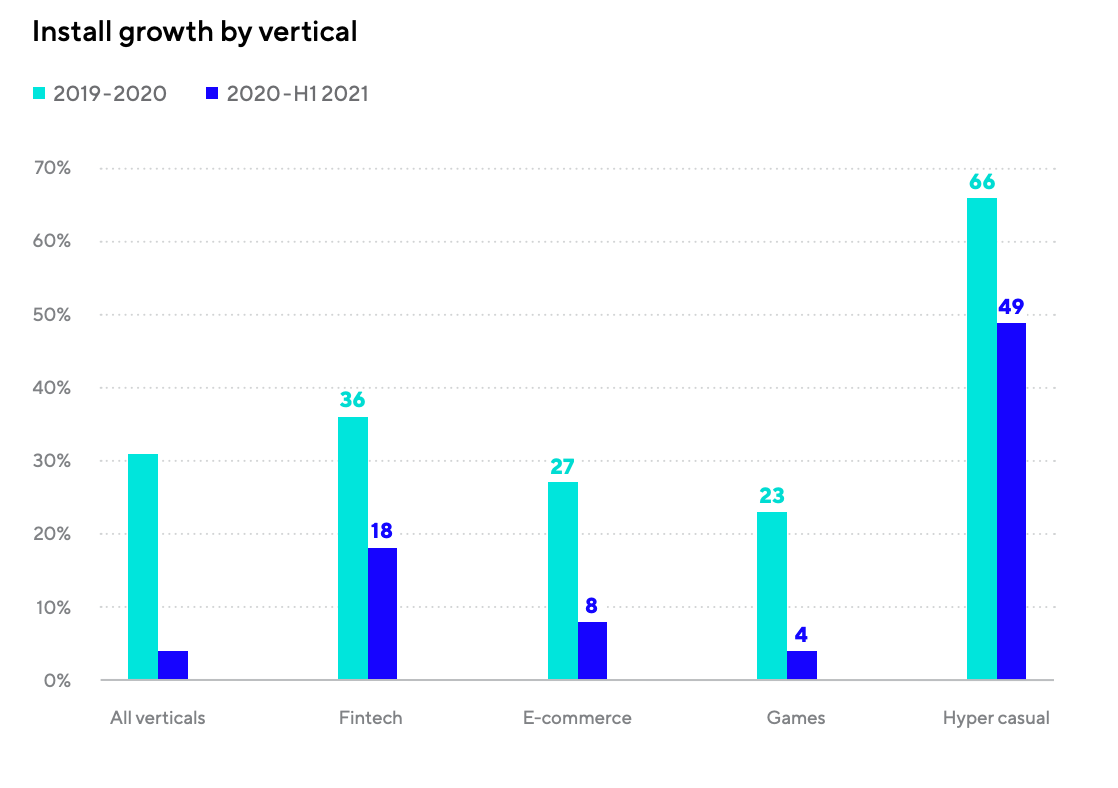
Hypercasual games downloads increased by 49% from 2020. Non-hypercasual games growth wasn’t so significant - just 4%.
-
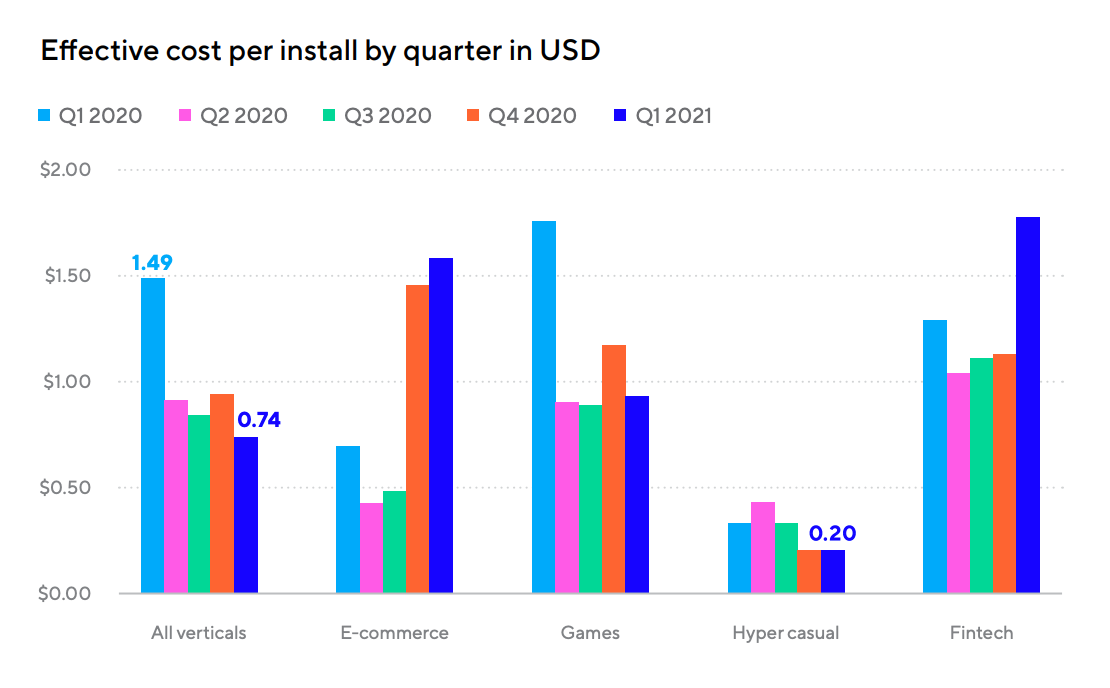
eCPI in non-hypercasual games in Q1 2021 resulted in $0.95. In hypercasual, it is about $0.2.
-
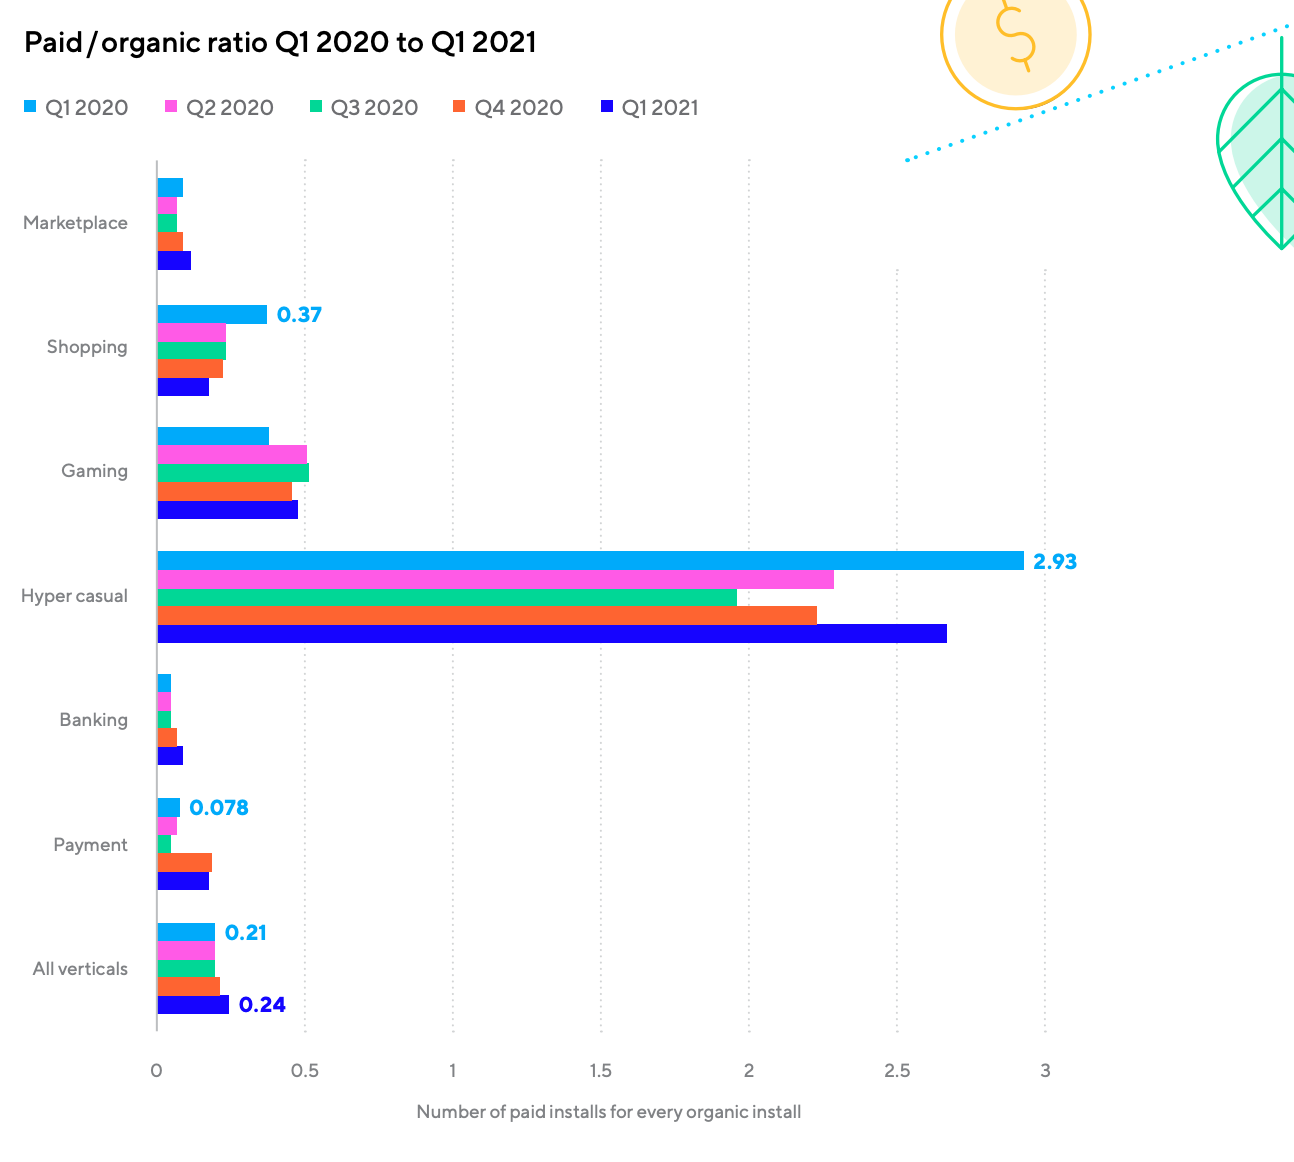
Paid/organic traffic ratio in non-hypercasual games in Q1 2021 was about 0.5. For hypercasual titles, the ratio is about 2.6.
-
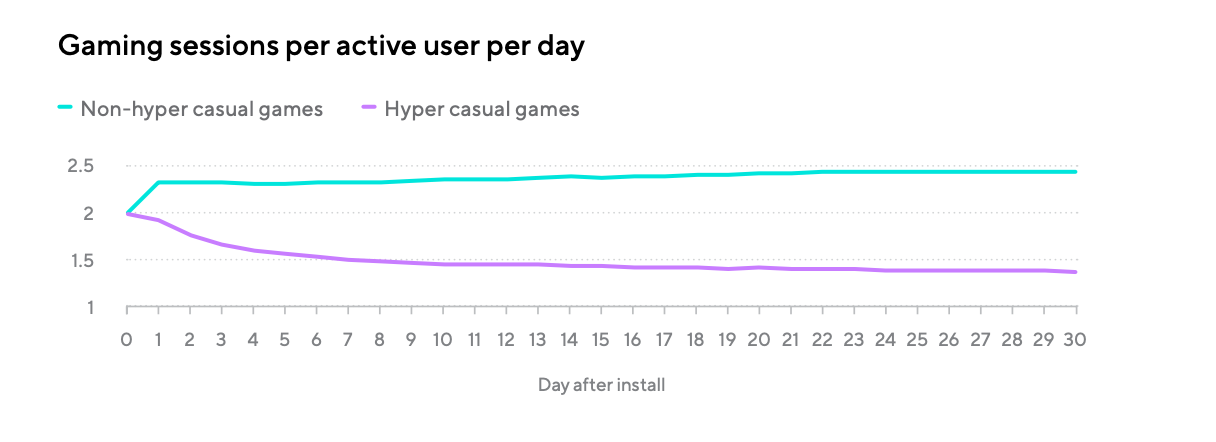
Surprisingly, users have more daily sessions in non-hypercasual games compared to hypercasual. It’s about 2.4 sessions vs. 1.5 respectively.
-
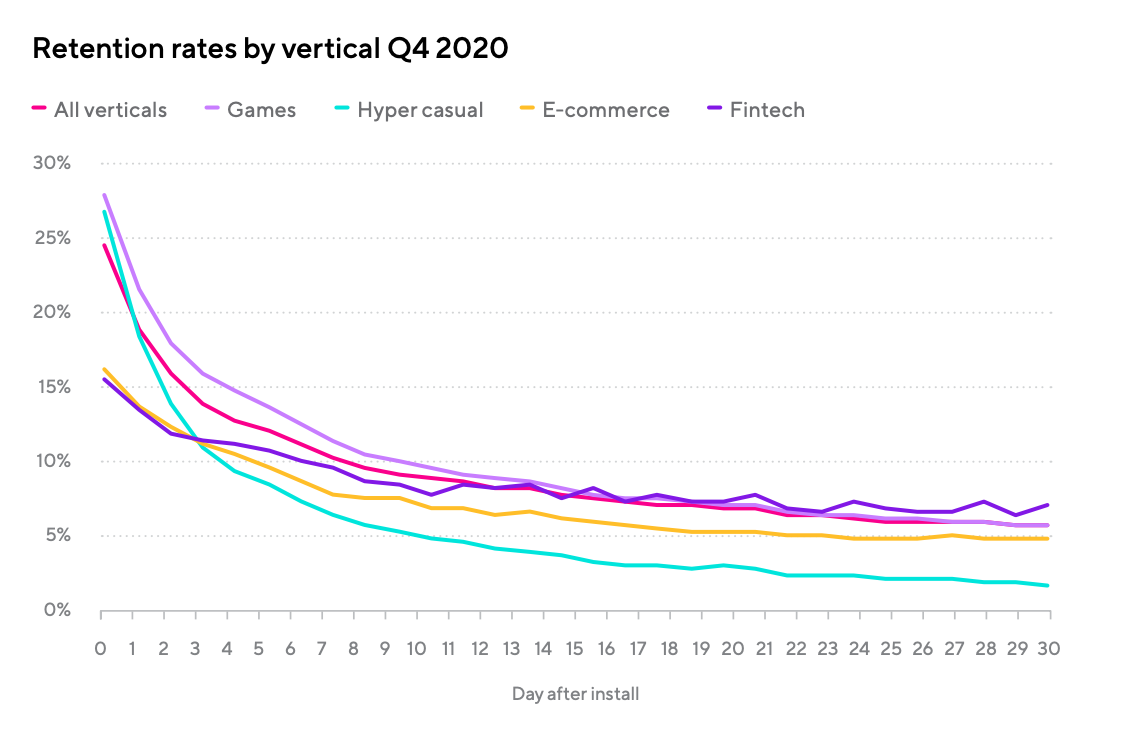
On average, 5.64% of users are sticking within the game at 30 days after install. But for hypercasual games, this metric is about 1.69%.
StreamElements & Rainmaker.gg: Twitch views increased by 27% in August
-
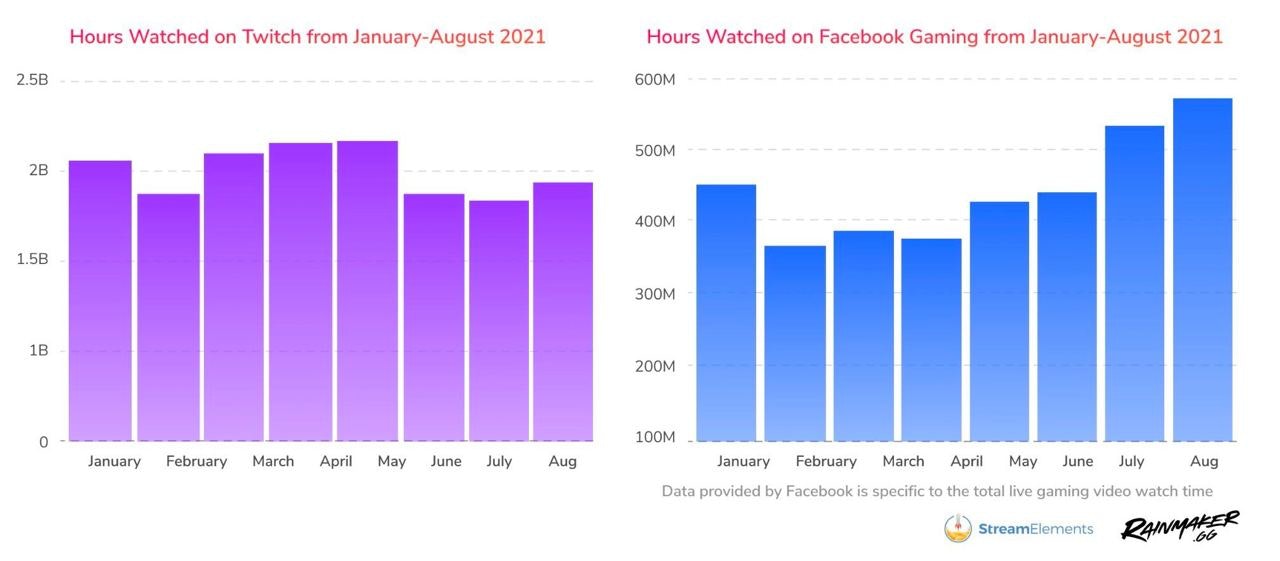
People watched 1.9B hours in Twitch in August.
-
Facebook Gaming set a new August record - 567M hours of views and 64% growth YoY.
-
GTA V became the most viewed game in Twitch. People watched 142M hours of it (+2% month on month). Apex Legends showed a 103% growth of views (86M hours).
Sensor Tower: Update 2.1 for Genshin Impact boosted revenue by 5x times
-
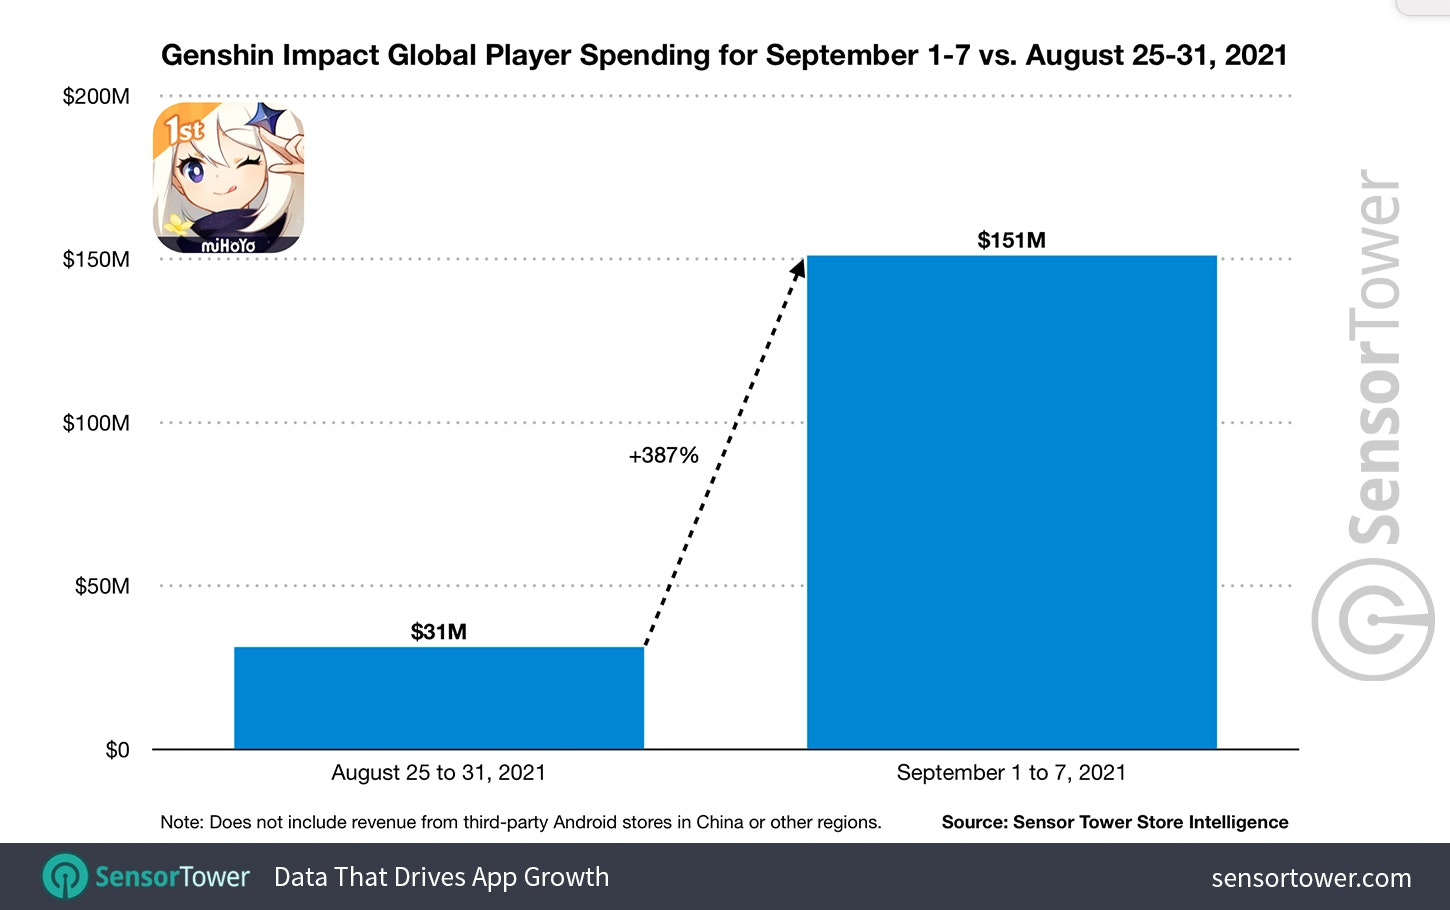
A week after the update was released, Genshin Impact earned $151M. A week before, the game revenue was $31M.
-
37% of record weekly revenue belongs to China - and this is without third-party stores. The US is responsible for 20% of revenue, Japan - for 19%.
-
The number of paying users after releasing an update in China increased by 9.7x times. In Japan - by 4.4x times; in the US - by 3.5x times.
-
The lifetime revenue of Genshin Impact is $1.9B.
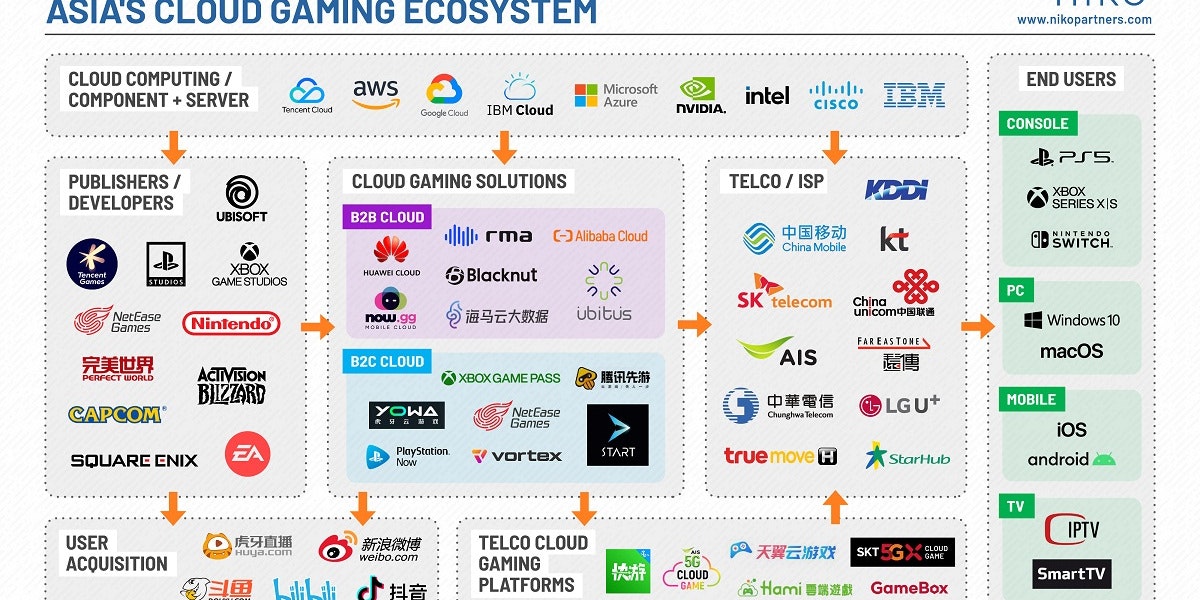
Niko Partners: Total Addressable Market of Cloud Gaming in China will reach 150M by the end of the year
-
Company analytics suggests, that by 2025 the amount of reachable audience will increase to 500M users.
-
It’s hard to imagine the fast growth of the technology without 5G connection being available everywhere.
Omdia: Cloud Gaming market will reach $4B in 2021
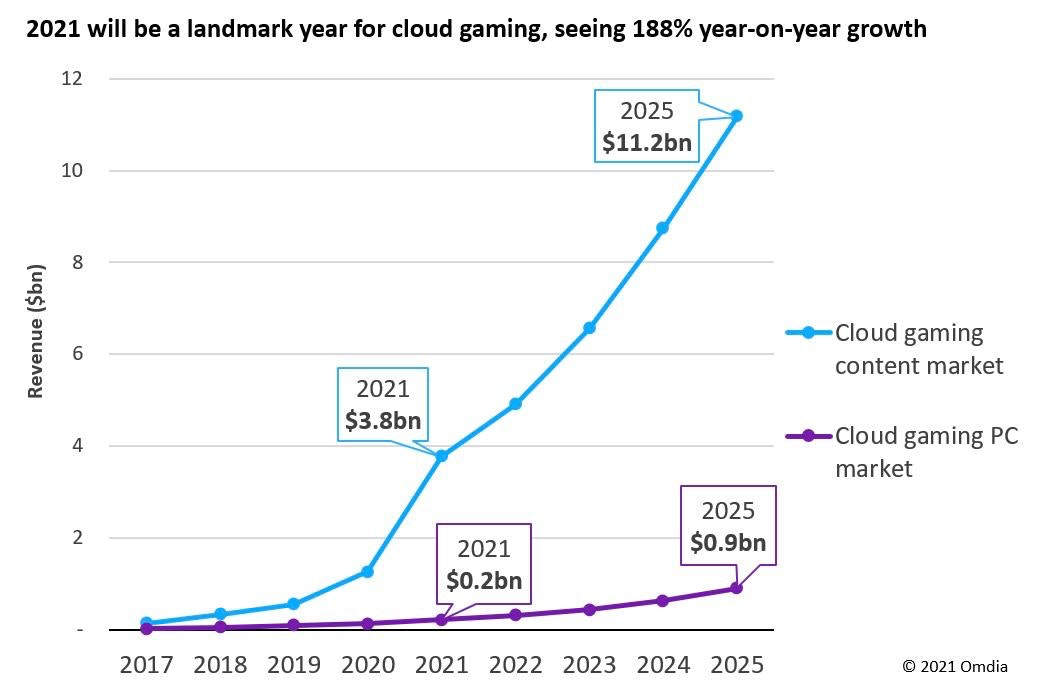
-
It’s 188% growth compared to last year.
-
By the end of 2025, the Cloud Gaming market valuation will be about $11.2B. It’s about 3x growth compared to what we have today.
-
From this $11.2B, only $0.9B will belong to Cloud Gaming services on PC.
-
The majority of revenue comes from the subscription services like Xbox Game Pass Ultimate and PlayStation Now. Only 7% of revenue in 2025 will come from “PC in Cloud” services like GeForce Now.
Sensor Tower: Top Mobile Games by Downloads in August 2021
-
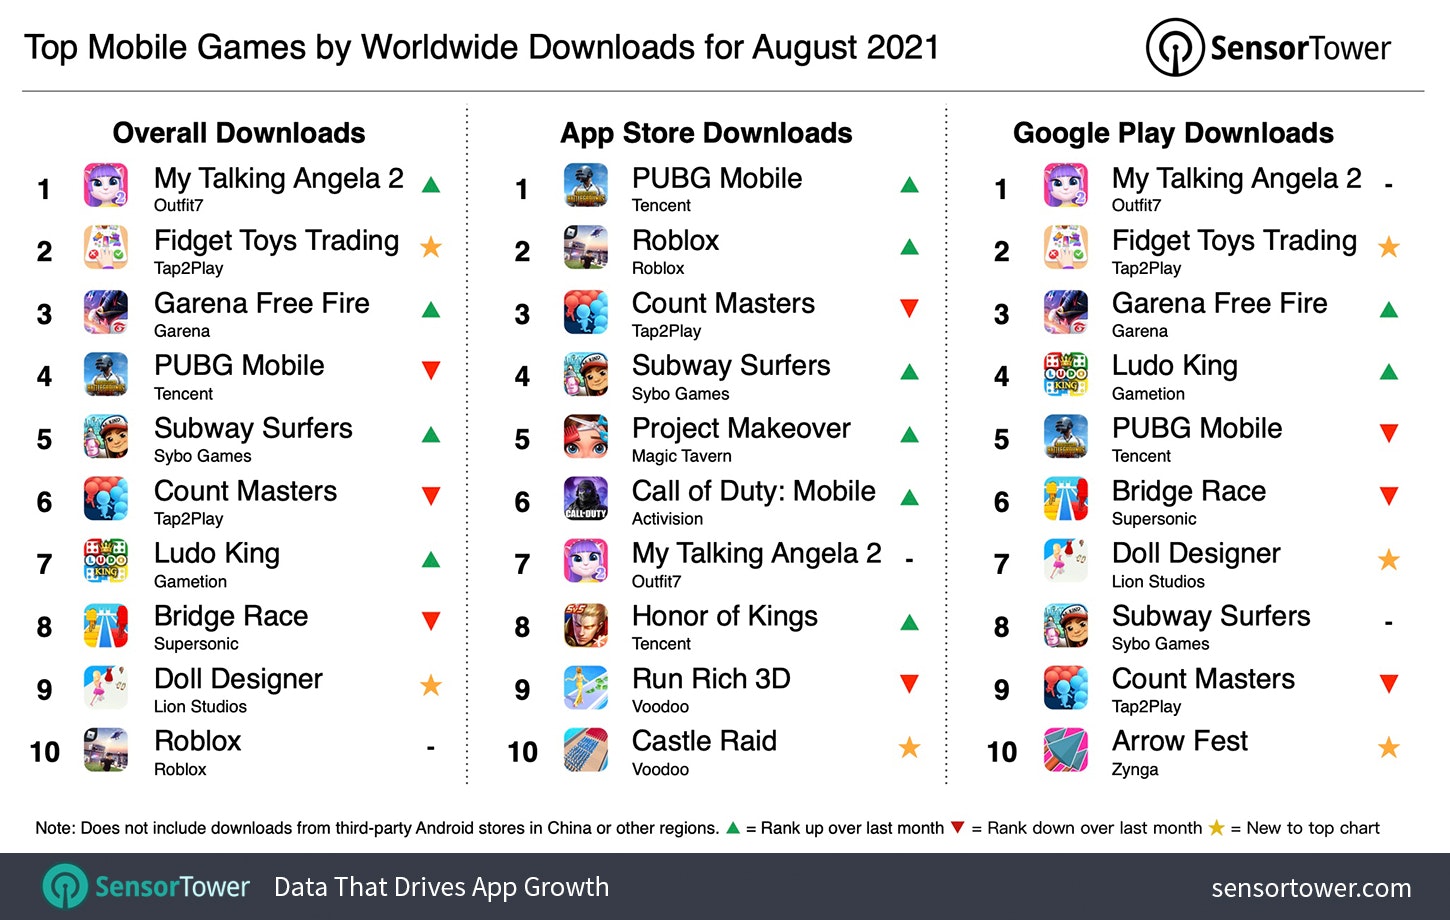
My Talking Angela 2 from Outfit7 was the most downloaded game of the previous month. It’s generated 28.5M downloads, 18% of which came from India, and 10.4% - from Brazil.
-
The second place belongs to Fidget Toys Trading from Tap2Play - 27M of downloads. Brazil is responsible for 13.7% of this amount, next is Indonesia with a 9.3% share.
-
Garena Free Fire, PUBG Mobile, and Subway Surfers are in top-5.
-
In August 2021 only 4 hypercasual games are in downloads top-10. Games of this category were downloaded 984.3M times last month.
-
In August 2021, users downloaded games 4.7B times. It’s 4% less than a year before. India is responsible for 825M of all downloads (it’s 17.6%). The US is accounting for 8.3% of downloads and Brazil - for 8.2%.
NPD: The US citizens spent $4.4B on gaming products in August 2021

-
It’s 7% higher than a year before.
-
From last year’s August, users spent $37.9B on gaming products. It’s 13% higher than the same period the year before.
-
Spendings on hardware increased by 45% and reached $329M. This is the best August from 2008 and the third by revenue in history.
-
From August last year players spent $3B on hardware in the US.
-
Nintendo Switch became the top-selling console in terms of units; PS5 was the first in terms of revenue. The selling dynamic of PS5 outpaces previous PlayStation generations.
-
The Madden NFL 22 was the best-selling game of August in the US. Ghost of Tsushima: Director’s Cut and Call of Duty: Black Ops - Cold War are on the 2 and 3 places respectively.
-
The US citizens spent $164 on accessories in August. It’s more or less the same as the year before.
Sensor Tower: Casino Games earned $4.8B in the US during the past year
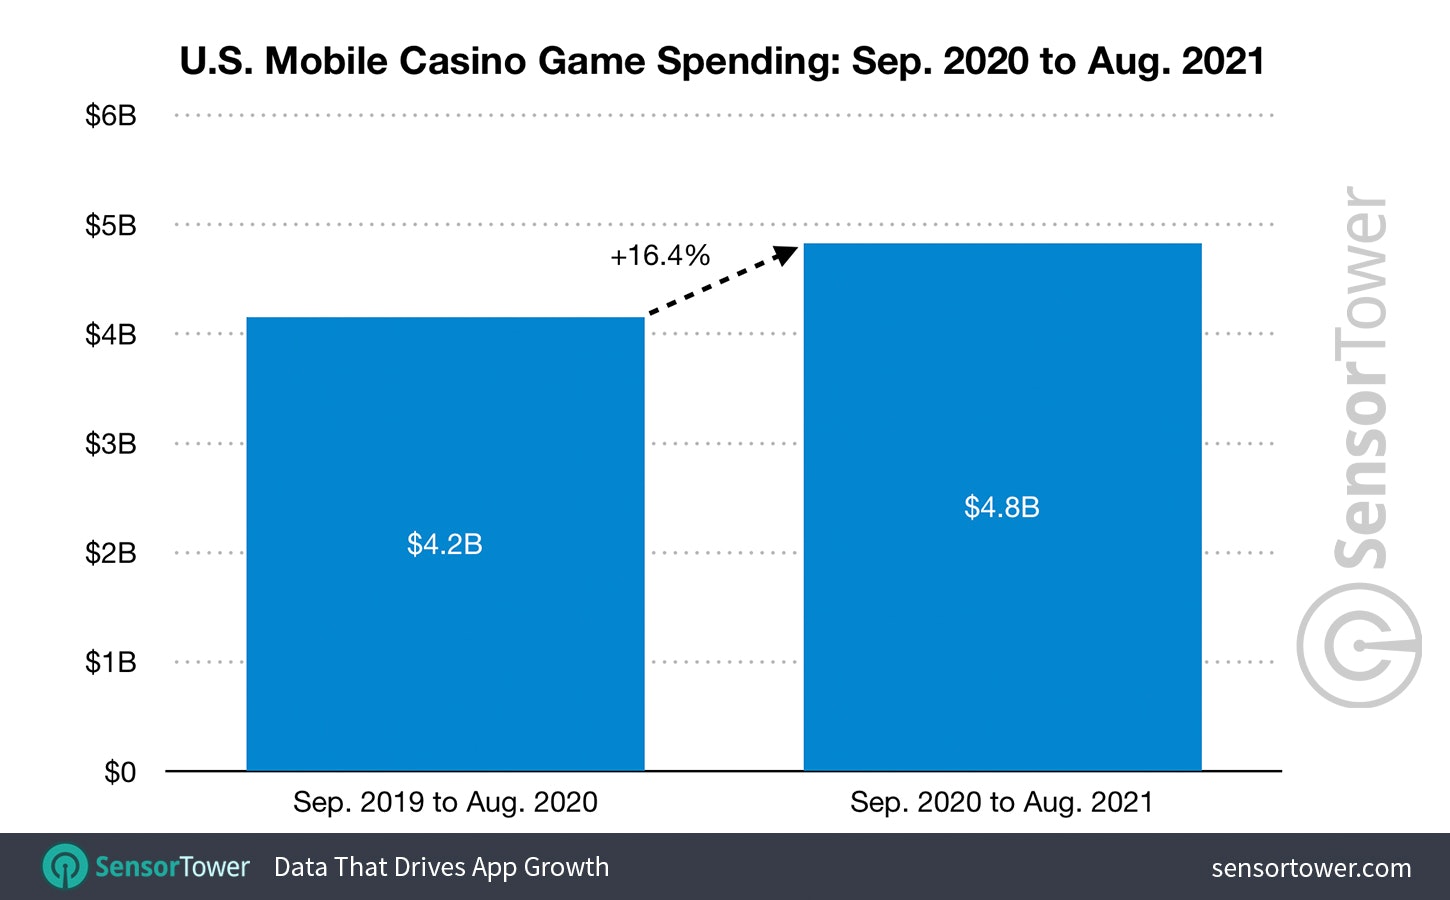
-
It’s 16.4% higher than a year before.
-
The highest revenue from 1 September 2020 to 31 August 2021 showed Coin Master (Moon Active) - $650.5M. Bing Blitz (Playtika) & Slotomania (Playtika) are in second and third places.
-
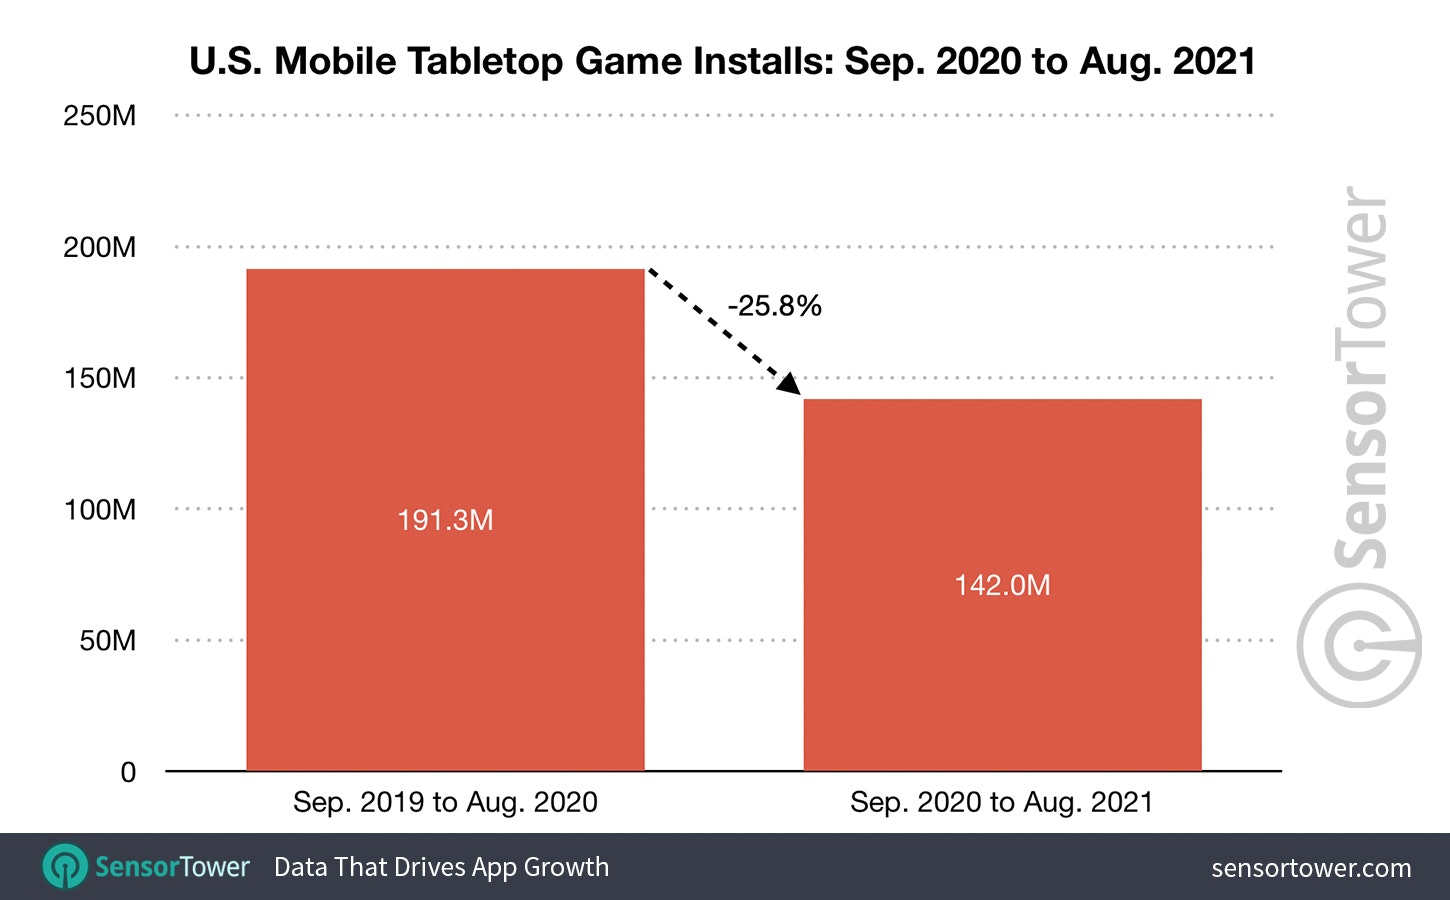
During the past year, casino games were downloaded 142M times in the US, which is 25.8% lower YoY.
-
Coin Master was the top-downloaded game with 8.4M of downloads.
-
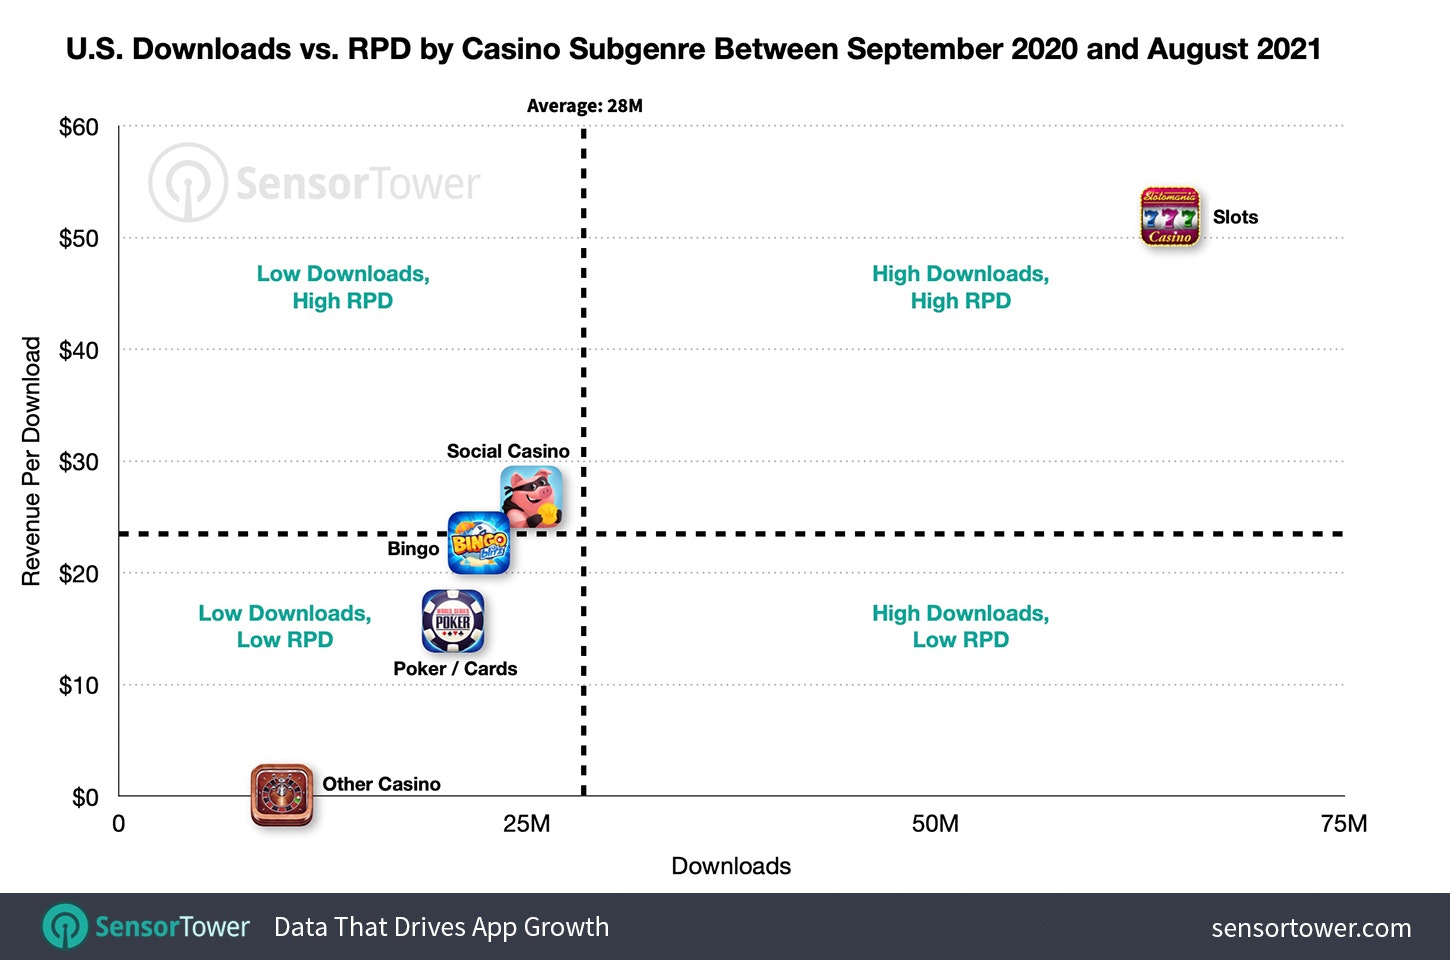
Slots are the most popular subcategory of casino games. It’s generated $3.3B of revenue (+13.2% YoY). The highest growth dynamics, however, showed the Bingo subgenre - +30.7% YoY ($499.3M of revenue).
-
Slots are the top-downloaded subcategory as well - 64.4M of downloads.
-
Casino games are second after the Puzzle games ($4.9B of revenue during the last 12 months) category in the US by revenue.
-
Coin Master is responsible for 96.3% of the whole social casino subcategory in the US. Bingo Blitz is covering 53.7% of the revenue of the Bingo subcategory.
AppMagic: Top-10 Turkish publishers by Revenue and Downloads in H1 2021
-
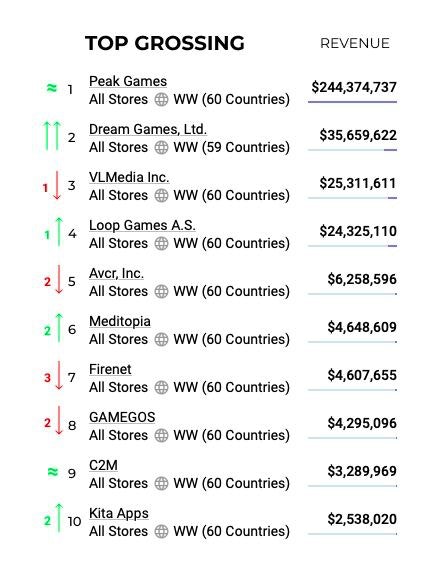
Peak Games took solid first place with $244.3M of revenue in H1 2021. The closest competitor - Dream Games - earned $35.6M.
-
However, Dream Games showed a significant growth rate - 14,344% (fourteen thousand, yeah) because of Royal Match success.
-
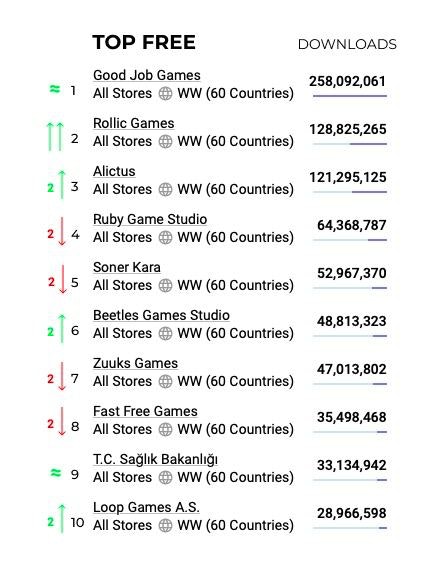
Games from Good Job Games were downloaded 258M times in H1 2021 - it’s 20% less than in H1 2020. But it’s still enough to be first.
-
Rollic Games showed nice performance with 31x growth and 128.8M of downloads.
AppsFlyer: Mobile Landscape in Nordics
-
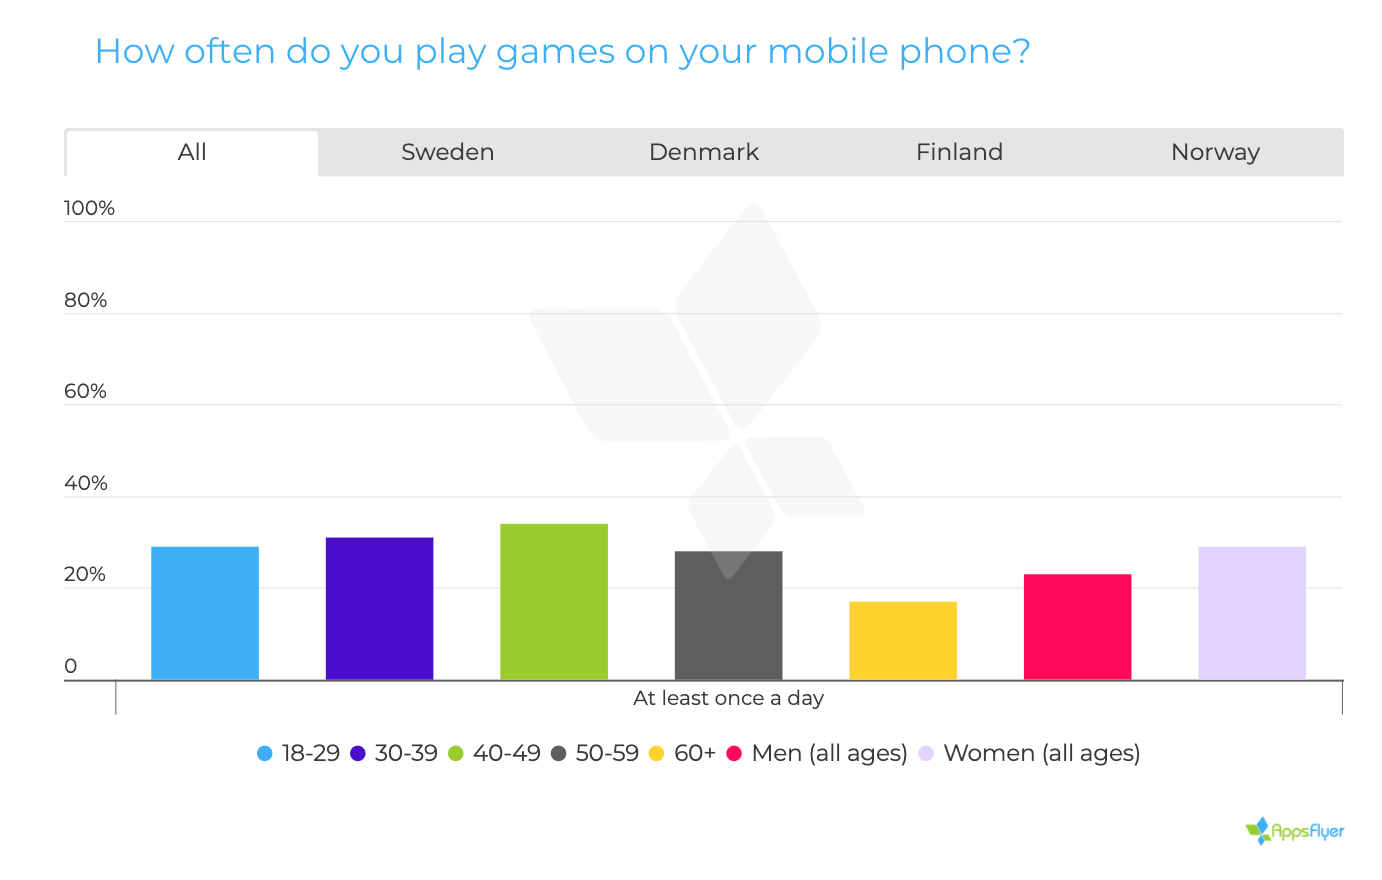
In Nordic countries, females are playing at least once a day often than males - 29% versus 23%.
-
The most active age segment is 40-49 - 1/3 of those users are playing at least once a day; a quarter is playing multiple times.
-
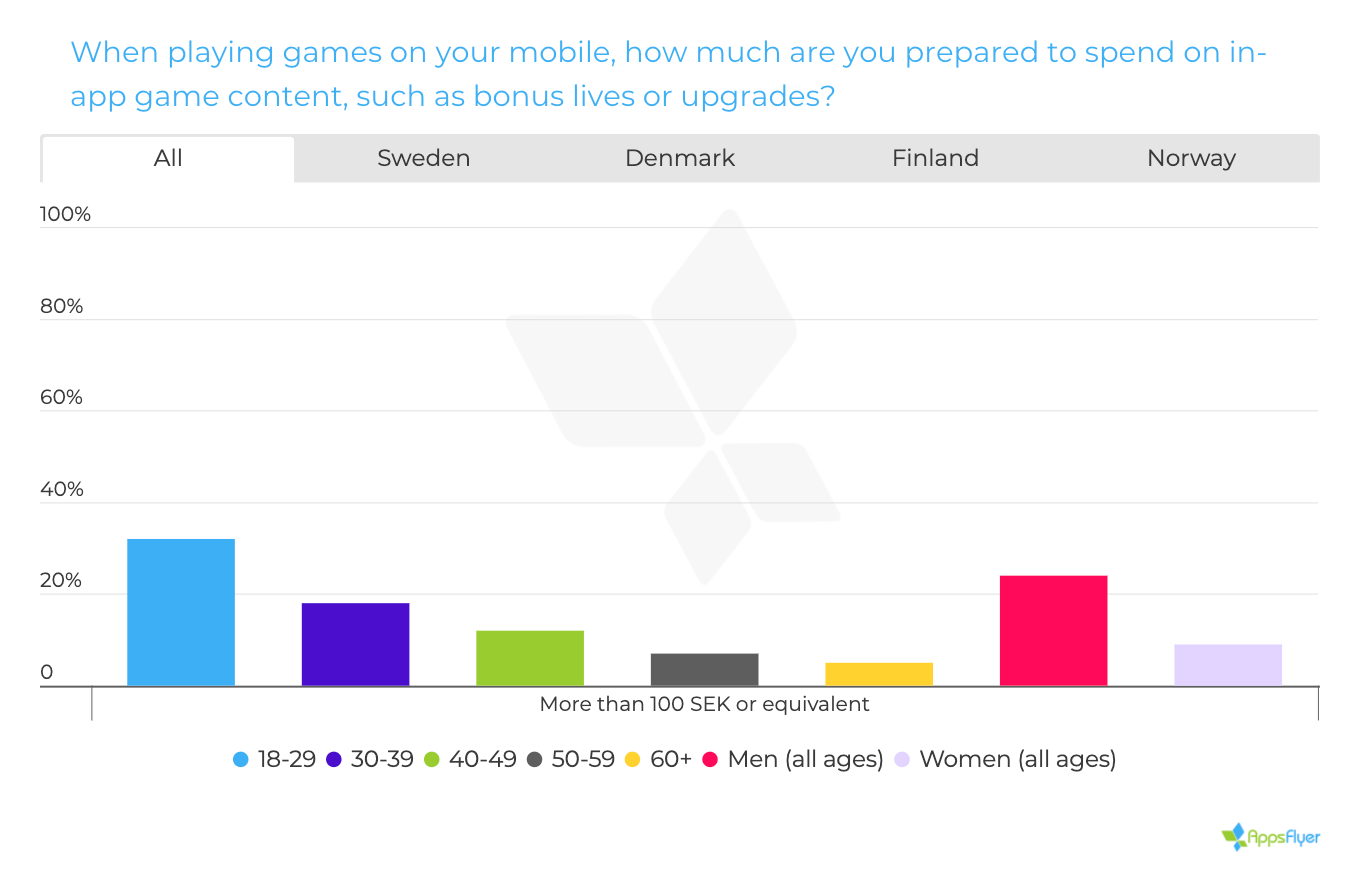
Males are more likely to spend money on games. Every 4th man is ready to spend 100 SEK (about $11) in games. If we’re talking about females, every 9th woman is ready to spend this sum.
-
Young users are much easier to spend large sums on games.
-
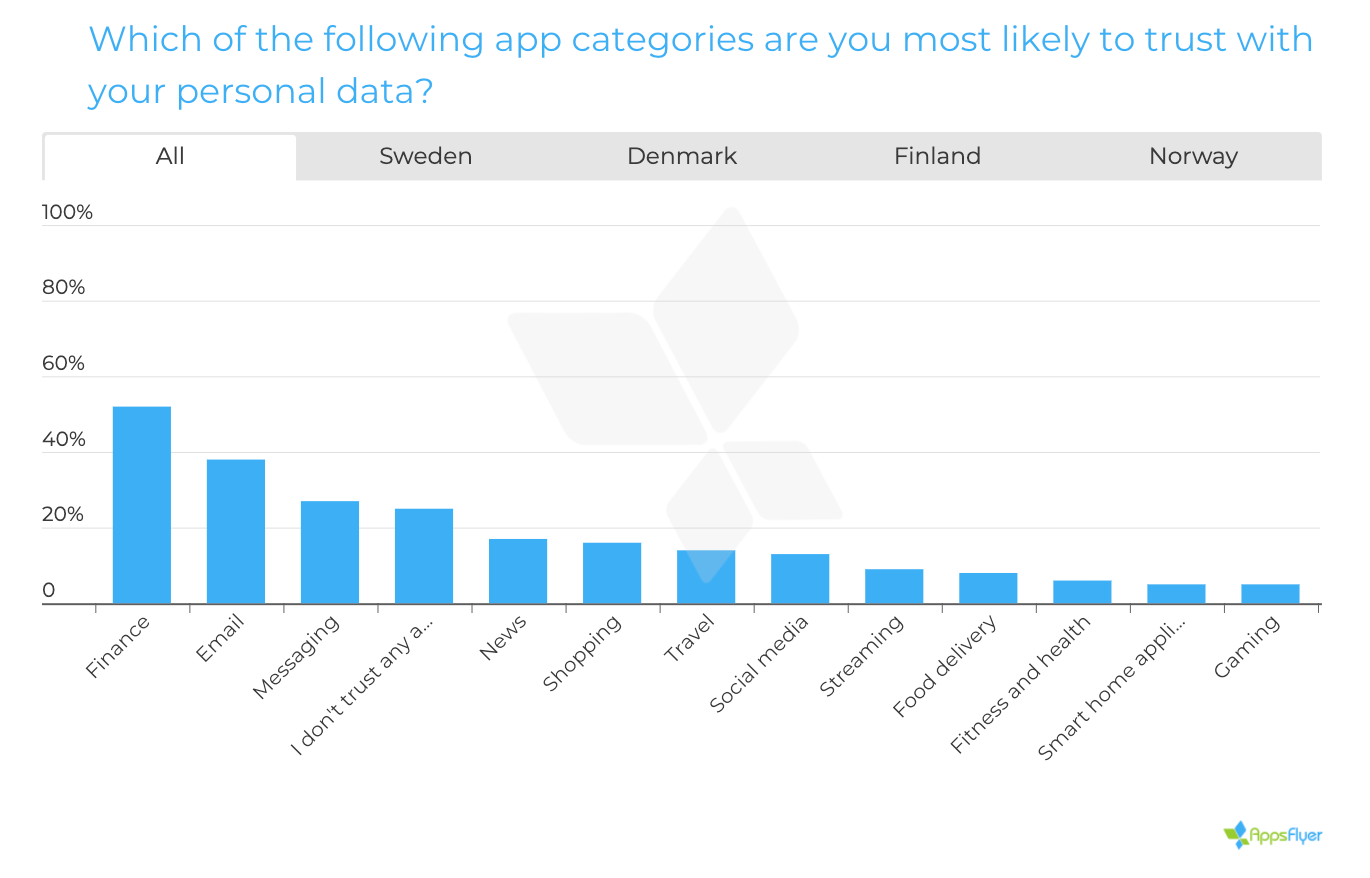
Only 5% of Nordic users allowed games to collect their personal data. It’s even less than Smart Home apps have.
-
Around 30% of Nordic users would like to pay for their personal data not to be collected.
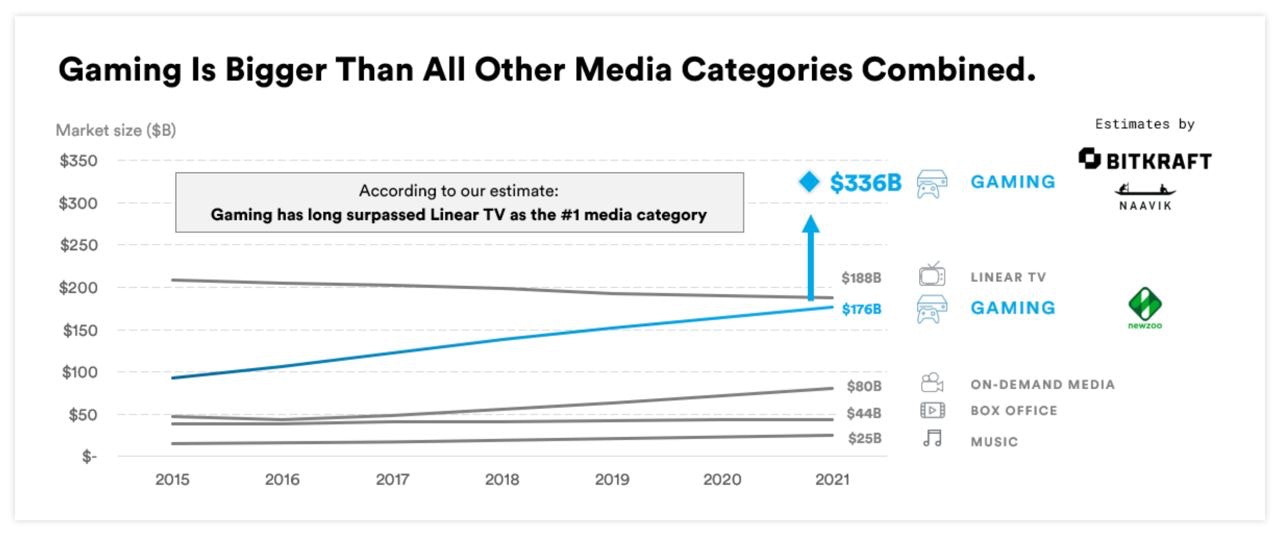
Naavik & BITKRAFT: In reality, the Gaming Market valuation is $336B, not $176B
-
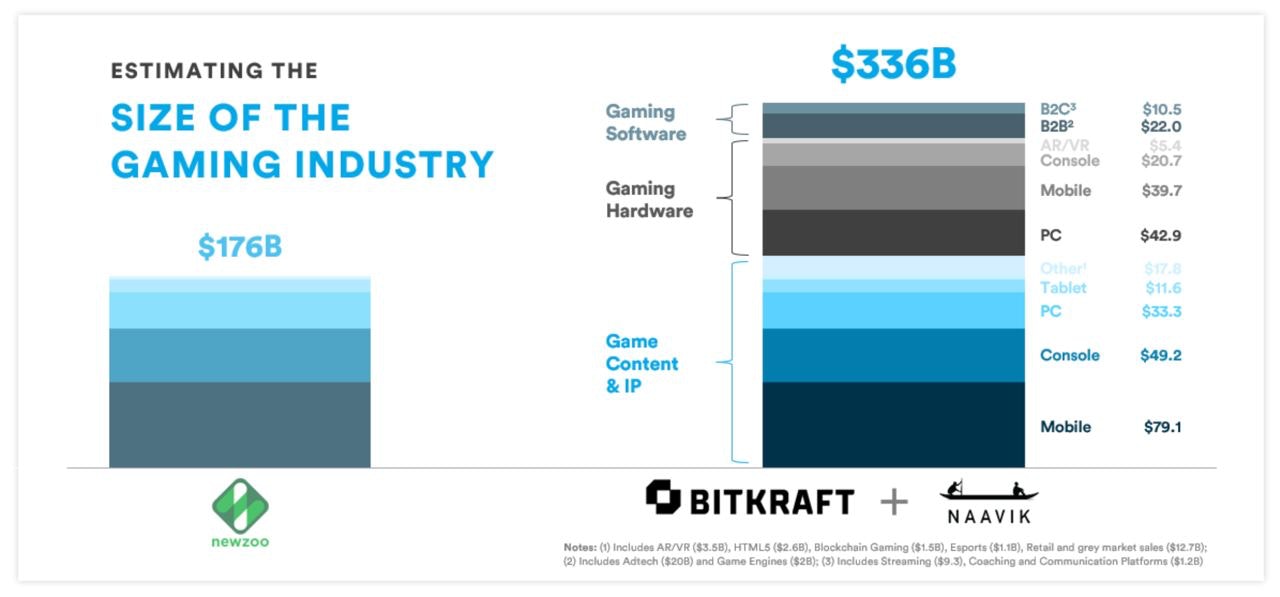
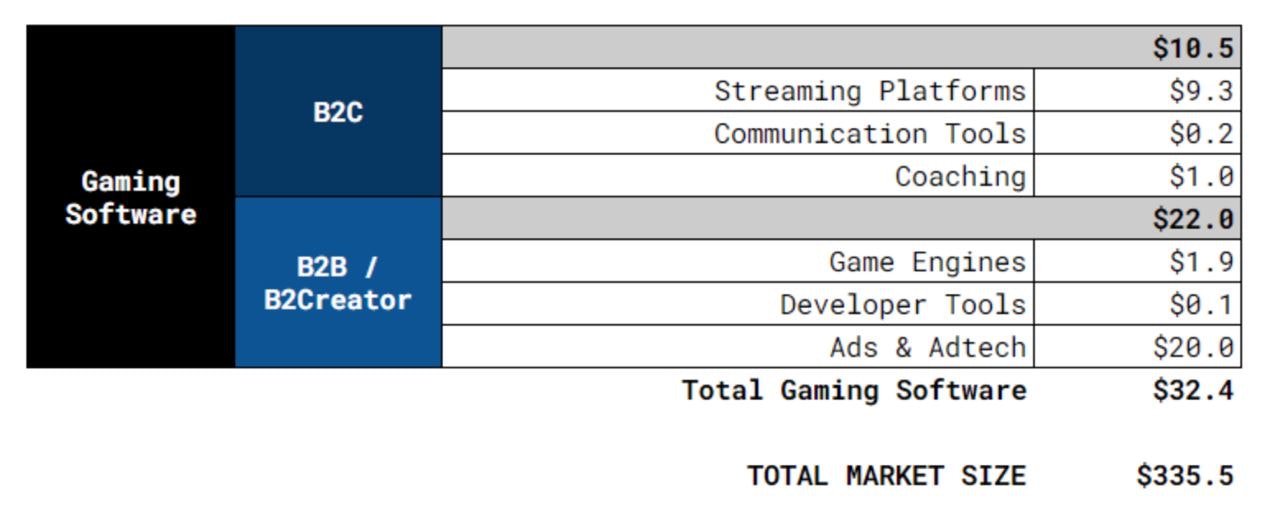
The company is assuring that the Newzoo valuation is incorrect and doesn’t take into account hardware sales, gaming software revenue, blockchain games & other segments.
-
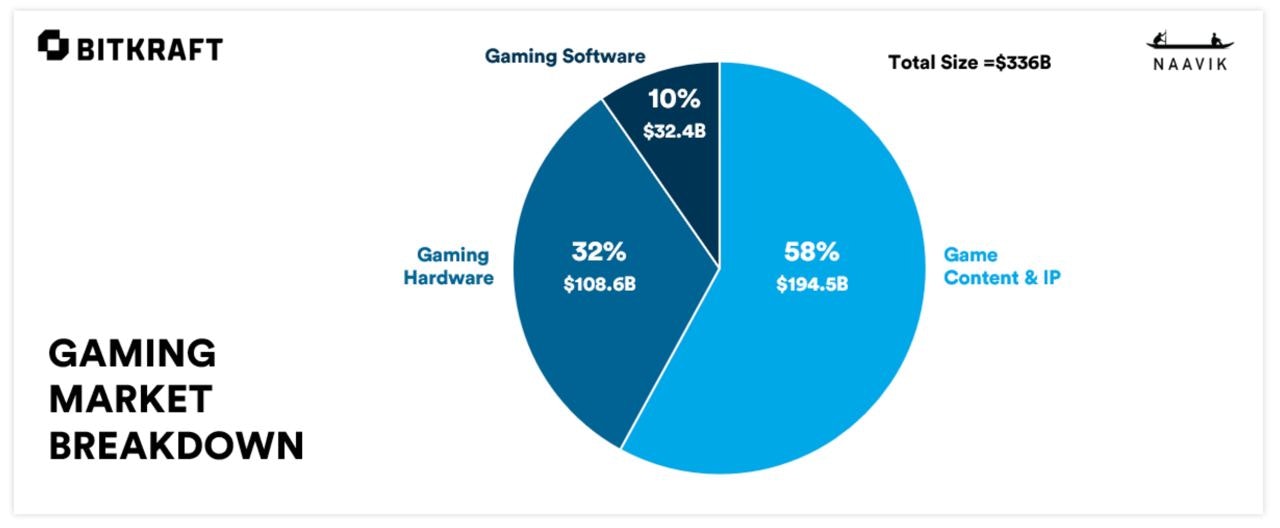
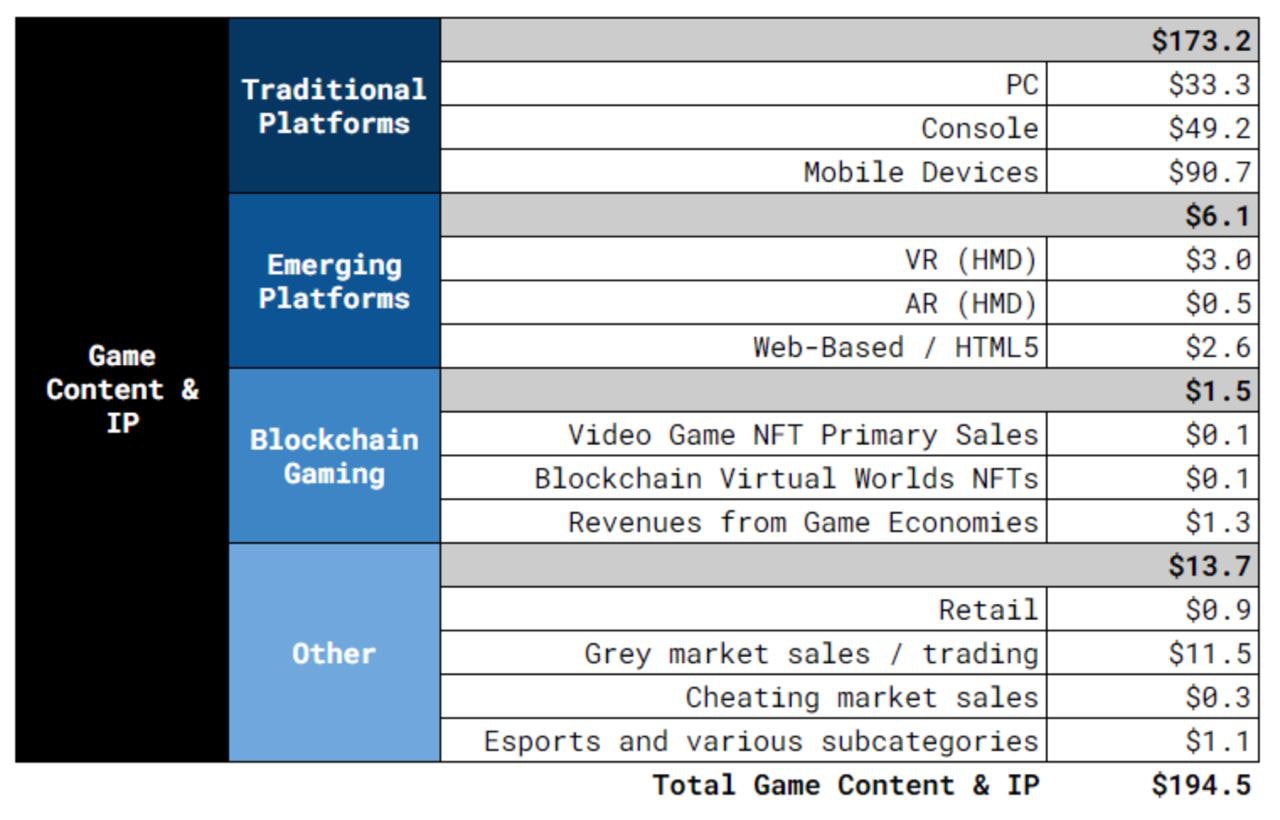
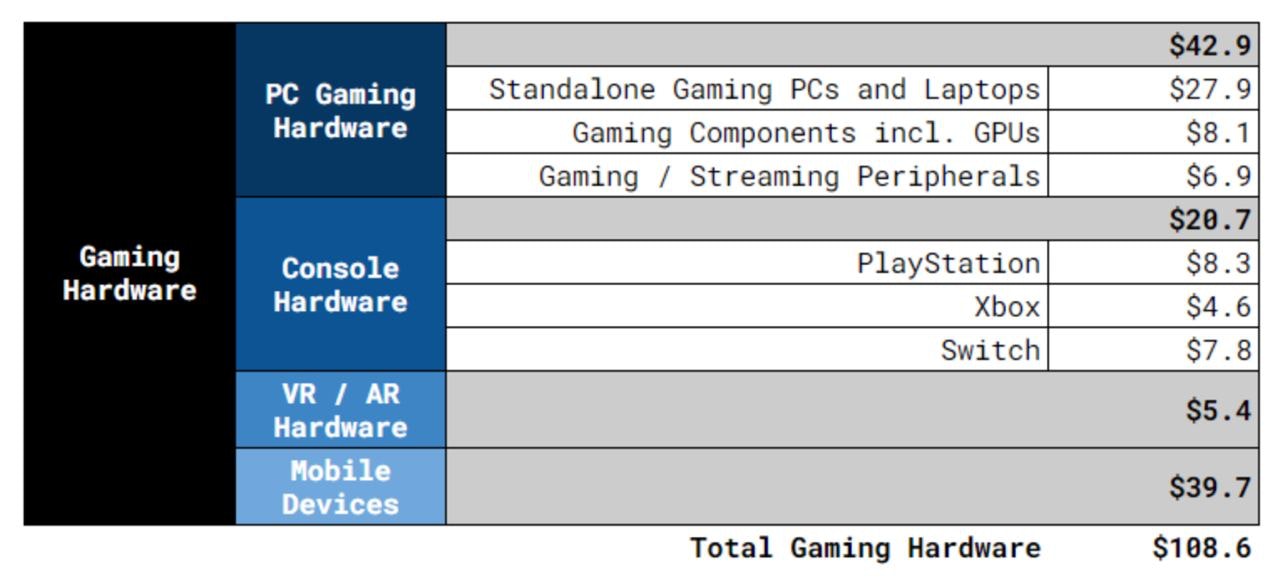
Companies are telling that 58% of the market share ($194.5B) belongs to Games & IP sales. Another 32% (108.6B) are coming from hardware sales. And final 10% (32.4B) are from gaming services of all kinds.
-
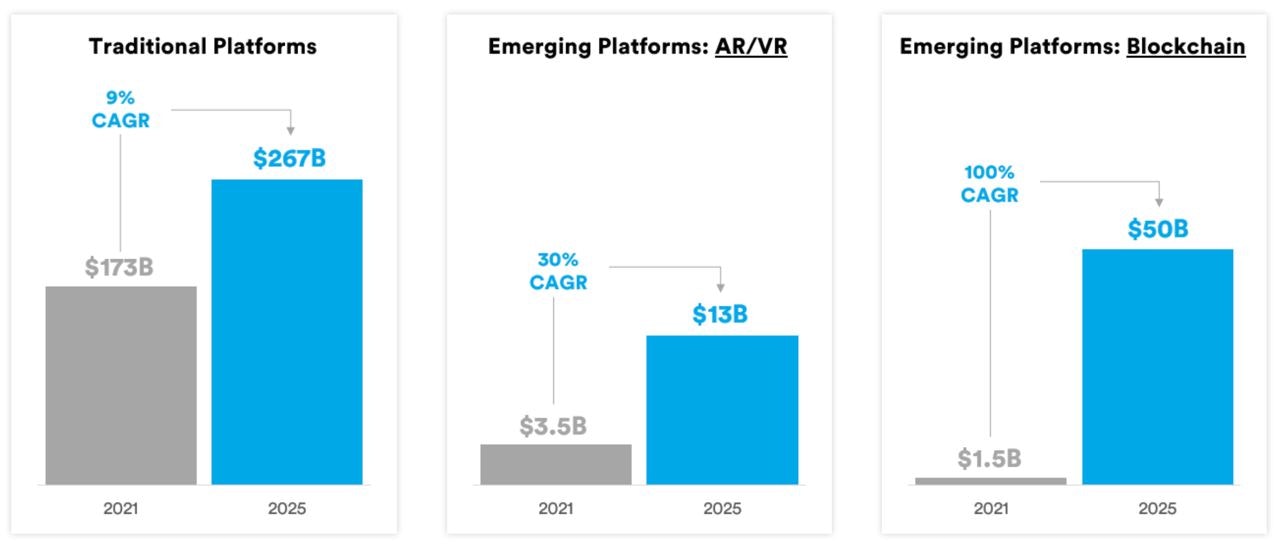
Naavik & BITKRAFT Ventures analytics are sure, that traditional game’s revenue will reach $267B by 2025. They are also positive that blockchain games will show a CAGR of 100% and will reach $50B by 2025.
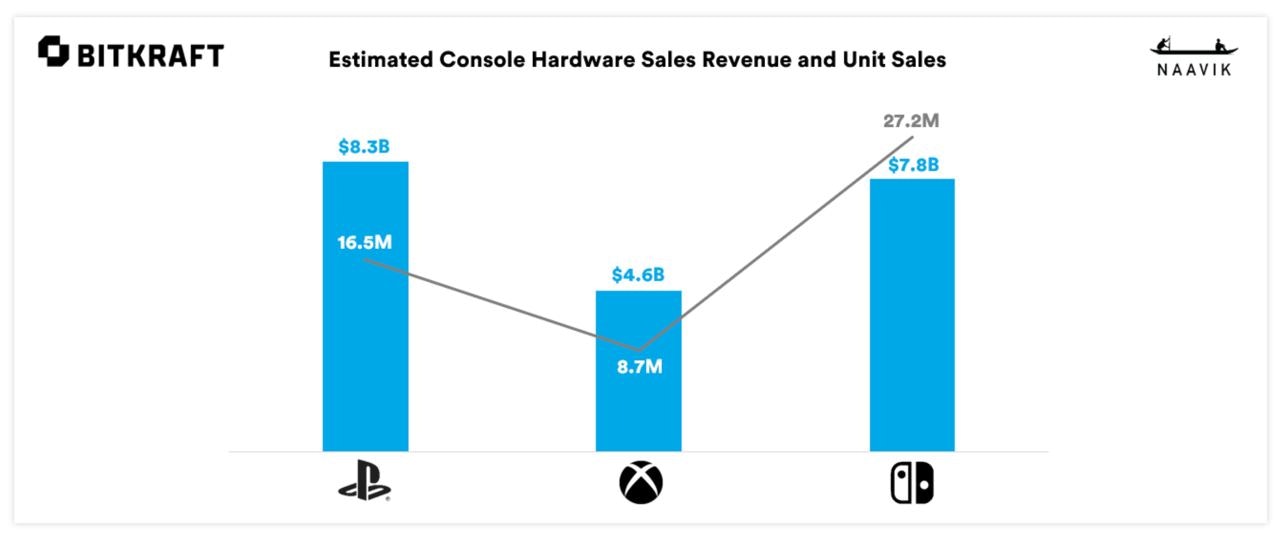
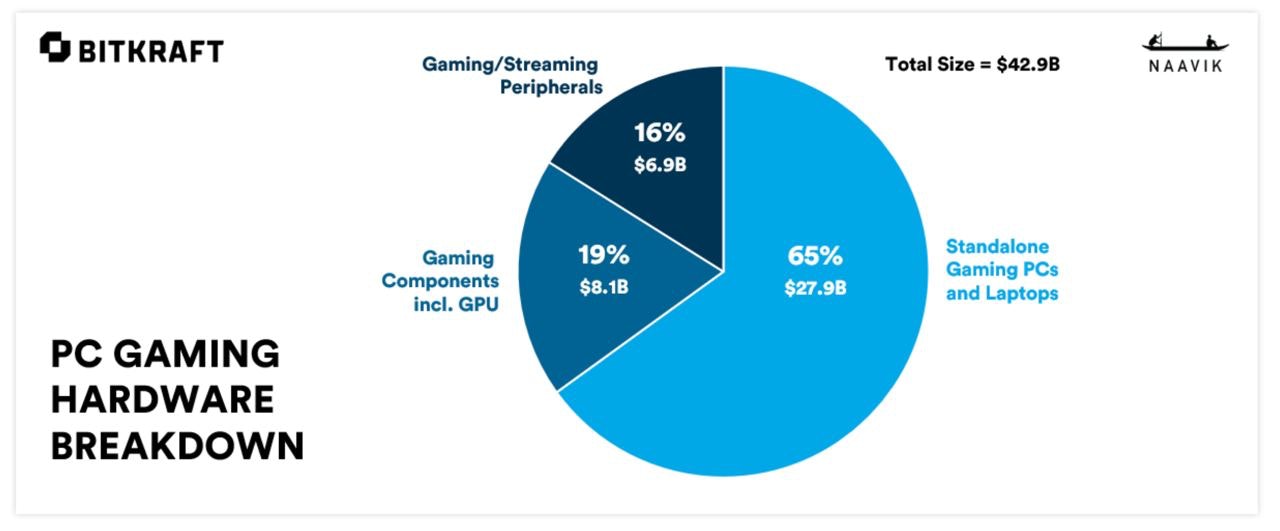
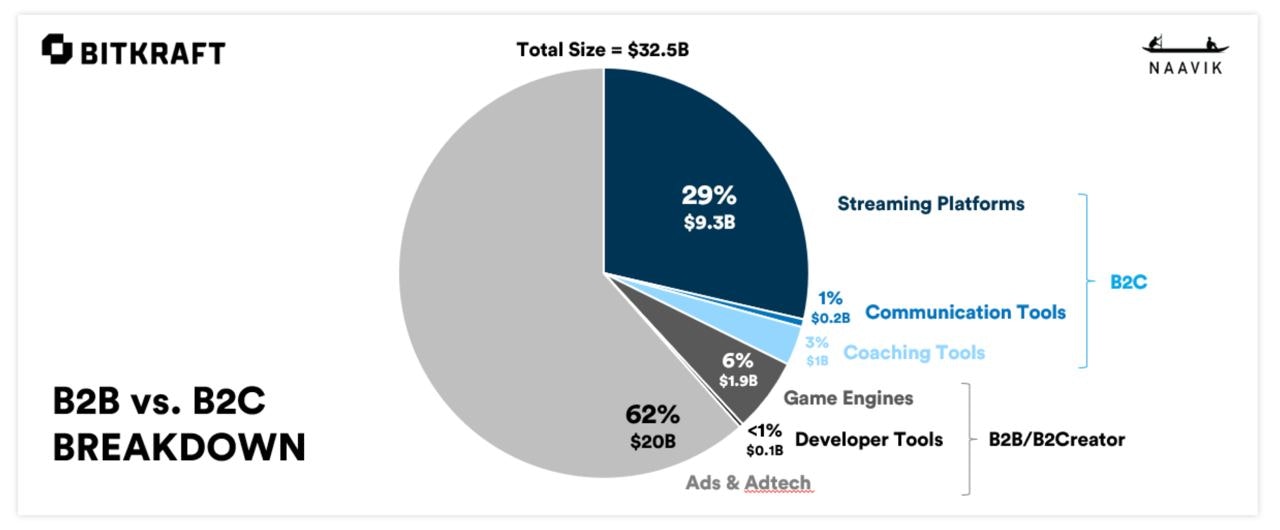
- About $20B of the valuation belongs to Ads & Adtech services. While the gaming engines are valued only at $1.9B. Streaming platforms of all kinds are responsible for $9.3B.
And here is an overview.
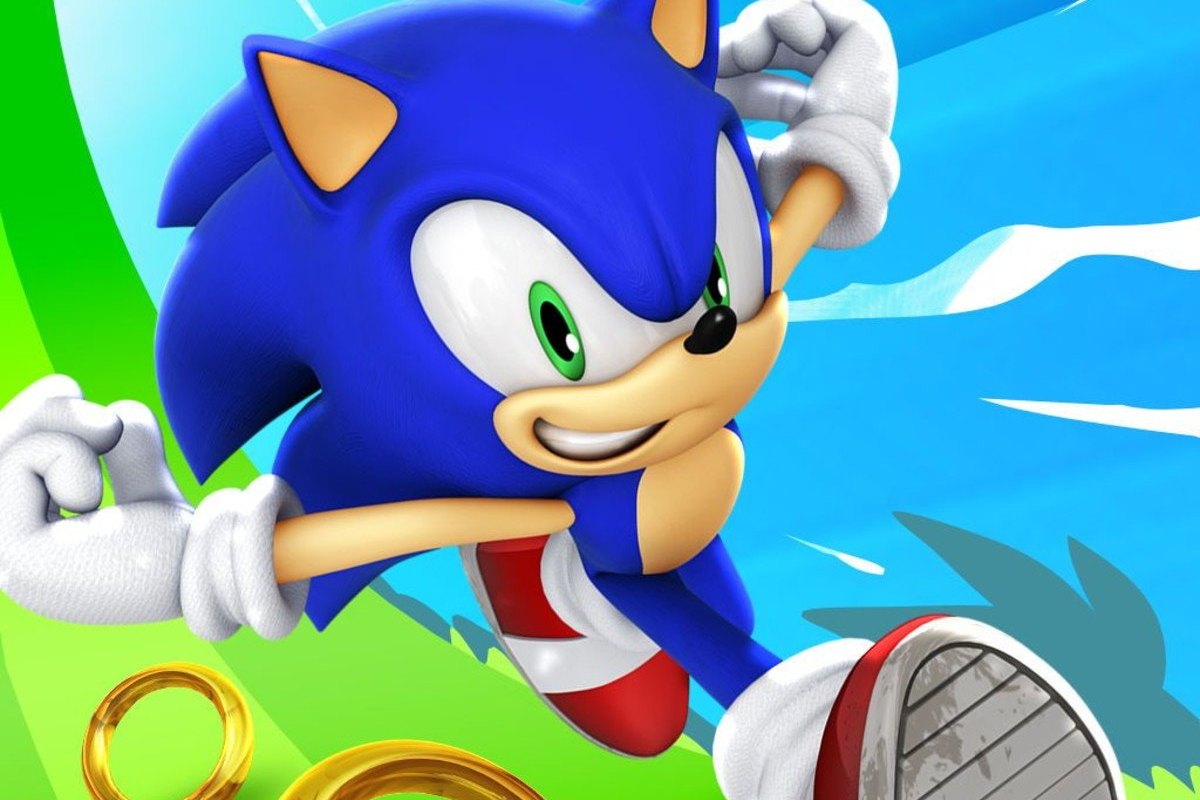
Sonic Dash is the most popular Sonic game on Mobile
-
The game was downloaded 500 million times.
-
Sonic Dash was released in March 2013. Alone it generated more revenue, than 5 other Sonic games on Mobile.
Sensor Tower: Casual Puzzle genre Overview in Last 18 Months
-
Monthly puzzle revenue has increased by 17% since the beginning of 2020.
-
Games, released from the beginning of 2020 in the Casual Puzzle genre, are responsible for 9% of revenue and 42% of downloads.
-
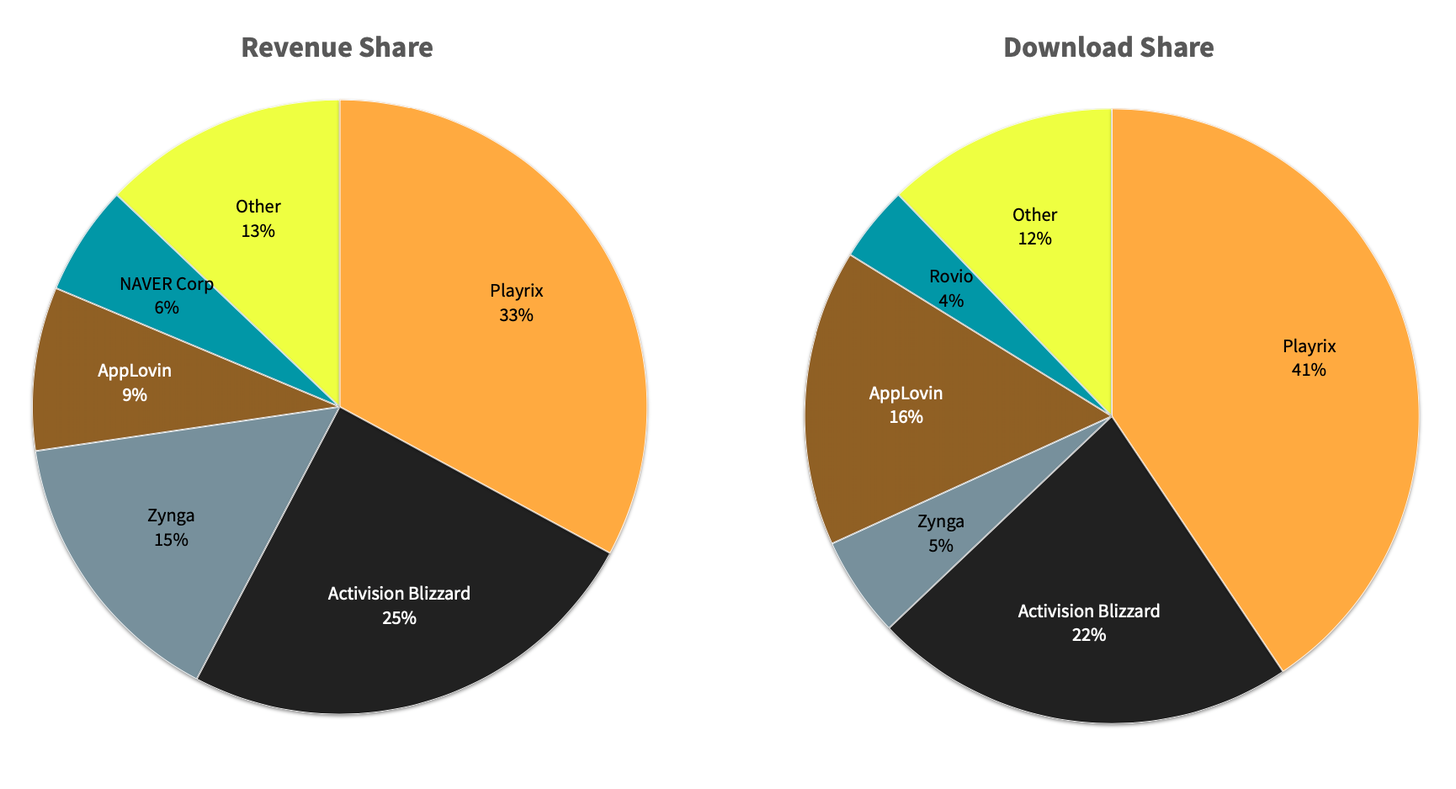
Playrix & Activision Blizzard together are holding 58% of genre revenue and 63% of genre downloads.
-
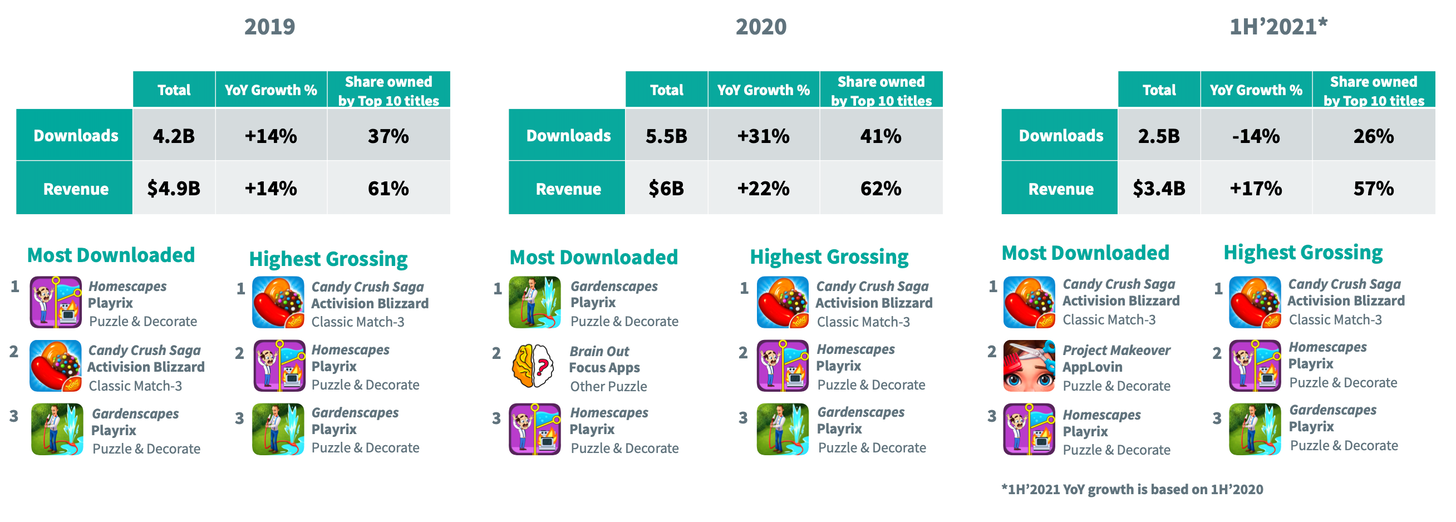
In H1 2021 Casual Puzzle games were downloaded 2.5B times (-14% YoY). However, their revenue reached $3.4B (+17% YoY). Top-10 projects are responsible for 57% of this sum.
-
In 2021 the following subgenres showed a decrease in revenue compared to 2020: Bubble Shooter, Hidden Objects, Tile Blast, Word.
-
Puzzle & Decorate sub-genre (Homescapes, Gardenscapes, Project Makeover) is the largest in the Casual Puzzle genre. In June 2021 games of this sub-genre earned $80M.
The full version of the report is available here.
Sensor Tower: Sports & Racing games Report
-
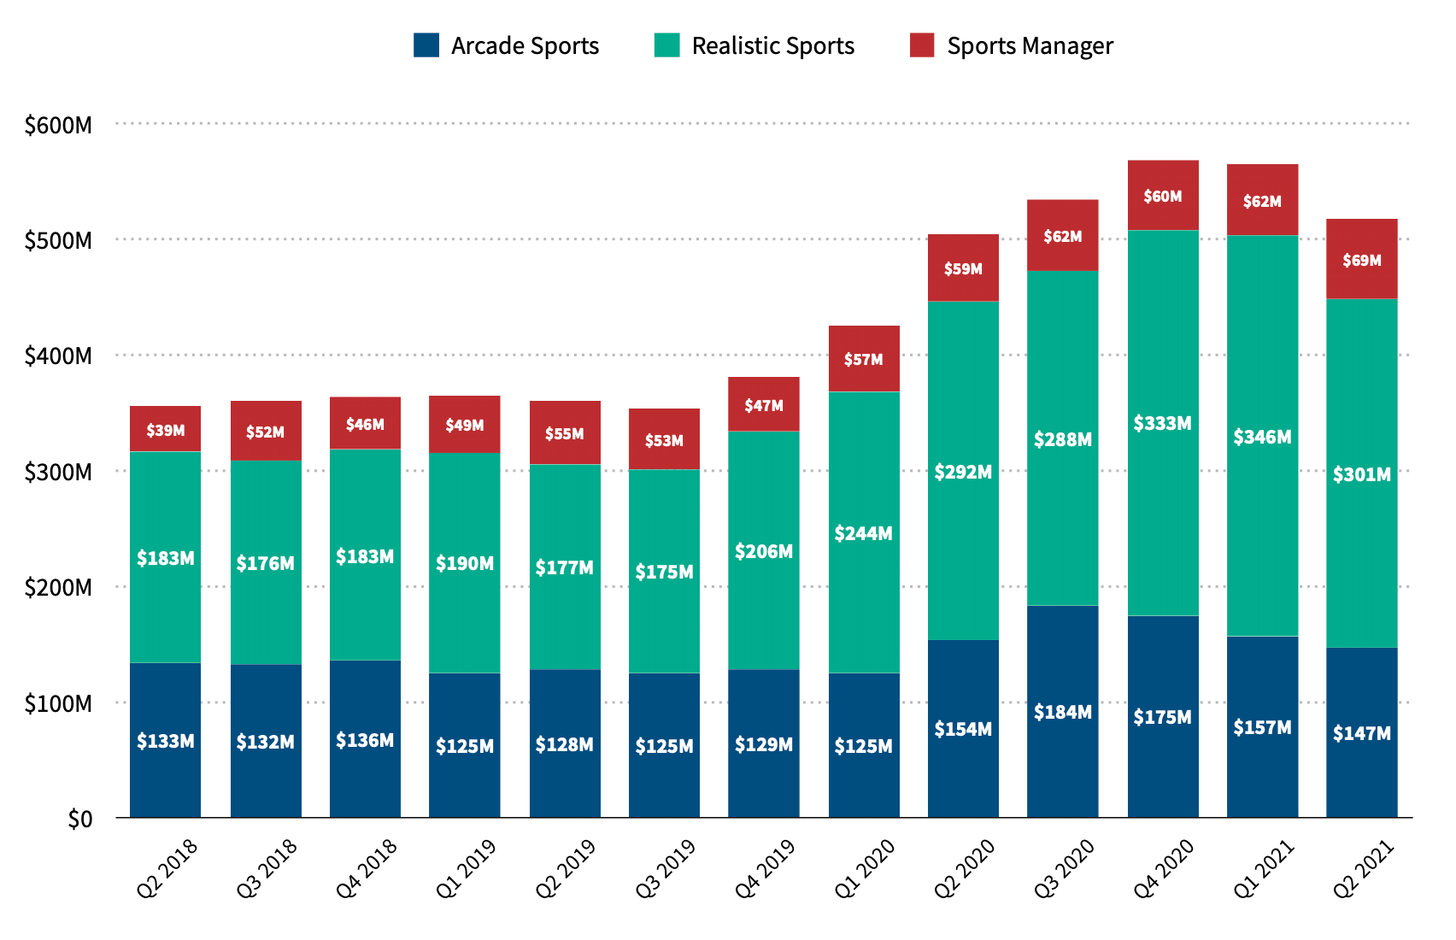
Sports games achieved $2B revenue in 2020 and showed the 40.2% growth YoY.
-
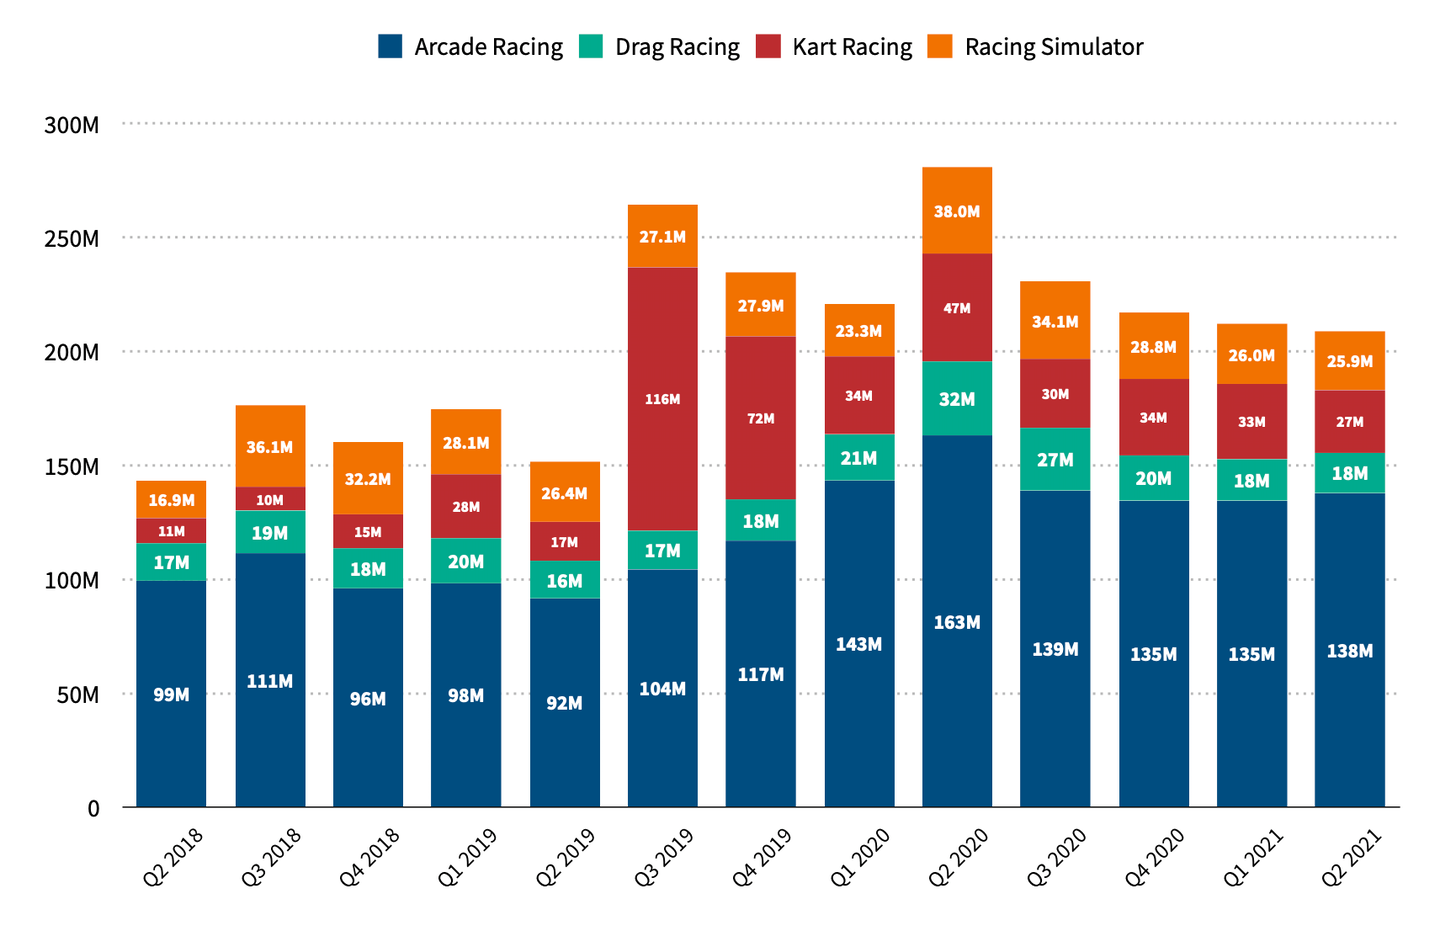
2020 wasn’t so good for Racing games in terms of revenue, it remained more or less unchanged. But in terms of Downloads, the genre increased by 22,3% and reached 1.9B of downloads.
-
Japan is the best market for Football and Baseball games, while Chinese players spent the most on Basketball titles. In the US Golf, Fishing, and Alternative Sports games are feeling great.
-
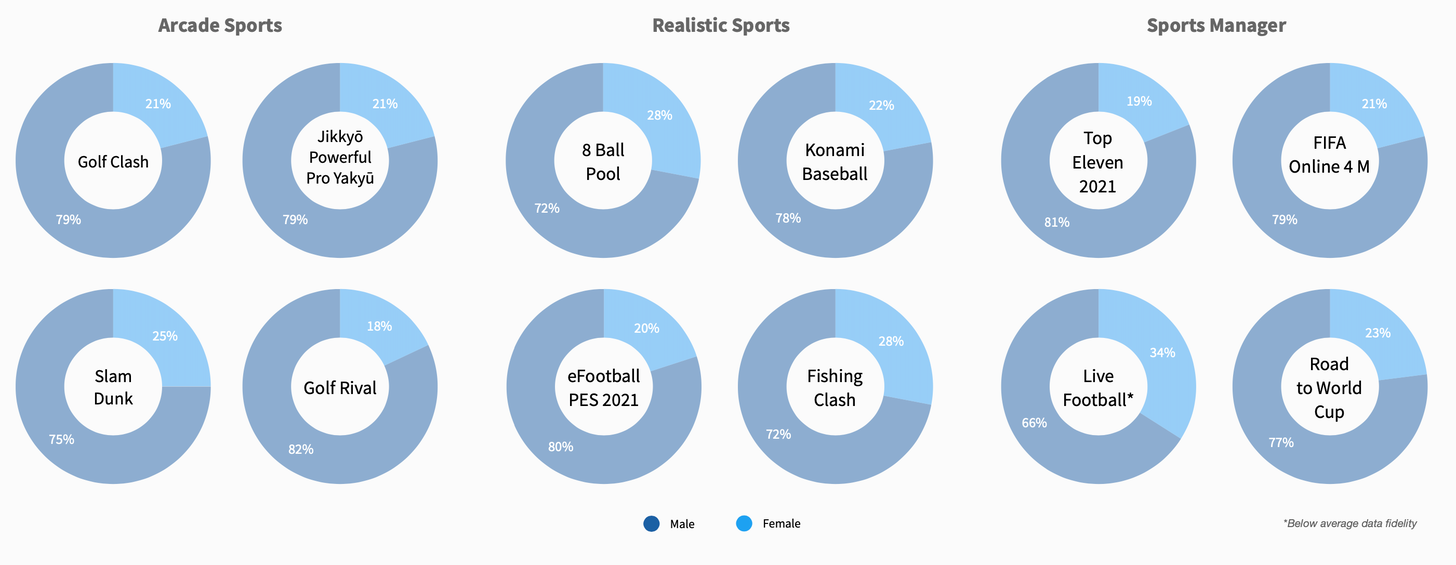
The majority of Sports games players are male (about 75%).
-
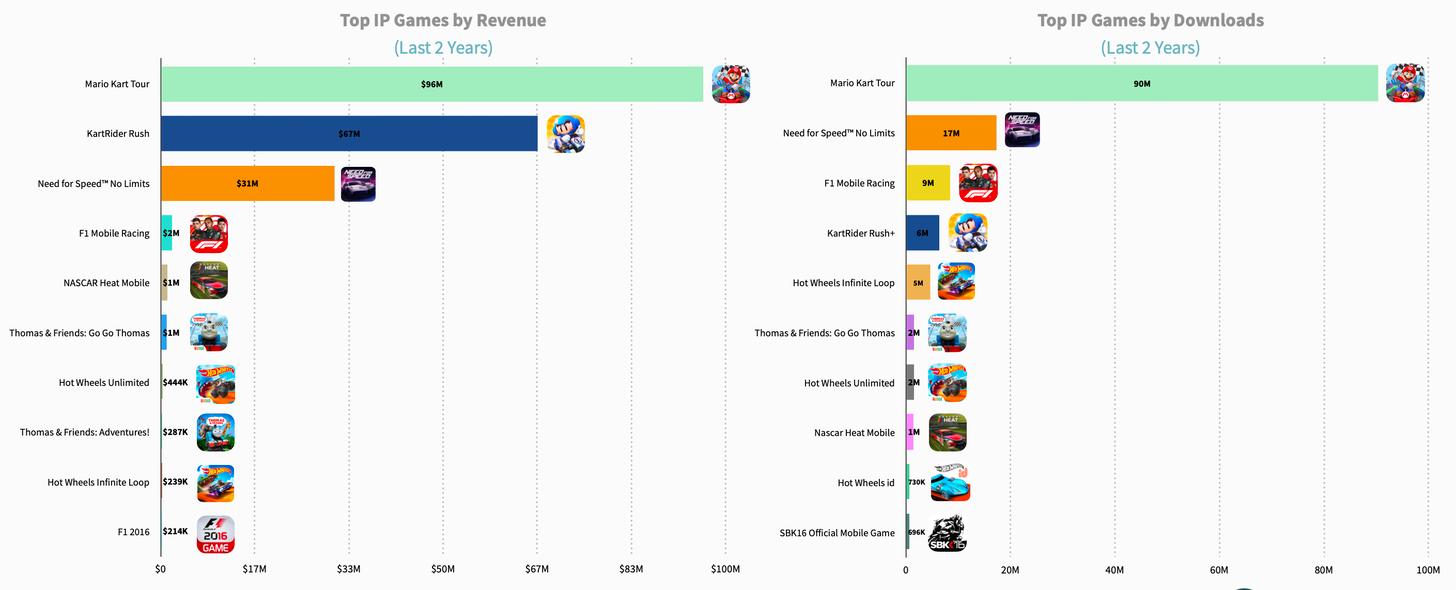
Cart Games are driving the whole Racing genre. 3 of 5 games of this sub-genre are on top in terms of revenue. And the leader here is Mario Kart Tour.
Link to the full version of the report.
Omdia: Ad Revenue is growing much faster than in-app Purchases
-
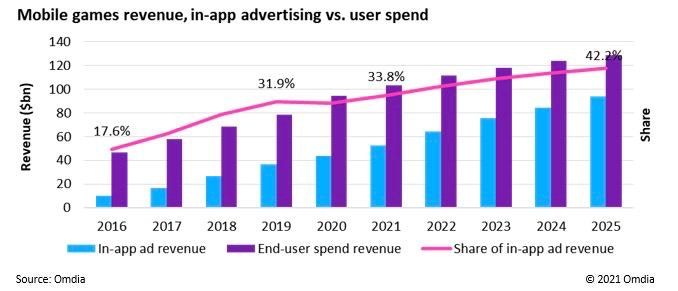
By the end of 2025, the share of Ad Revenue will be 42.2%.
-
In 2016 Ad Revenue was responsible only for 17.6 of all revenue. In 2021 this number will increase to 33.8%.
-
The growth is significant in Card games, Casino, Puzzles, and Sports games.
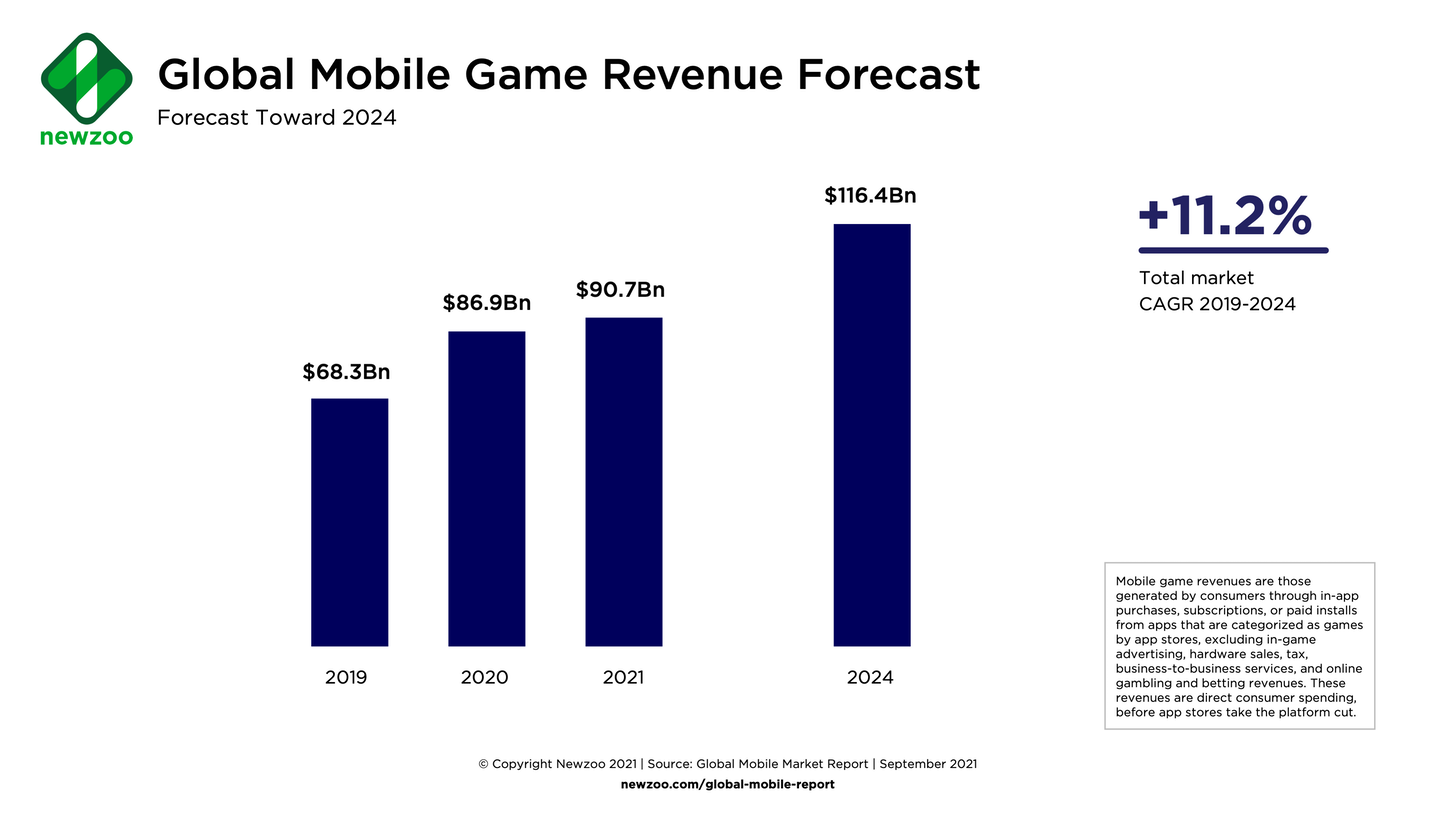
Newzoo: Mobile Gaming Market will reach $116,4B in 2024
-
Currently, the gaming market is valued at $90,7B (+4,4% YoY).
-
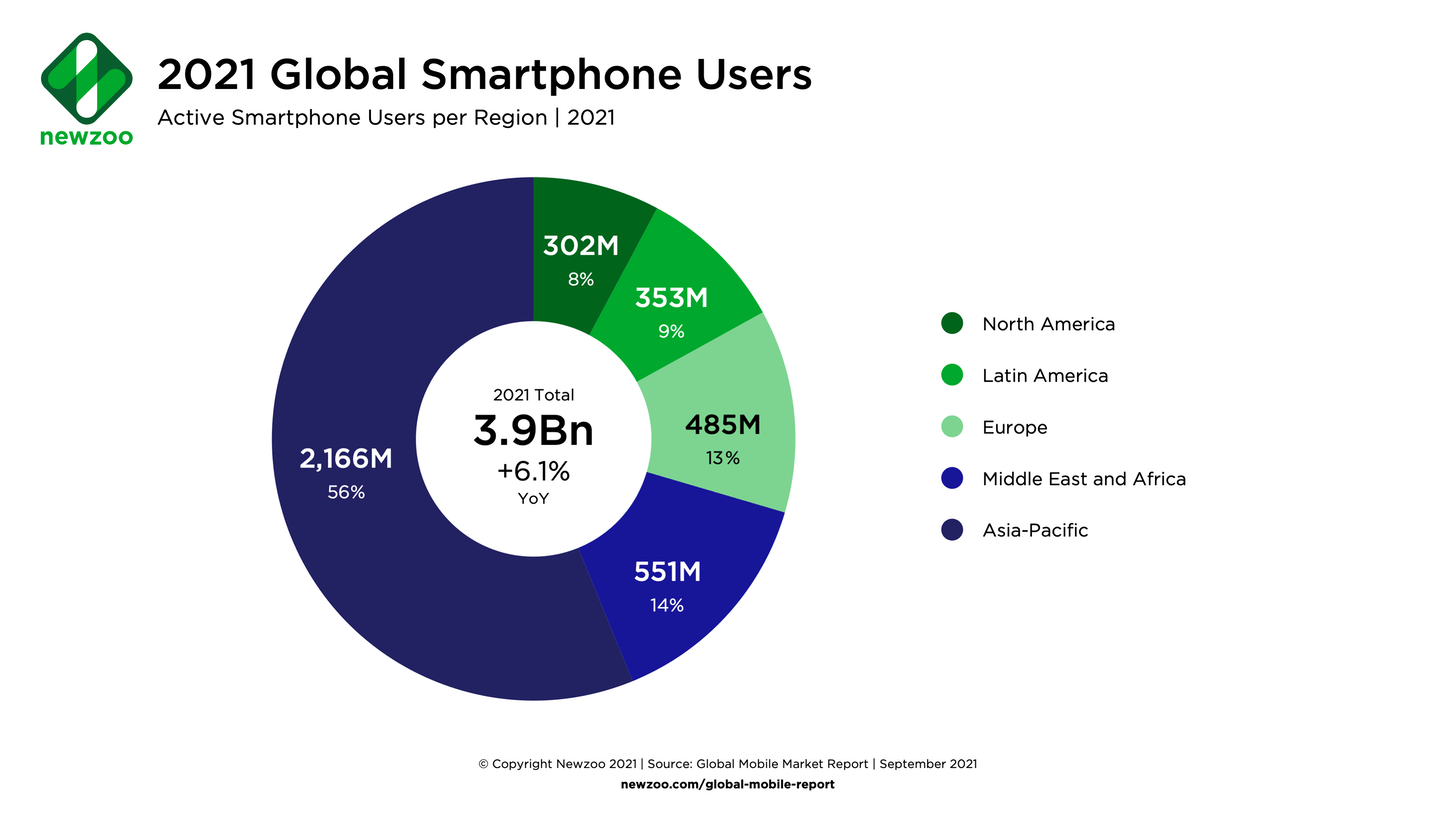
The number of smartphone users is growing and by the end of 2024 is supposed to reach 4.5B people. This year it will be 3.9B with the majority (2.1B) in the Asia-Pacific region.
-
45.3% of all mobile revenue belongs to iOS ($41.1B). 31.1% is coming from Google Play ($28.2B). The remaining 23.5% of revenue is generating alternative Android Stores, mainly in China ($21.3B).
-
Newzoo analytics are positive, that in the future the Google Play & alternative Android Stores will overcome App Store by revenue.
-
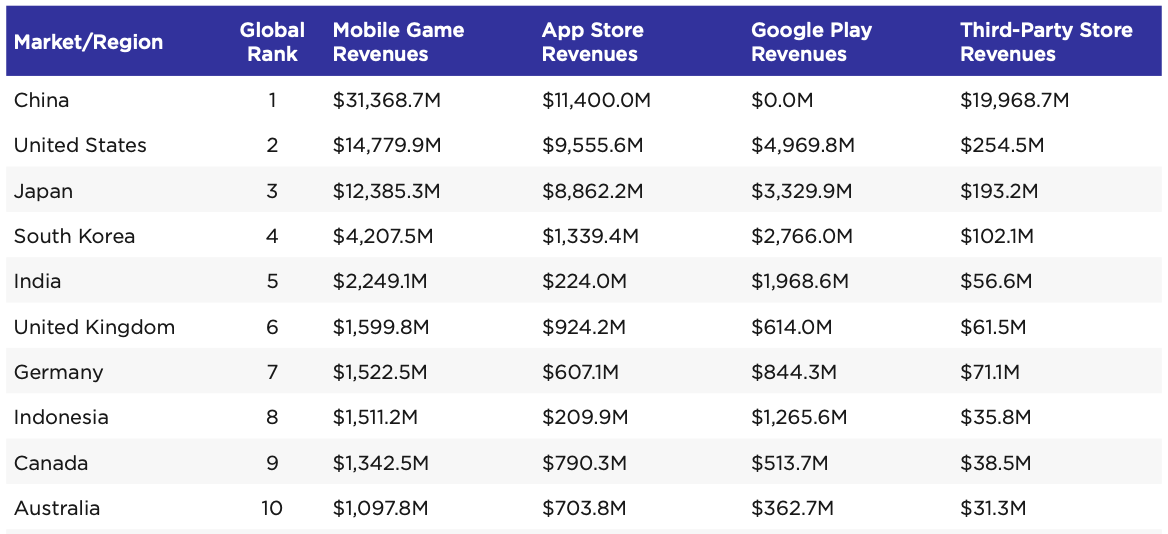
Three leaders by revenue - China ($31.3B), the US ($14.7B), and Japan ($12.3B).
App Annie: Spent on Mobile Games in Q3 2021 will overcome pandemic-2020 level and reach $22B
-
App Annie believes that users will make 14.5B downloads in App Store & Google Play in Q3 2021.
-
App Store revenue will reach $13B (+10% YoY). Google Play will show the same growth rate showing $9B of revenue.
-
Games are responsible for 77% of the revenue of Google Play and 60% of the revenue of the App Store.
-
As for the downloads, 44% of all Google Play downloads and 29% of App Store downloads belongs to Games.
-
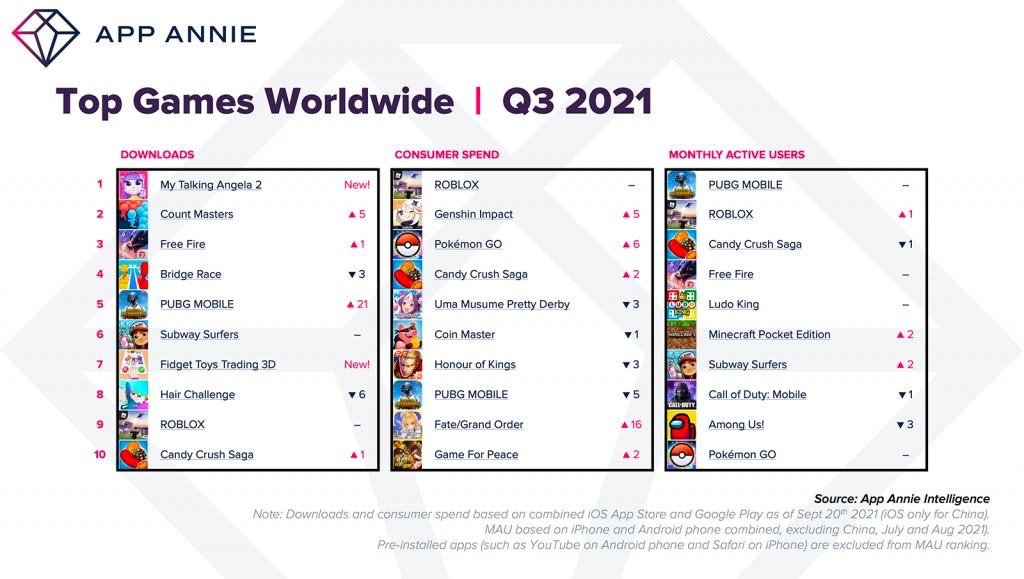
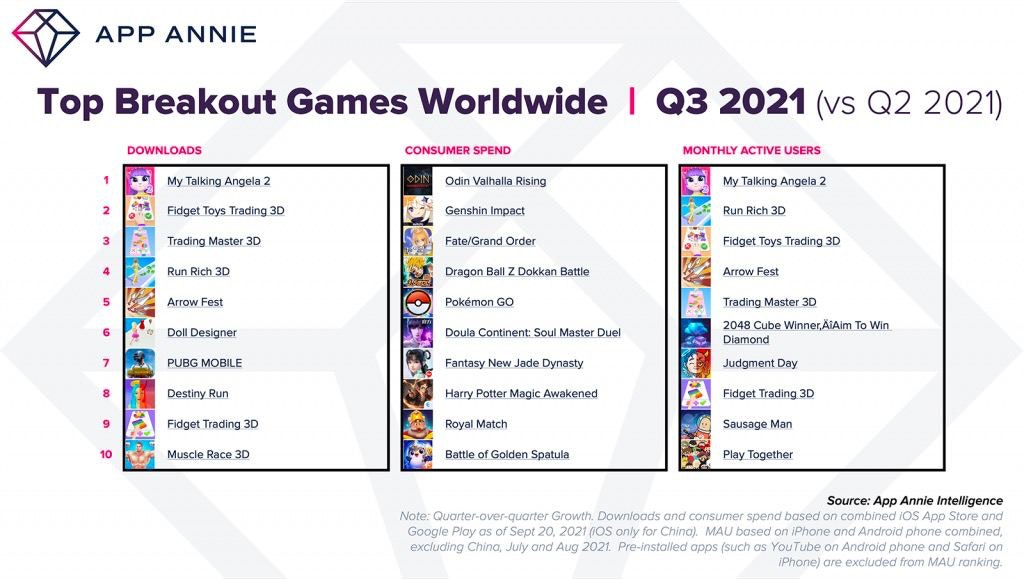
My Talking Angela 2 will become the downloads leader; ROBLOX - the Revenue leader; PUBG Mobile - the MAU leader in Q3 2021.
Sensor Tower: Apps User Engagement Report
-
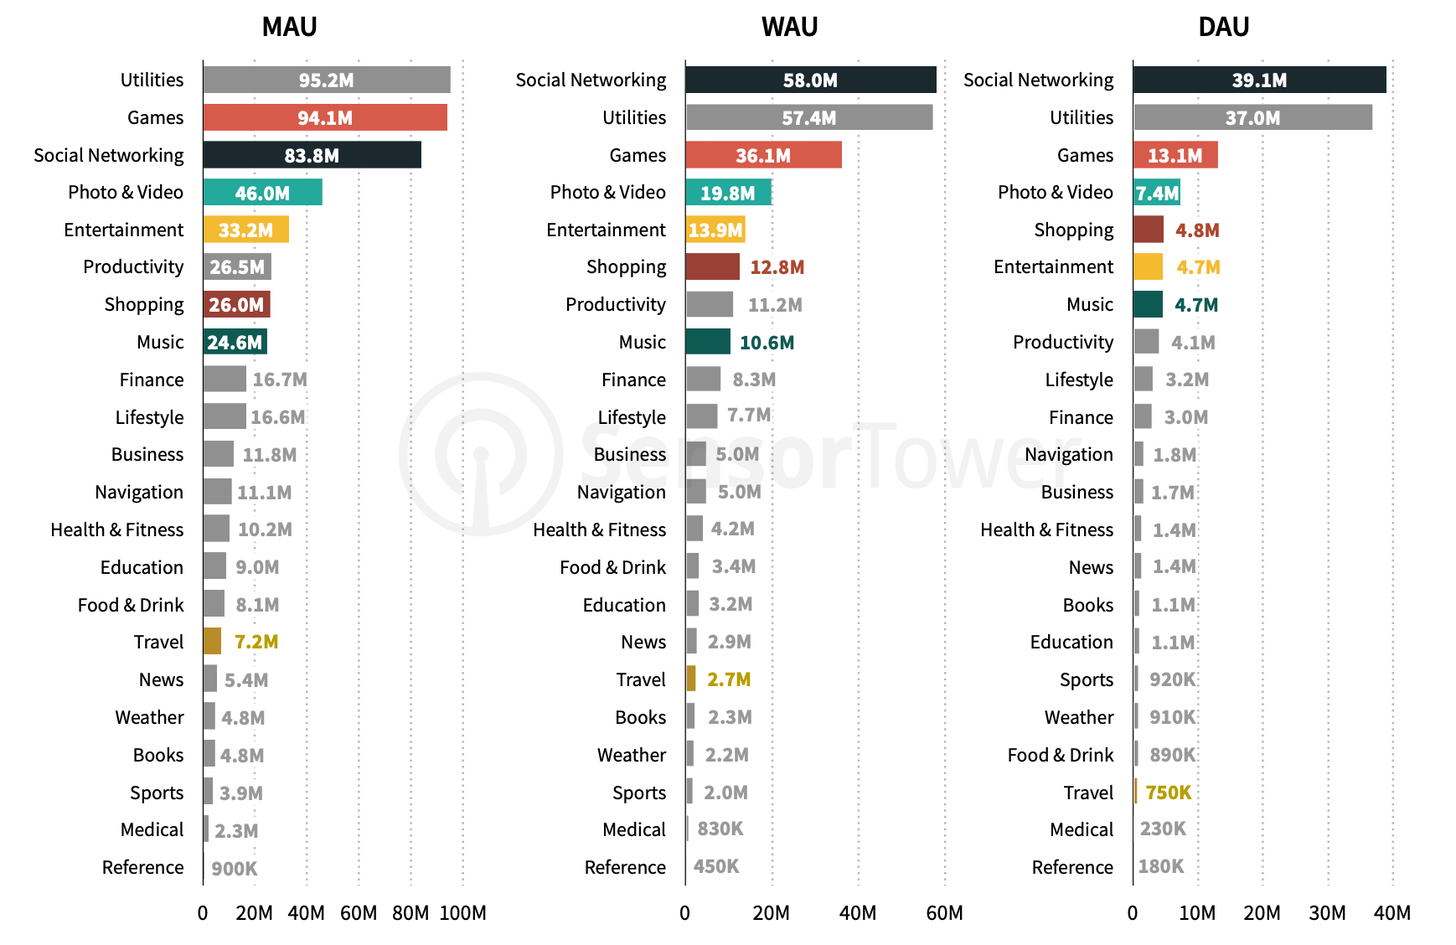
Games are in top-3 by DAU (13.1M), WAU (36.1M), and MAU (83,8M) among the top-100 apps in each category. They’re losing to social networks and utilities only.
-
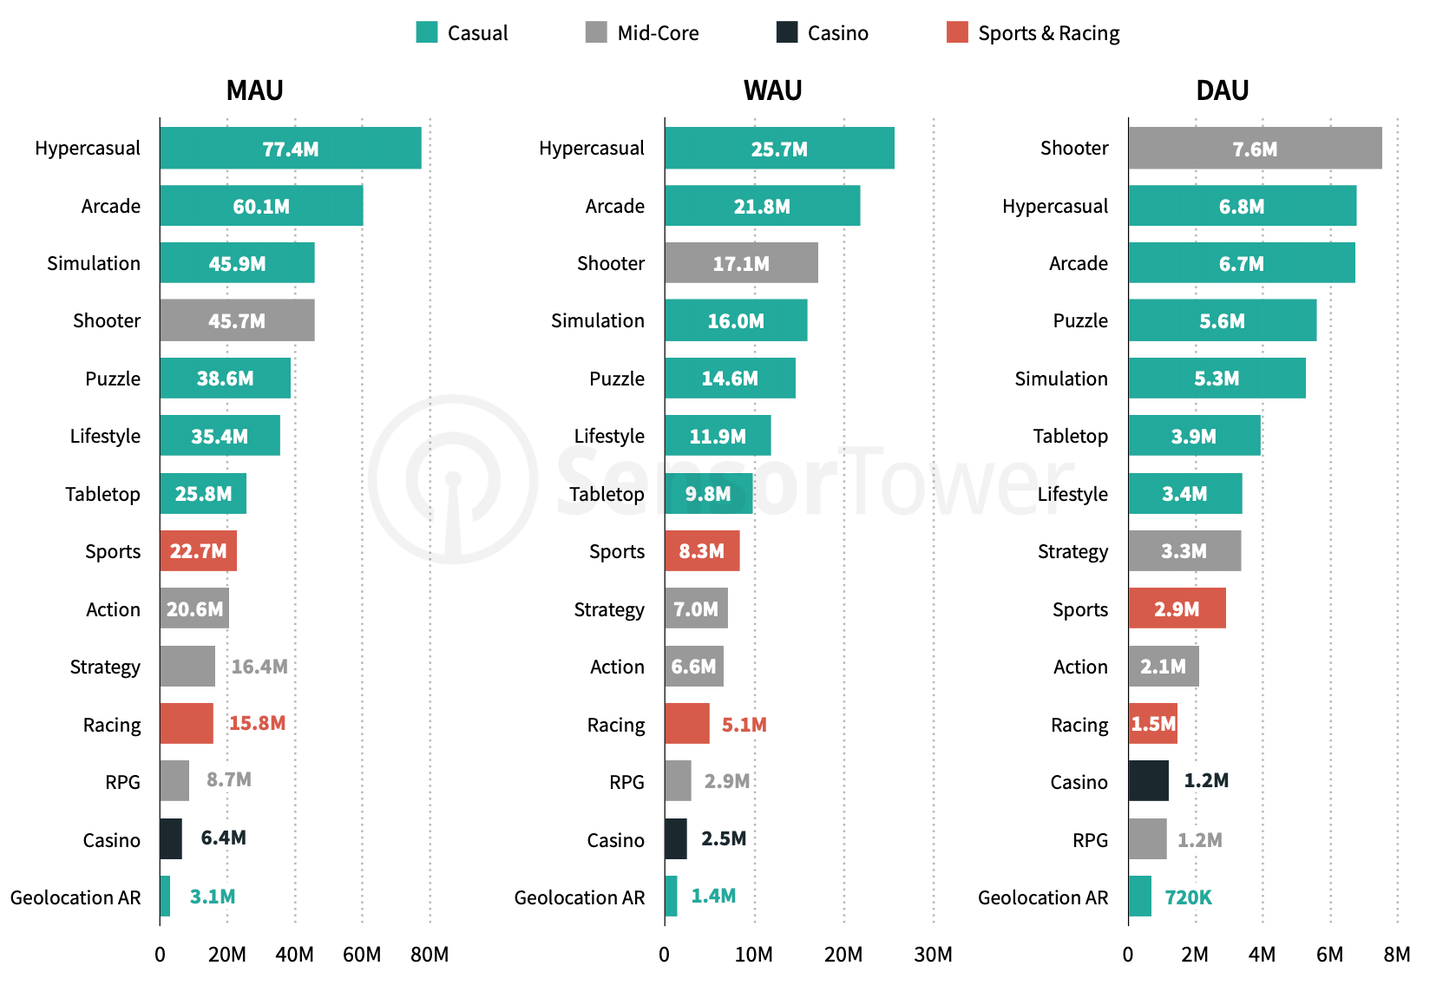
Hypercasual Games are on top by WAU (25.7M) and MAU (77.4). But Shooters surprisingly are showing better results by MAU (7.6M).
-
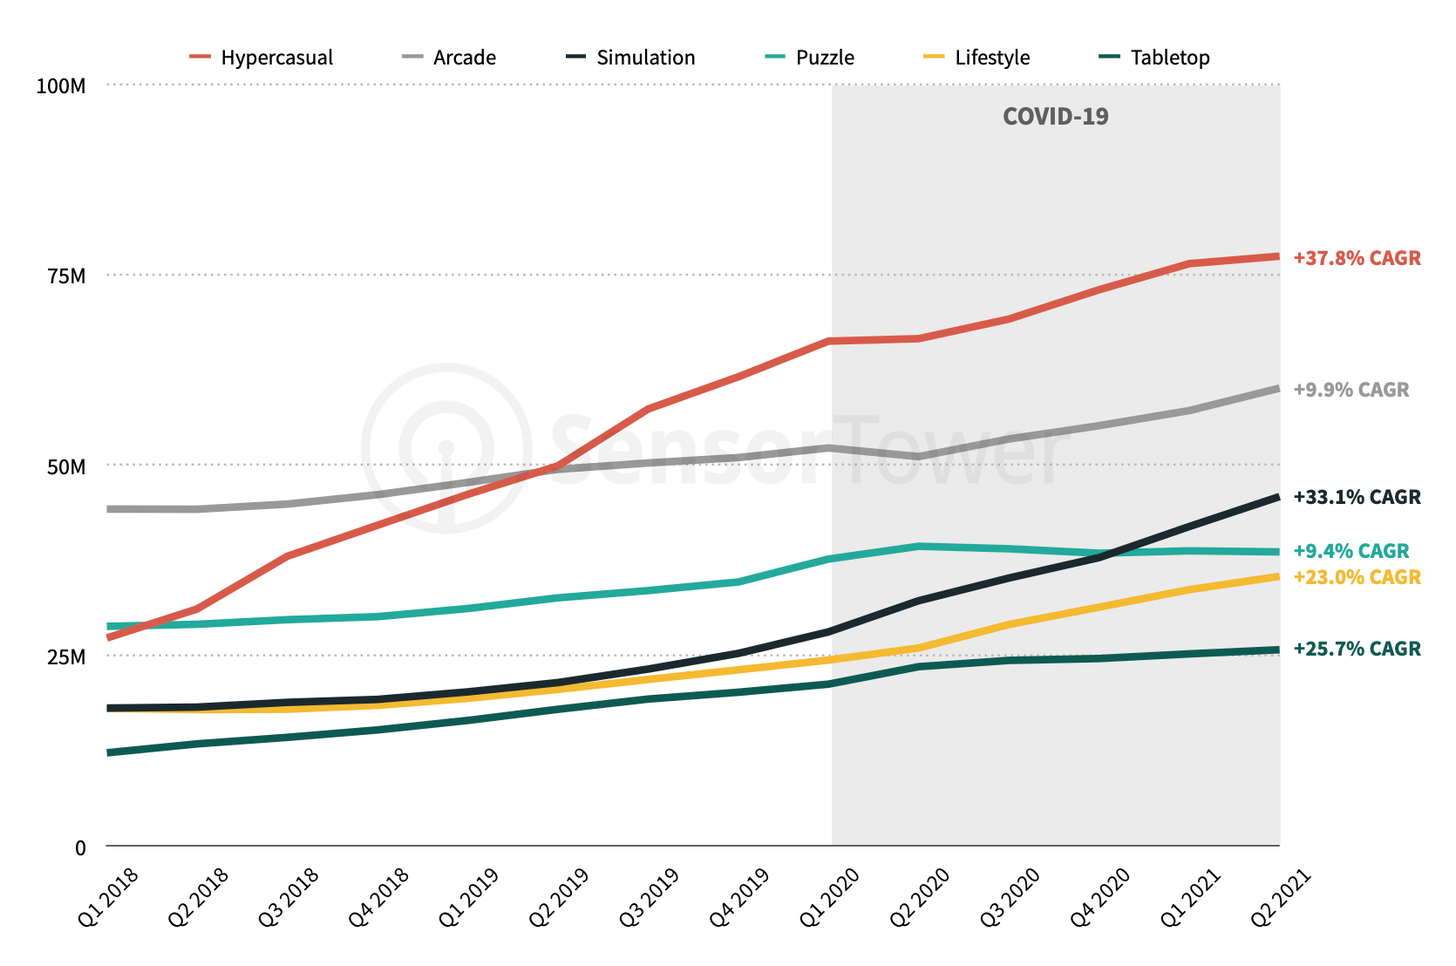
Hypercasual Games are showing a CAGR of MAU of 37.8% since 2018. Simulation genre (+33.1%) and Tabletop (+25.7%) are following.
-
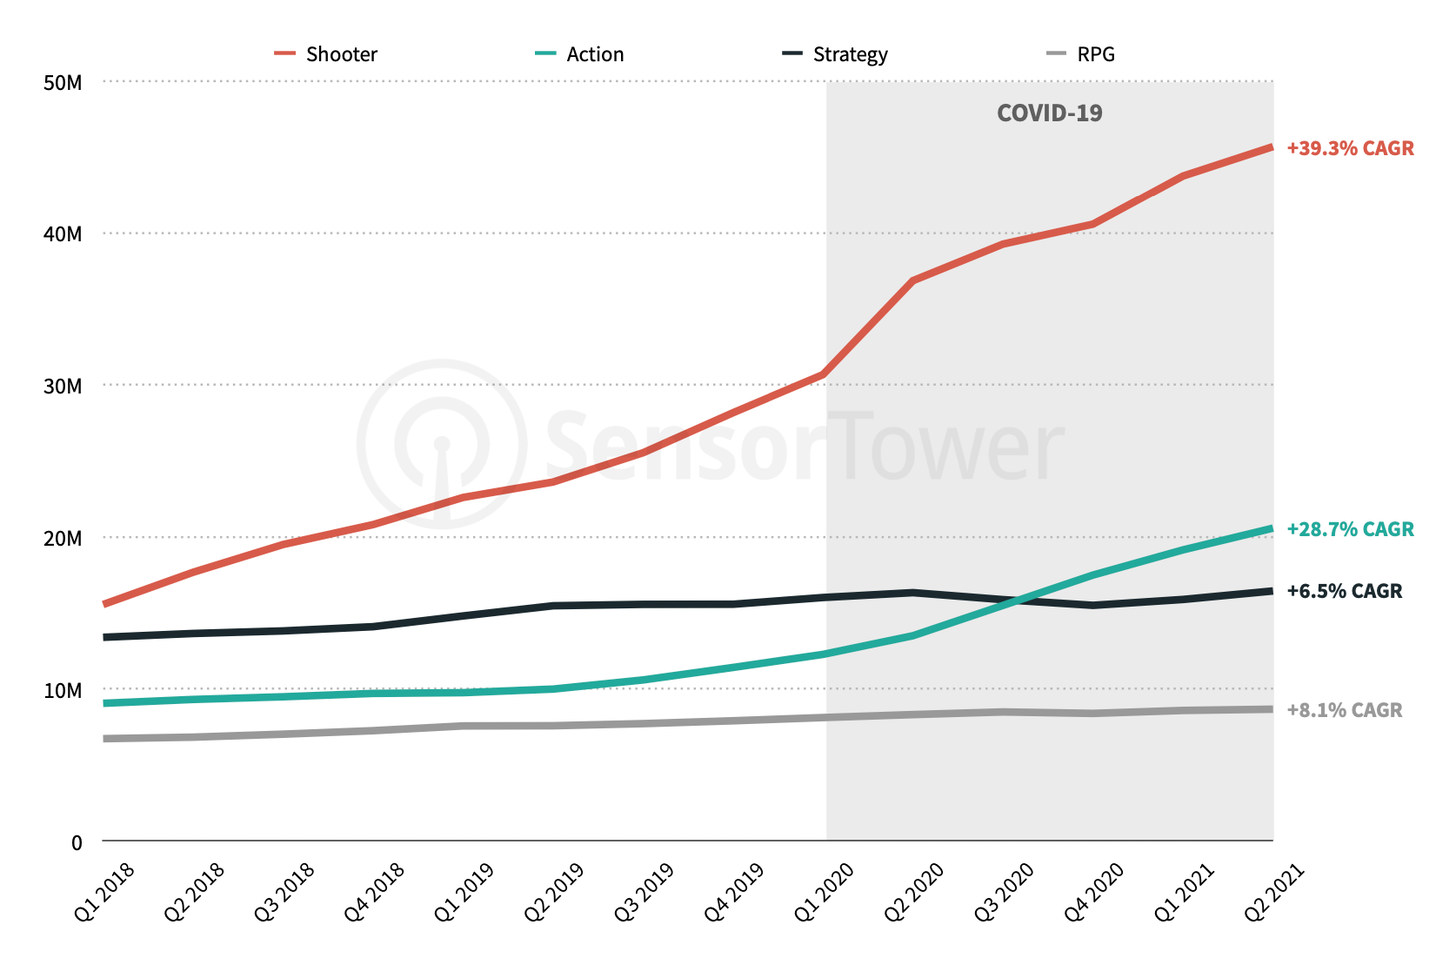
In mid-core genres, shooters are showing the highest CAGR of MAU - 39.3% since 2018. Action genre showing nice results too with a 28.7% CAGR.
-
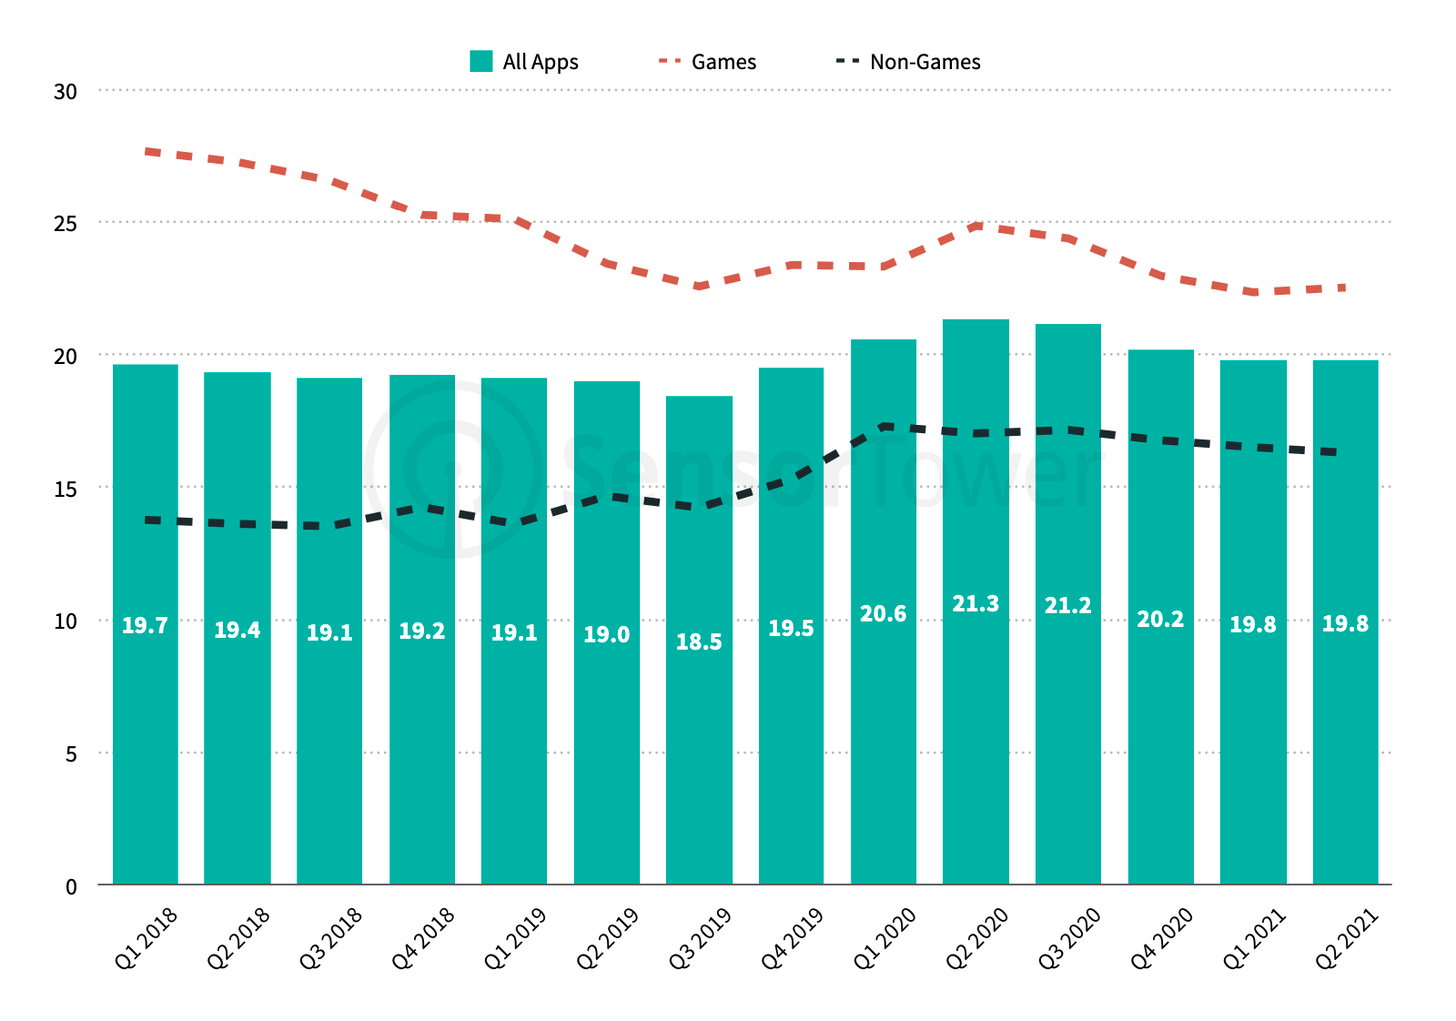
On average, users are spending more time in games, than in other apps. In Q2 2021, the average time spent in games was 23 minutes, while in other apps - 17 minutes.
-
Users are spending in games about 22 minutes (in top-100 games).
-
The games category is the most popular by time spent (20 minutes) on Android.
-
In Strategy and RPG games, users are spending, on average, 62 and 57 minutes relatively.
-
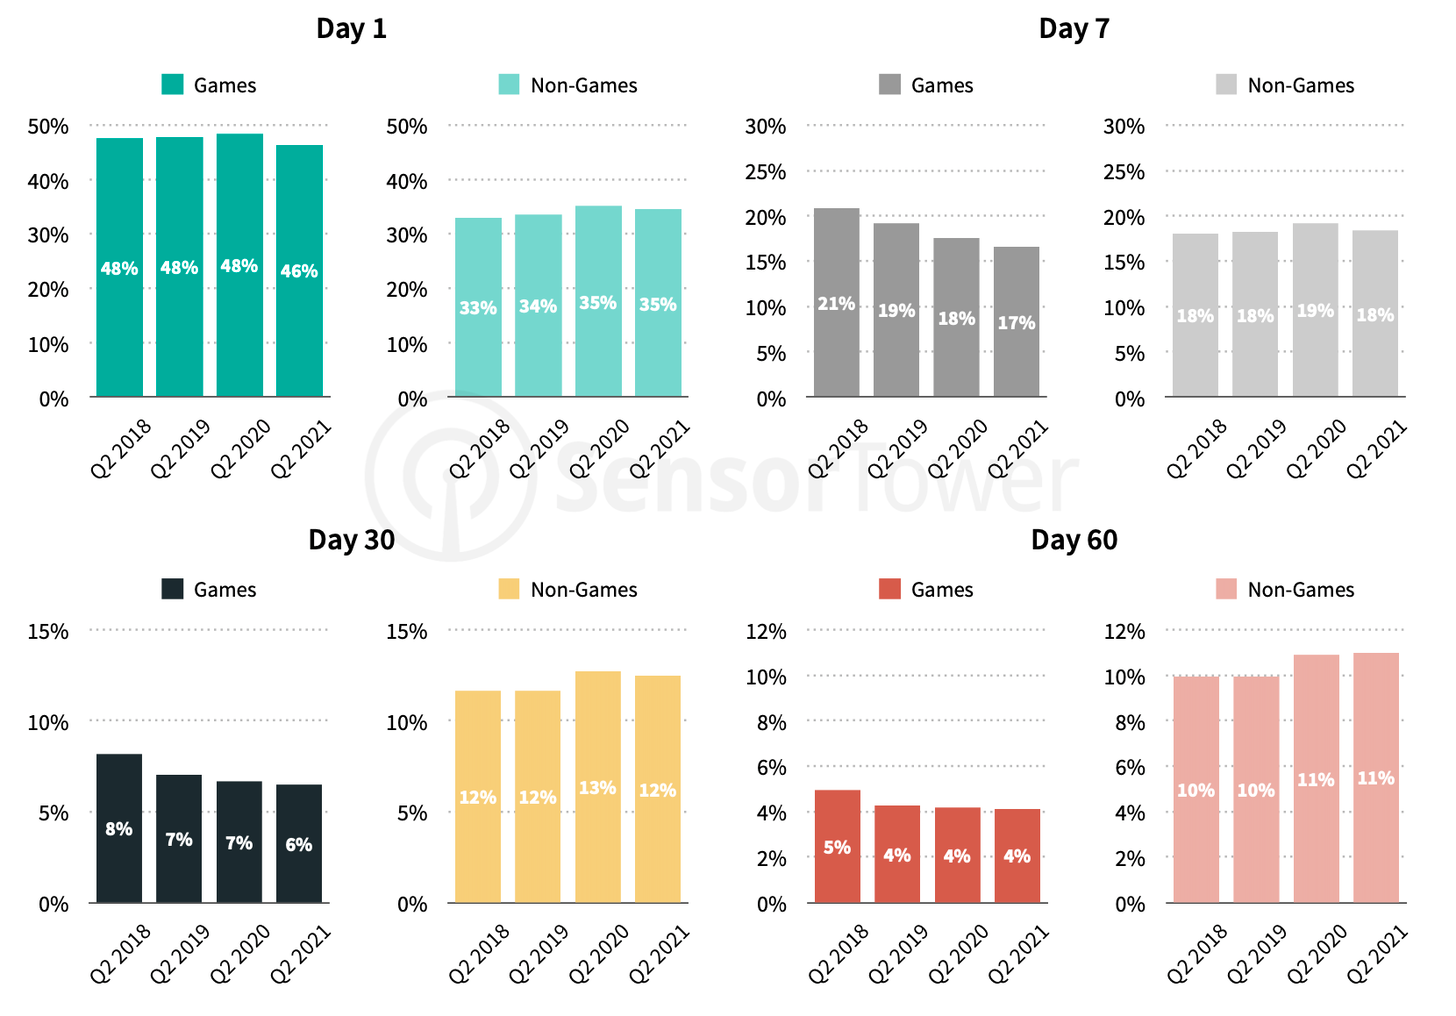
In Q2 2021 average Retention in top-500 games are following: D1 - 46%; D7 - 17%; D30 - 6%; D60 - 4%. It’s important to notice, that long-term retention in games is much lower than in other apps.
App Annie: LATAM Mobile Market Report
-
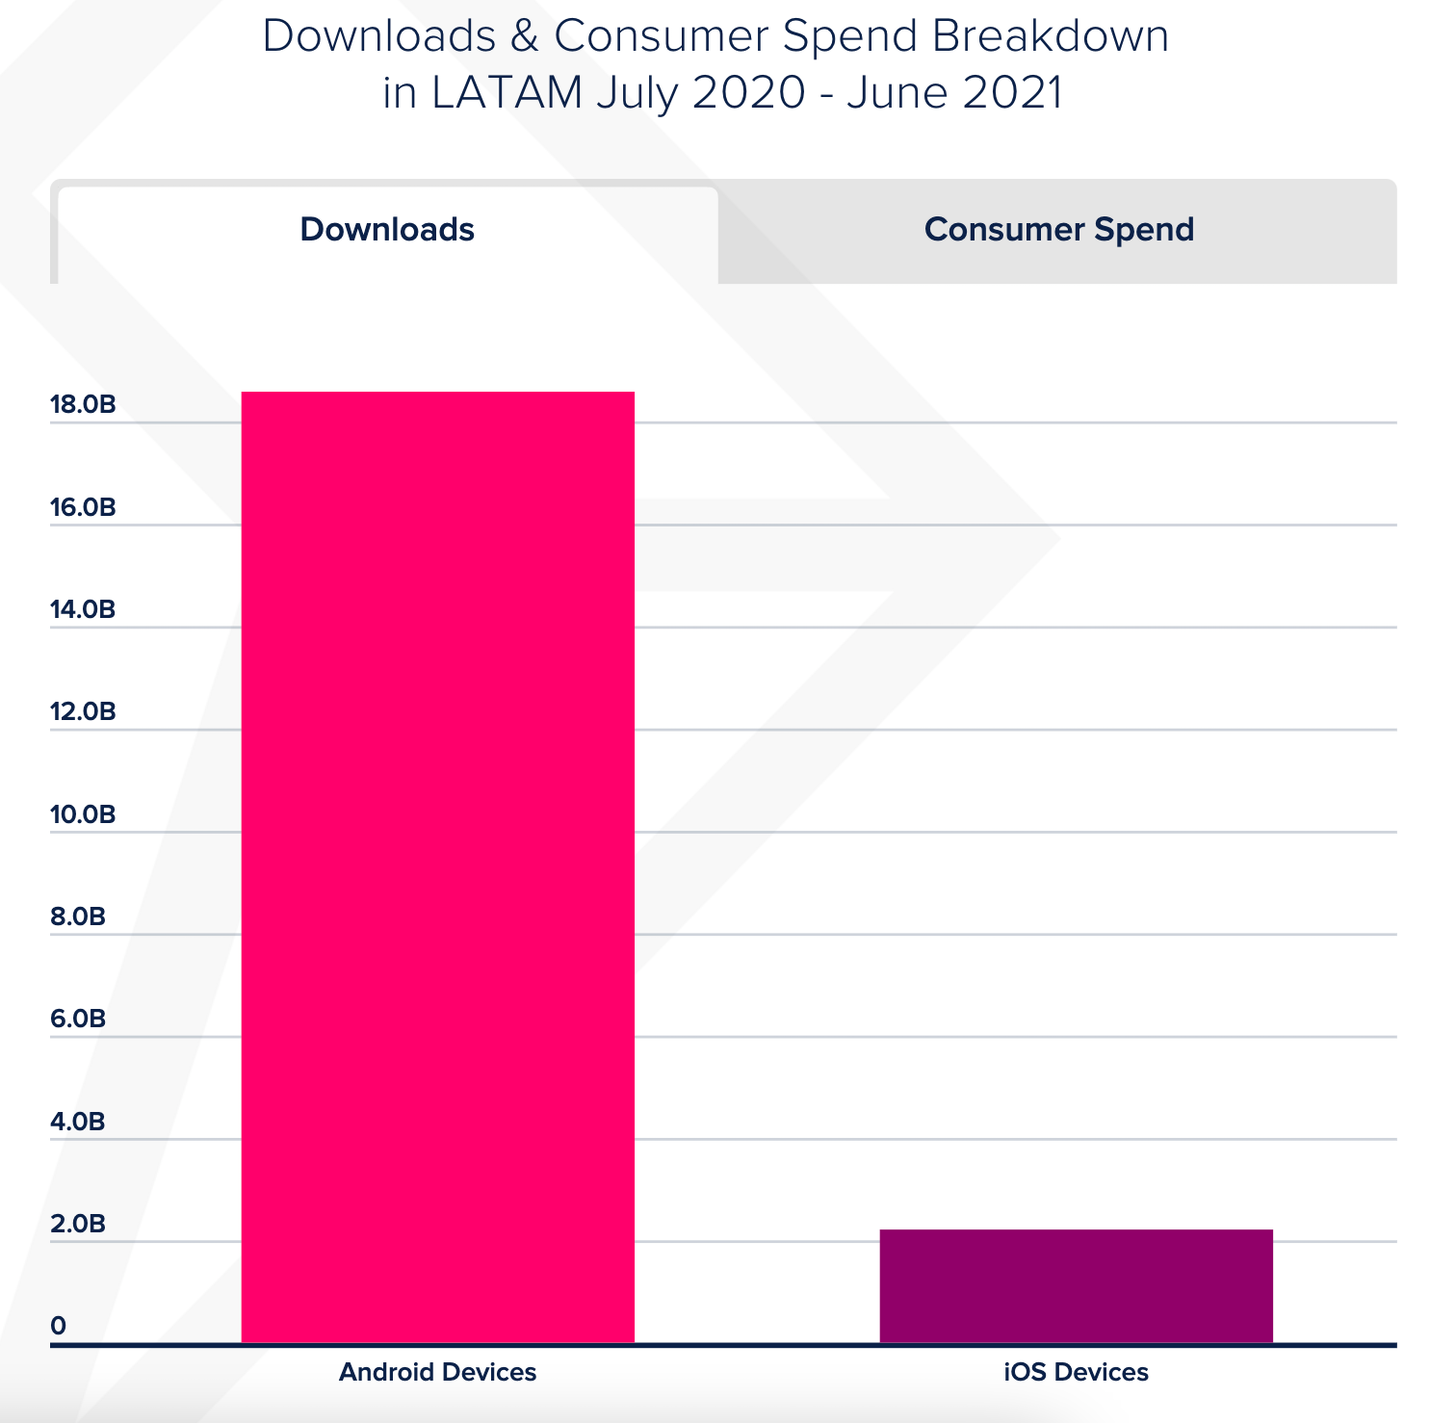
89% of region downloads belong to Android. However, iOS is still leading in terms of revenue. From July 2020 to June 2021 users have spent $1.62B in App Store and $1.27B in Google Play.
-
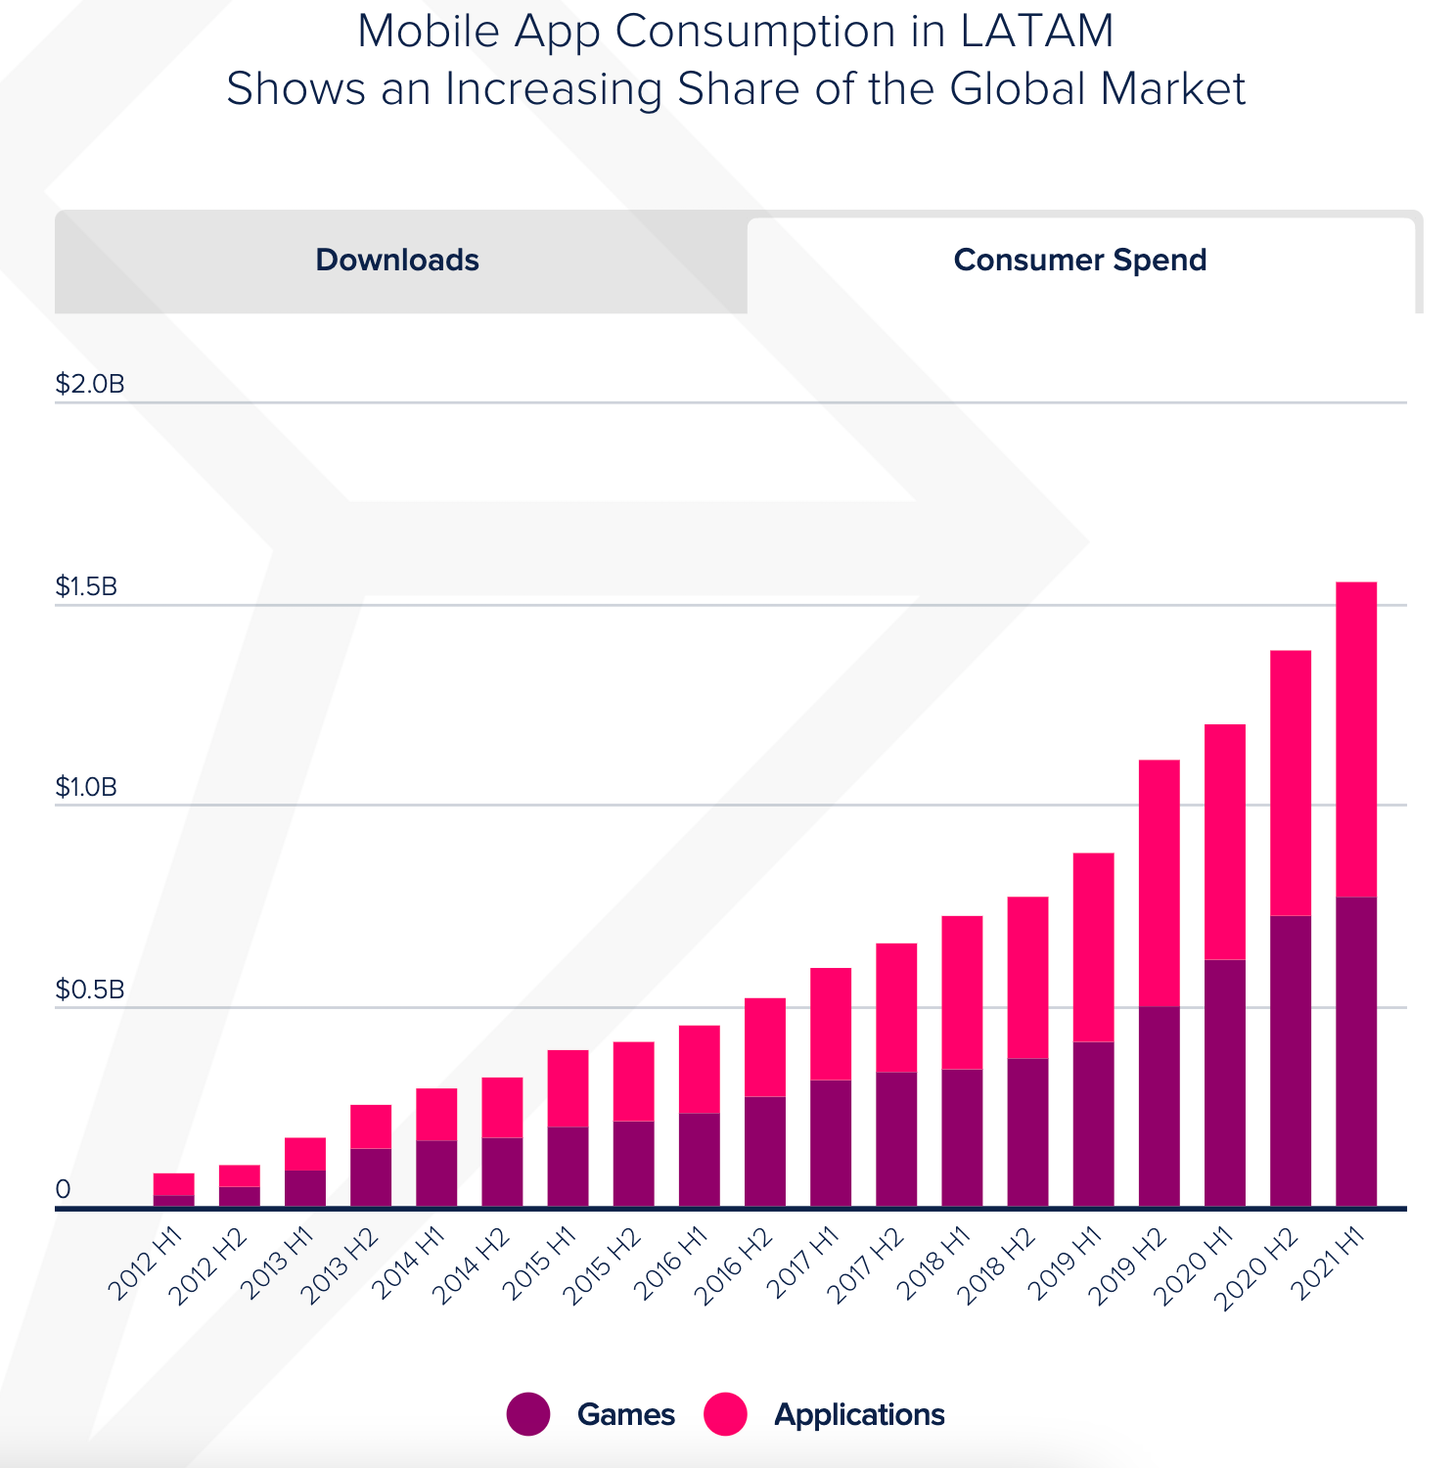
From H1 2019 the gaming market in the region grew by 87% - from $0.41B to $0.77 in H1 2021.
-
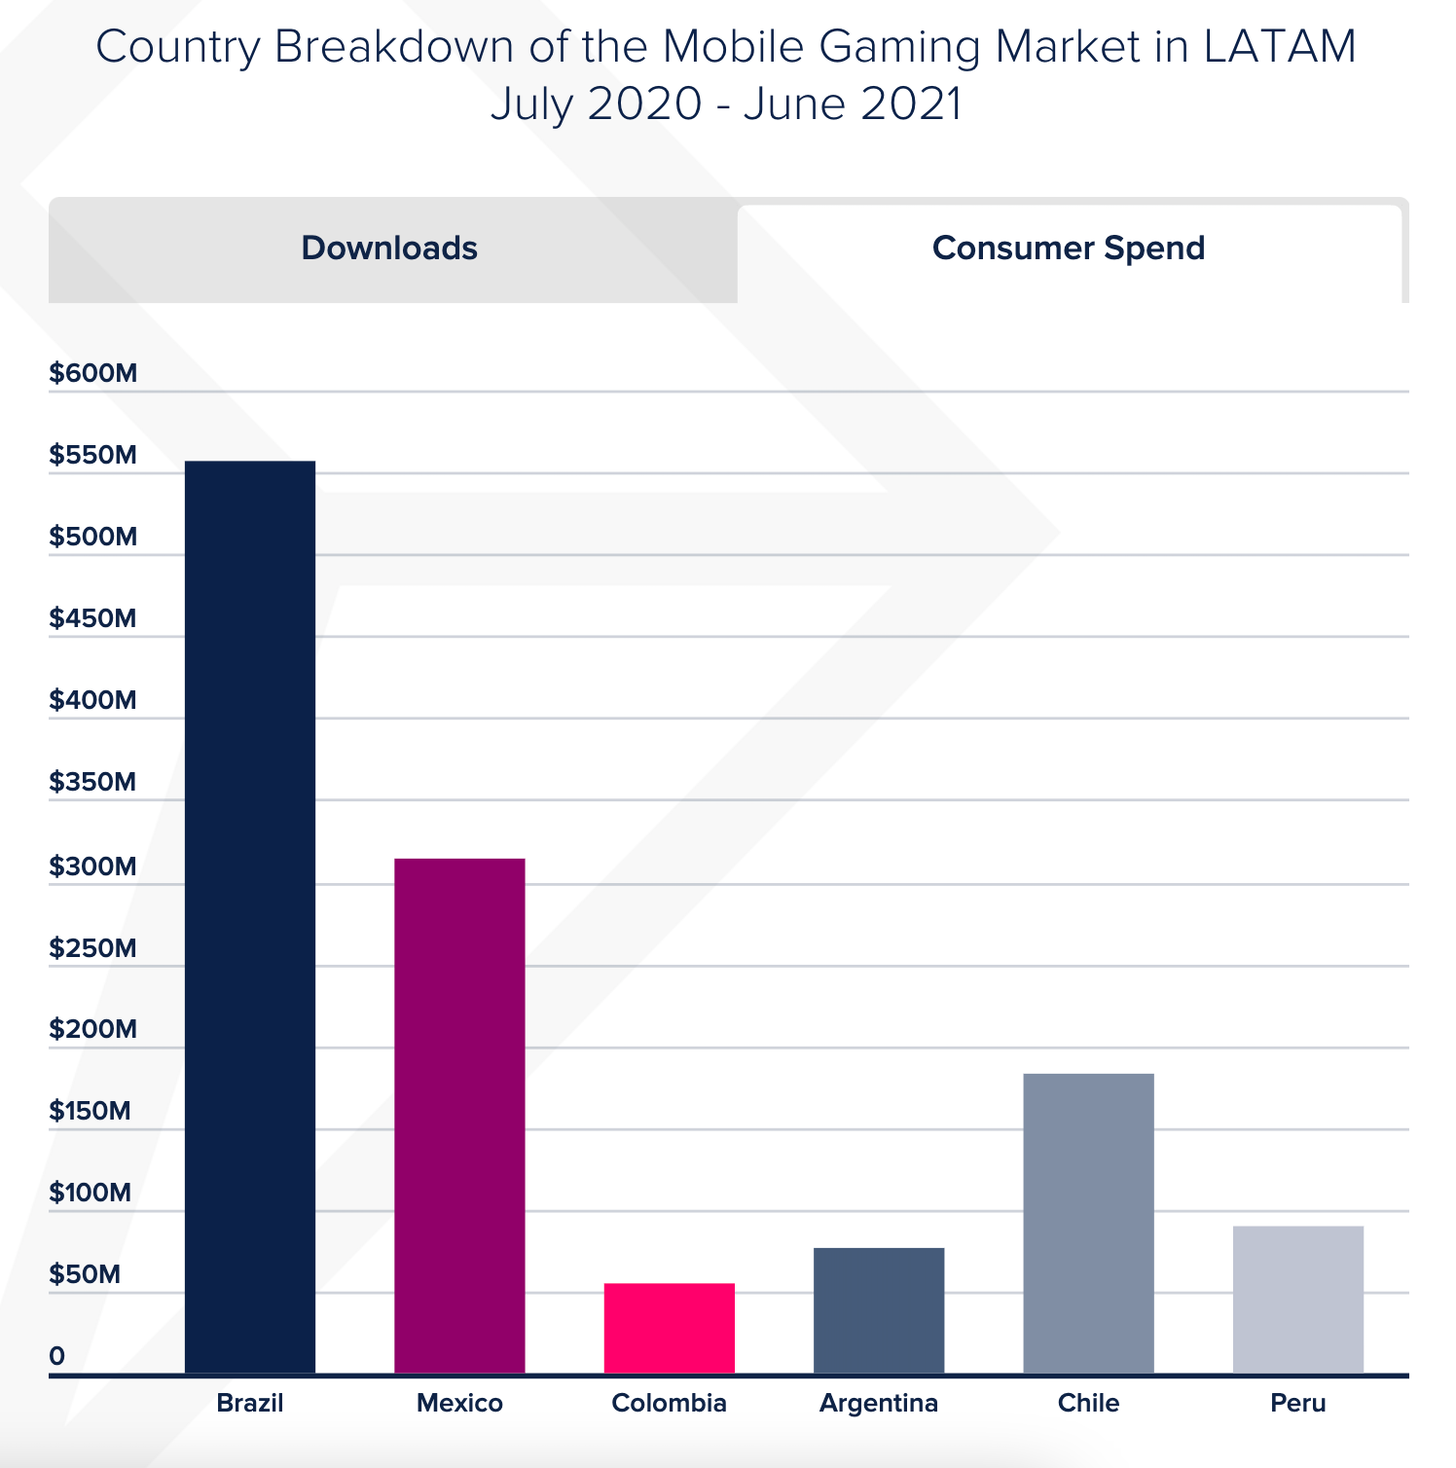
Brazil is the core market of Latin America. From July 2020 to June 2021 it has generated $555M of revenue and about 5B downloads.
-
From July 2020 to June 2021, the LATAM market resulted in $1.46B of revenue and 9.42B of downloads.
-
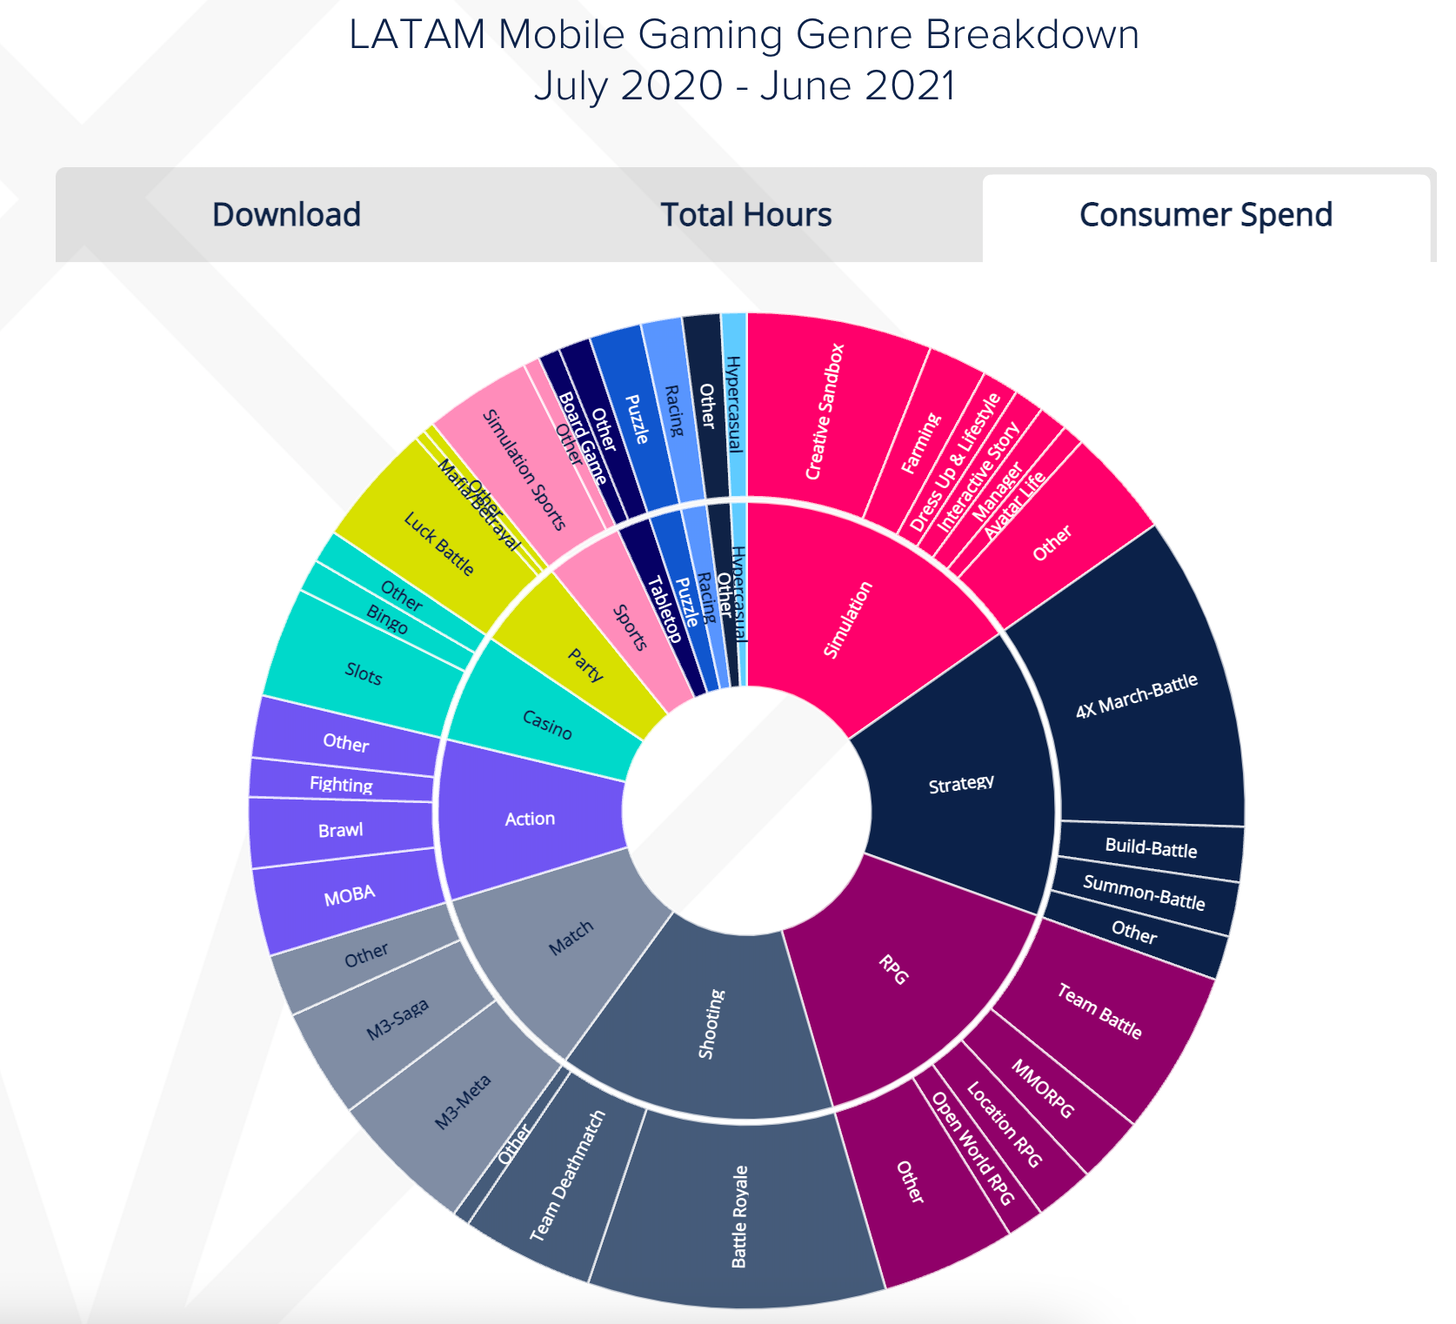
Simulation, Strategy, RPG, and Shooters are core genres, they’re responsible for 60% of revenue. However, only 25% of downloads are coming from titles of mentioned genres.
AppMagic: Top-10 Games in Argentina by Downloads and Revenue in H1 2021
Revenue
-
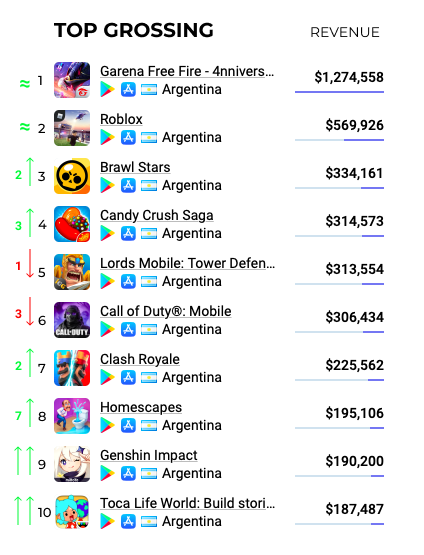
Ten top-grossing titles generated $3.91M per half a year.
-
Garena Free Fire and Roblox are leaders. Cumulatively they’ve earned $1.8M during the H1 2021.
-
Genshin Impact doubled its revenue from H2 2020. Currently, it’s about $190k.
Downloads
-
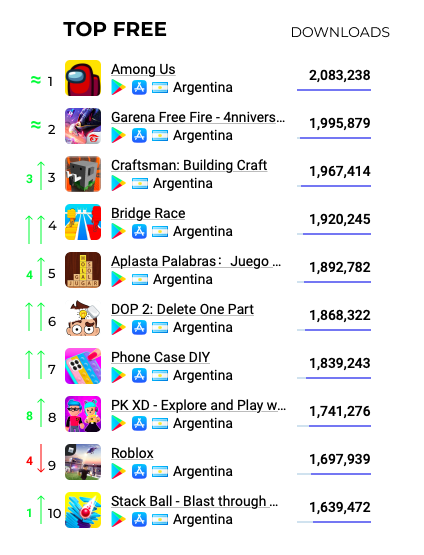
Among Us and Garena Free Fire are the most popular titles in Argentina. They’re responsible for 4M of downloads out of 18.64M of the top-10 games.
-
Argentinian players like Strategy, Shooters, and Racing genres.
App Magic: Pokemon UNITE earned $1.7M in 5 days after release

-
The game also received 5M downloads in 5 days. On September 26 the game was downloaded 2.8M times.
-
By downloads pace, the game is outrunning hypercasual titles and social networks. Which is rare for mid-core titles.
App Annie: Candy Crush Jelly Saga reached $500M Revenue
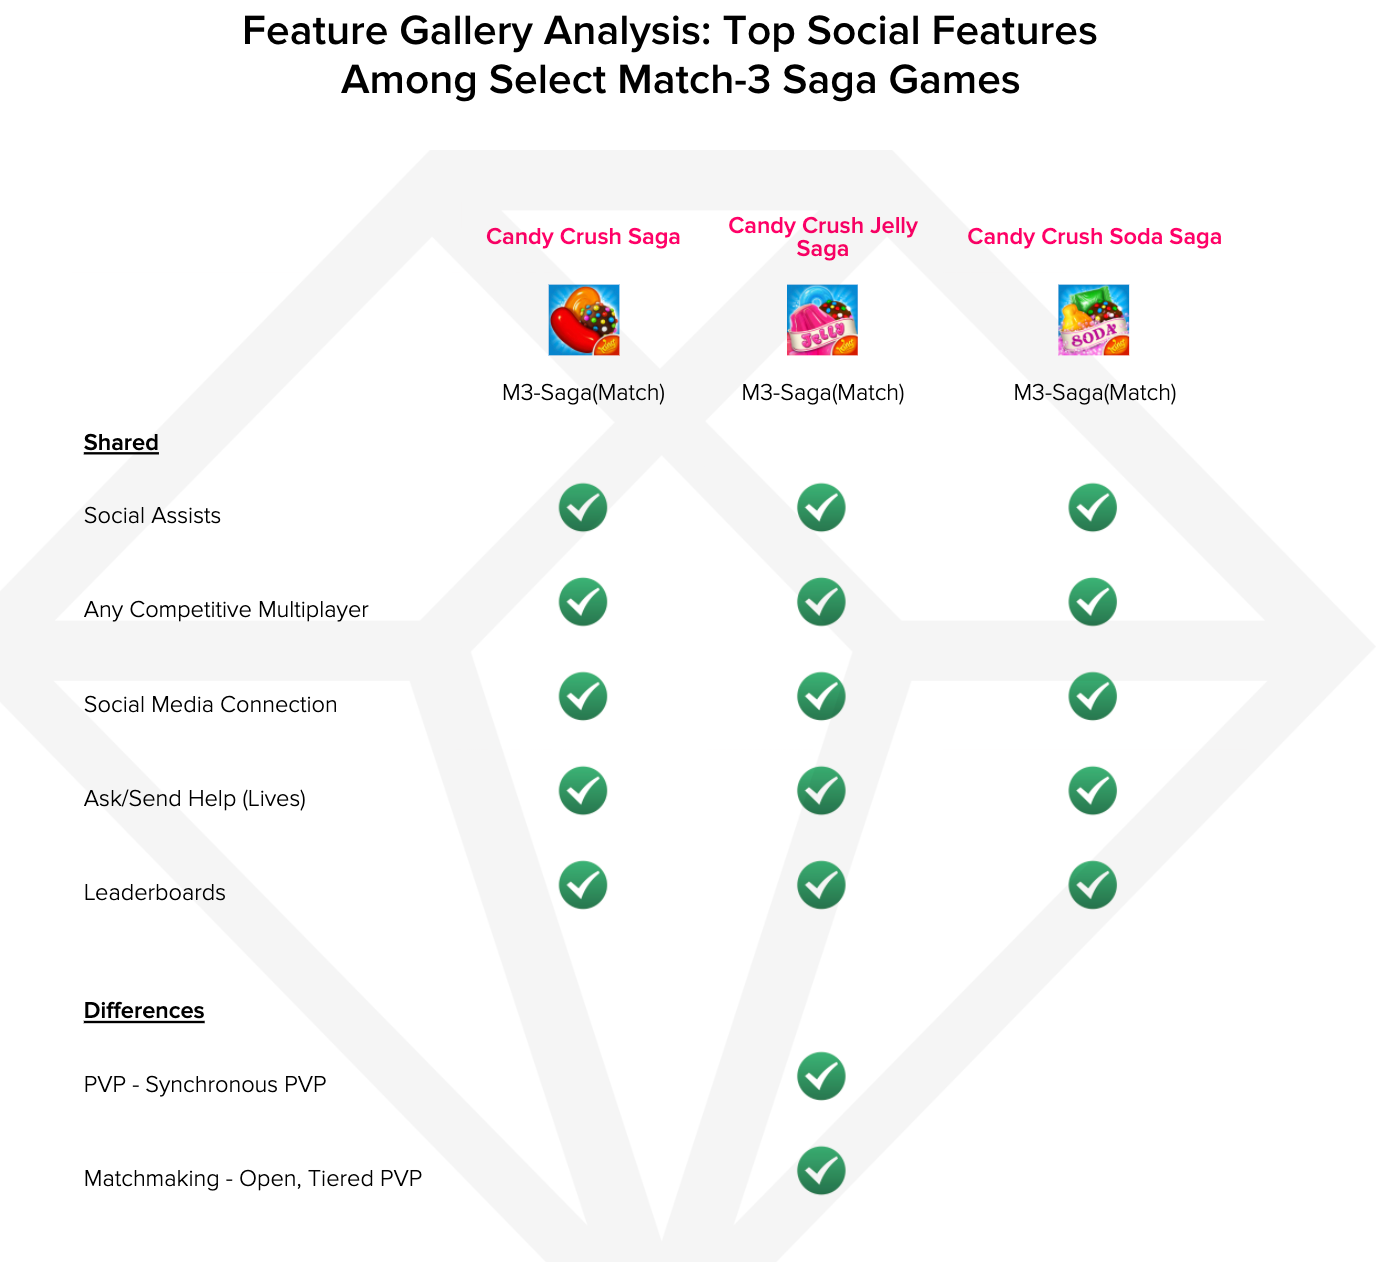
-
It took 6 years to reach this milestone.
-
The best countries in terms of revenue for the project are the US, the UK, Japan, Germany, and France.
Sensor Tower: Top Mobile Publishers in Various Genres from 1 January to 31 August 2021
Puzzles:
-
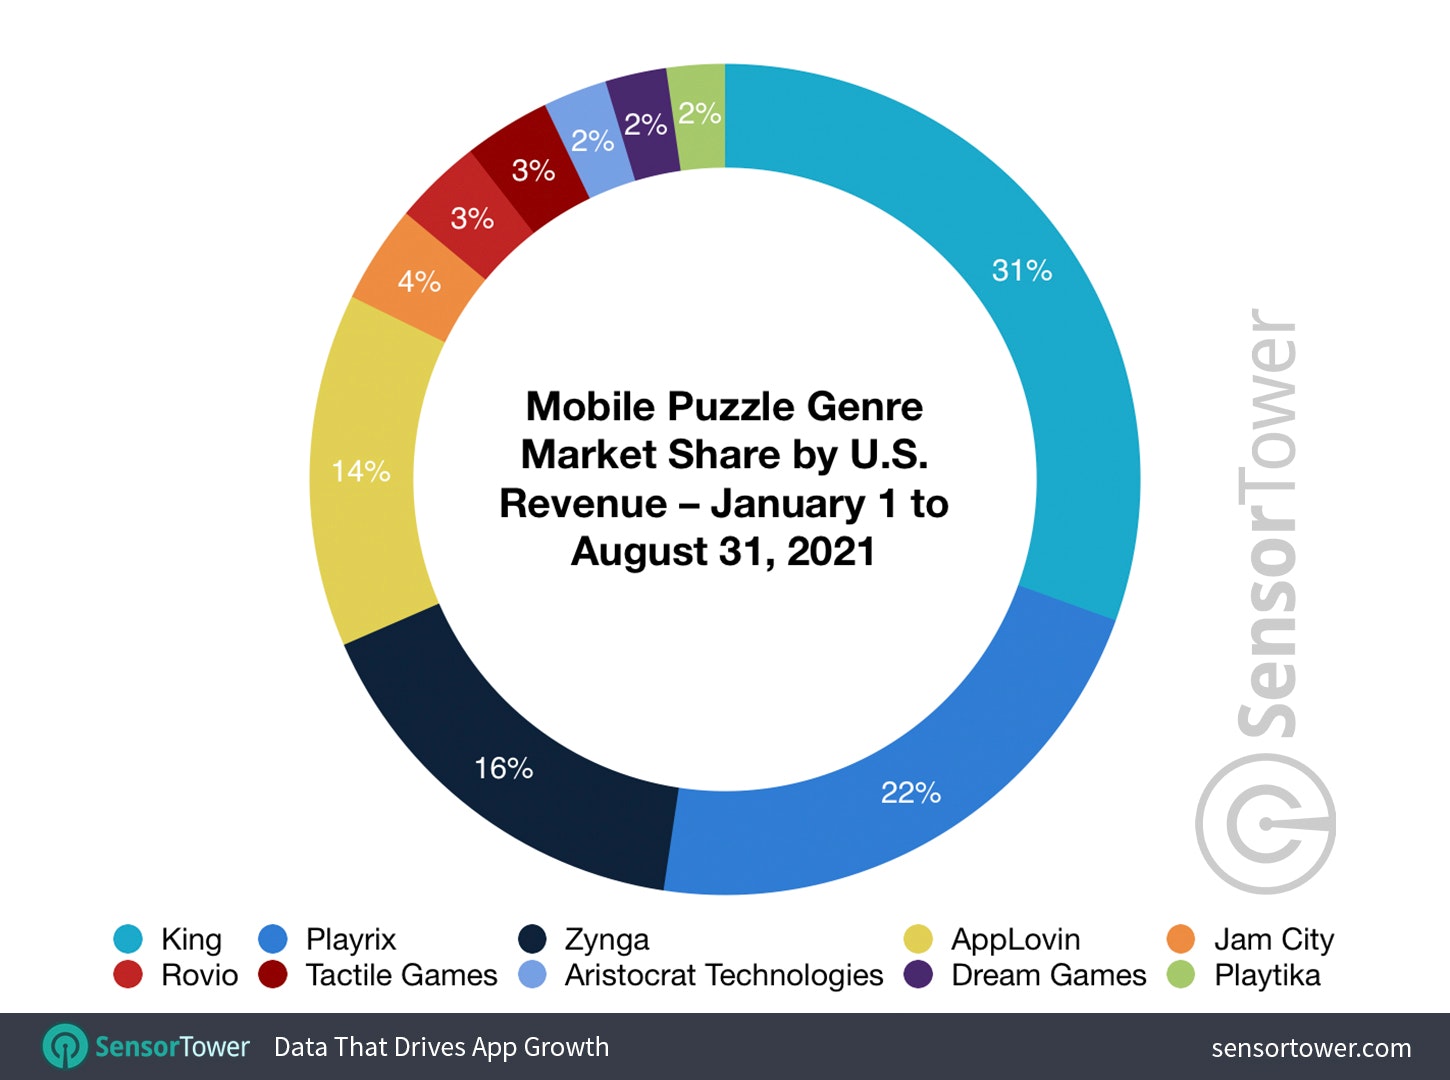
Activision Blizzard, which has King in the structure, is responsible for 31% of overall genre revenue - it’s a solid first place. The company earned $873M in the first eight months of 2021.
-
Second place belongs to Playrix with $625M of revenue and 22% of the market.
-
Zynga increased its presence in the genre sufficiently with the M&A deals. Its earnings resulted in $394M.
Lifestyle Games:
-
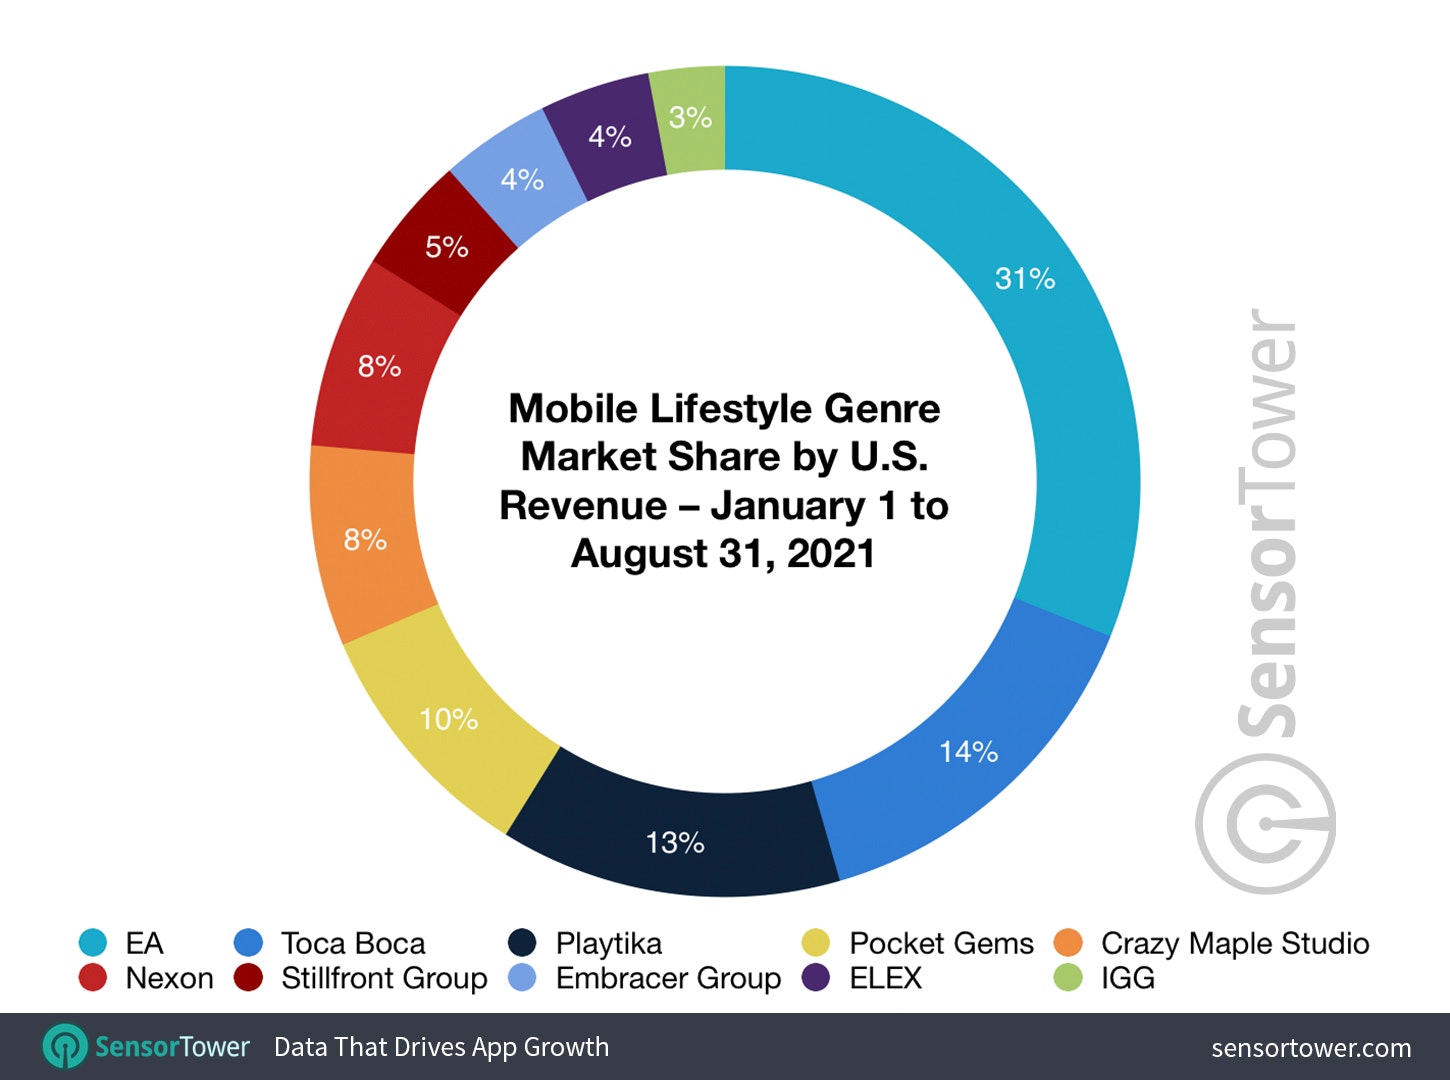
EA won the race here, earned $123M. Glu Mobile acquisition helped with it.
-
Playtika received third place with $53M of revenue. It won’t be possible without the M&A deal with Reworks.
Sports Games:
-
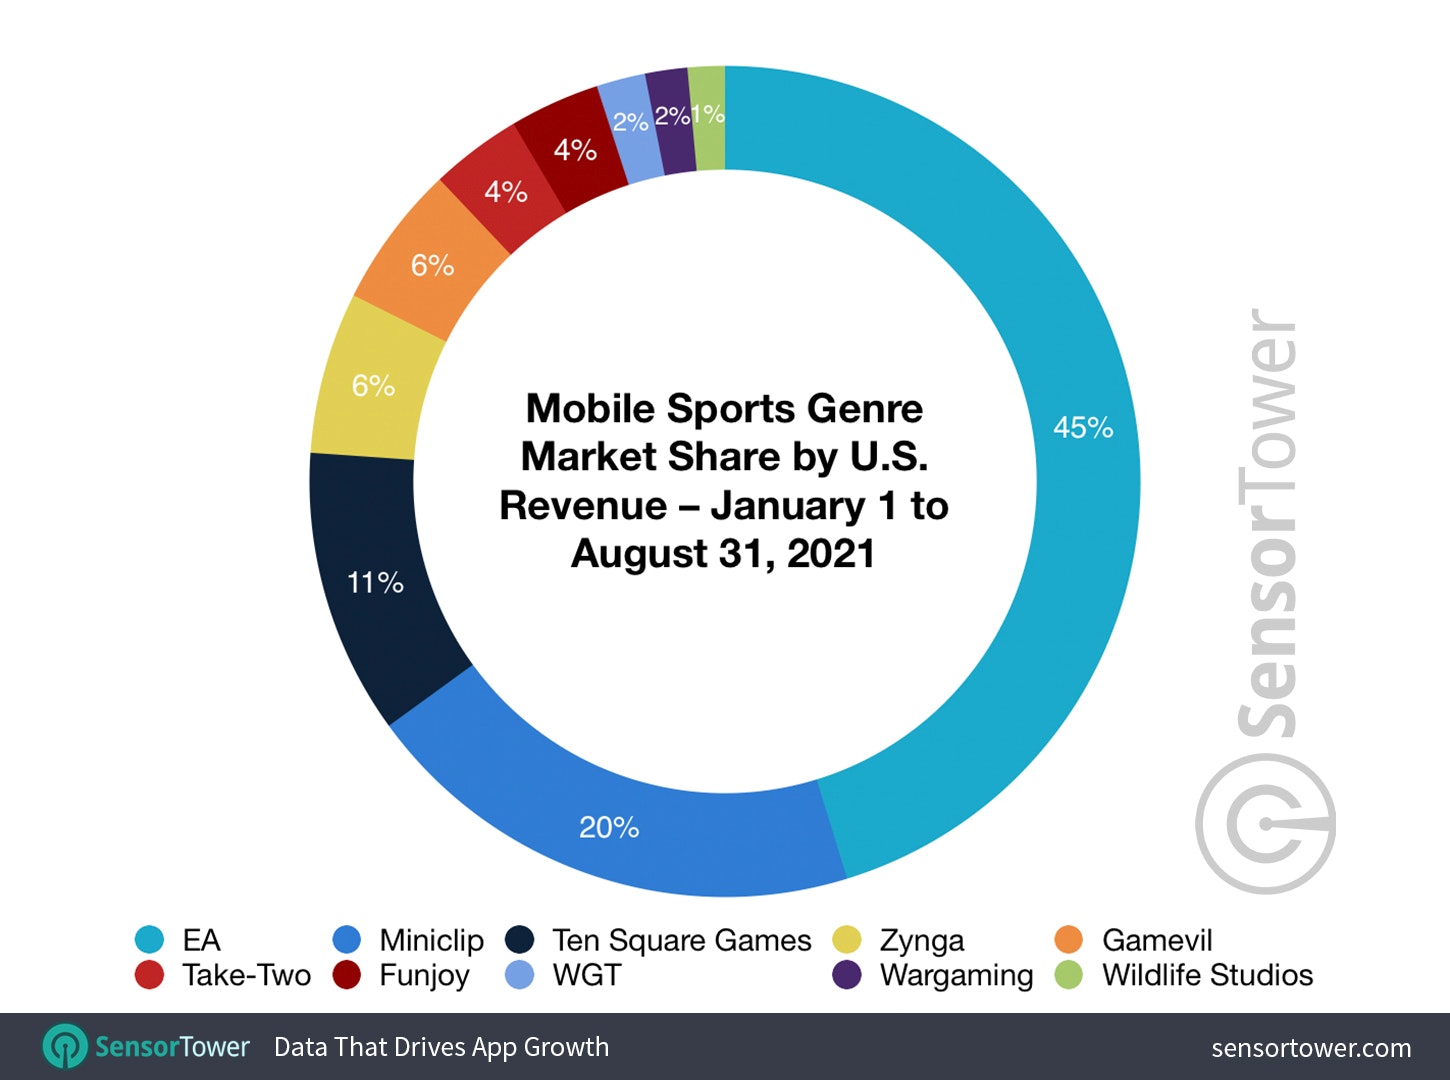
EA is first here too with $176M of revenue in the first 8 months. Playdemic acquisition played the role here.
-
Miniclip is second - $77M.
Hypercasual Games:
-
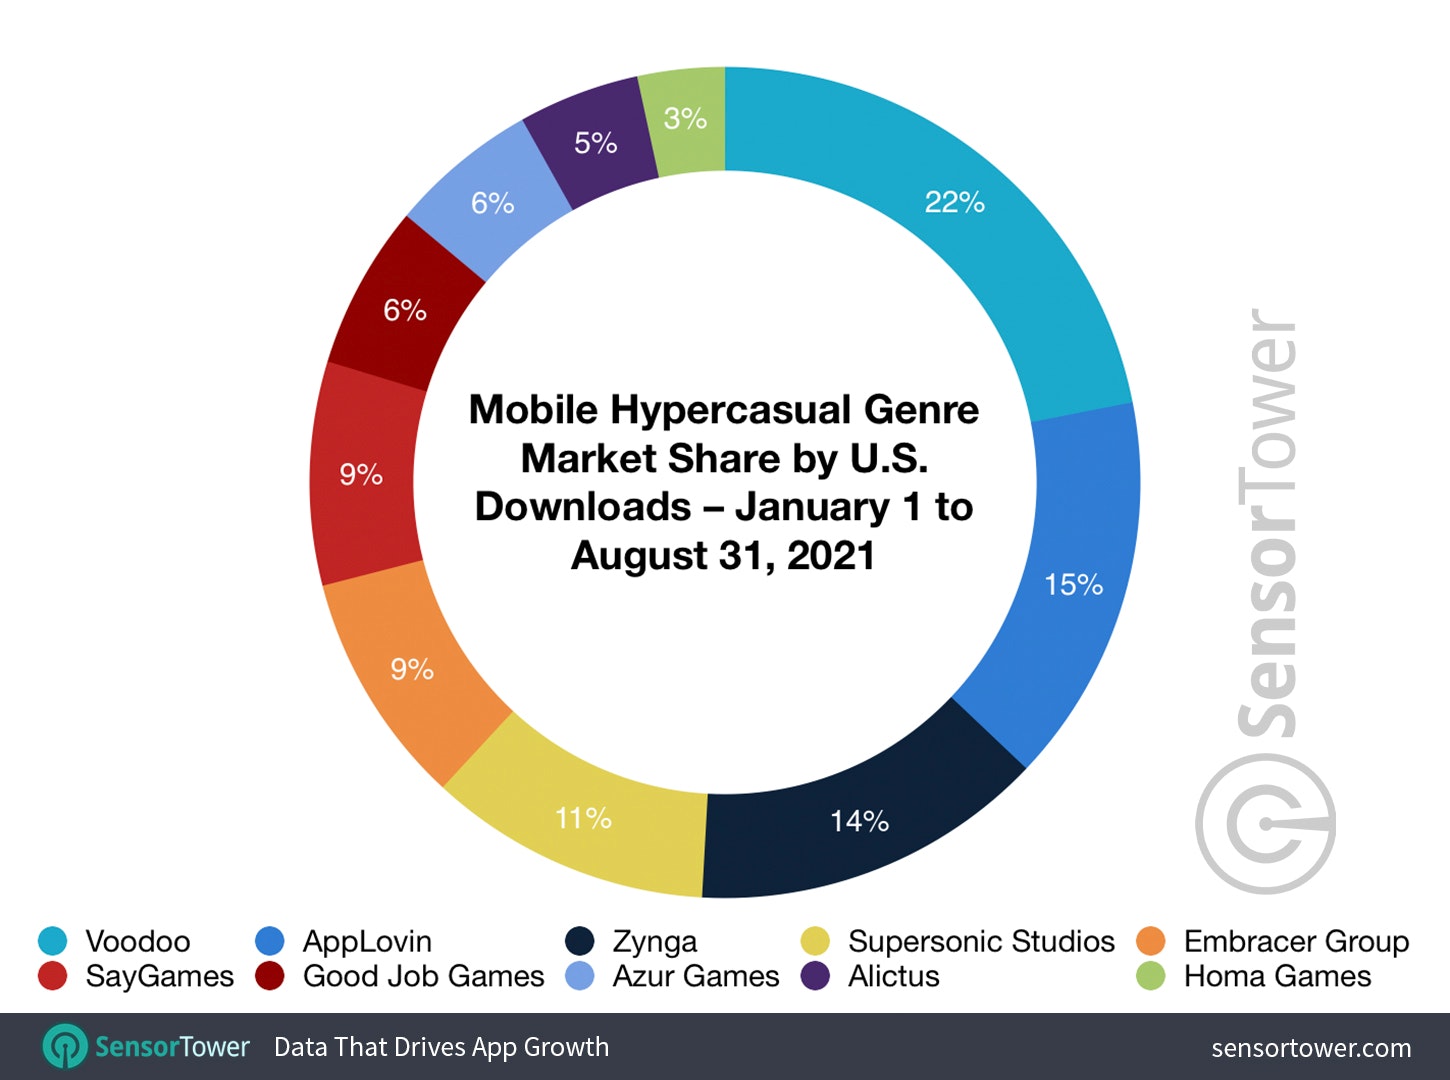
Voodoo is the leader by downloads. In the first 8 months company’s games generated 139M of downloads.
-
AppLovin received 96M downloads in the same period and it’s the second place.
-
The third place belongs to Zynga, which won’t be reachable without Rollic Games acquisition back in October 2020.
-
Embracer Group after the Crazy Labs deal is now holding 9% of the market.
Adjust: Games are responsible for 50% of all UA spending
-
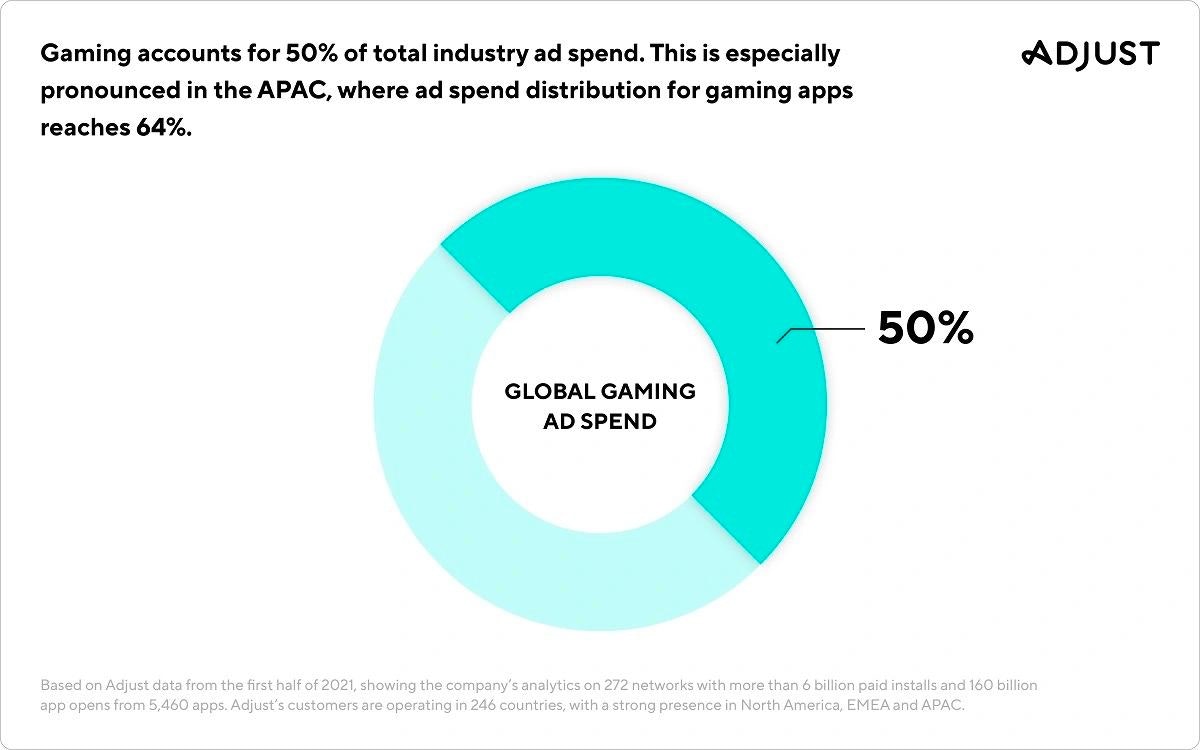
In the APAC region, this number is jumping to 64%. In the US game spendings are responsible for 57% of the overall amount. in Europe, Middle East, and Africa the UA spendings on games are about 39%.
-
On average, one install on iOS costs $3.86. Facebook user price is $1.02, while the user from Google Ads costs $0.91. Attribution from AppLovin, ironSource, and Mintegral costs $0.58, $0.39, and $0.19 respectively.
-
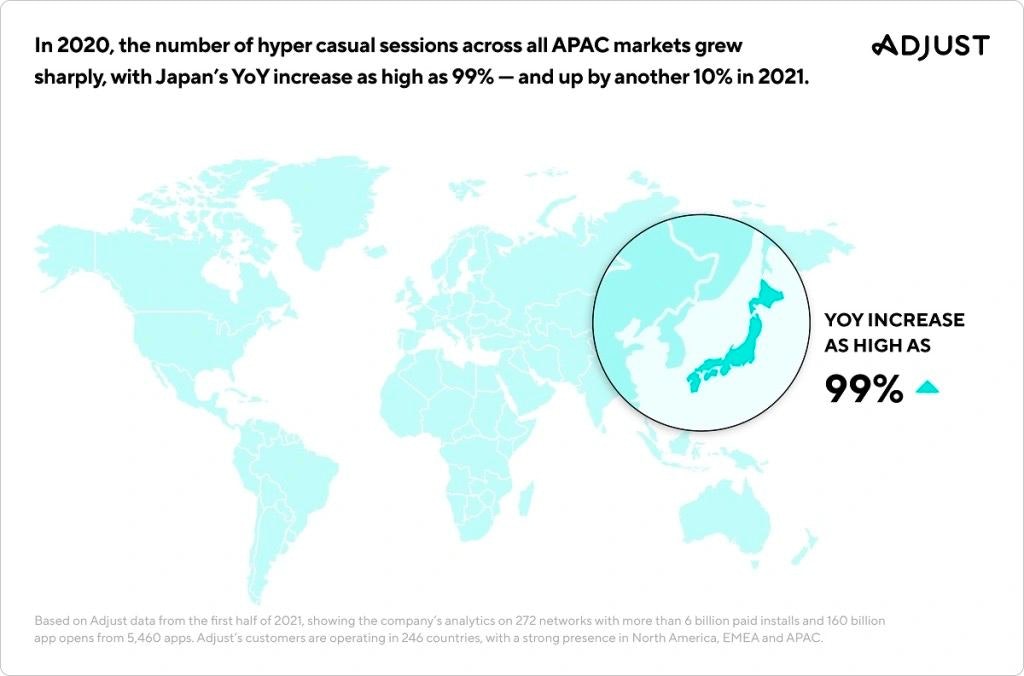
Hypercasual games rose significantly in 2020. Installs increased by 43%, and the number of sessions grew by 36%.
-
In Japan, the number of sessions in HC titles increased by 99% in a year.
-
On average, one user in hypercasual costs $0.25. The most expensive users are from the US - they are priced at $0.55.
Sensor Tower: Genshin Impact earned $2B on Mobile during the first year
-
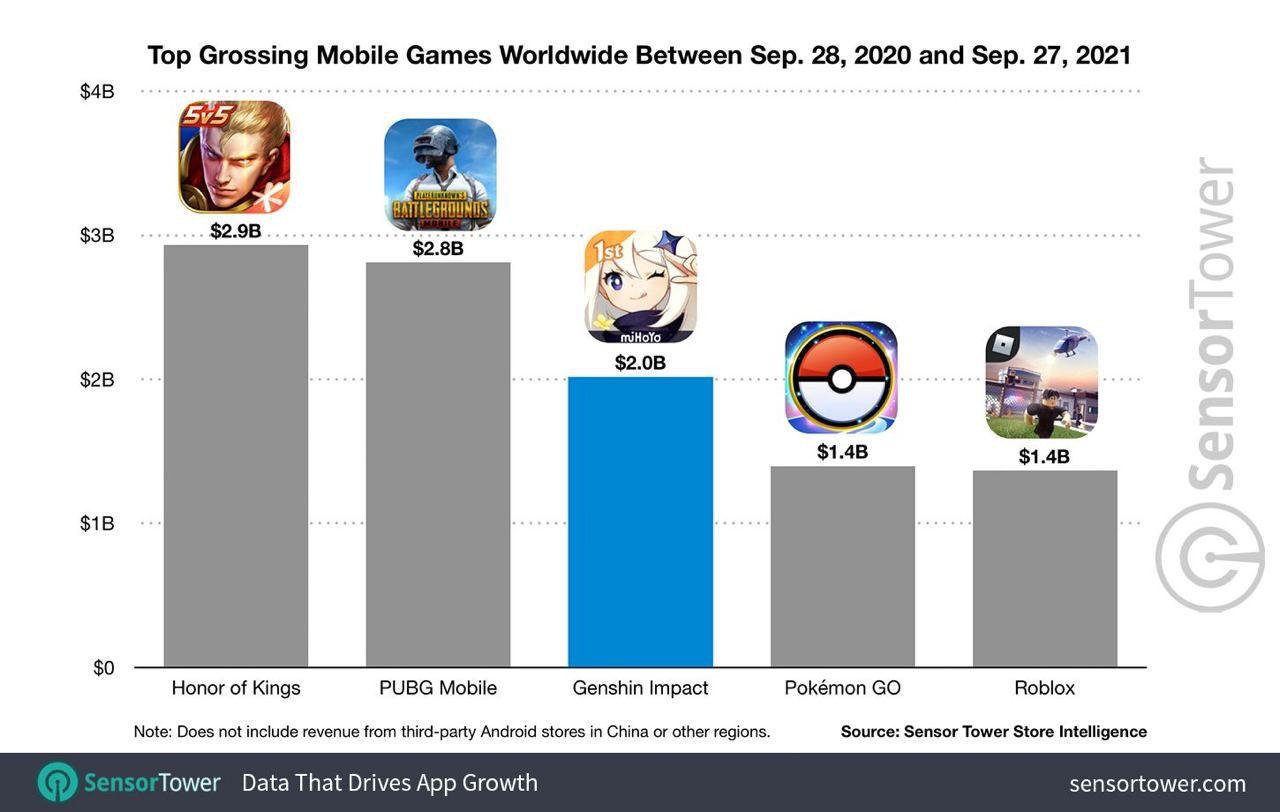
In terms of revenue, Genshin Impact was overpassed only by Honor of Kings ($2.9B), and PUBG Mobile ($2,8B).
-
Genshin Impact is the most successful game launch ever. The game earned its first billion in 6 months. The previous record was held by Pokemon GO, which reached the result in 9 months.
-
China is responsible for 28.6% of all revenue ($577M) - with only iOS counting. Japan is second with 23.7% of revenue, the US is in third place (21% of revenue).
-
App Store is responsible for 61.8% of revenue, while Google Play takes 38.2%. Sensor Tower is not counting Chinese alternative stores. If we cut off China, then the revenue leadership goes over to Google Play - 53.6% versus 46.4% on iOS.
Sensor Tower: Mobile MOBA Landscape in 2021
-
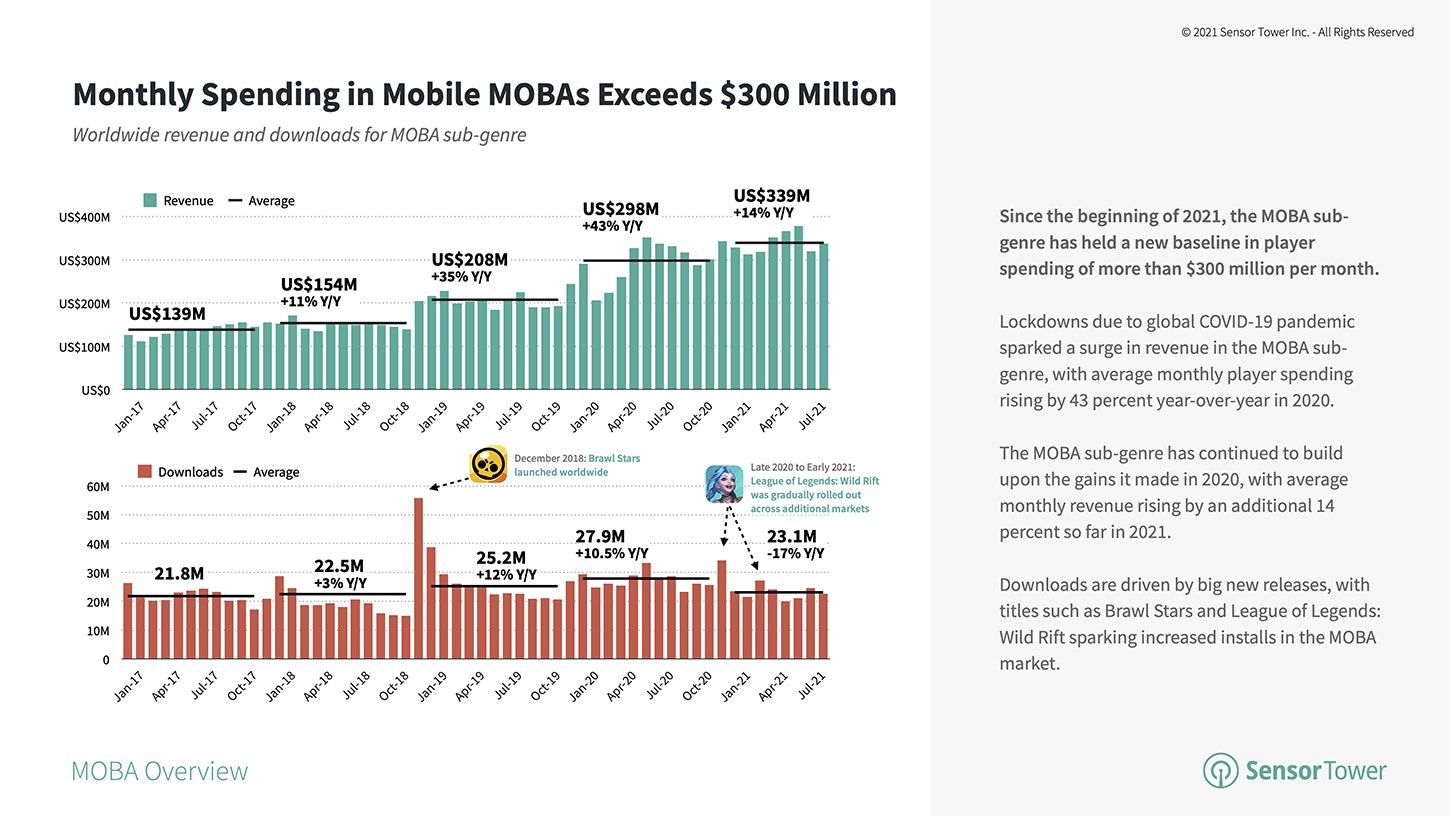
MOBA Sub-Genre is responsible for 23% of users spendings on Strategy Genre. In the first half of this year, MOBA resulted in $2B of revenue.
-
From January to late-August MOBA games were downloaded 208M times - it’s 21% of all Strategy genre downloads.
-
Despite revenue growth (Q1 to Q2 2021 the genre received +14%), downloads decreased by 10% same period.
-
From the beginning of the year, MOBA games are holding the +$300M revenue per month plank.
-
Asia is responsible for 84% of genre revenue; Europe - for 9%; North America - for 5%.
-
The most successful MOBA titles now are Honor of Kings ($10B); Brawl Stars ($320M), and Mobile Legends: Bang Bang.
