Devtodev is helping you keep in touch with what’s happening in the game market. Every month we publish an overview of reports on the most popular games worldwide, top-grossing games, successful releases, favorite video game types, trends, etc. This overview is prepared by Dmitriy Byshonkov - the author of the GameDev Reports by devtodev Telegram channel. You can read the March and April reports.
Contents
- InvestGame: Gaming Investment Market in Q1’24
- SJN Insights: Analysis of the UK Gaming Market in 2023
- Game Sales Round-up (17.04.24 - 30.04.24)
- Omdia: 19.3 million handhelds were sold in 2023
- AppMagic: Top Mobile Games by Revenue and Downloads in April 2024
- Circana: The US gaming market in March 2024 grew by 4%
- Liftoff & GameRefinery: Casual Games in 2024
- Newzoo: Top 20 PC/Console games in March 2024 by Revenue and MAU
- Lurkit: State of the Streaming market in Q1’24
- Liftoff: CPI and D7 ROAS benchmarks in Mobile Games
- Stream Hatchet: Streaming Market Trends in Q1’24
- GameDiscoverCo: Data Consumption in Steam by Country in 2024
- Newzoo: Outlast Trials became the top-grossing B2P adventure game of March
- GameDiscoverCo: Conversion benchmarks of Steam wishlists into sales in the first month
- IGDA: Developer Satisfaction Survey 2023
- GSD & GfK: Fallout 4 became the best-selling PC/Console game of April in the UK
- Games & Numbers (01.05.24 - 14.05.24)
- SGA: The Serbian gaming industry doubled its workforce in 2023
- GSD & GfK: PC/Console game sales in Europe dropped in April 2024
- Mistplay: Spending habits of Mobile Gamers in South Korea in 2024
- Daniel Ahmad: Sony shipped 5 times more consoles to stores in Q1'24 than Microsoft did with the Xbox Series S|X
- Newzoo lowered its Forecast for the Gaming Market in 2023
- Notes of the Nintendo FY'24 report
- GameAnalytics: Benchmarks in Mobile Games for Q1’24
- Famitsu: Nintendo Switch has become the best-selling console in Japan's history
- StreamElements & Rainmaker.gg - State of the Streaming Market in April 2024
- Games & Numbers (15.05.24 - 28.05.24)
- Big Games Machine: How People Discover New Games in 2024
- Metaplay: How much does it cost to develop custom Backend Services in Mobile Gaming Companies?
- Circana: The US Gaming Market Decreased by 3% in April 2024
- PlayStation 5 is the most profitable console for PlayStation & more from a new FY'23 PS business presentation
InvestGame: Gaming Investment Market in Q1’24
Private Investments
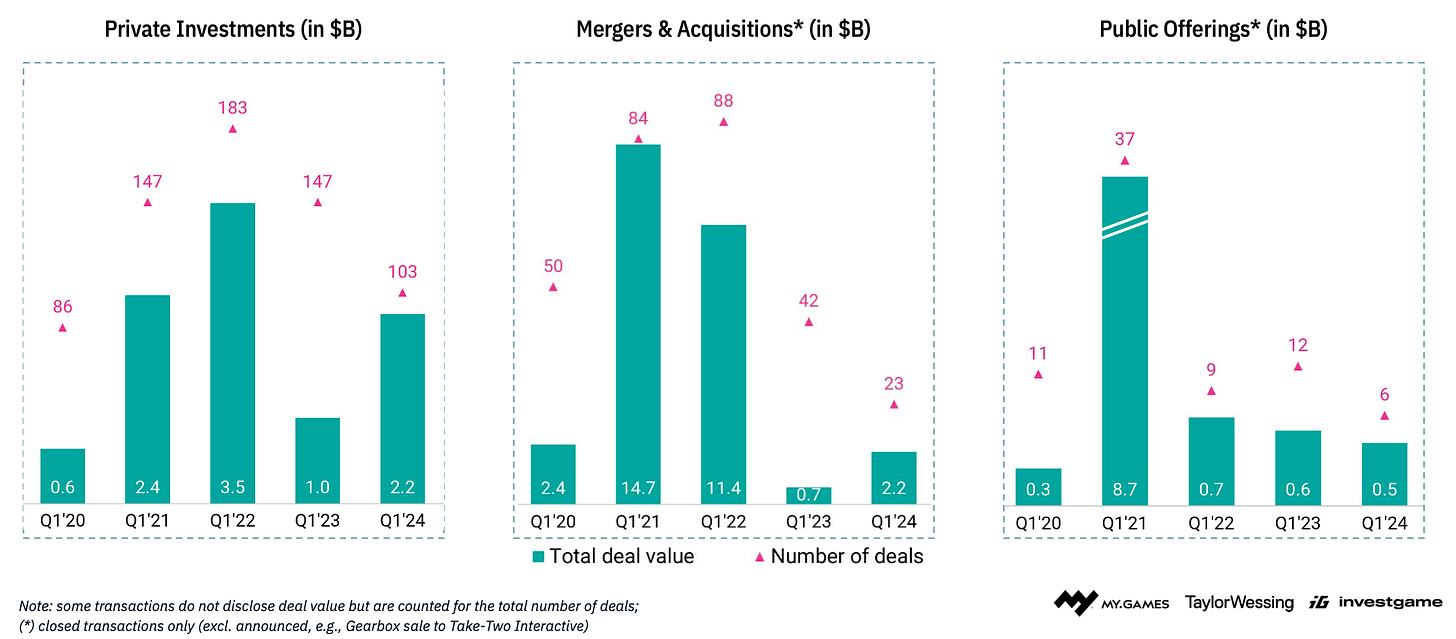
- Private investment volume in Q1’24 reached its peak since Q3’22 - $2.2 billion. However, it's important to note that $1.5 billion is attributed to the deal between Disney and Epic Games.
-
In the first quarter of 2024, 103 deals were made. This is fewer than in the first quarter of 2023 (147 deals) but more than in the past 3 quarters.
-
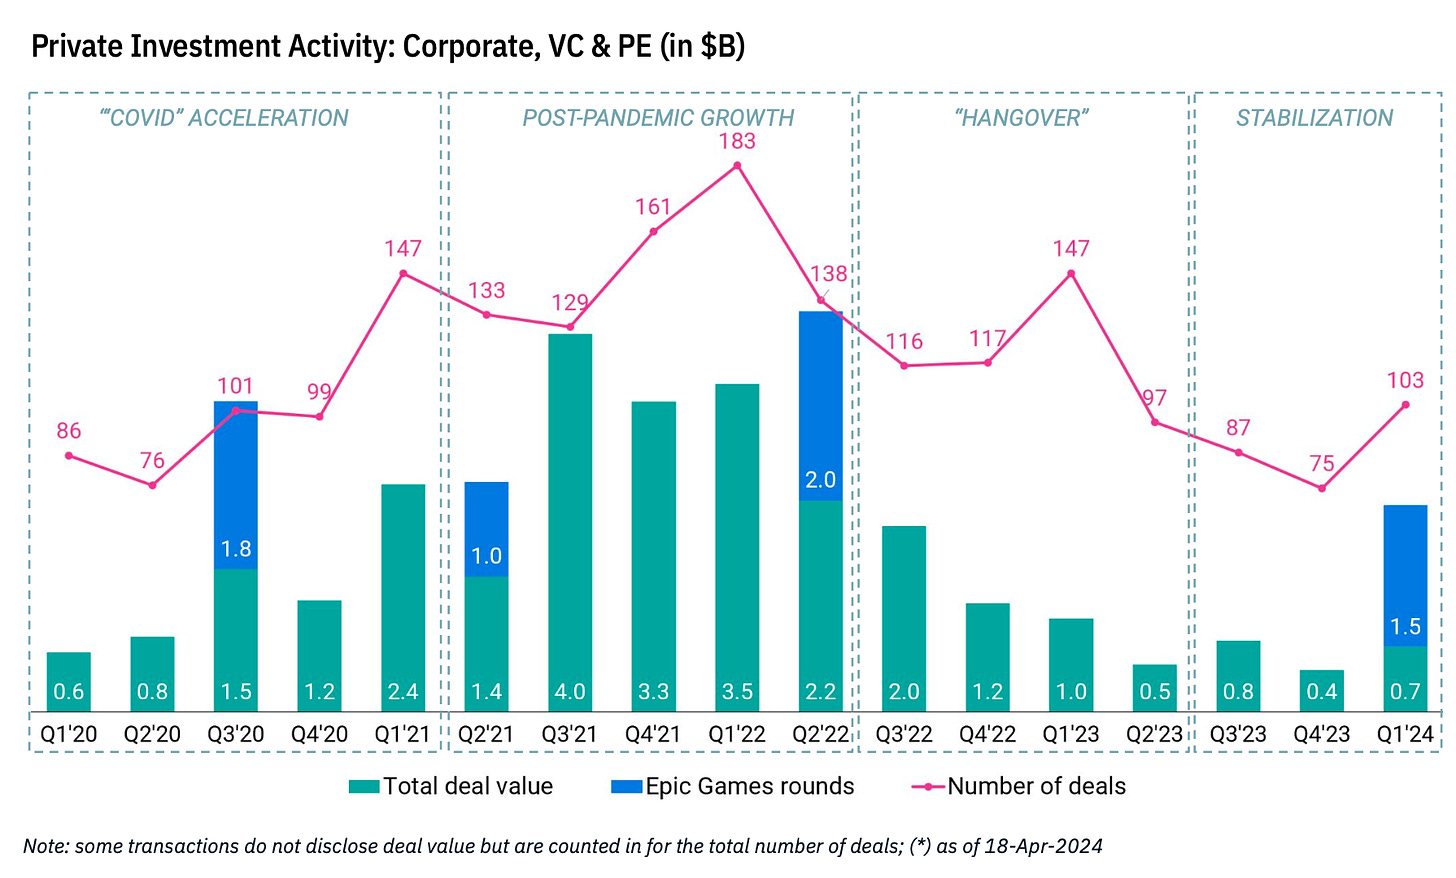
InvestGame vividly illustrates the market's development stages on a graph - showing how investment activity has changed at different stages.

-
The InvestGame team expresses cautious optimism about the market situation and notes the growth of pre-Seed and Seed deals. However, the market situation remains far from optimal.
Private Investments - Gaming Companies (Developers or Publishers)
-
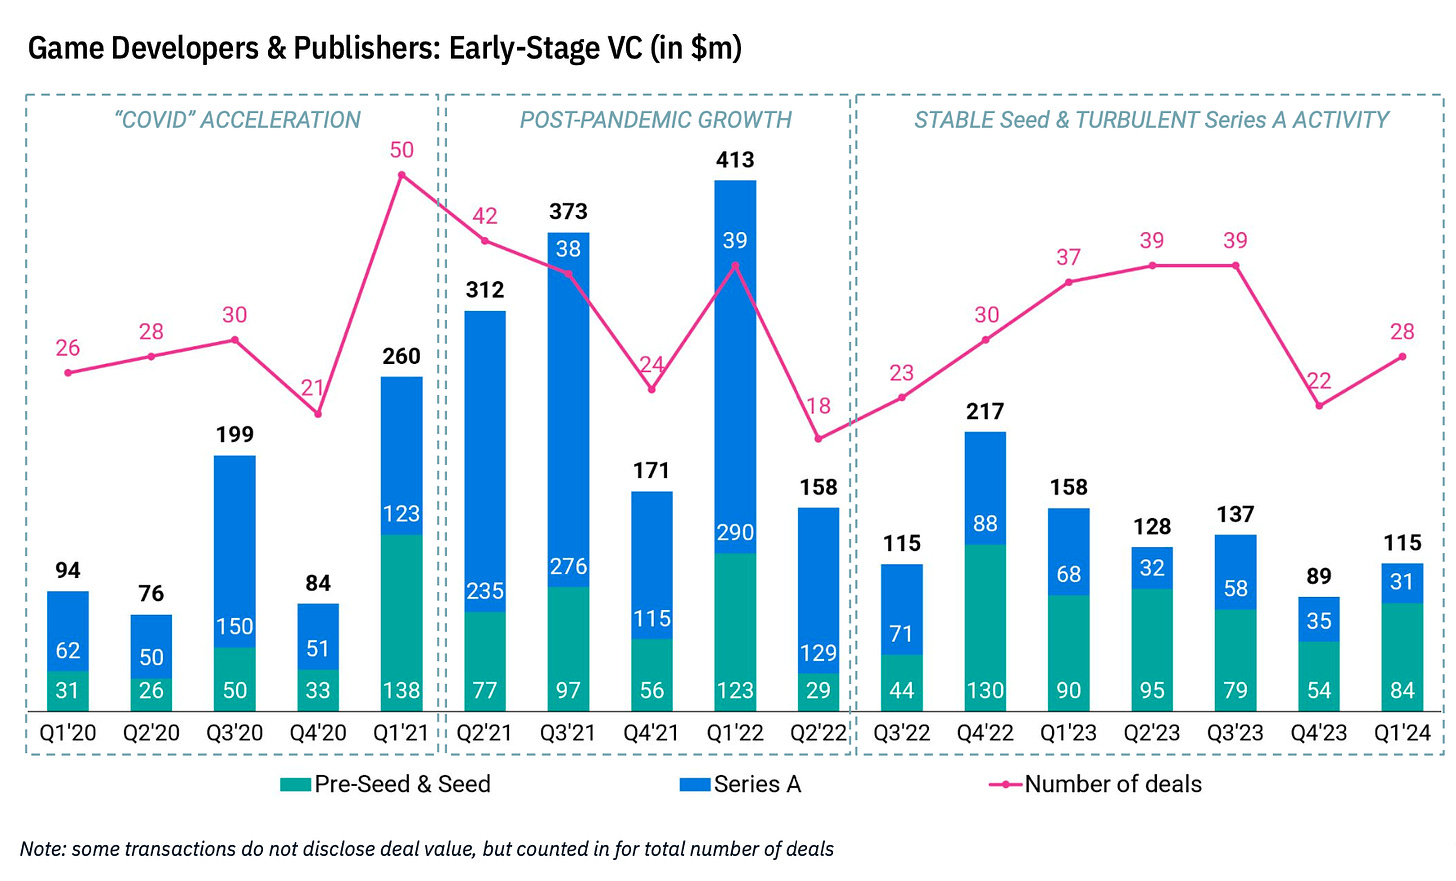
If we consider only investments in gaming companies at stages prior to Series A, then in Q1’24, 28 deals were made totaling $115 million.
-
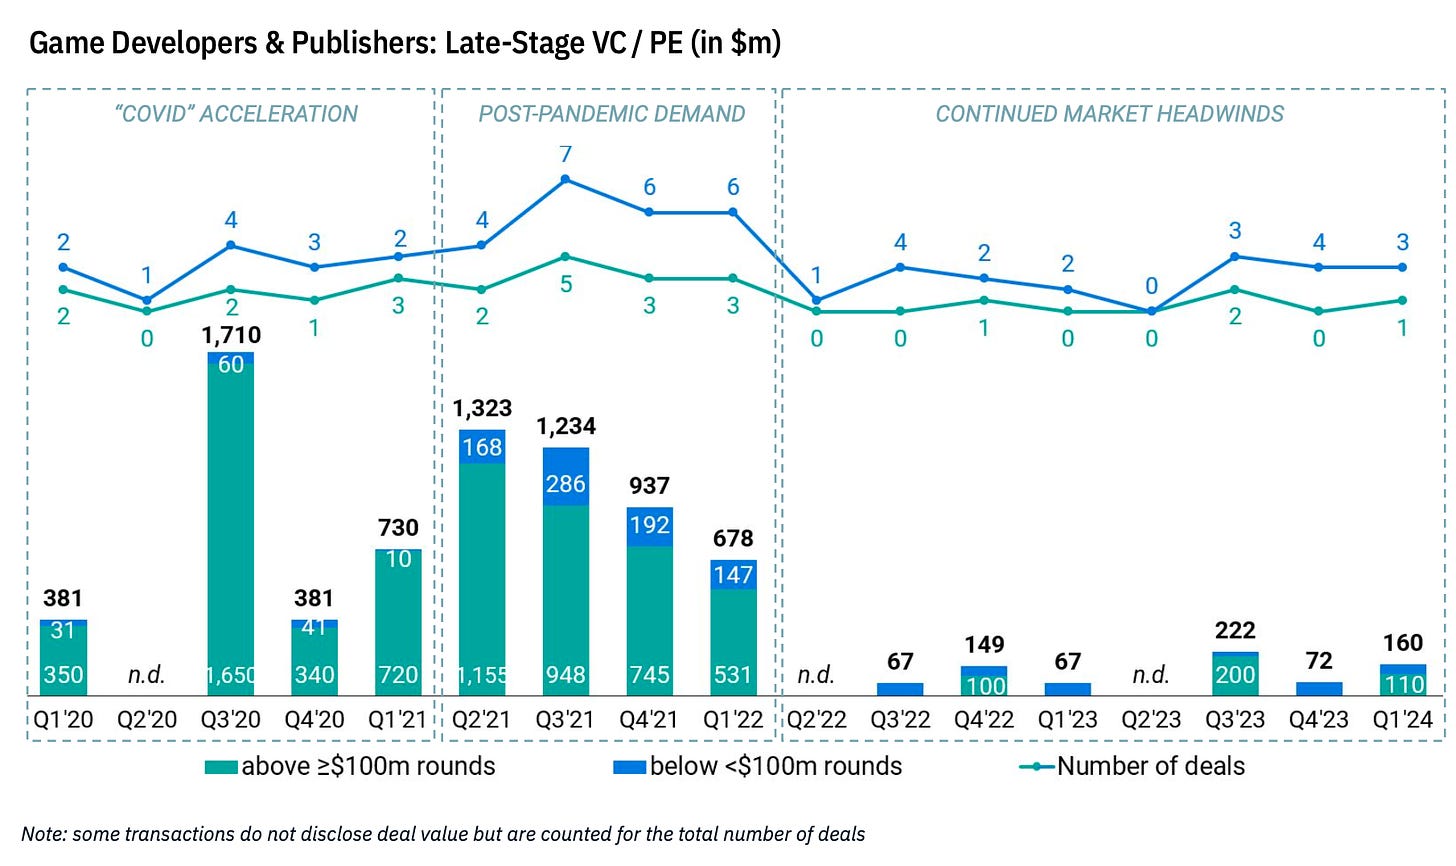
The situation with VC deals in later rounds is less positive. In Q1’24, 4 deals were closed totaling $160 million. Three of them were less than $100 million; one was larger.
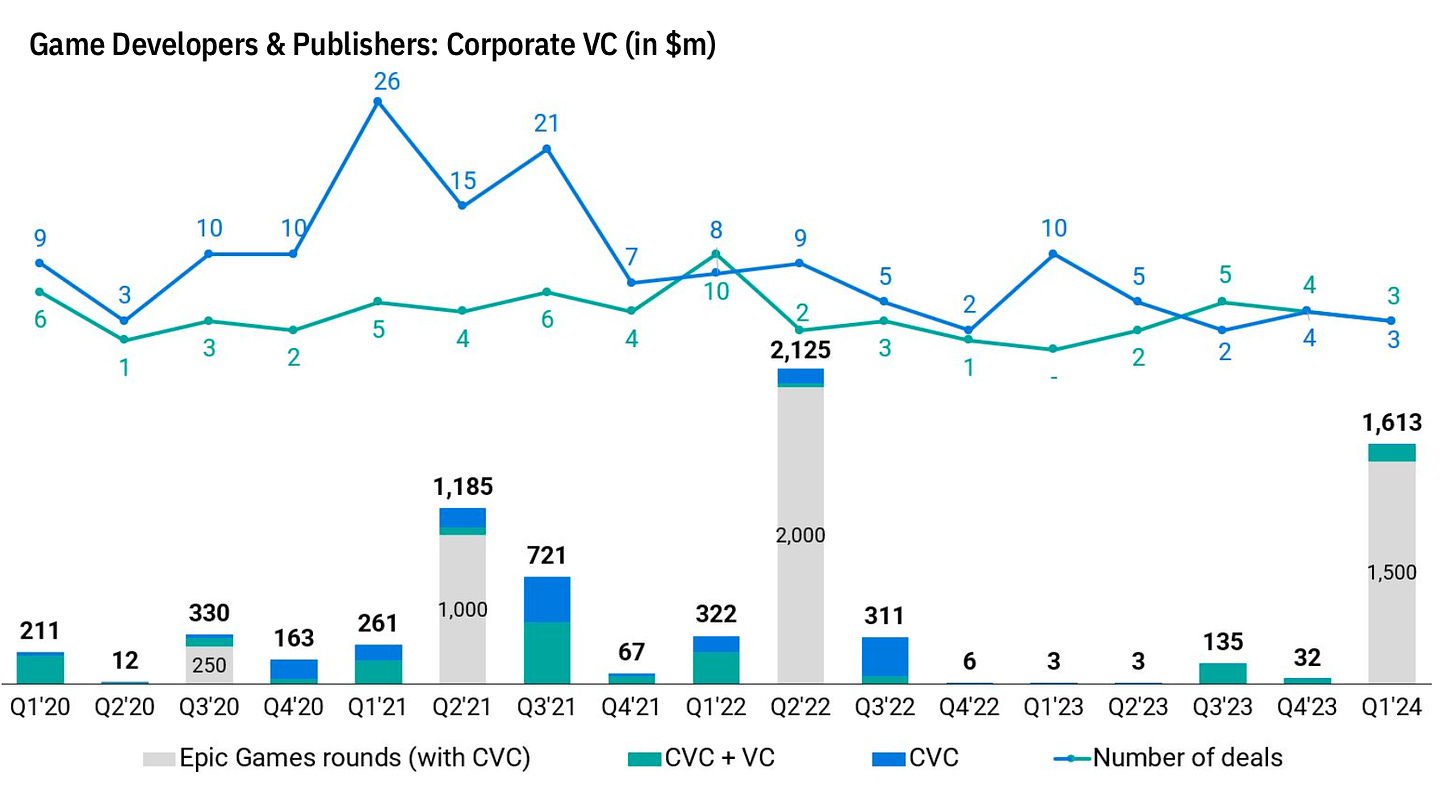
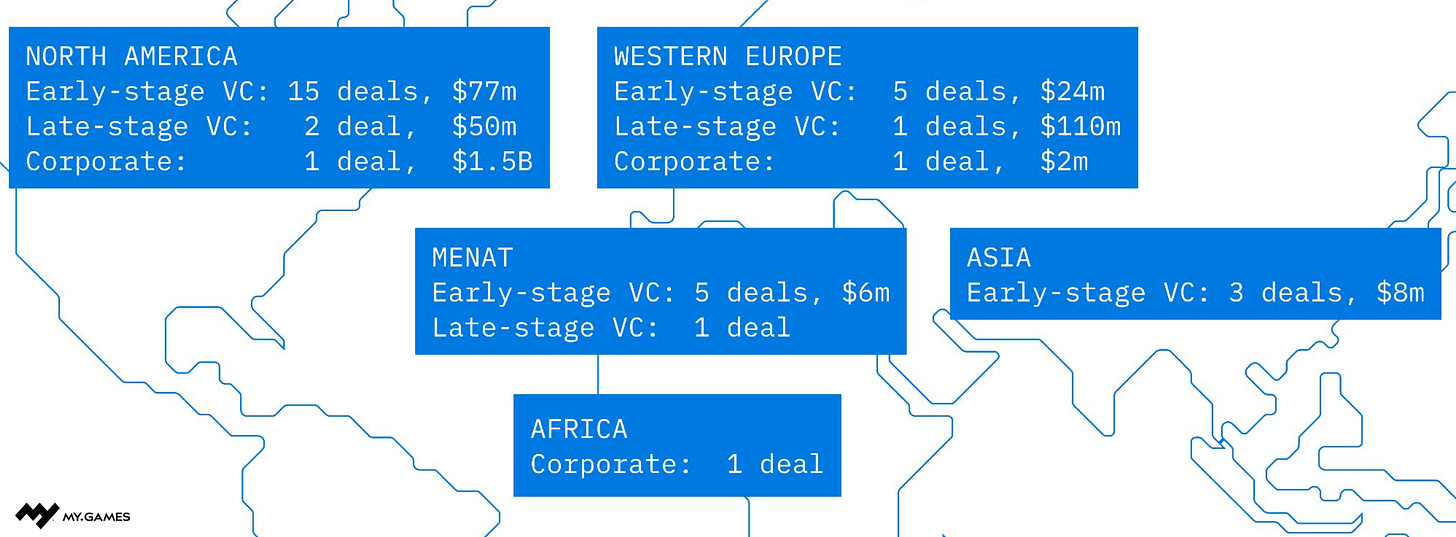
- Corporate investors in Q1’24 made 6 deals totaling $1.613 billion (including the Disney deal with Epic Games). The InvestGame team notes that corporate funds are increasingly behaving like VC funds, investing at early stages. Tencent, NetEase, Krafton, Kakao, Sony are particularly active (25 such deals since 2022).
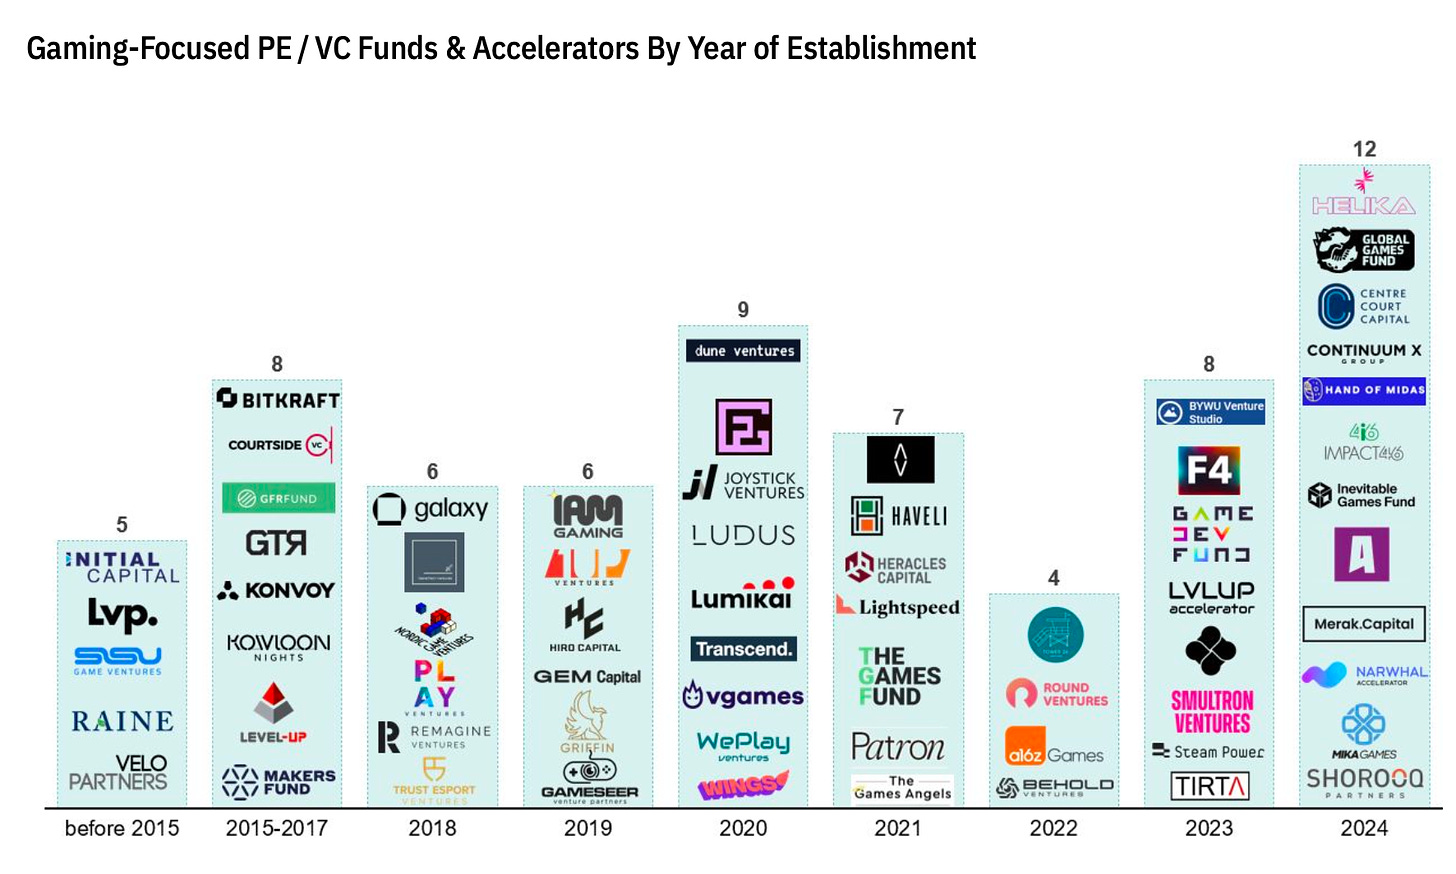
- Since 2019, over 45 funds have emerged in the market. Twice as many as in the previous 10 years. They have attracted over $15 billion but have only reinvested $7 billion so far. Despite the challenging market situation, 10 funds were announced in Q1’24. Over 80% of all funds focus on early-stage investments.
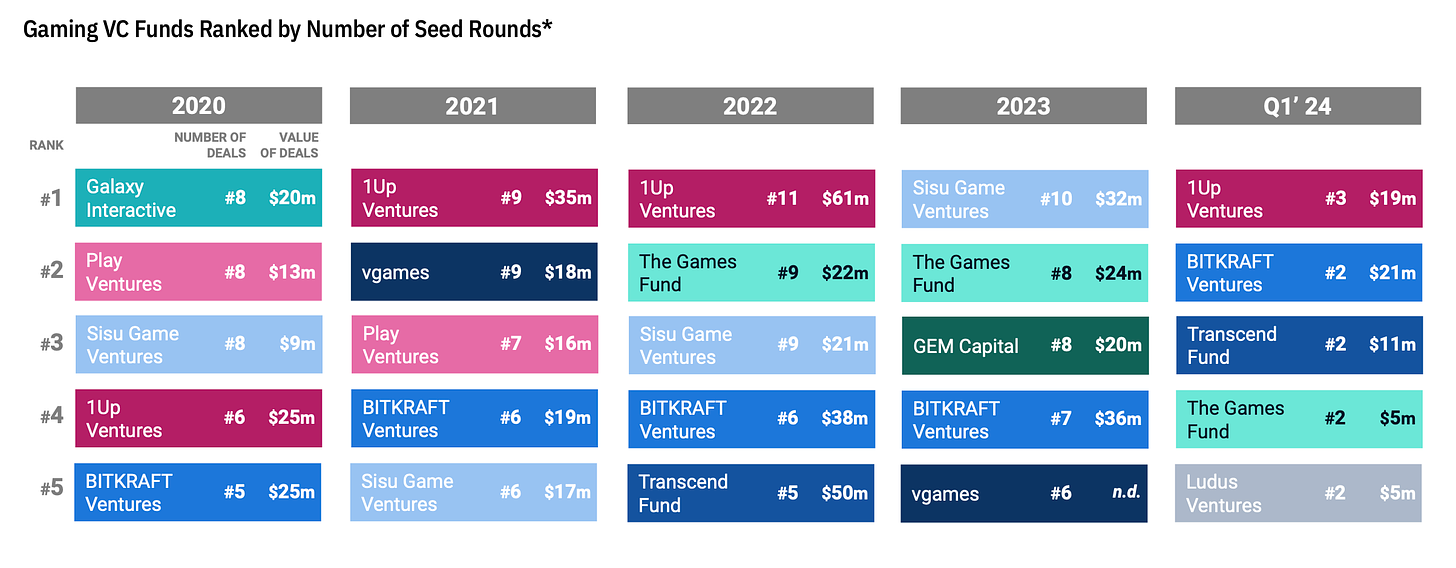
- 1Up Ventures; BITKRAFT Ventures; Transcend Fund; The Games Fund; Ludus Ventures - the most active players in Seed stages in Q1’24.
-
The primary markets for investments remain the USA and Western Europe.
Private Investments - PC/Console Market
-
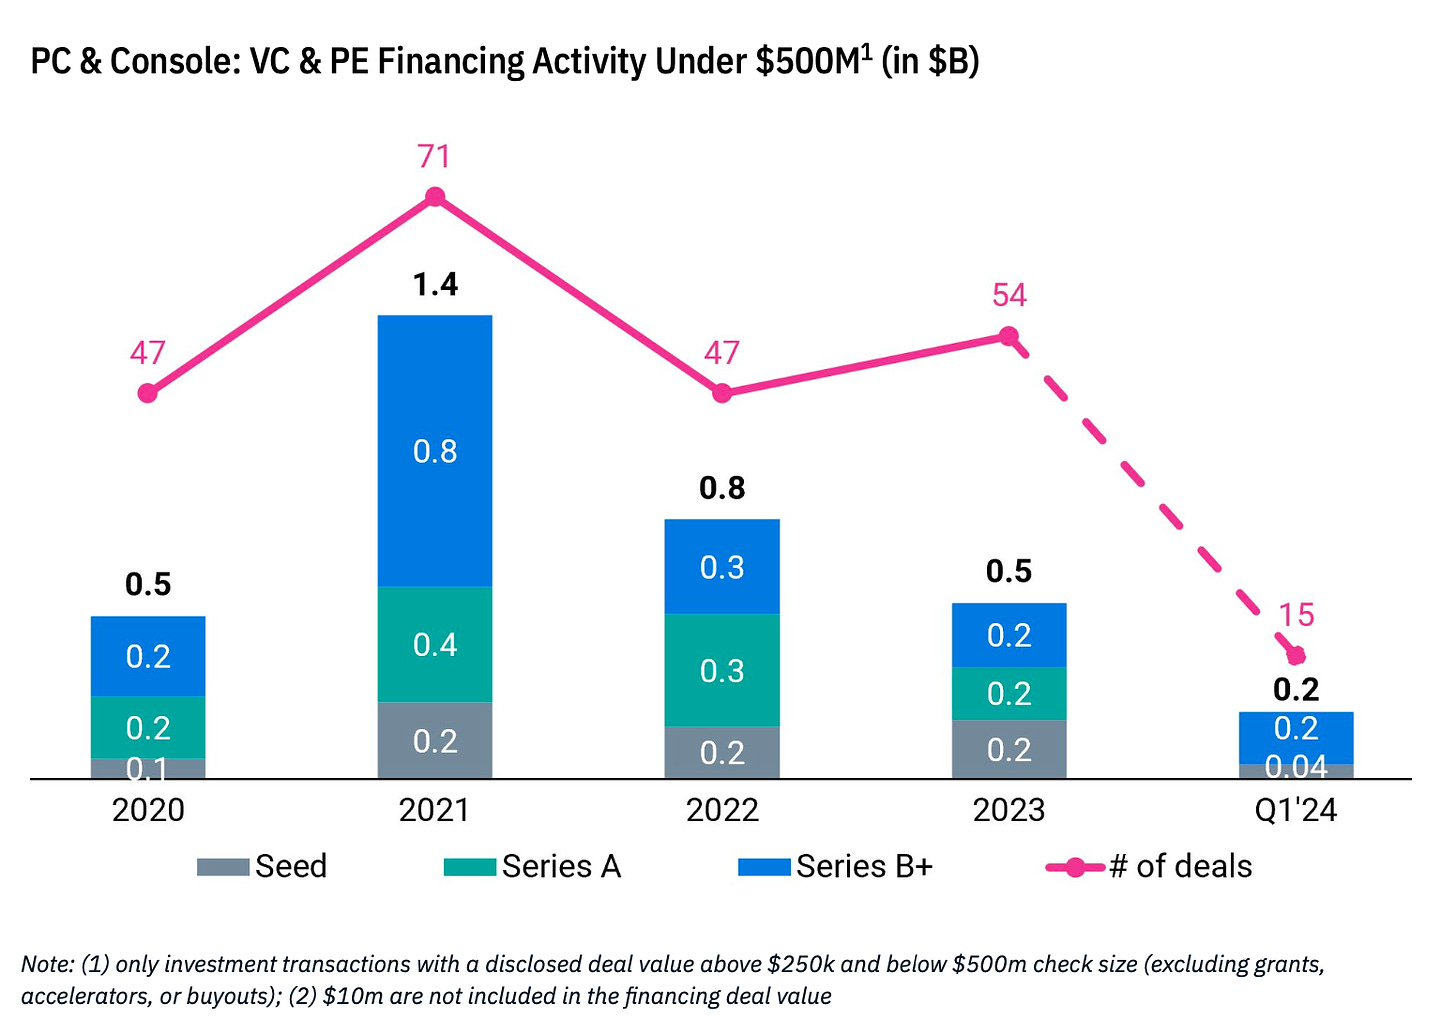
Since 2020, VC funds and PE firms have invested over $3.4 billion in PC/console companies. 50% of this amount was in Series B+ rounds. The majority of deals, both in terms of quantity and volume, occurred in 2021.
-
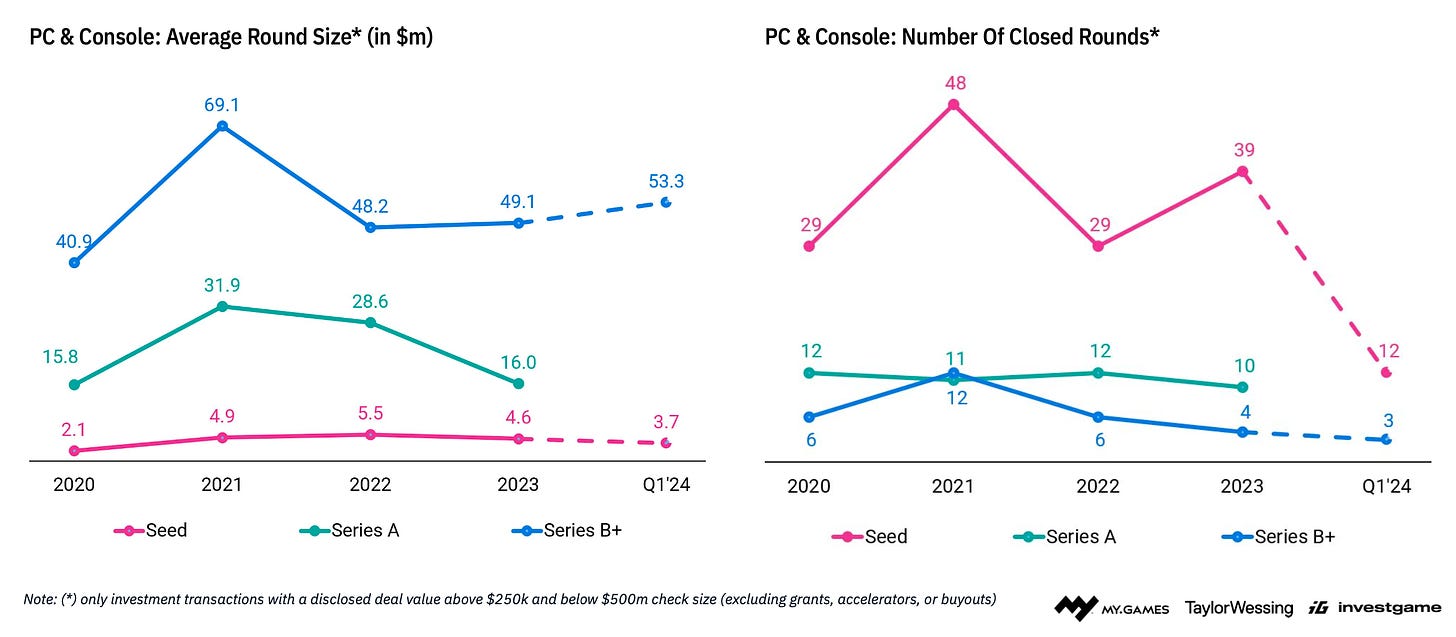
The number and volume of Seed rounds for PC/console developers have remained almost unchanged over the years, while Series A+ rounds have decreased both in volume and quantity.
-
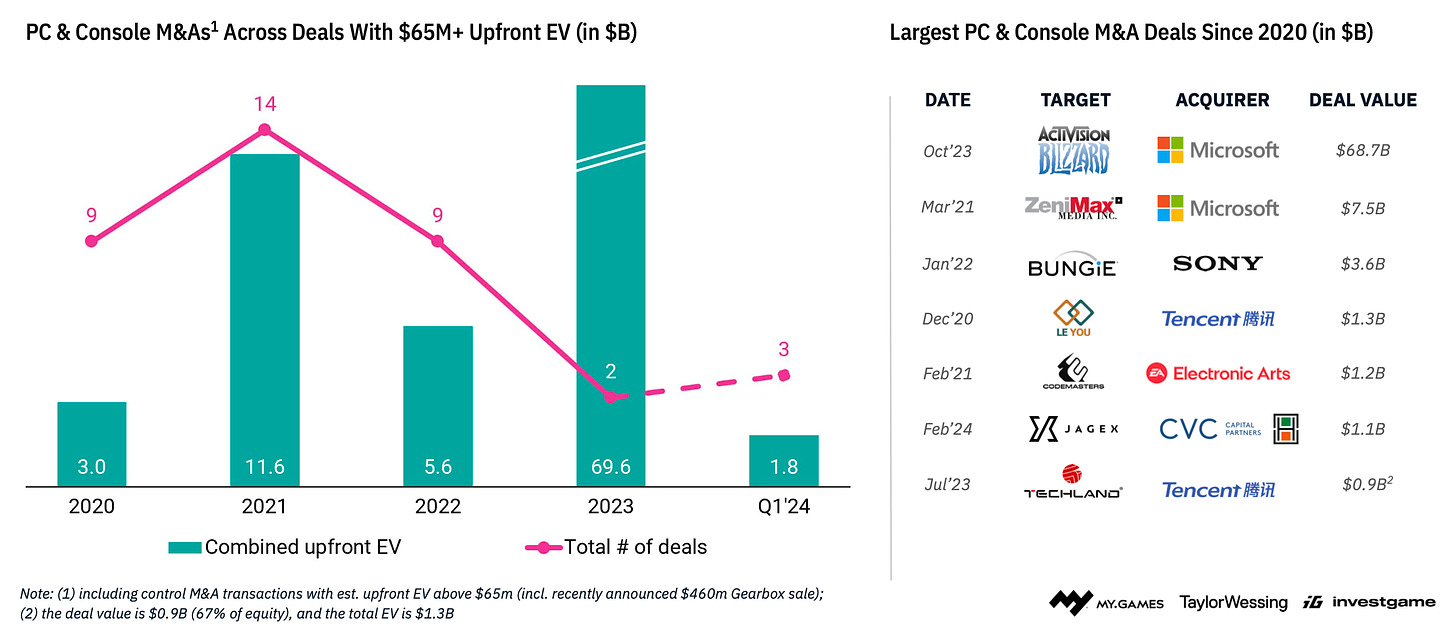
Meanwhile, there have been 37 deals totaling $91 billion for PC/console developers since 2020.
Private Investments - Mobile Market
-
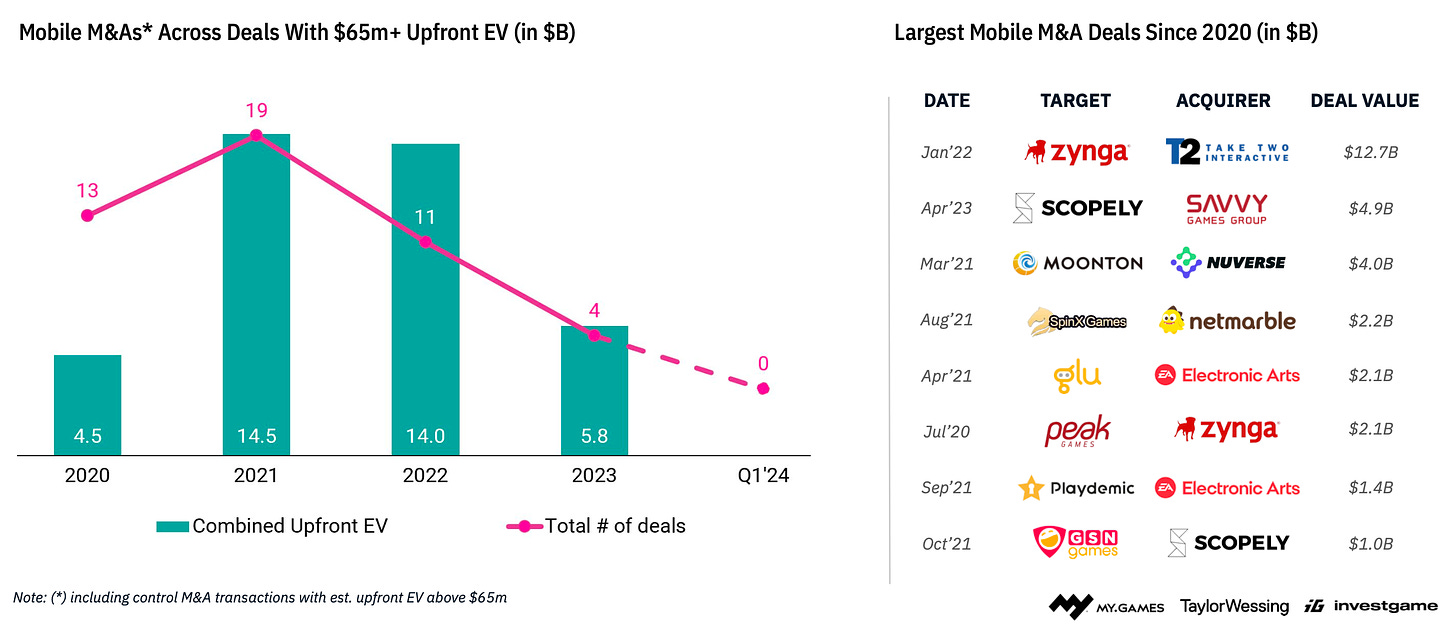
The number of M&A deals with mobile developers has been decreasing since 2021 in terms of both volume and quantity of deals.
-
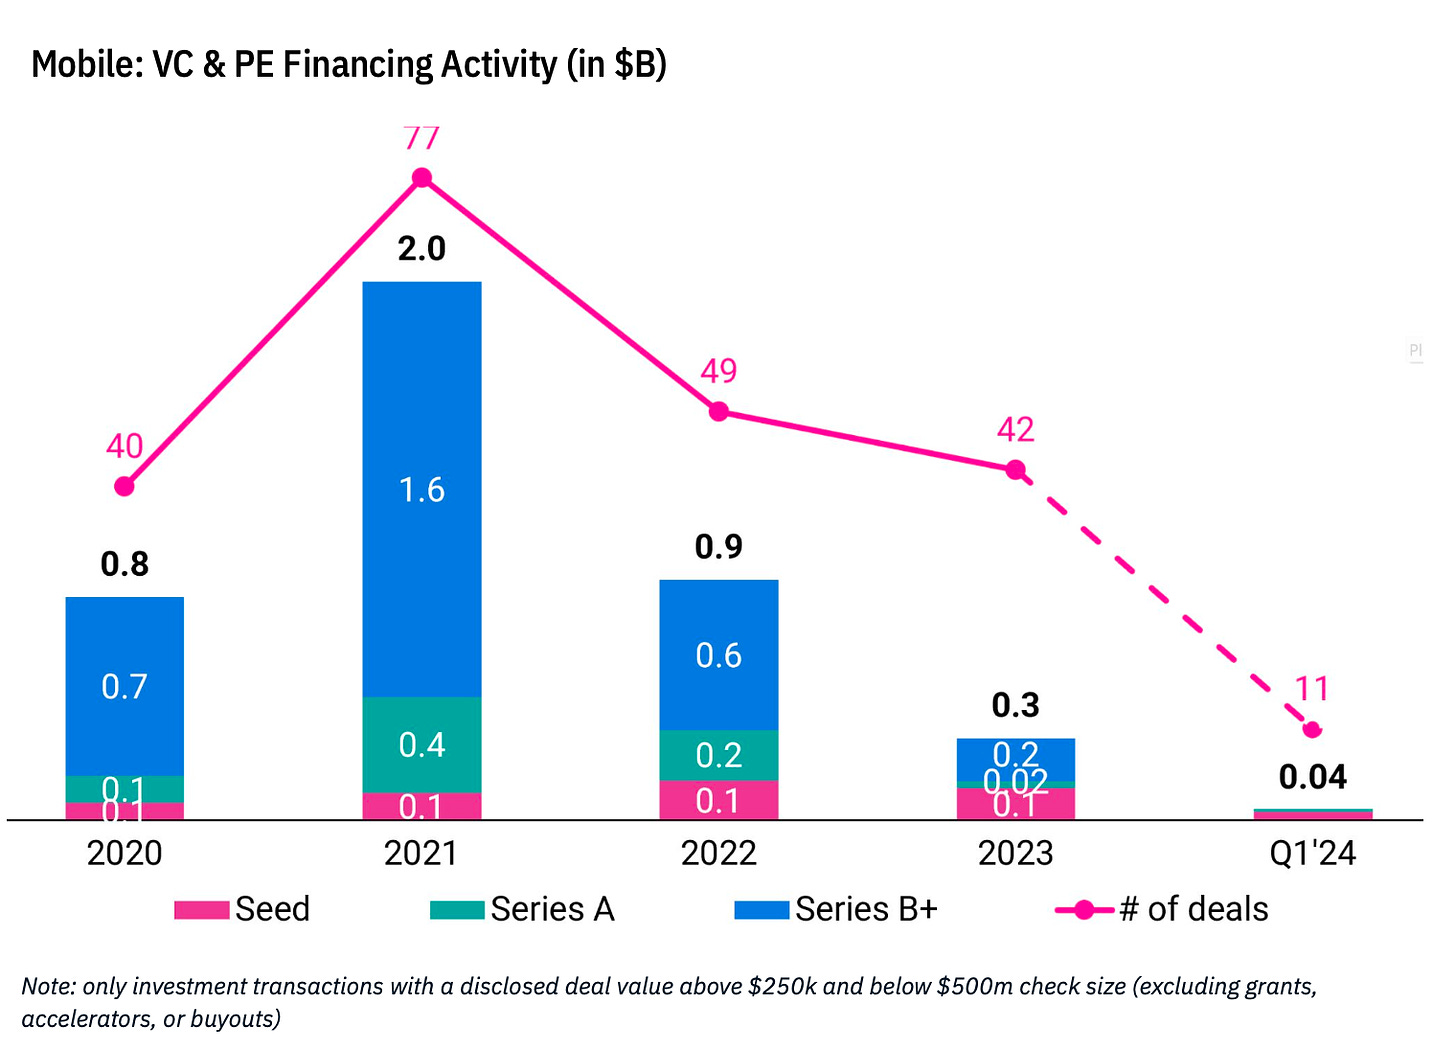
The popularity of mobile studios among VC and PE investors is also declining. In 2023, such studios attracted $0.3 billion in 42 deals.
-
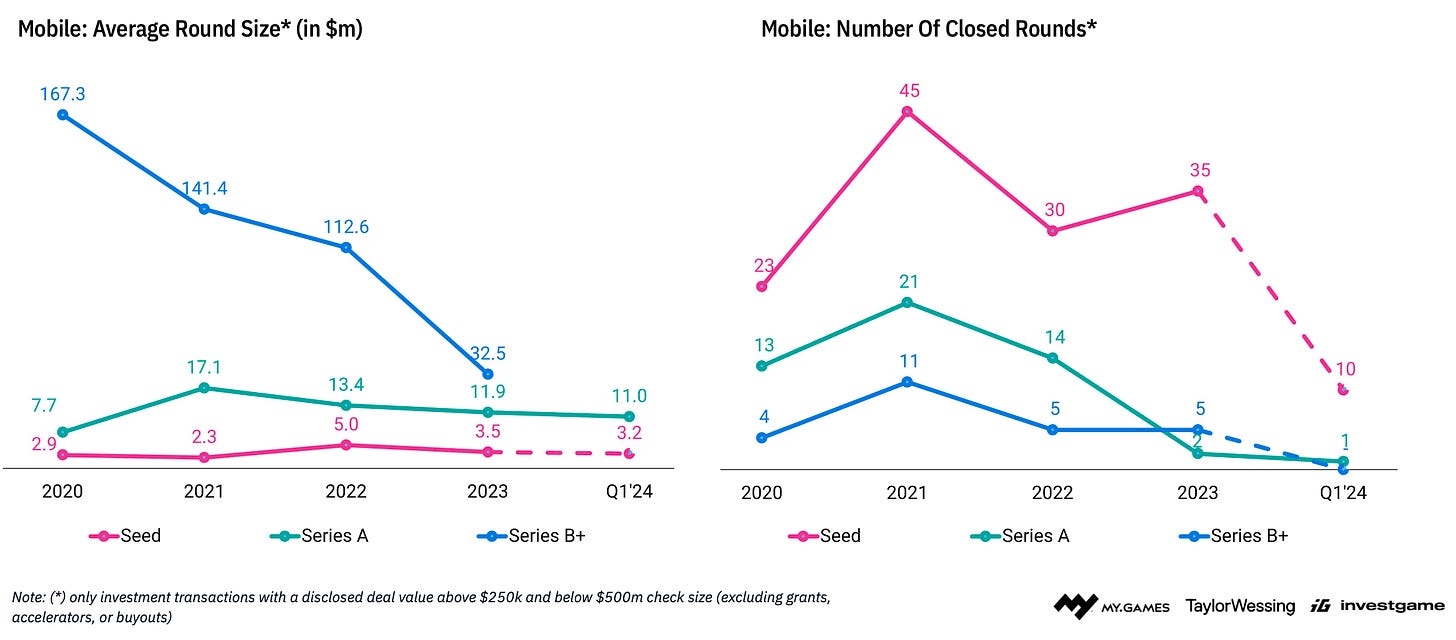
The decline is most noticeable in later stages. The number and volume of Seed rounds are more stable.
M&A
-
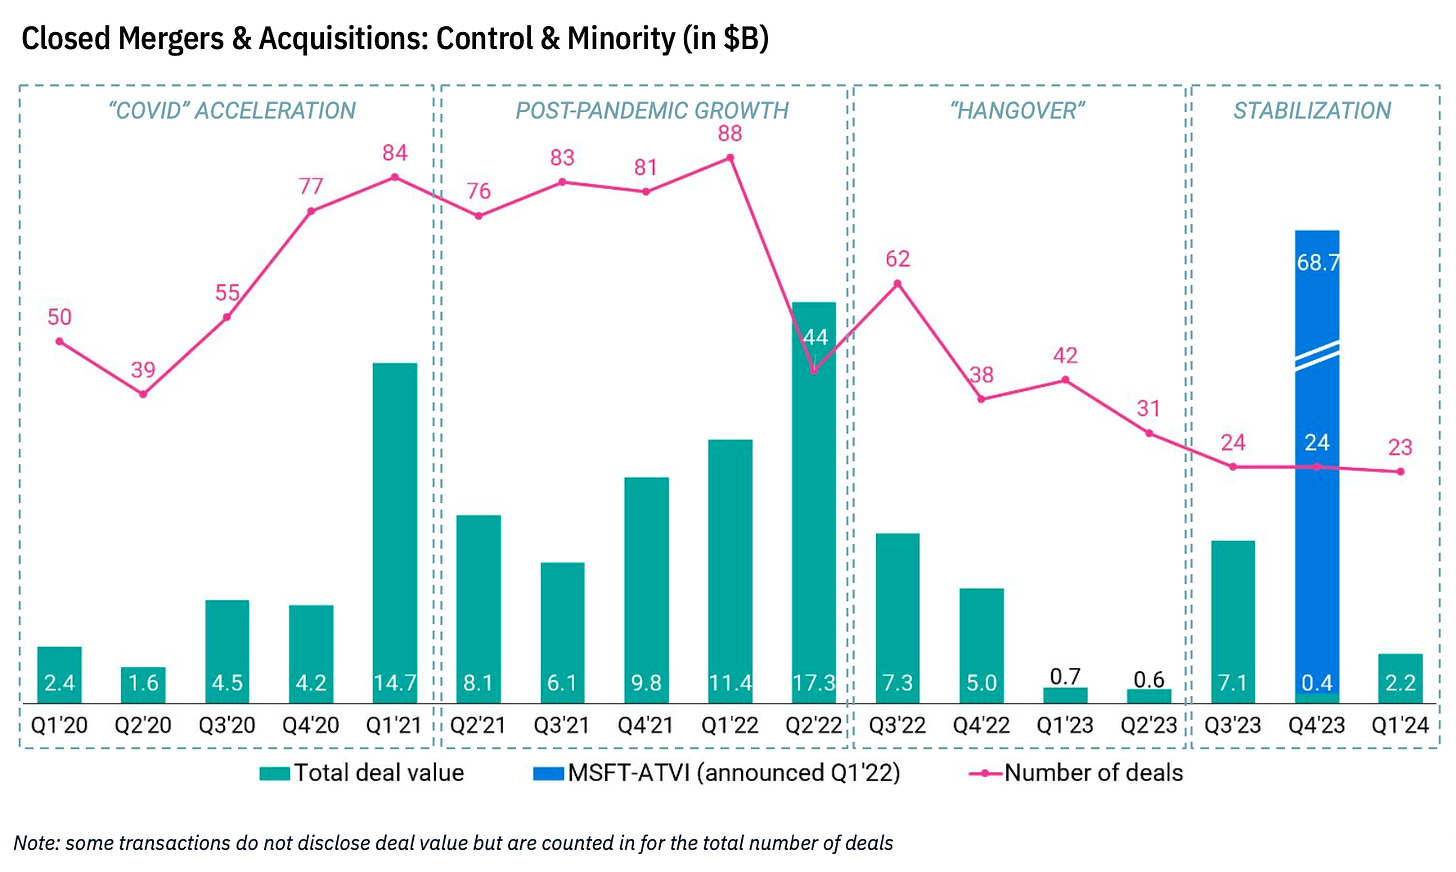
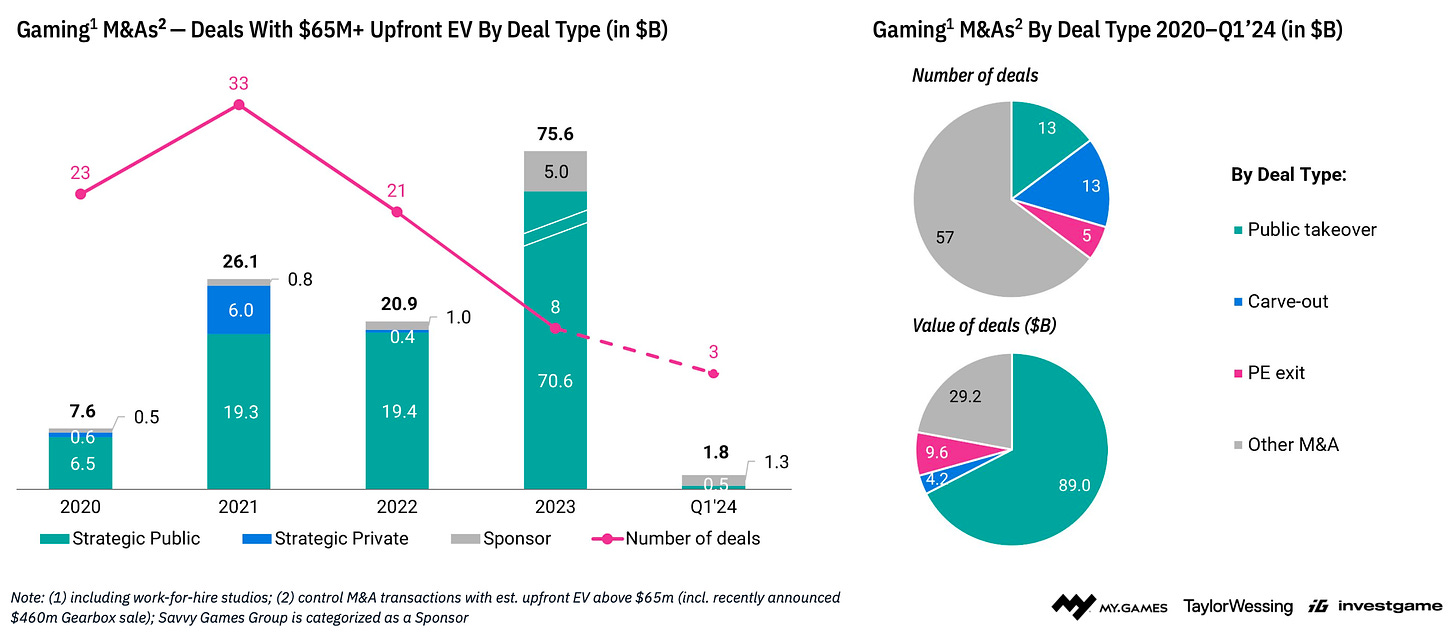
In Q1’24, 23 M&A deals totaling $2.2 billion were completed.
-
The most notable deal of the quarter was the acquisition of Jagex for $1.1 billion.
IPO
-
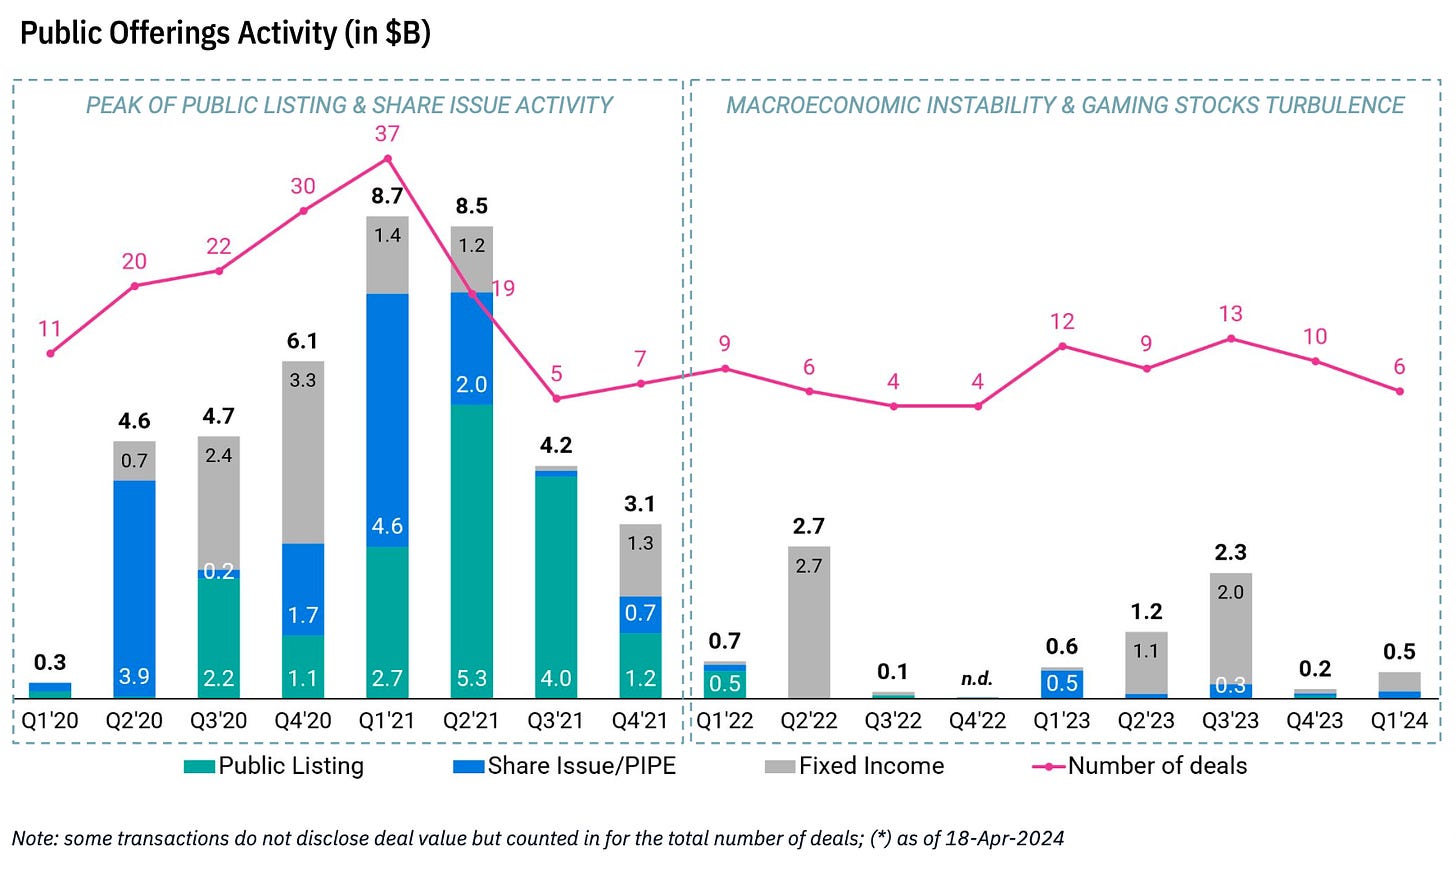
The situation with going public remains complex. High interest rates and poor performance of companies already on the market are putting pressure.
-
The largest upcoming IPO might be Shift Up. It is reported that they have already applied to the Korea Stock Exchange with a valuation of $2 billion.
-
Many public gaming companies are currently trading at a discount, so they are conducting buyback campaigns.
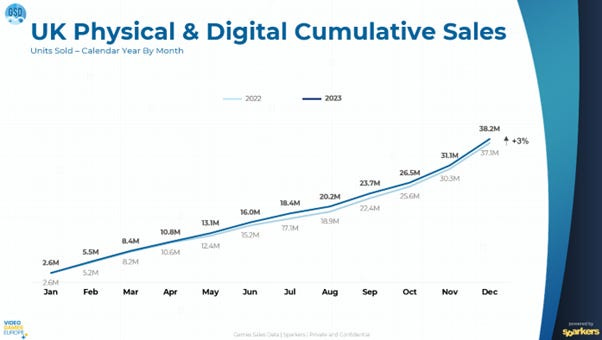
The analysis is based on data from GSD and GfK. It includes actual sales figures shared by publishers and stores.
-
The number of copies sold in 2023 increased by 3% compared to 2022. That's 38.3 million games.
-
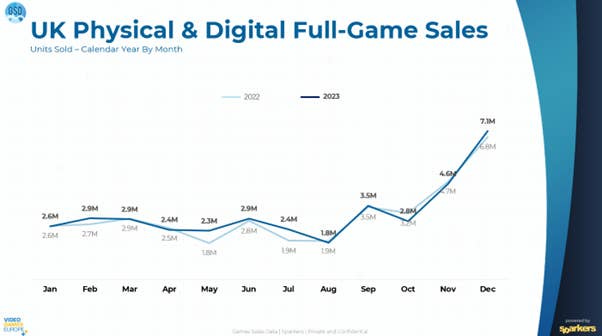
Until May 2023, sales dynamics mirrored those of 2022. It was only from May onwards that the market surged, largely due to The Legend of Zelda: Tears of the Kingdom and Diablo IV.
-
When comparing sales of new games (games less than 3 months on the market), 2023 unexpectedly turned out to be 1% worse than 2022 (11.8 million copies). However, back-catalog sales (games older than 3 months) grew by 5% compared to 2022.
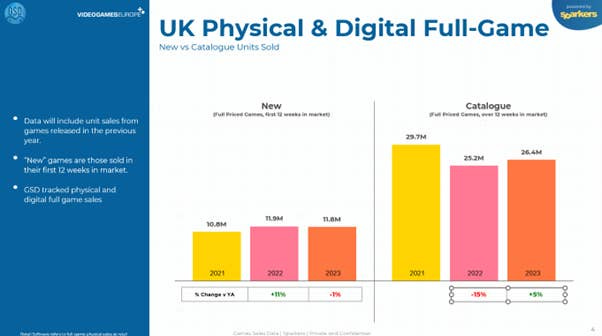
❗️The calculation methodology used by GSD and GfK is somewhat atypical. In my opinion, the back-catalog should include projects released before the reporting year.
-
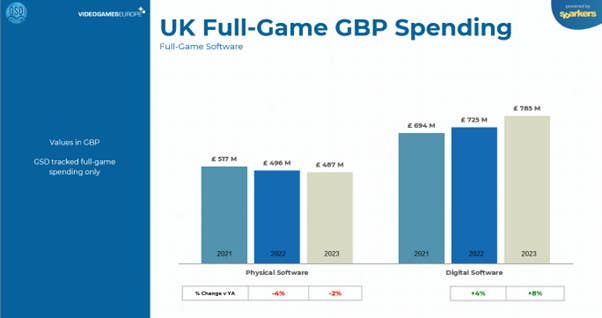
User spending on games increased by 4% - reaching £1.27 billion. Digital sales saw an 8% growth (£785 million), while physical copy sales decreased by 2% (£487 million).
-
The number of digital version sales is increasing, but the rate of replacing boxed versions of games has slowed down.
-
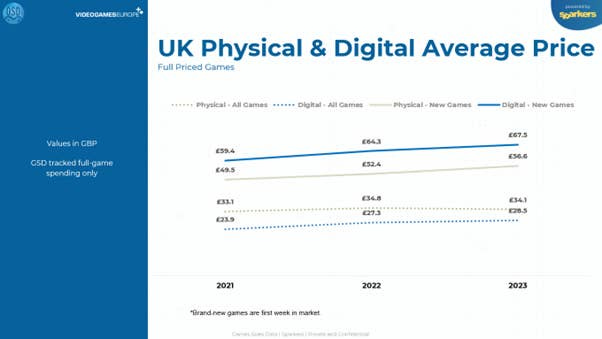
The average price of new physical format games increased by 14% in 2023 (£57), compared to 2021 (£50). A similar percentage growth is seen in digital versions - from £59 in 2021 to £68 in 2023.
-
The average price of all disc format games increased from £33 in 2021 to £34 in 2023. The growth is more noticeable in digital format - from £24 to £29.
-
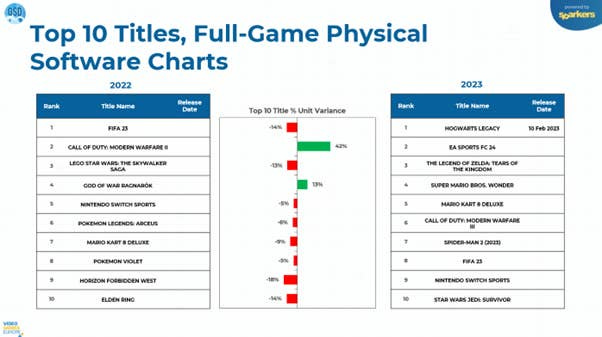
In 2023, games from the top 10 of the British chart sold 2% worse than the top 10 in 2022, considering only physical copies.
-
However, the situation is similar when considering digital versions.
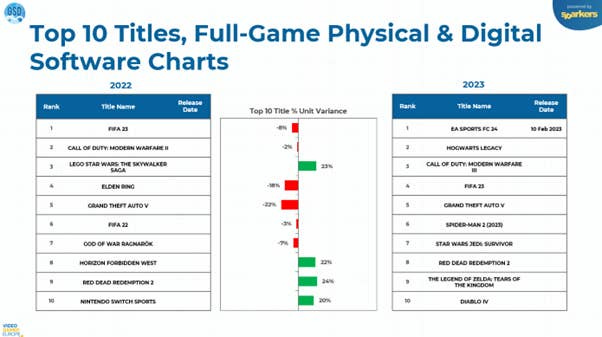
❗️For some reason, British consumers were not very optimistic about new releases in 2023.
-
Sea of Thieves has over 40 million users. The impressive milestone was announced a week before the release on PlayStation, and the player count has grown even more since then.
-
Buckshot Roulette reached over a million copies sold in 2 weeks. It's an indie horror game about "Russian roulette."
-
House Flipper 2 sold 13,088 copies on Xbox ($511.7k revenue) and 18,170 copies on PlayStation ($667k revenue) in the first 3 days on consoles. The results are four times worse than on PC, where the game was purchased 131 thousand times in a similar period in December 2023.
-
Frostpunk surpassed the great milestone of 5 million copies sold. An excellent achievement.
-
Users have spent over $8 billion on Pokémon GO since its release, according to AppMagic analysts. During the same period, the game was downloaded over 656 million times.
-
Capcom and Niantic reported 15 million downloads of Monster Hunter Now. AppMagic notes that during this time, the game has earned $164 million gross.
-
Manor Lords sold over 1 million copies within a day of its release. At the time of launch, the game had over 3.2 million wishlists. The project's peak CCU is 173 thousand people. One person made the game, Greg Styczeń (Slavic Magic); Hooded Horse published the project.
-
In the first 2 weeks, over 65 million people watched the Fallout TV series. The majority of viewers are aged between 18 and 34. The top countries for viewership are the United Kingdom, France, and Brazil.
Omdia: 19.3 million handhelds were sold in 2023
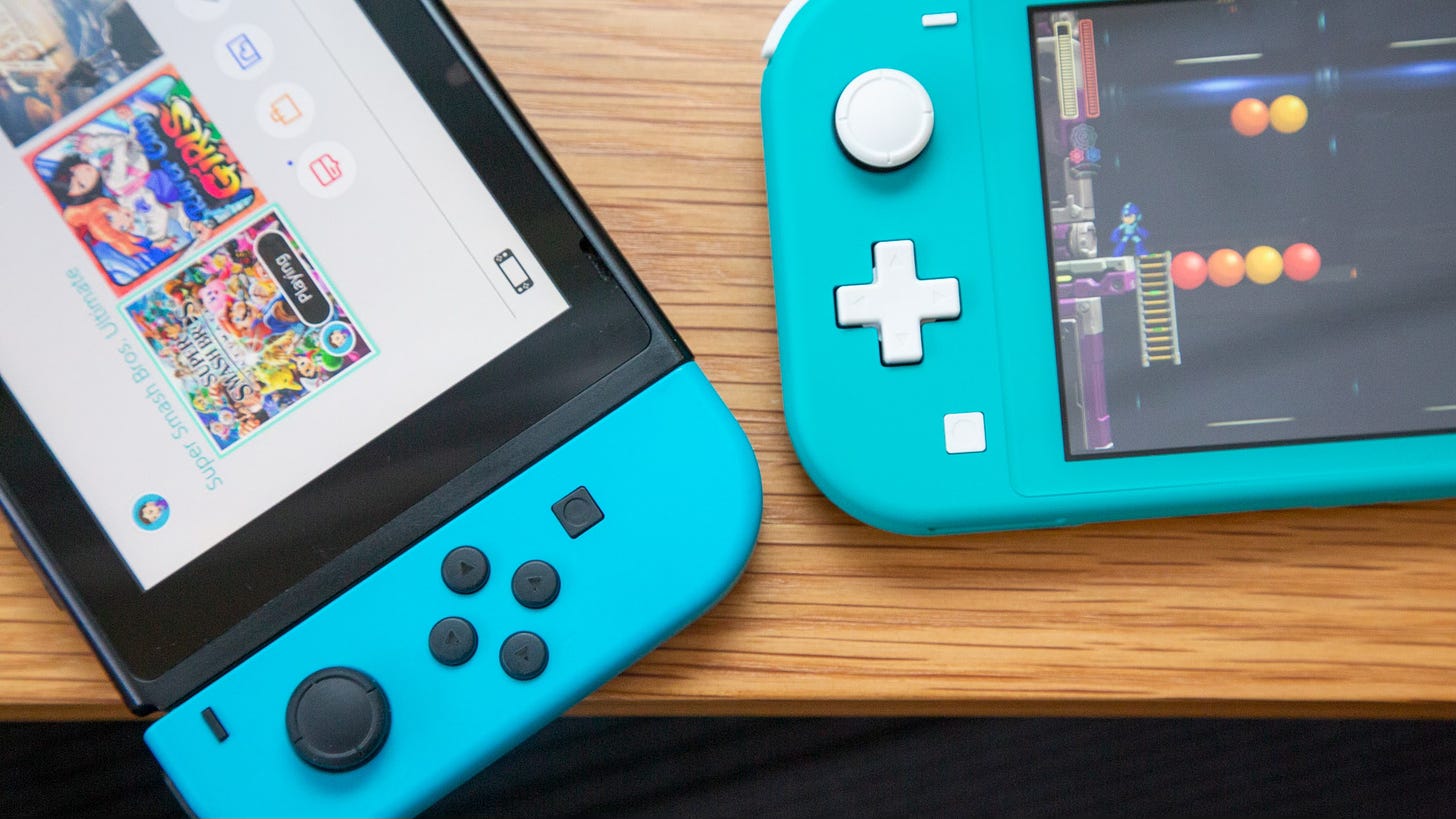
This segment includes the Nintendo Switch; portable PC consoles (Steam Deck); streaming systems (PlayStation Portal); and historical portable consoles (Nintendo 3DS; PlayStation Vita).
-
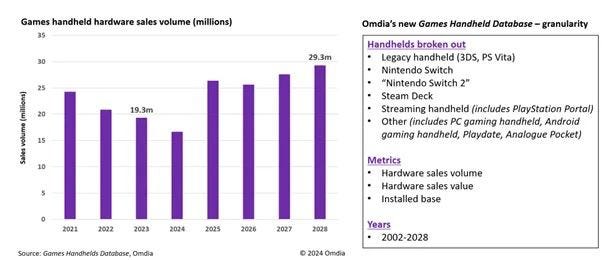
Omdia notes that 19.3 million portable devices were sold in 2023, fewer than in 2021 and 2022.
❗️This is related to the end of the life cycle of the Nintendo Switch.
-
However, Omdia predicts rapid growth in the segment in 2025 - rumors suggest the release of the Nintendo Switch 2 then.
-
Omdia forecasts that in 2028, sales of portable gaming devices will reach 29.3 million units.
AppMagic: Top Mobile Games by Revenue and Downloads in April 2024
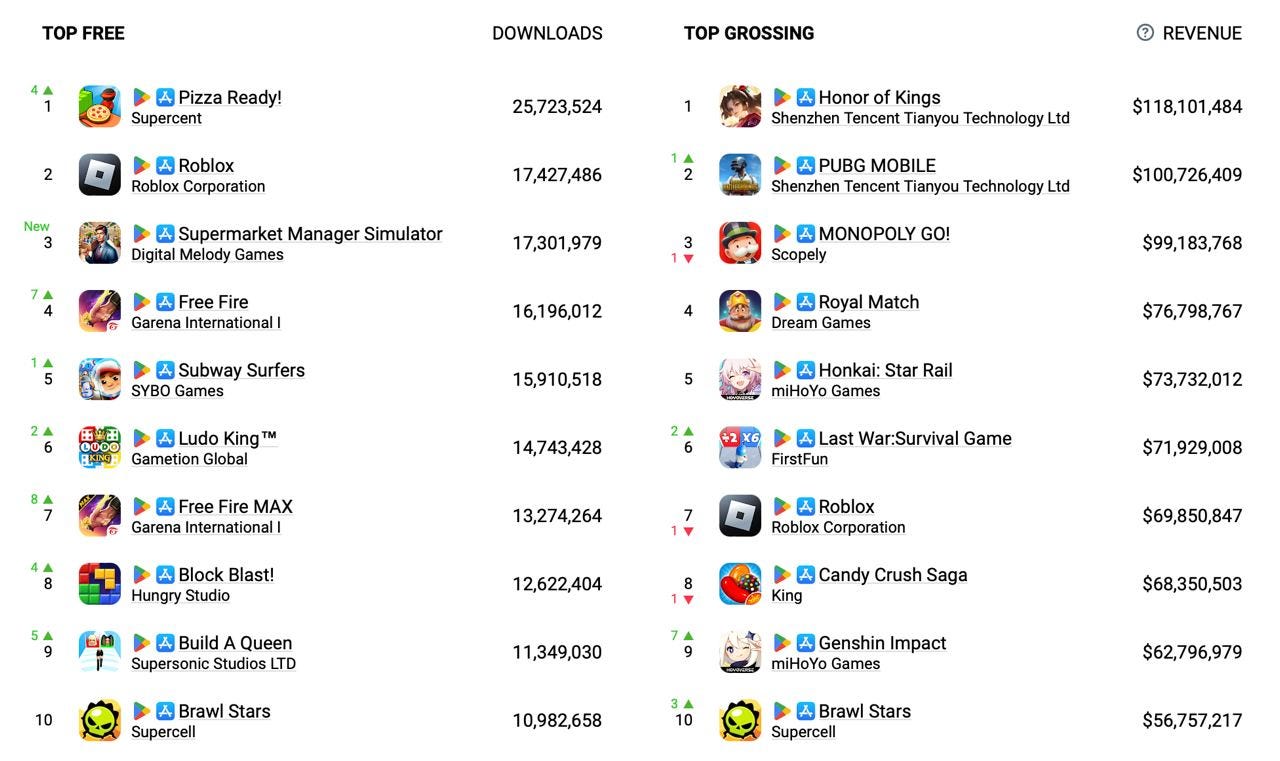
AppMagic provides revenue data net of store commissions and taxes.
Revenue
-
Honor of Kings is leading the chart with $118.1 million. I imagine writing this every month for the next decade…
-
Monopoly GO! dropped to third place on the chart ($99.2 million). Its place was taken by PUBG Mobile ($100.7 million in April).
-
Last War: Survival Game is gaining in revenue; in April, the game earned $71.9 million.
-
Genshin Impact increased its revenue by half compared to the previous month. The game earned $62.8 million in April and jumped 7 positions in the rankings.
-
Brawl Stars continues its triumphant march. The game set a historical revenue record, earning $56.8 million in April.
Downloads
-
Pizza Ready! by Supercent topped the download chart. In April, the game was downloaded 25.7 million times.
-
Supermarket Manager Simulator - a newcomer in the download chart. In April, the project had 17.3M installs (3rd place). 28% of downloads from Brazil; 27% from the USA; 11% from the UK. You might’ve expected some idle title, but it’s a 3D simulation game.
-
The top 10 also includes two versions of Free Fire - Classic (16.2M downloads) and Max (13.3M downloads). Technically, if combined, Free Fire would be the most downloaded game of April.
Circana: The US gaming market in March 2024 grew by 4%
General Numbers
-
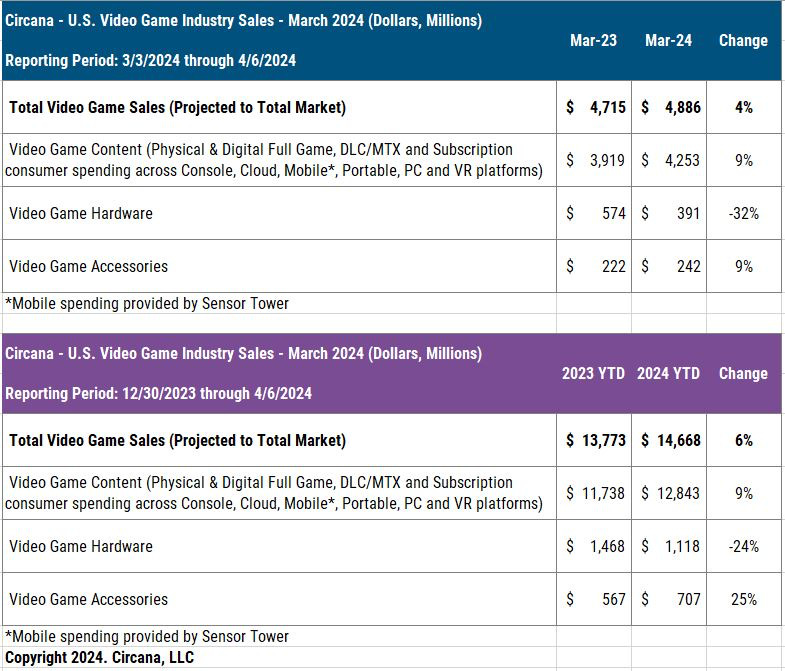
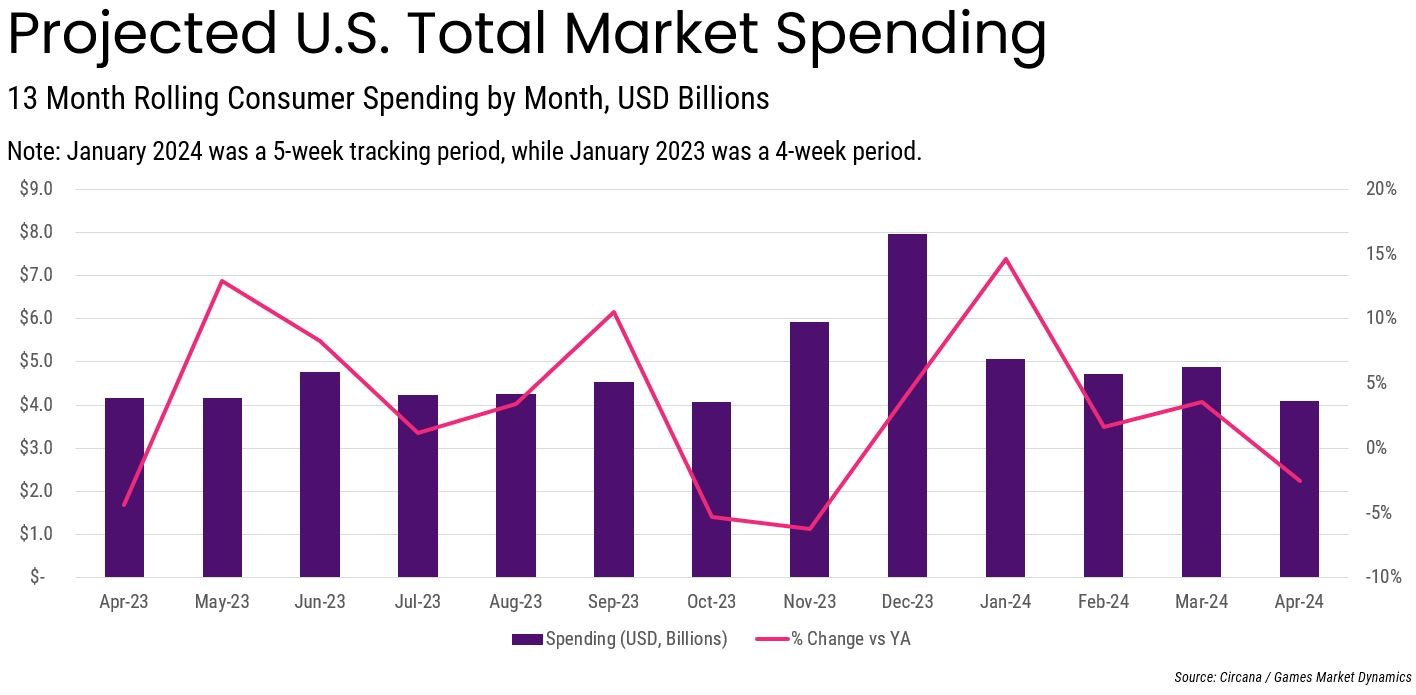
In March 2024, the American gaming market reached $4.9 billion. This is 4% higher compared to the previous year.
-
Sales of gaming content grew by 9% compared to the previous year ($4.25 billion). Similar growth was shown in accessory sales ($242 million). However, sales of gaming devices fell by 32% to $391 million.
-
Comparing the first 3 months of 2024 to the first 3 months of 2023; the total revenue of the American market is 6% higher ($14.67 billion in 2024 versus $13.77 billion in 2023). Content sales are up by 9%; accessories by 25%. Gaming hardware sales are down by 24%.
-
DualSense Edge was the top-selling accessory in the USA in March 2024 and in the first quarter overall.
-
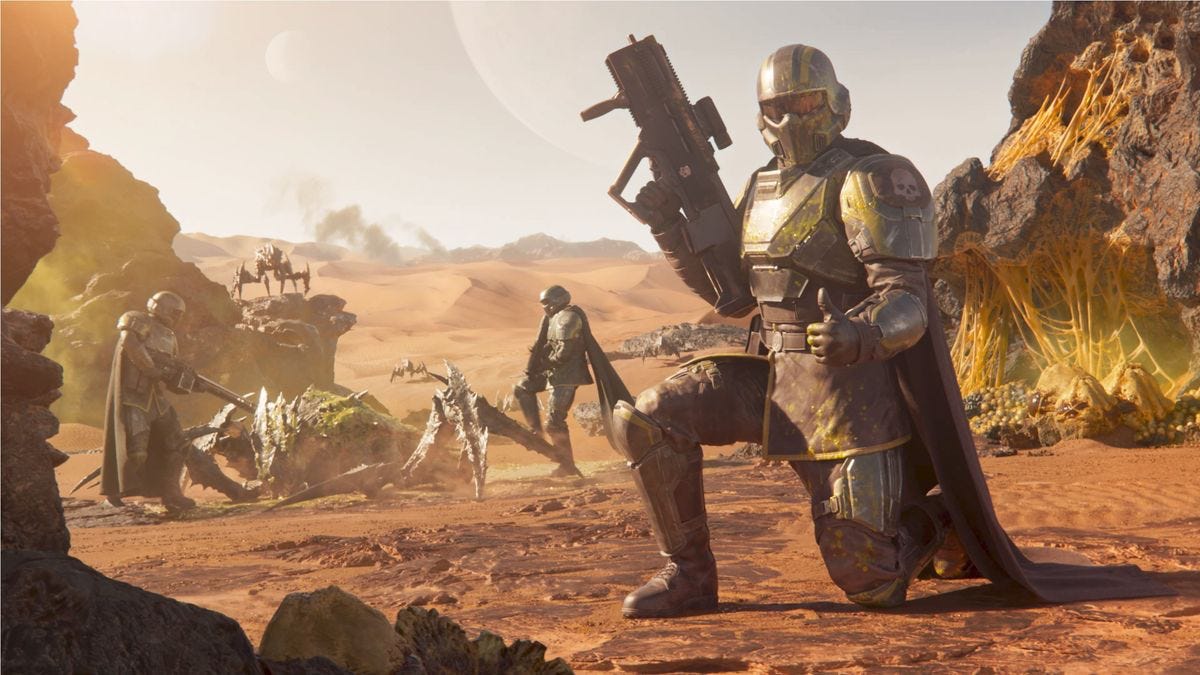
The mobile market in the USA grew by 3% in March. 89% of this month's growth was driven by the mobile market.
-
PC game sales, cloud services, and VR content outside of consoles grew by 2%.
Bestselling Games
-
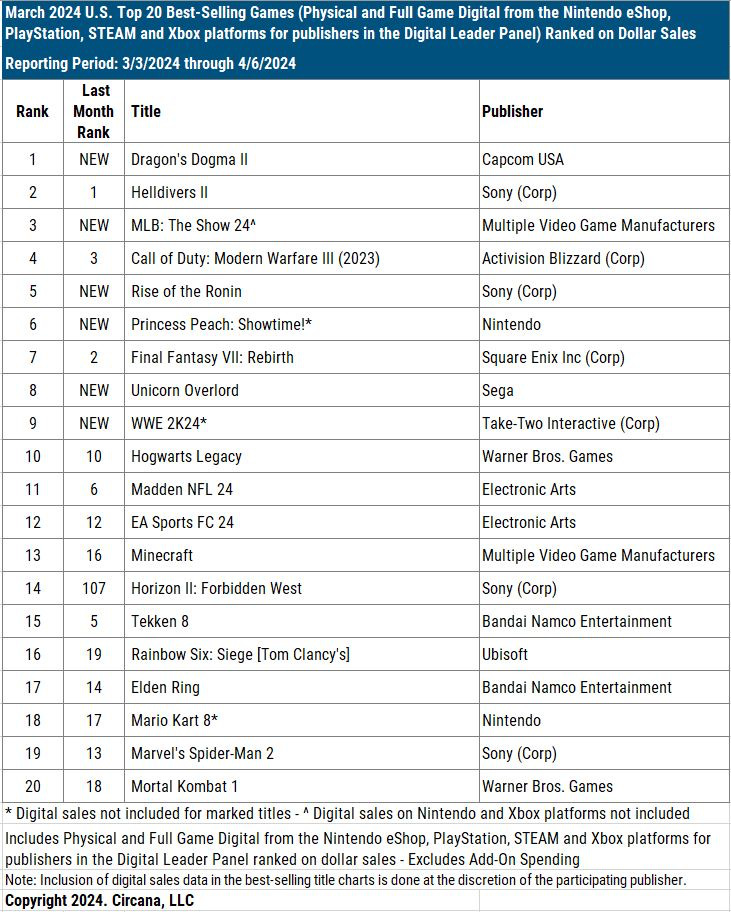
The best-selling game in March 2024 in the USA was Dragon’s Dogma II. Helldivers II dropped to second place.
-
March saw many new releases - MLB: The Show 24 (3rd place); Rise of the Ronin (5th place); Princess Peach: Showtime! (6th place - excluding digital versions); Unicorn Overlord (8th place), and WWE 2K24 (9th place - excluding digital versions).
-
For the first 3 months of 2024, Helldivers II is a solid leader. Call of Duty: Moder Warfare III took second place, and Dragon’s Dogma II claimed the third spot.
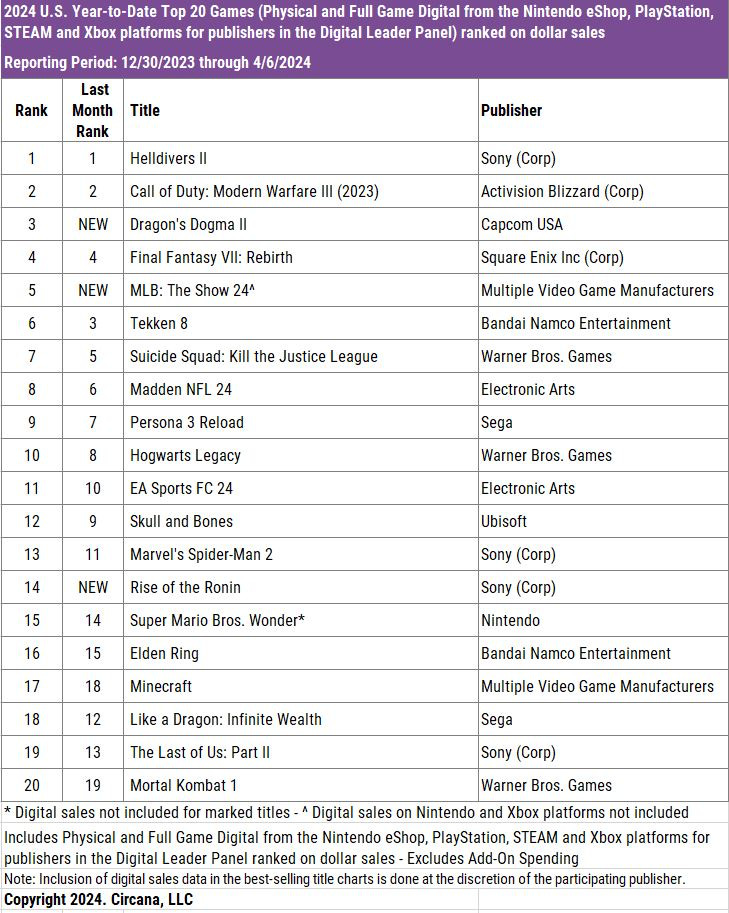
- If only the PlayStation or PC versions of Helldivers II were considered in the ranking, the game would still be in first position. The release was that successful.
-
In just one month, Dragon’s Dogma II sales surpassed the combined sales of the original Dragon’s Dogma and Dragon’s Dogma: Dark Arisen.
-
Helldivers II is currently the 7th best-selling game in Sony's history in the American market. Without the PC version, it wouldn't even be in the top-20. Thus, the simultaneous release on PlayStation and PC was a huge success for Sony.
-
Final Fantasy VII: Rebirth is currently the 14th in the Final Fantasy series in terms of sales in the American market. Final Fantasy XV holds the top spot, followed by Final Fantasy VII: Remake and the original Final Fantasy VII.
-
The revenue leaders in the American mobile market were Monopoly GO!, Royal Match, and Roblox.
-
The fastest-growing game in the mobile market in March 2024 was Last War: Survival Game. The project grew by 40% in revenue compared to the previous month.
PC/Console Charts
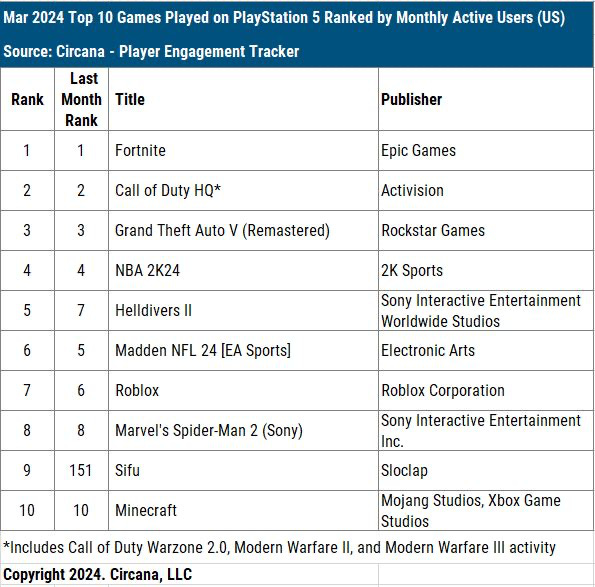
- Fortnite, Call of Duty, and GTA V are the leaders in MAU (Monthly Active Users) on PlayStation. Helldivers II rose to the 5th position; Roblox finished at 7th place. Thanks to PS Plus, Sifu entered the chart at 9th place.
-
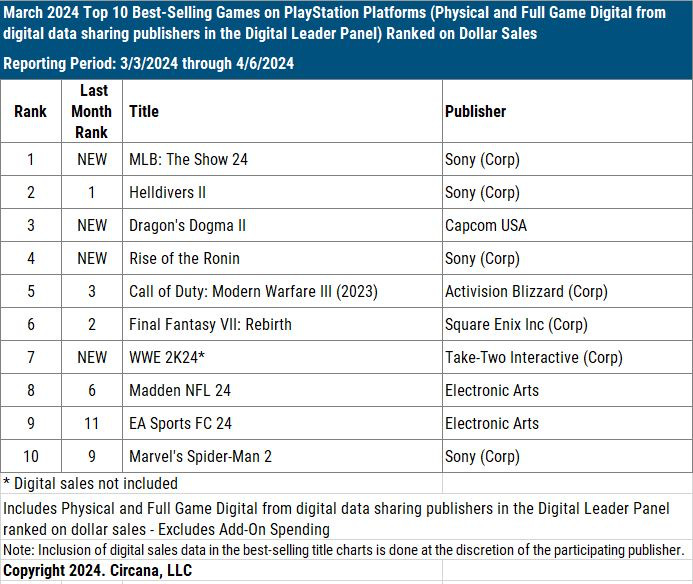
The best-selling games in March on PlayStation are MLB: The Show 24, Helldivers II, and Dragon’s Dogma II. New releases include Rise of the Ronin (4th place) and WWE 2K24 (7th place - excluding digital copies).
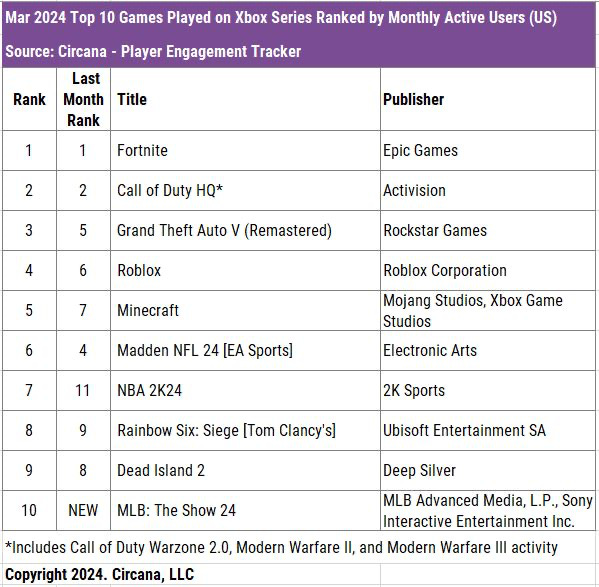
- The MAU leaders on Xbox in the USA are the same as on PlayStation - Fortnite, Call of Duty, and GTA V. MLB: The Show 24, which is developed by Sony, is also in the top 10.
-
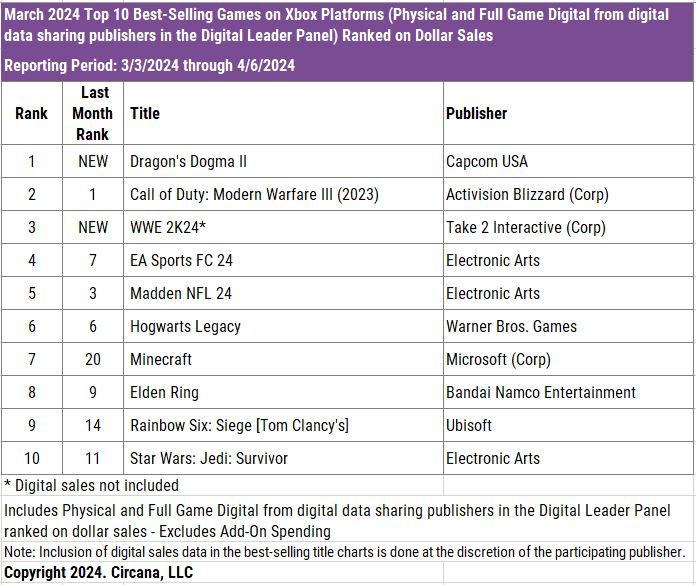
The top-selling games in March on Xbox are Dragon’s Dogma II, Call of Duty: Modern Warfare III, and WWE 2K24. Overall, Xbox's chart is more stable than PlayStation's.
-
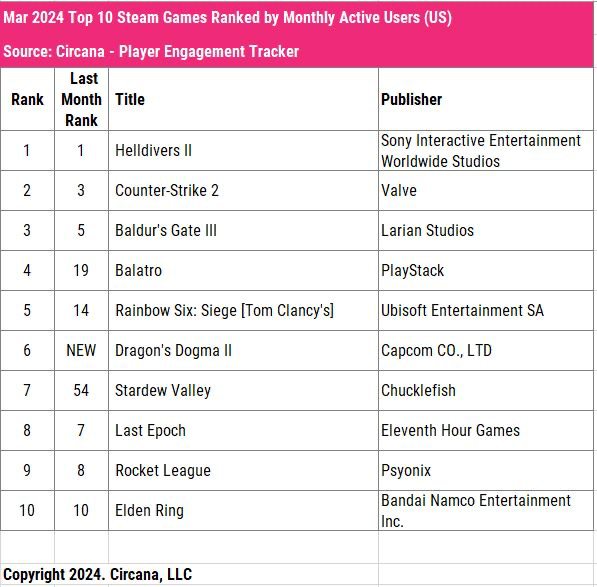
Helldivers II is the MAU leader on PC. Counter-Strike 2 is in second place, and Baldur’s Gate III is in third. Dragon’s Dogma II is in 6th position.
-
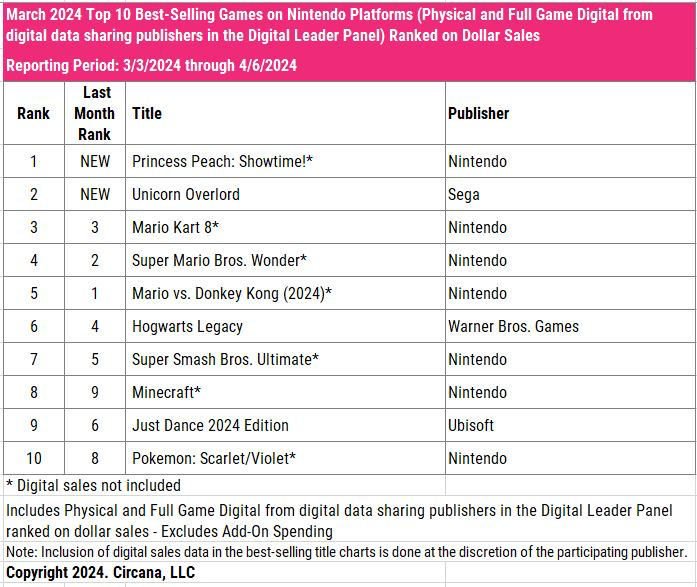
The best-selling games on Nintendo Switch are Princes Peach: Showtime! (excluding digital versions), Unicorn Overlord, and Mario Kart 8 (also excluding digital versions).
Liftoff & GameRefinery: Casual Games in 2024
The data for the report was collected from April 1, 2023, to April 1, 2024. 355B impressions, 36B clicks, and 90M installations were tracked.
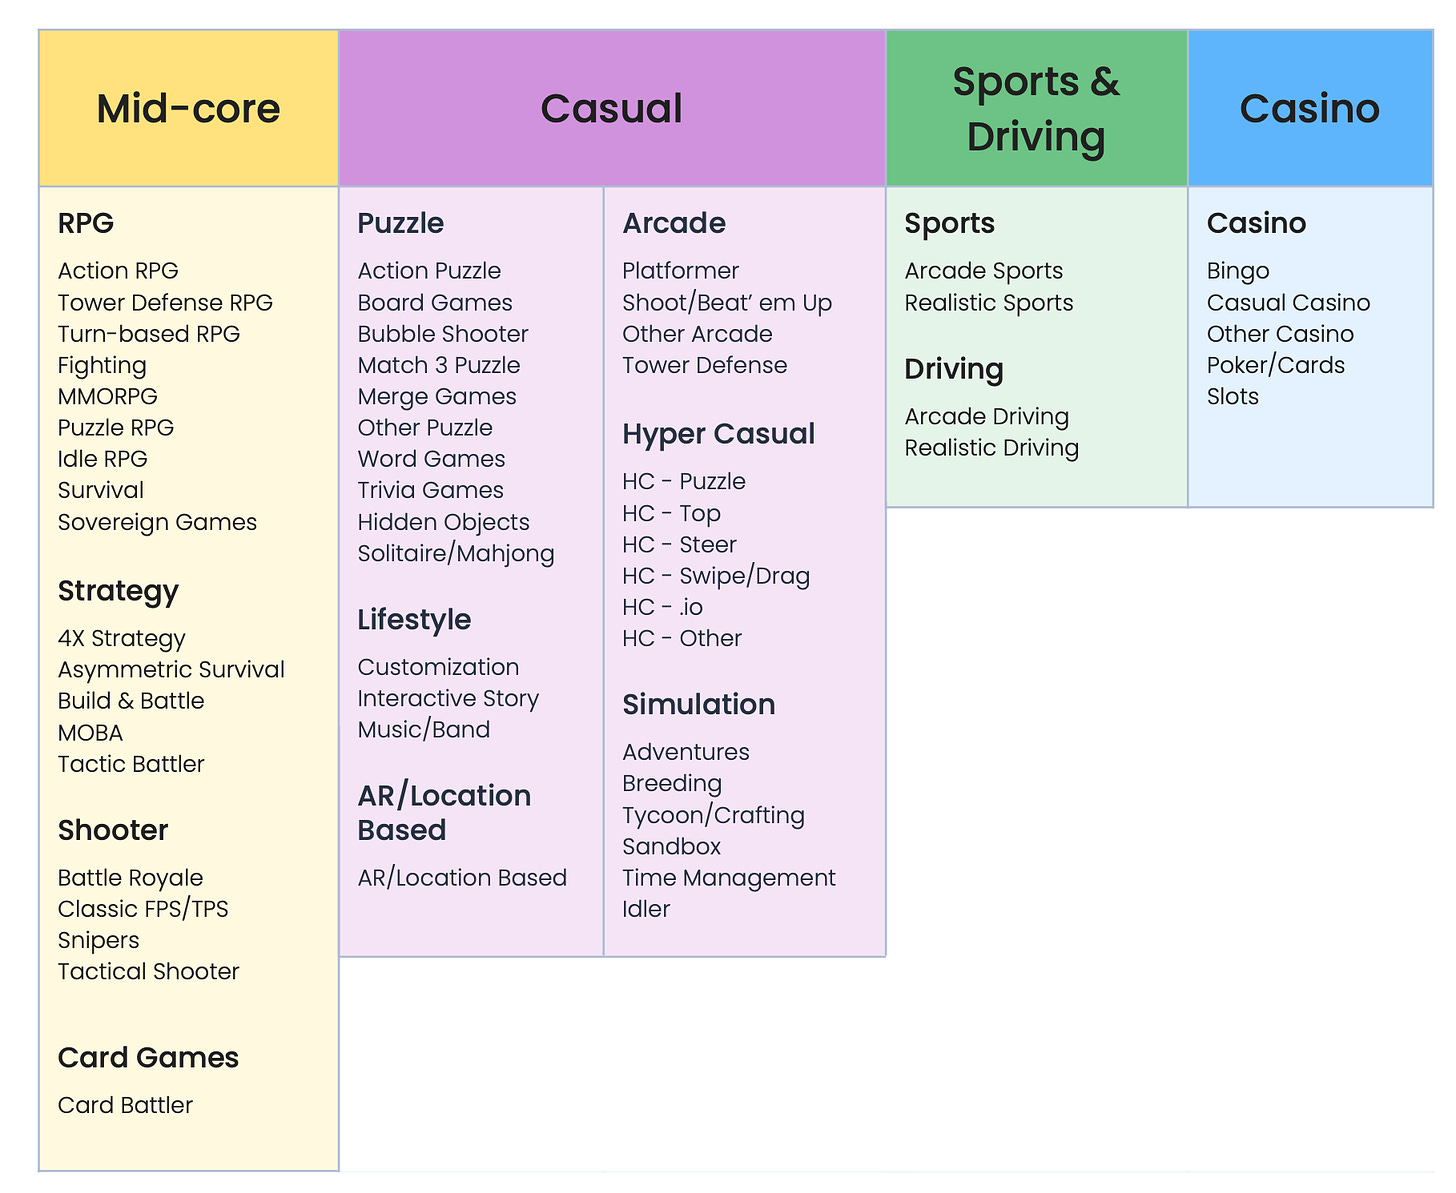
Liftoff and GameRefinery consider puzzle games, lifestyle projects (interactive stories, musical projects), and simulators (city builders, adventure projects) as casual games. Hyper-casual games are also taken into account.
CPI Benchmarks
-
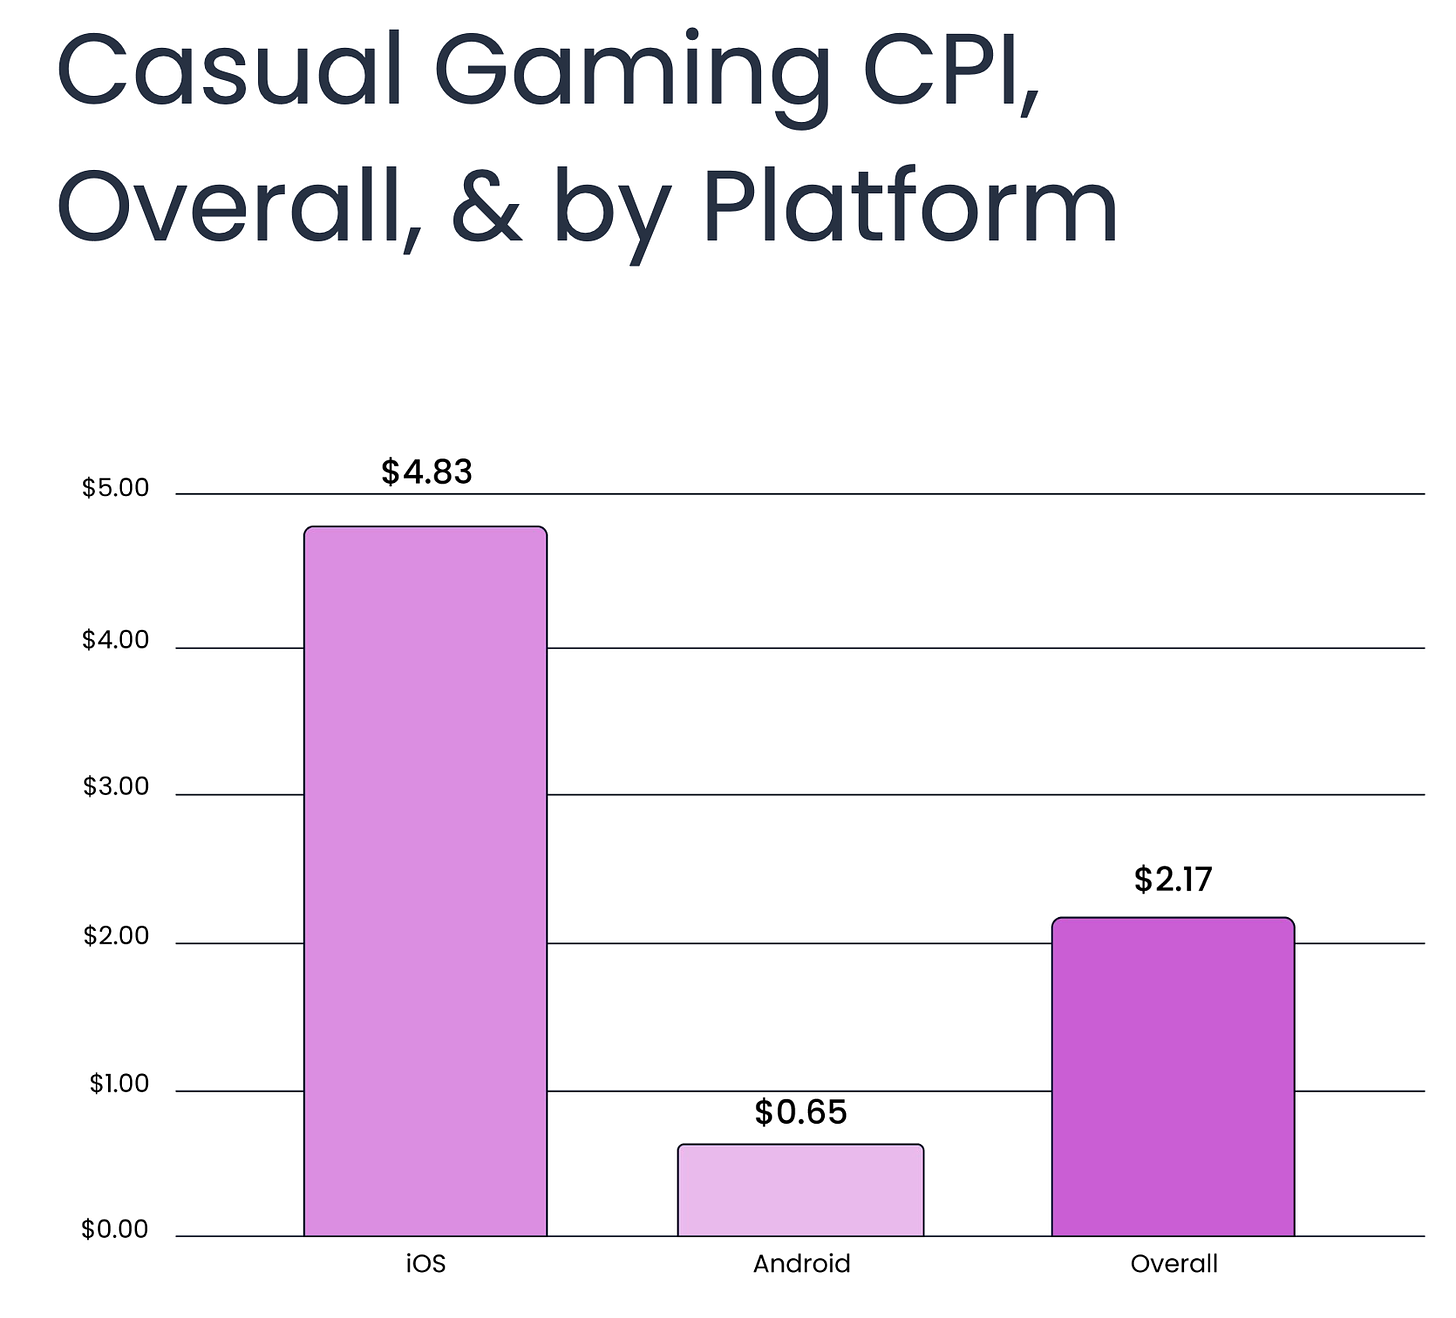
Average CPI for casual games - $2.17. On Android - $0.65; on iOS - $4.83.
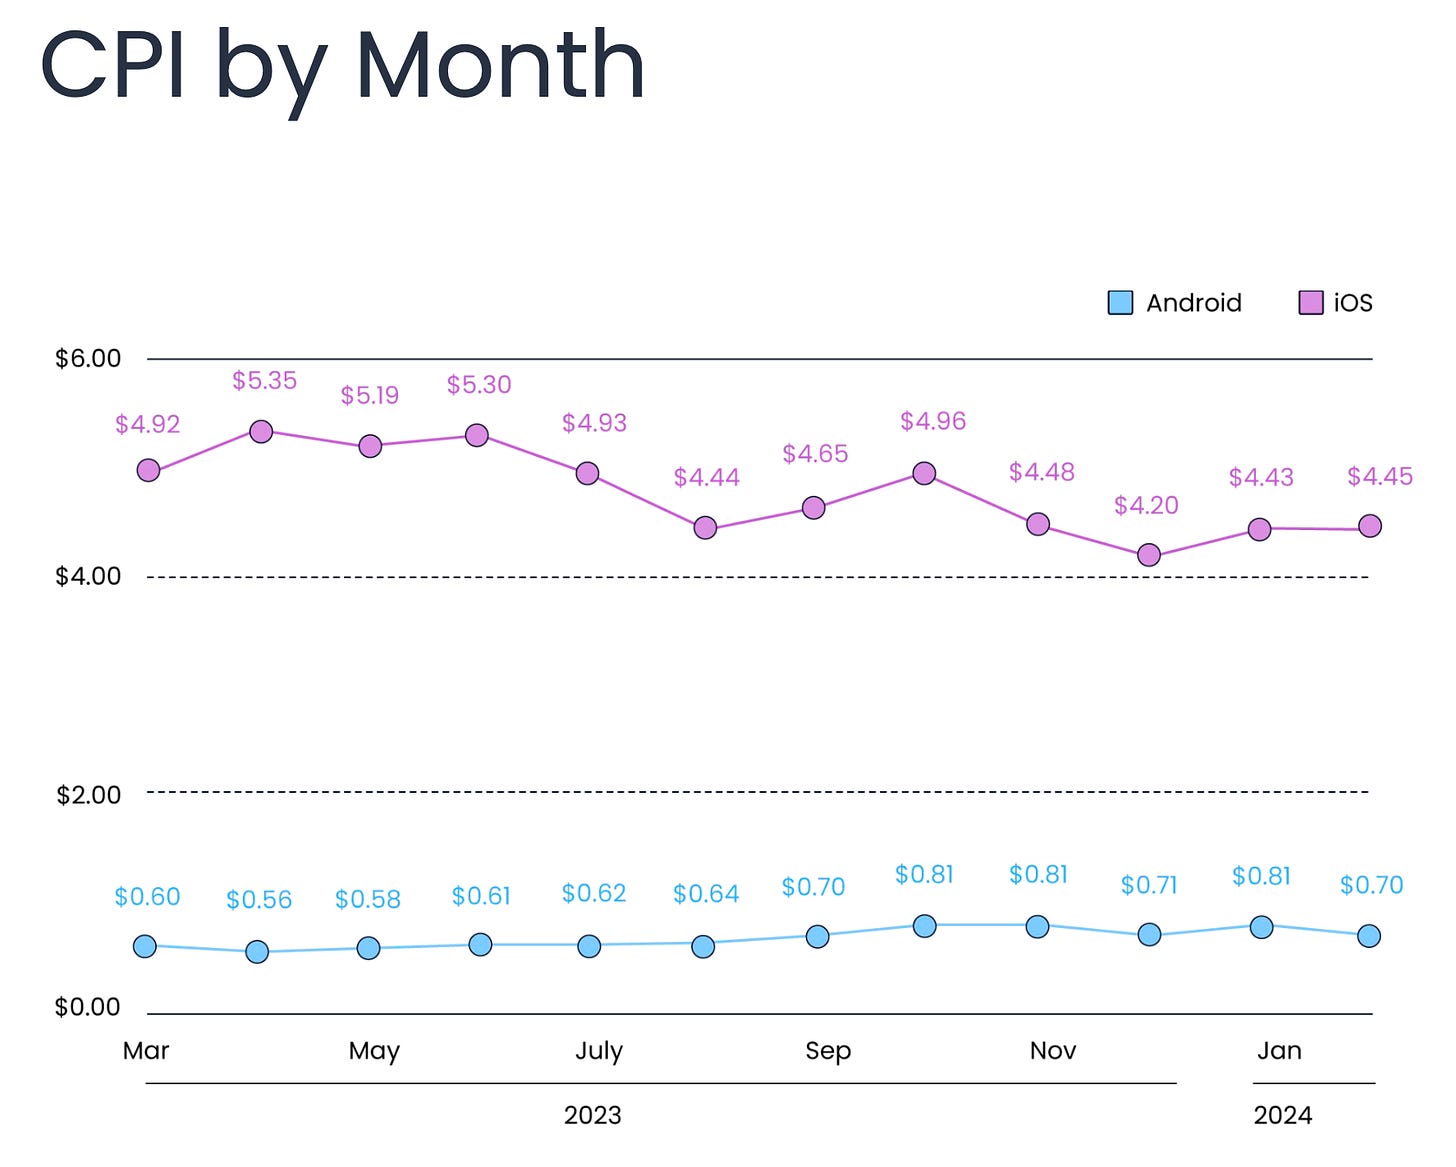
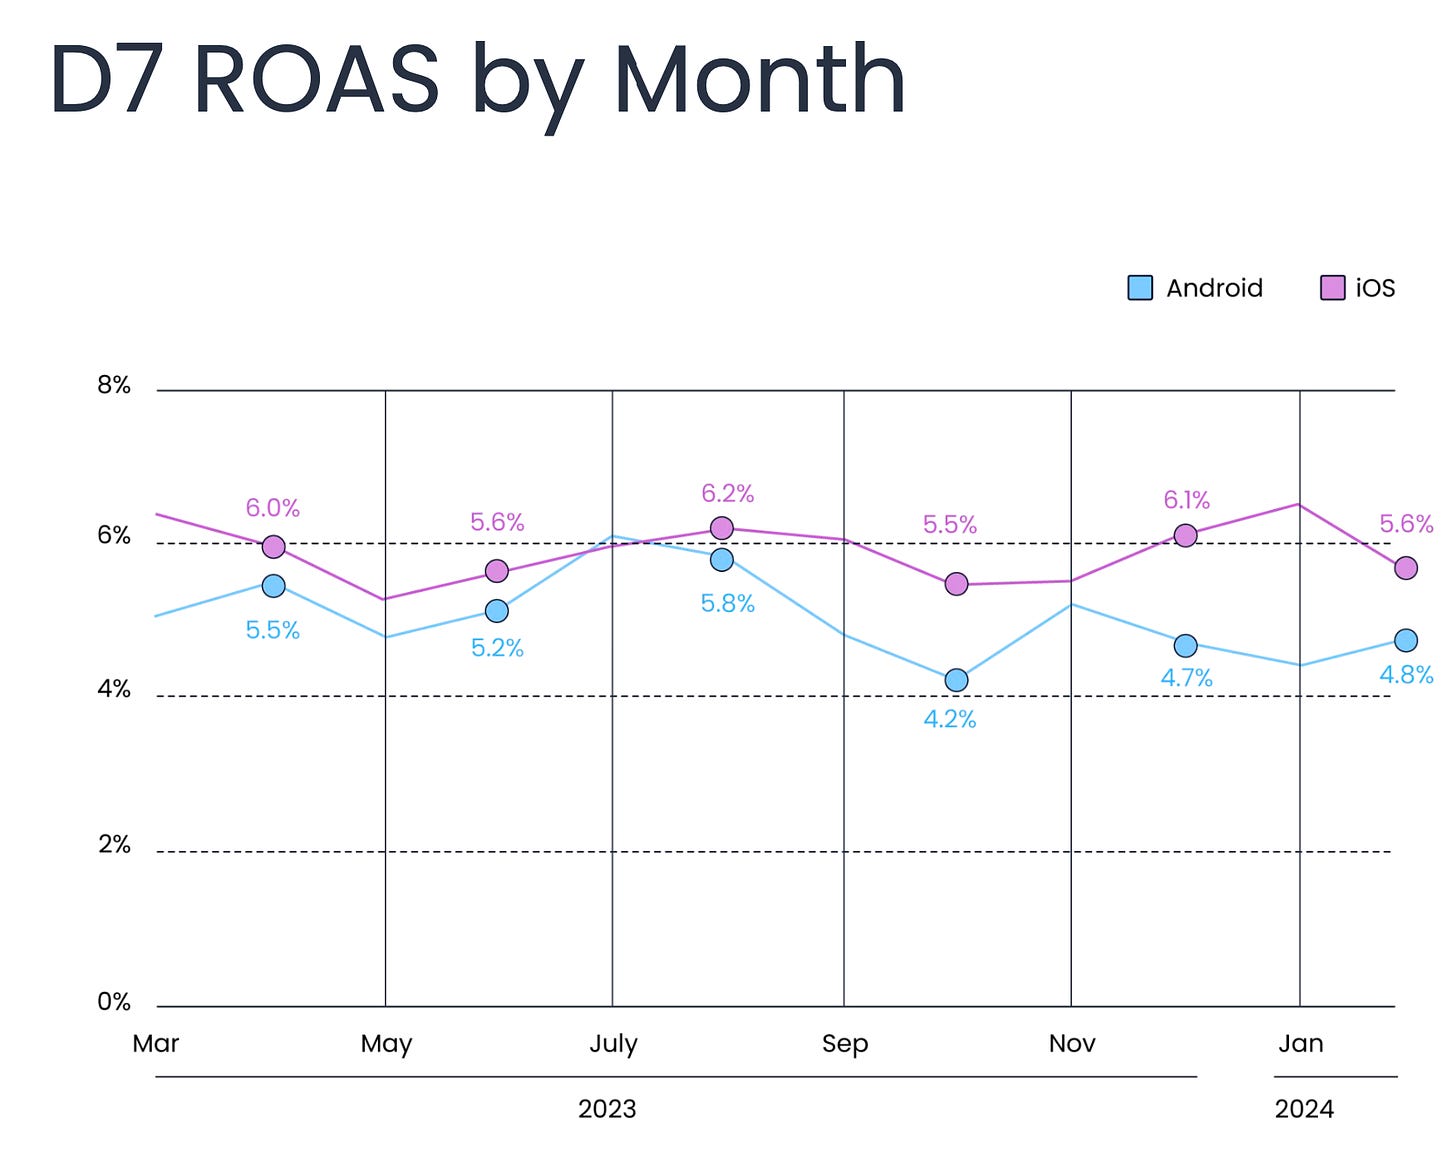
- On iOS, the highest CPI in 2023 was from March to May, after which it declined. On Android, however, growth occurred in the second half of the year - from September to December. Thus, platform seasonality is not identical.
-
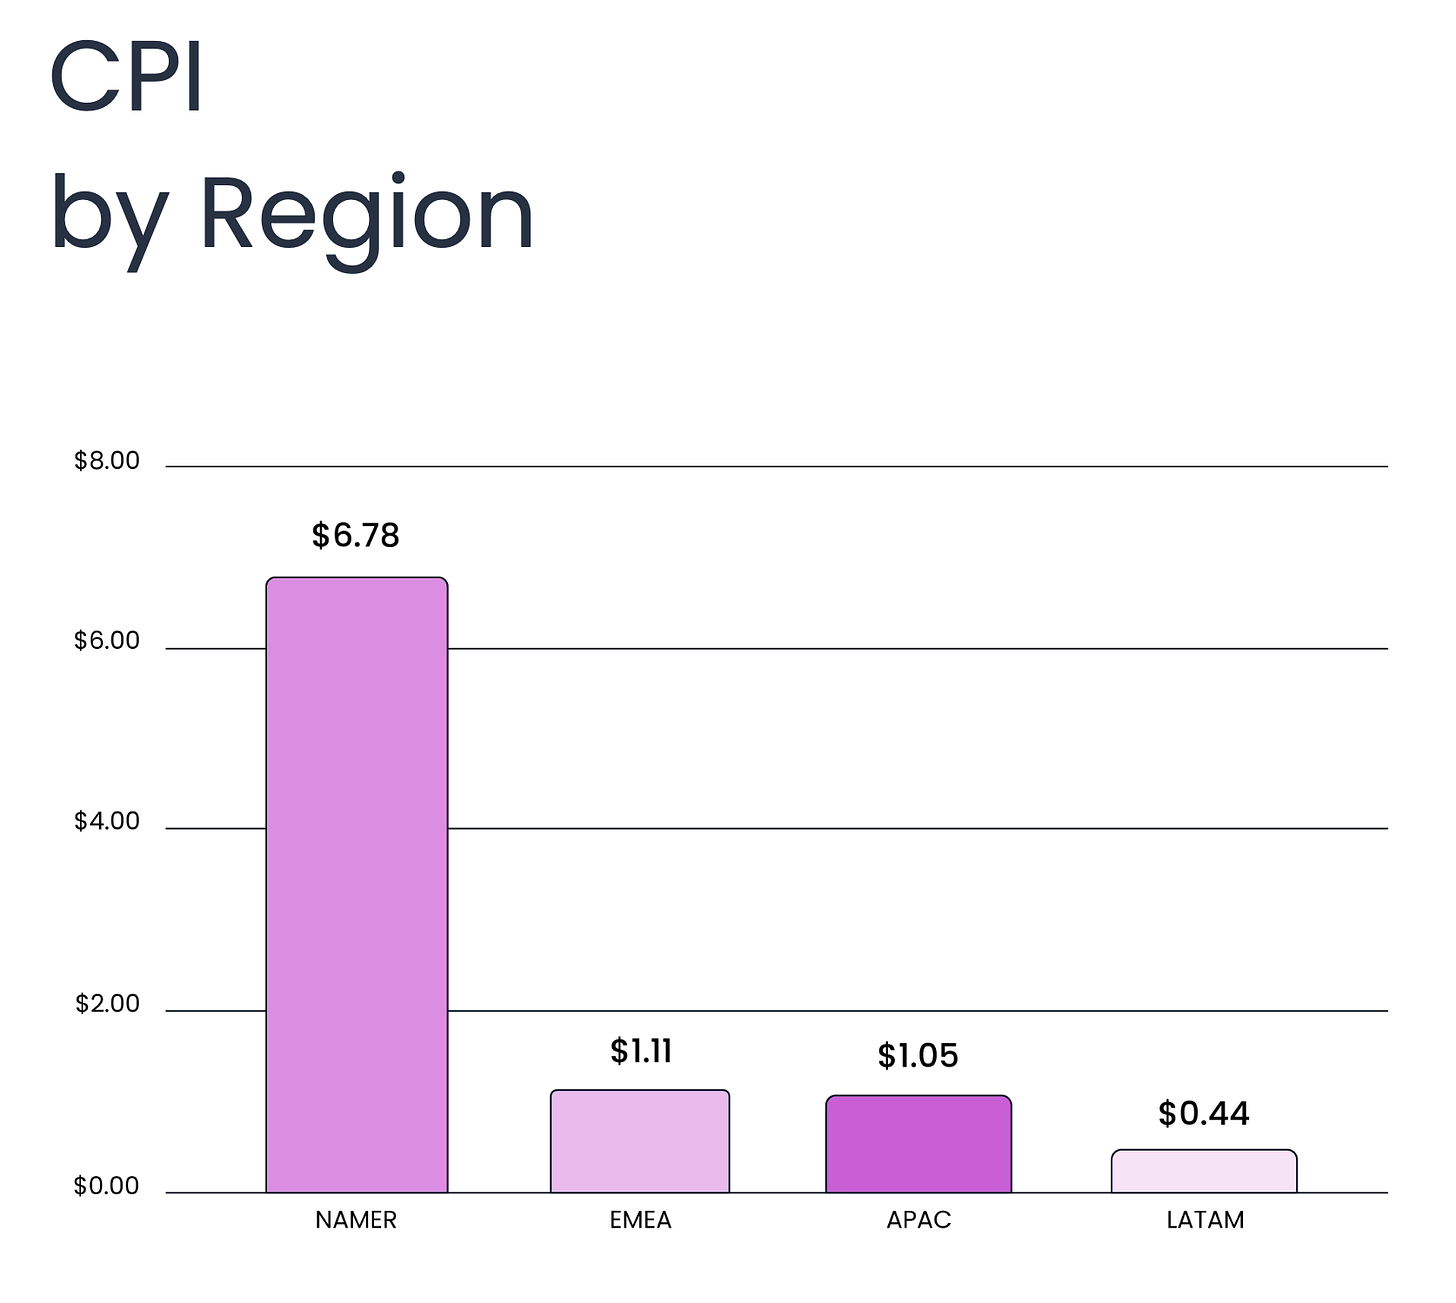
$6.78 - average CPI in casual games in North America (NAMER). In EMEA - $1.11; in APAC - $1.05; in LATAM - $0.44.
-
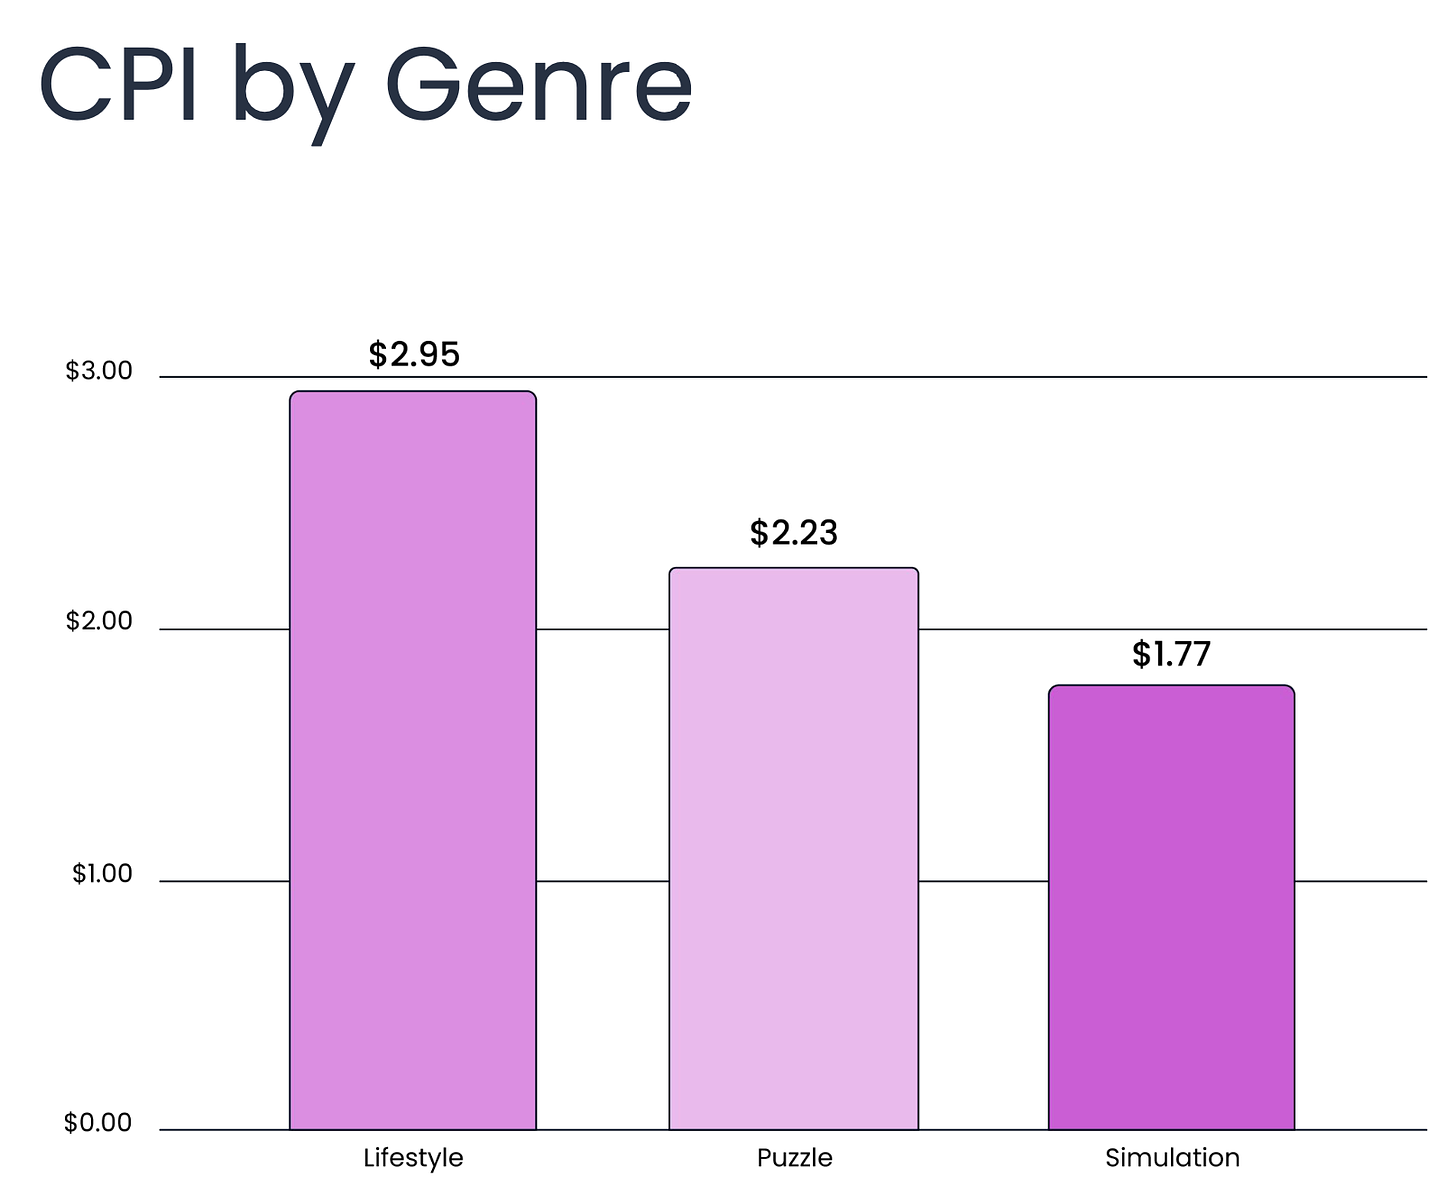
The highest CPI is for lifestyle projects - $2.95; puzzles - $2.23; followed by simulators - $1.77.
D7 ROAS Benchmarks
-
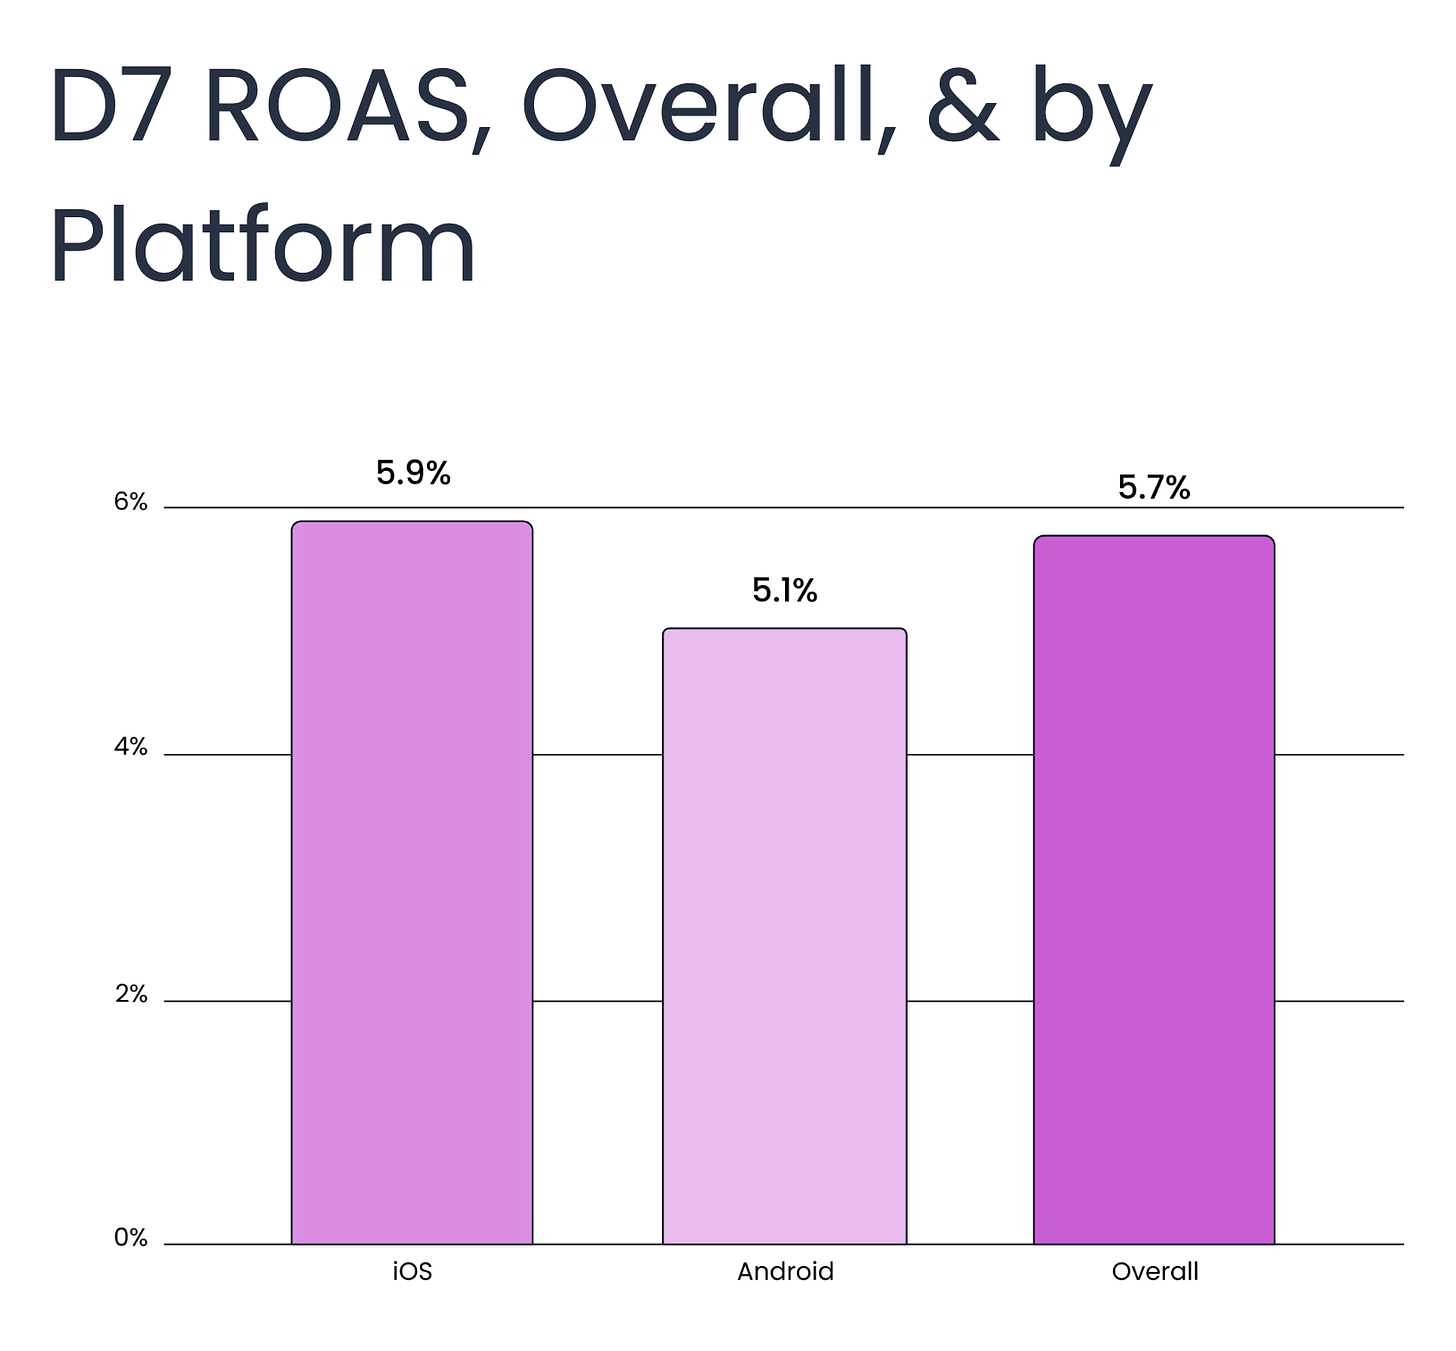
Average D7 ROAS in the casual genre - 5.7%. Slightly lower on Android - 5.1%; higher on iOS - 5.9%.
-
In the NAMER region, the average D7 ROAS reaches 6%; in EMEA - 5.3%; in APAC - 5.3%; in LATAM - 4.6%.
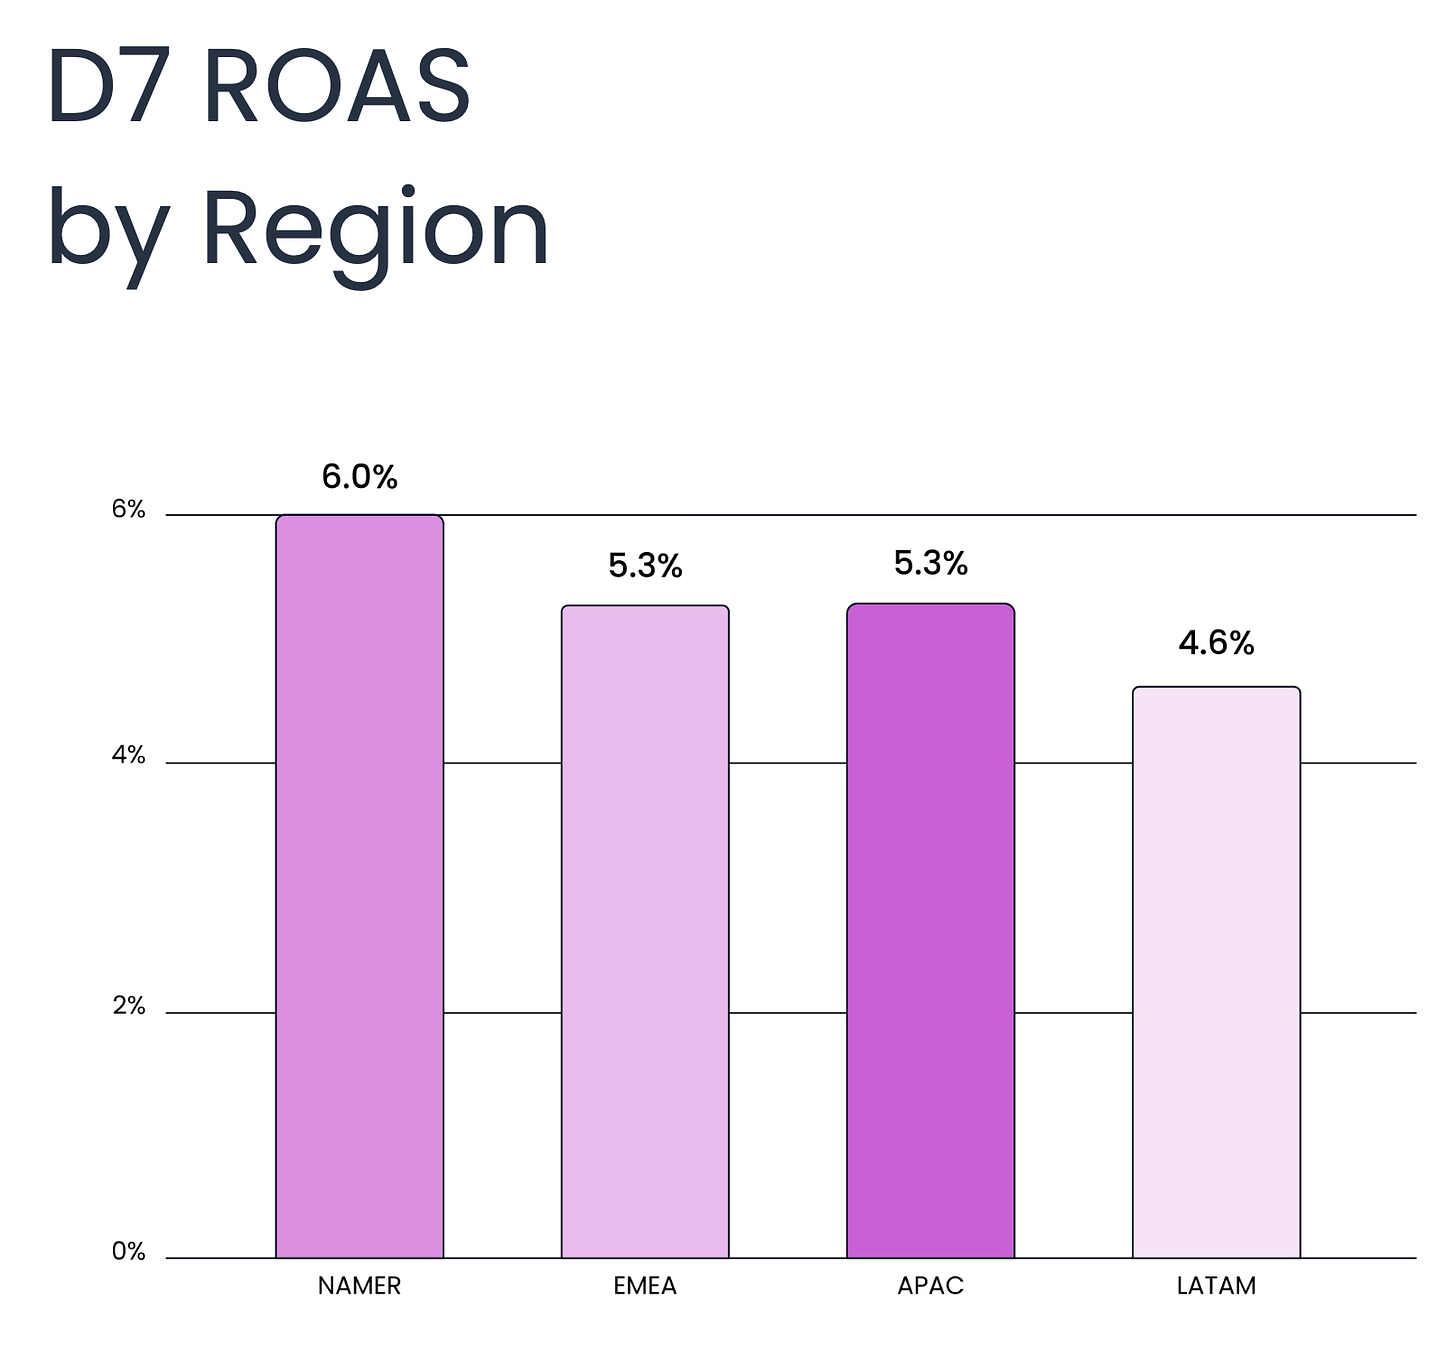
❗️I’d like to note that the figures are market averages. For successful products, both CPI and ROAS metrics can be (and most likely are) significantly different.
Downloads Sources
-
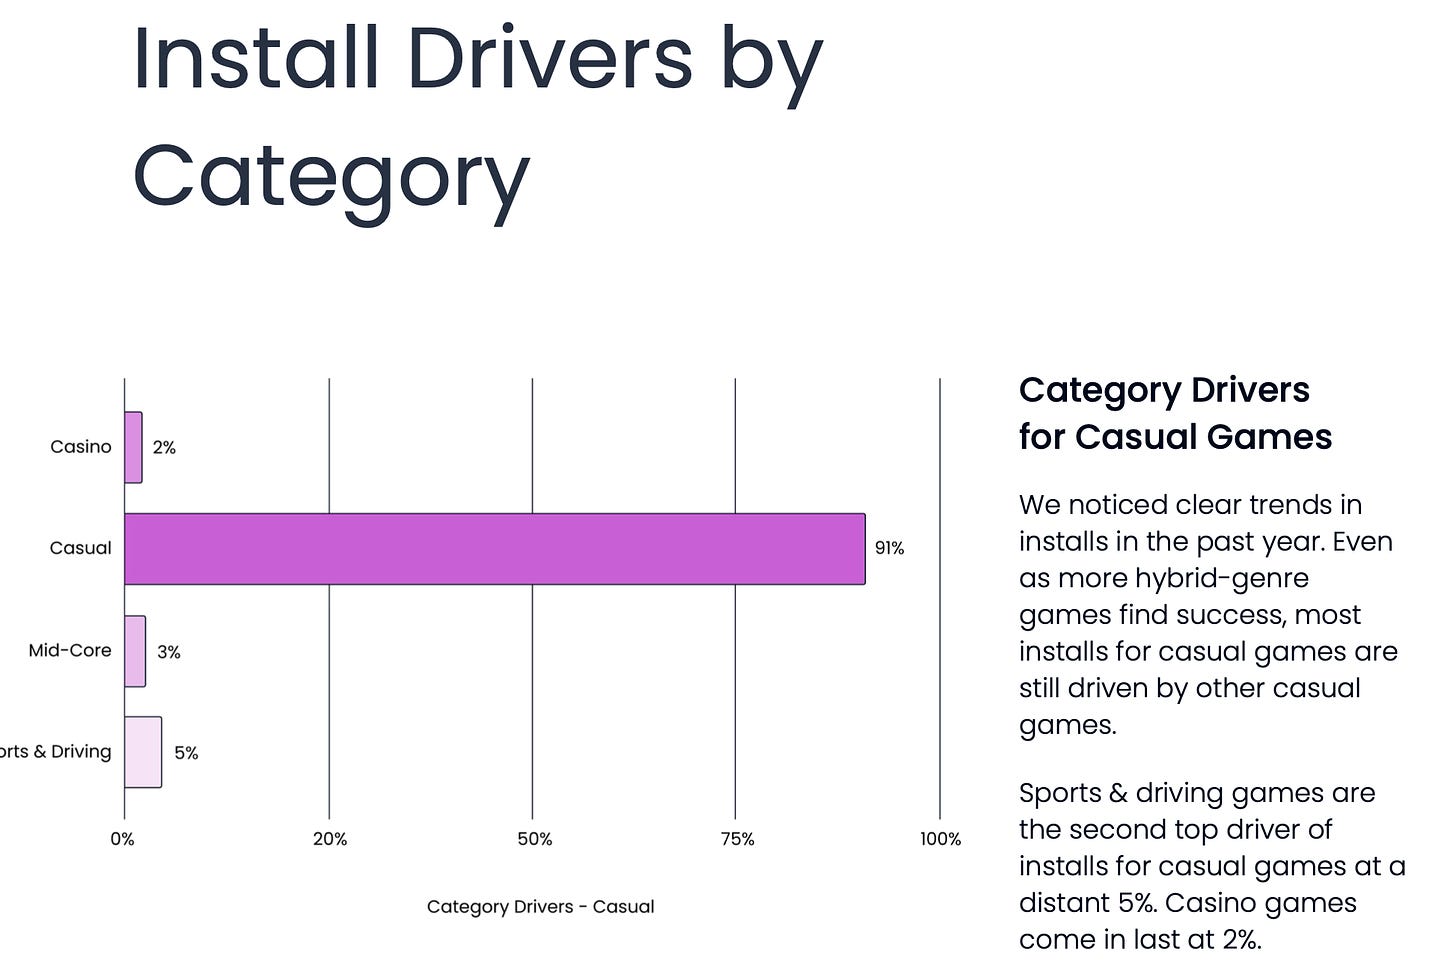
91% of traffic for casual games comes from... other casual games. 5% - from racing and sports games. 3% - from mid-core projects. 2% - from casinos.
-
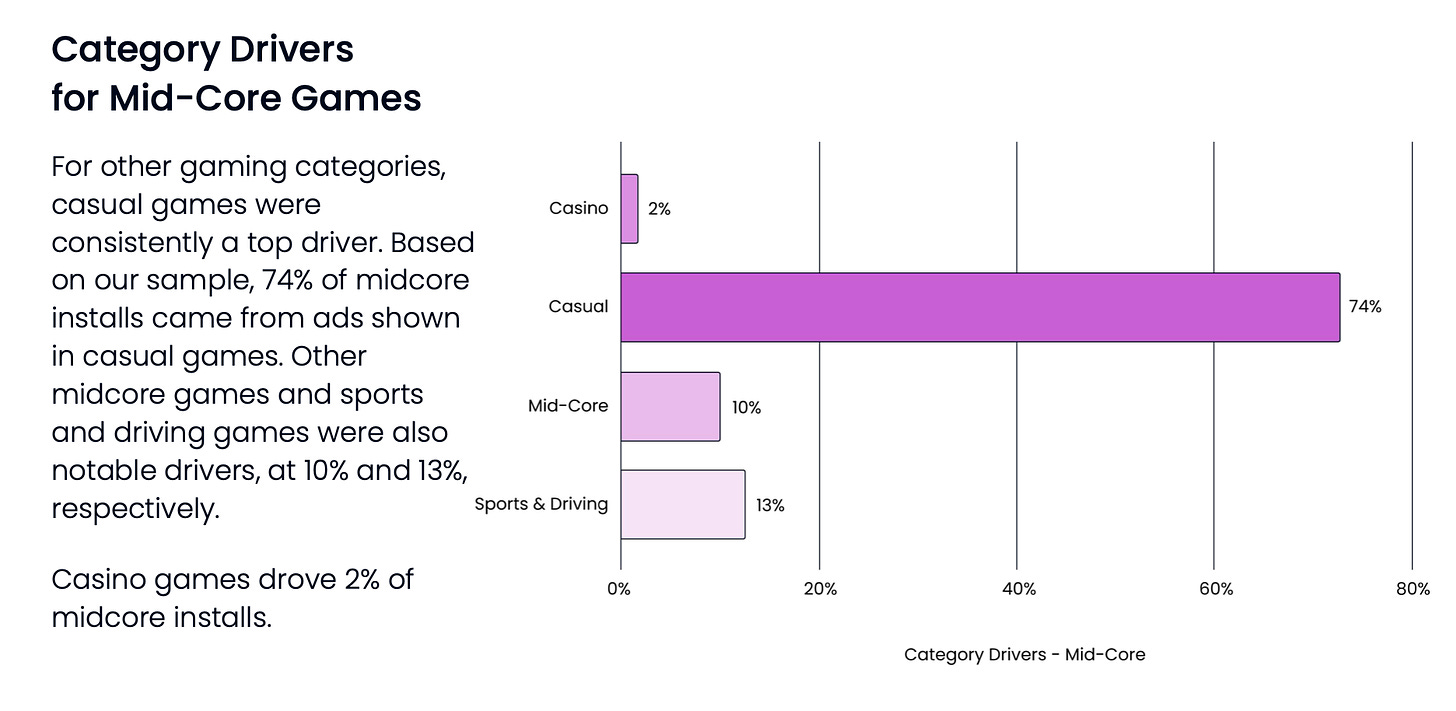
However, 74% of installations for mid-core games also come from casual projects. 13% - from sports and racing games; 10% - from other mid-core projects; 2% - from casino titles.
-
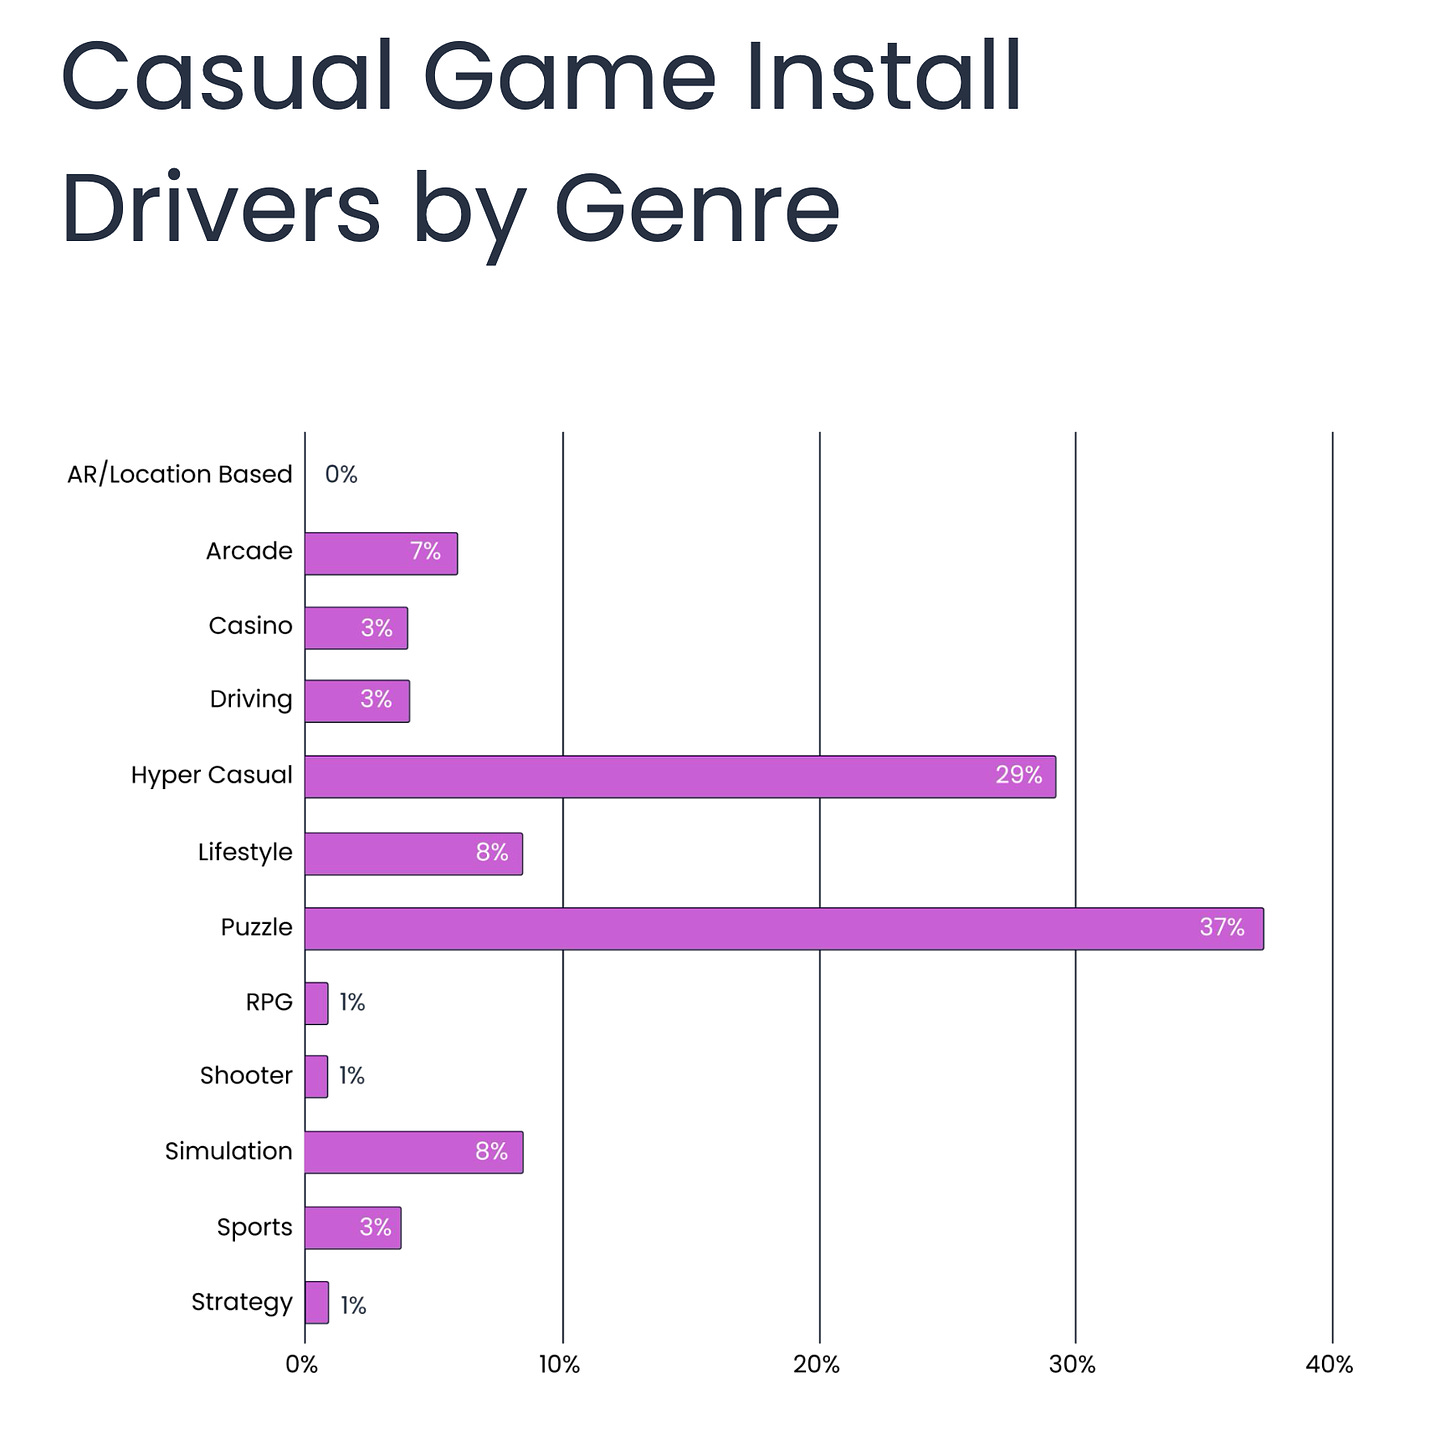
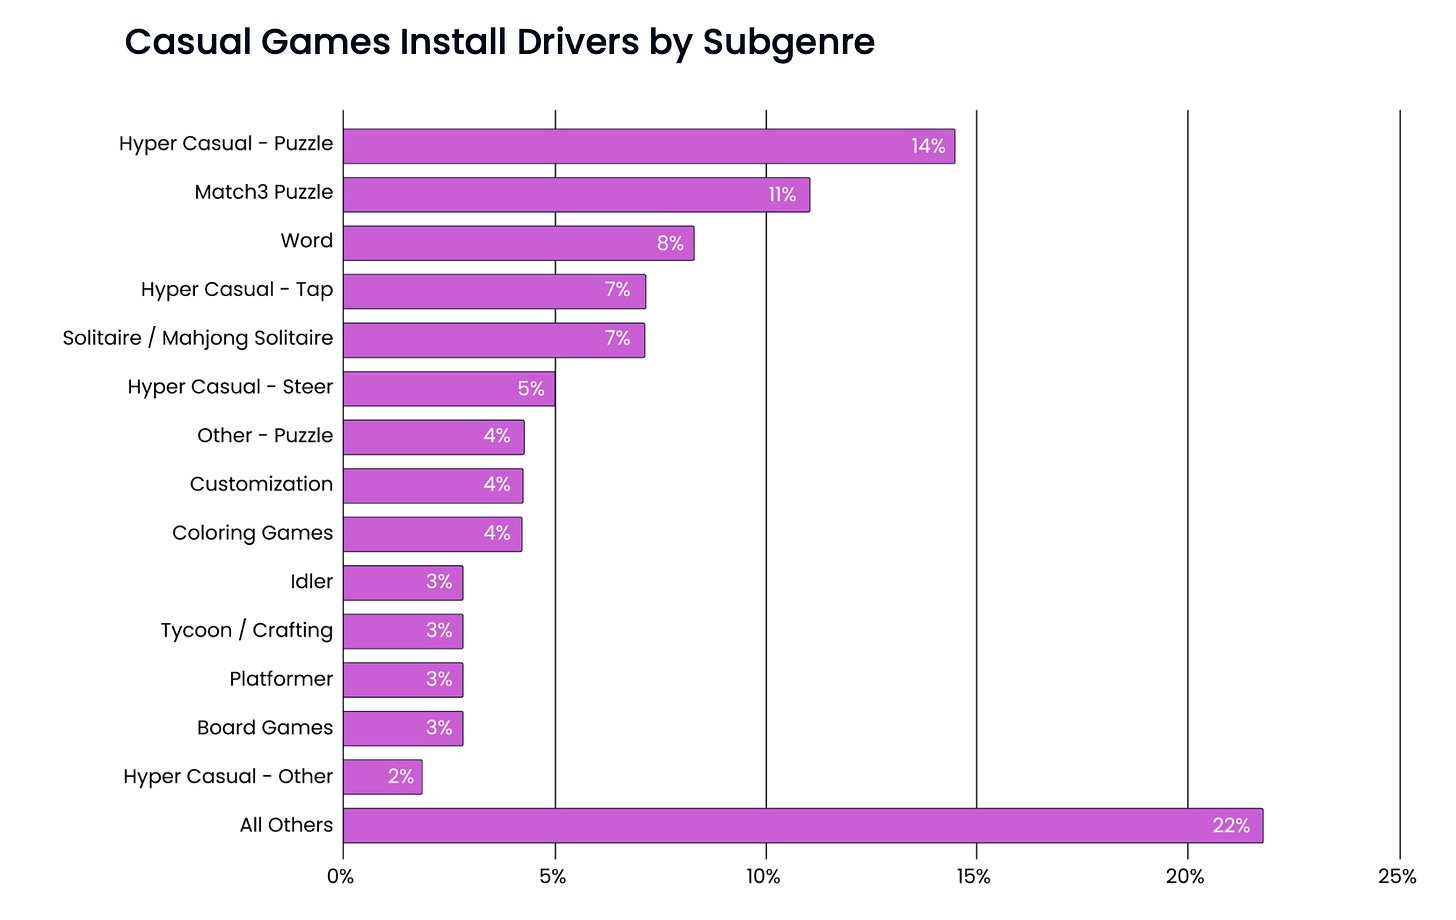
Puzzles account for 37% of all installs of casual games. Hyper-casual projects for 29% (and this share is decreasing); lifestyle projects and simulators for 8% each.
-
Looking at subgenres, hyper-casual puzzles lead - they account for 14% of downloads. They are followed by Match 3 (11%); then Word games (8%).
Noteworthy Genres and Projects
-
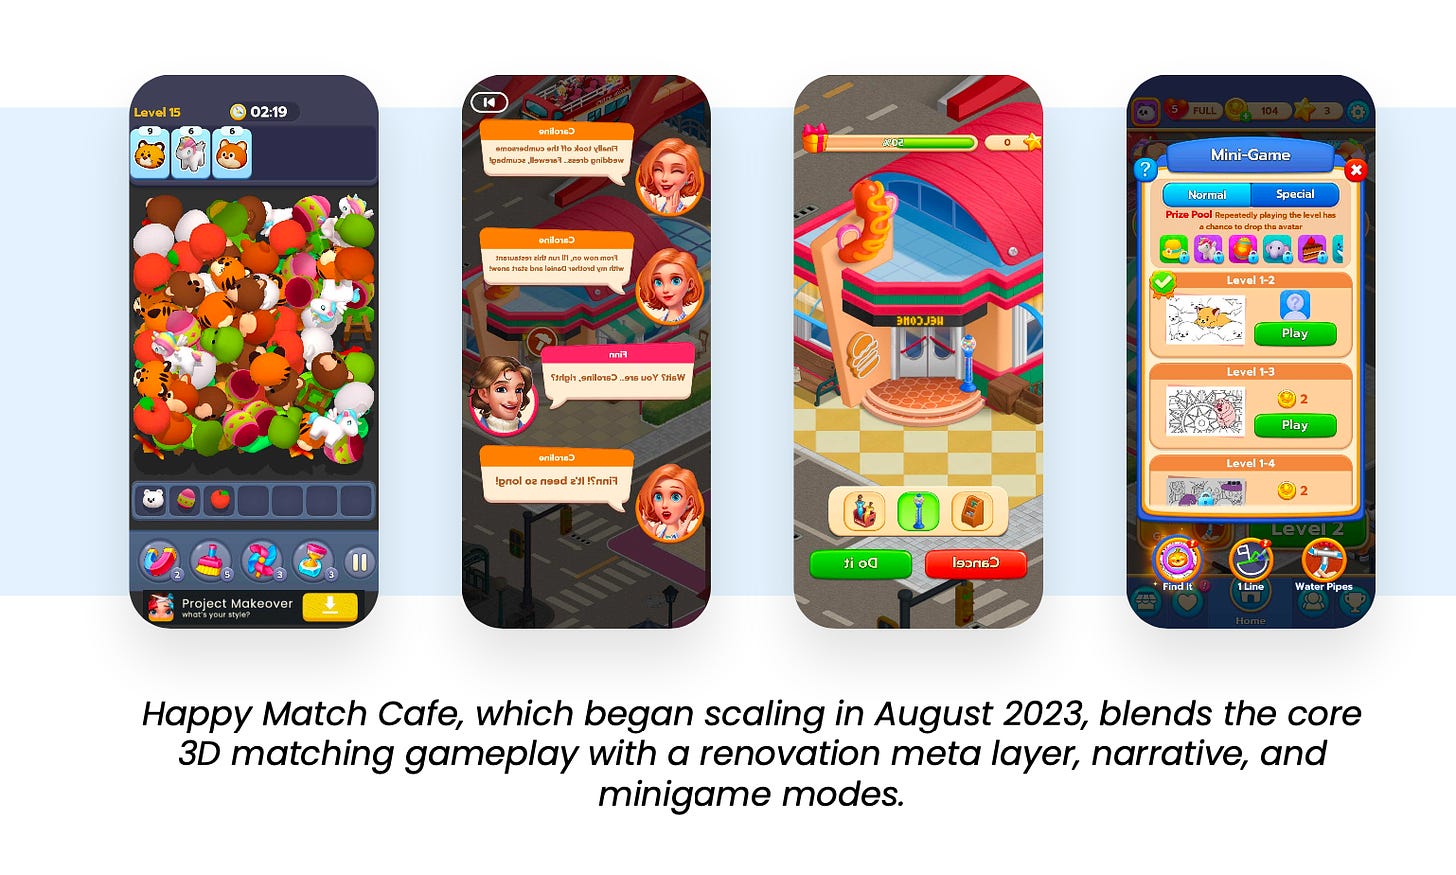
Match 3D is gaining popularity. According to GameRefinery, the subgenre market share in the top 500 in the USA grew from $2.95 million in Q4’22 to $15.25 million in Q4’23.
-
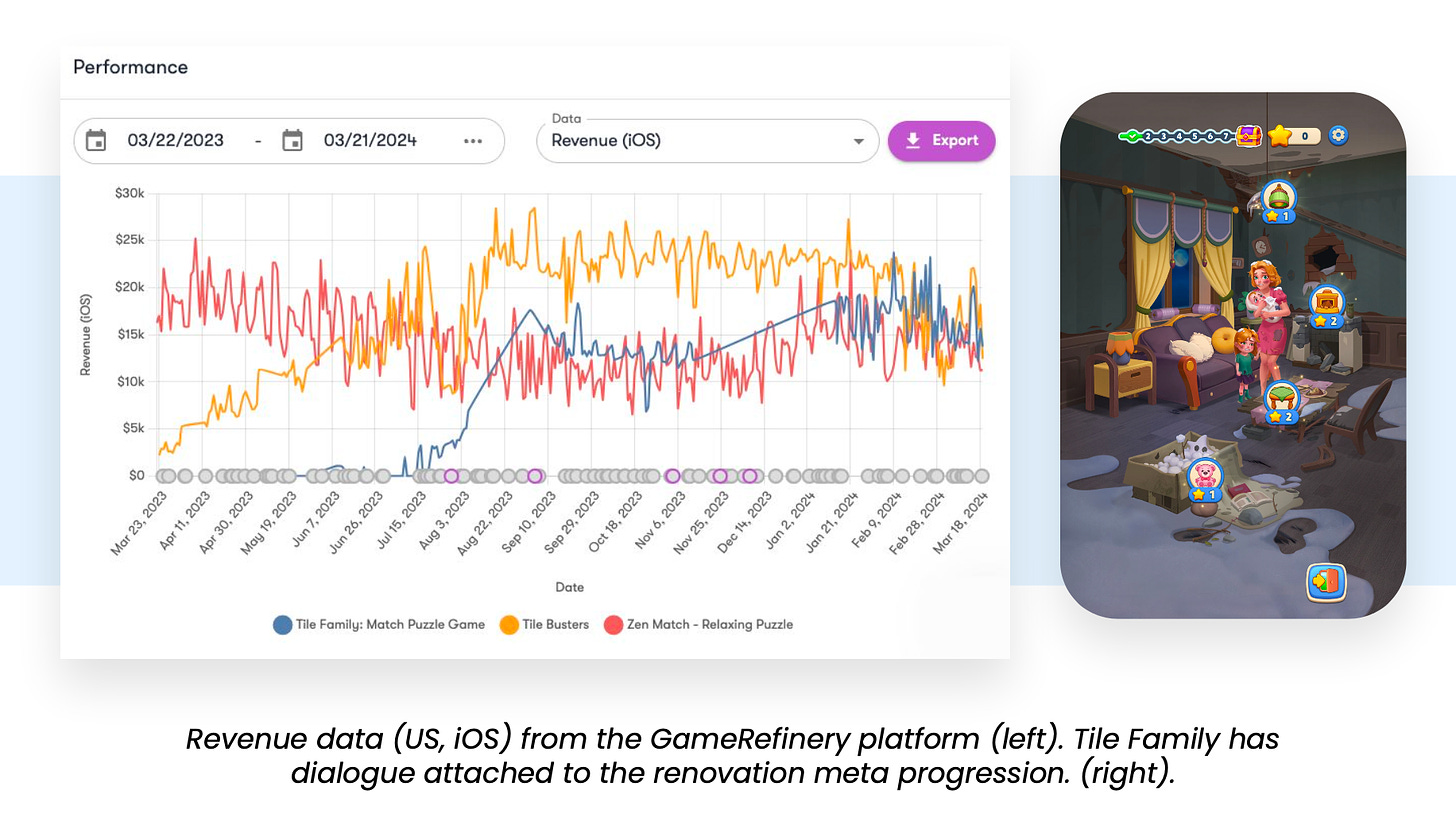
The Mahjong solitaires are showing traction. The main growth drivers are Tile Busters and Tile Family.
-
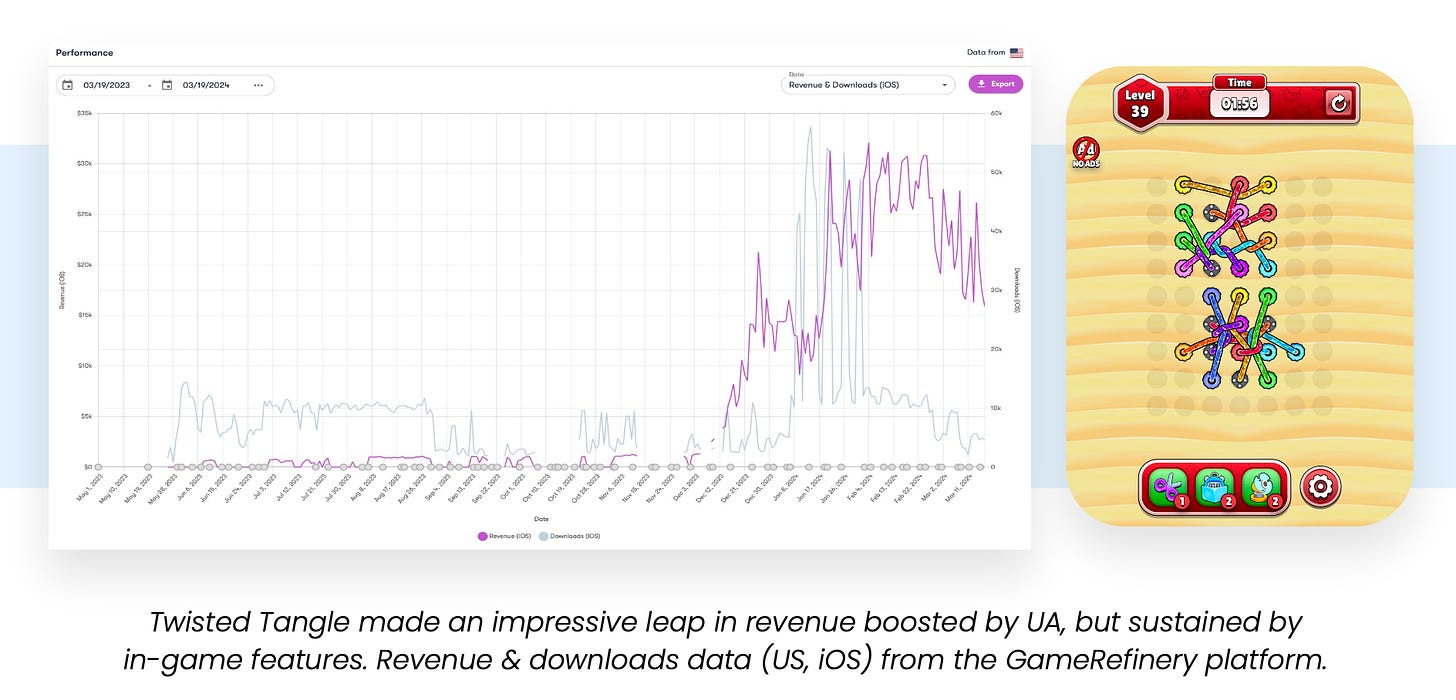
Twisted Tangle - a new hyper-casual hit from Rollic - originated from advertising creative. Since its revenue growth in December 2023, the game has solidified its position in the top 200 by revenue in the USA.
-
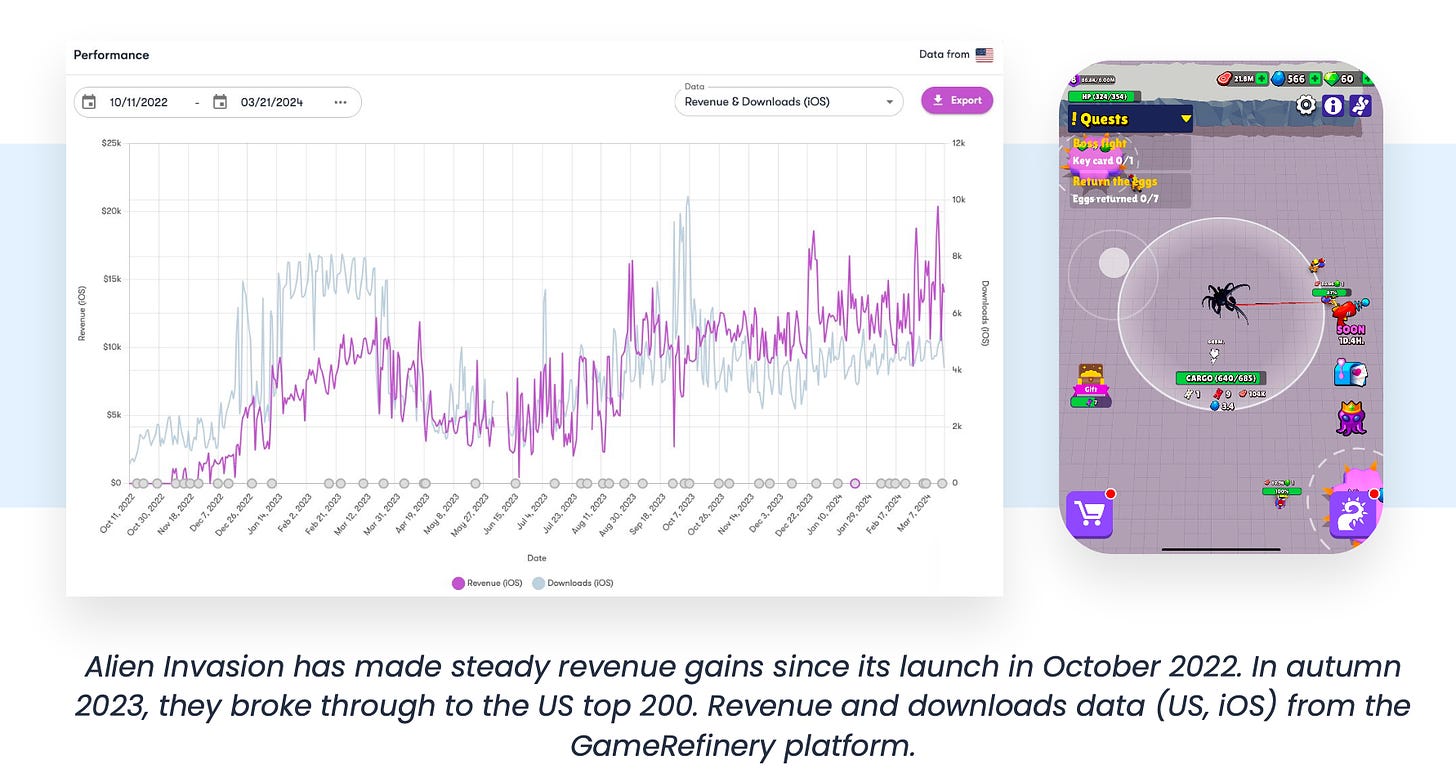
Alien Invasion continues to grow actively since its release in October 2022. This proves that hybrid casual games can linger on the market for a long time.
-
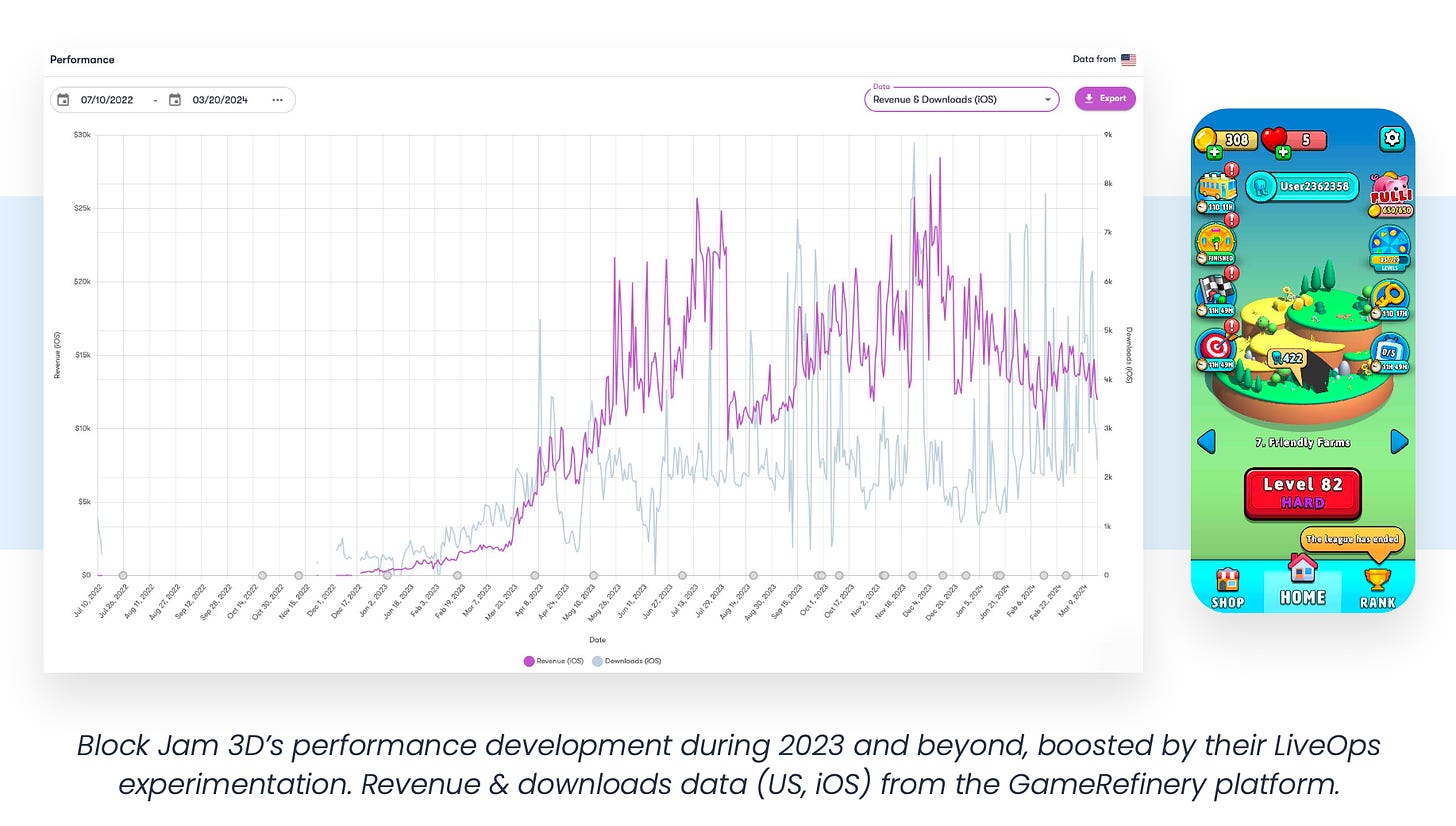
GameRefinery notes similar success with Block Jam 3D. Especially, the team praised the LiveOps of the game.
Trends in Casual Games
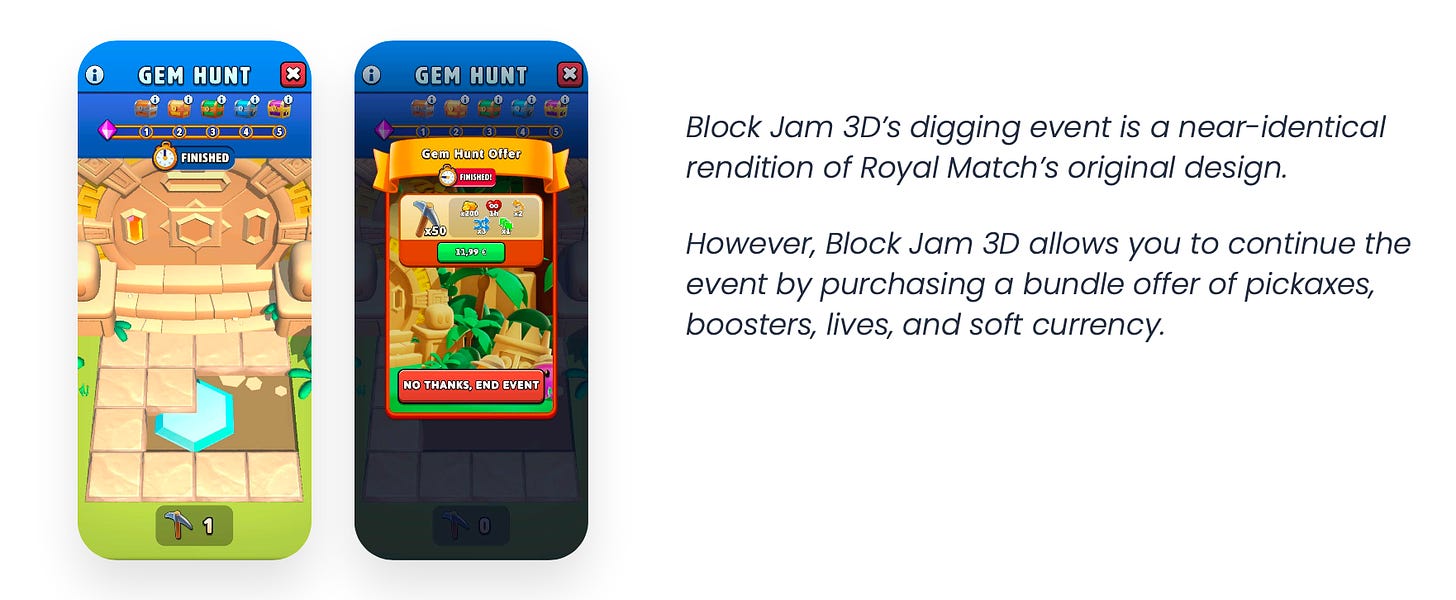
1. Digging events. They appeared in Legend of Slime; Royal Match applied the same mechanic in June 2023, becoming the first of casual games to do so. Since then, it has appeared in many other casual projects.
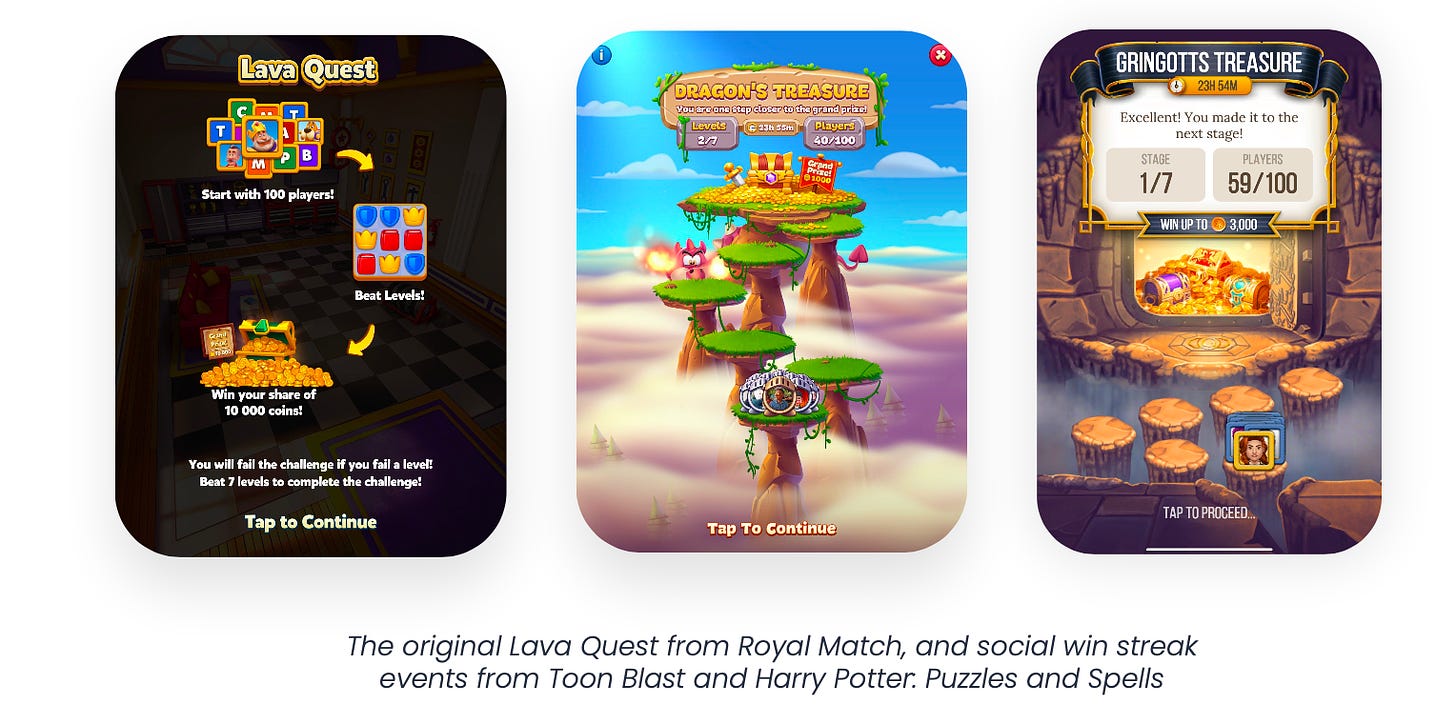
2. Social win streak events. The mechanics first appeared in Royal Match (Lava Quest) in March 2023. In this mode, the player competes with 99 other users; whoever completes successful levels in a row faster receives a reward. Toon Blast and Harry Potter: Puzzles and Spells have already implemented such mechanics.
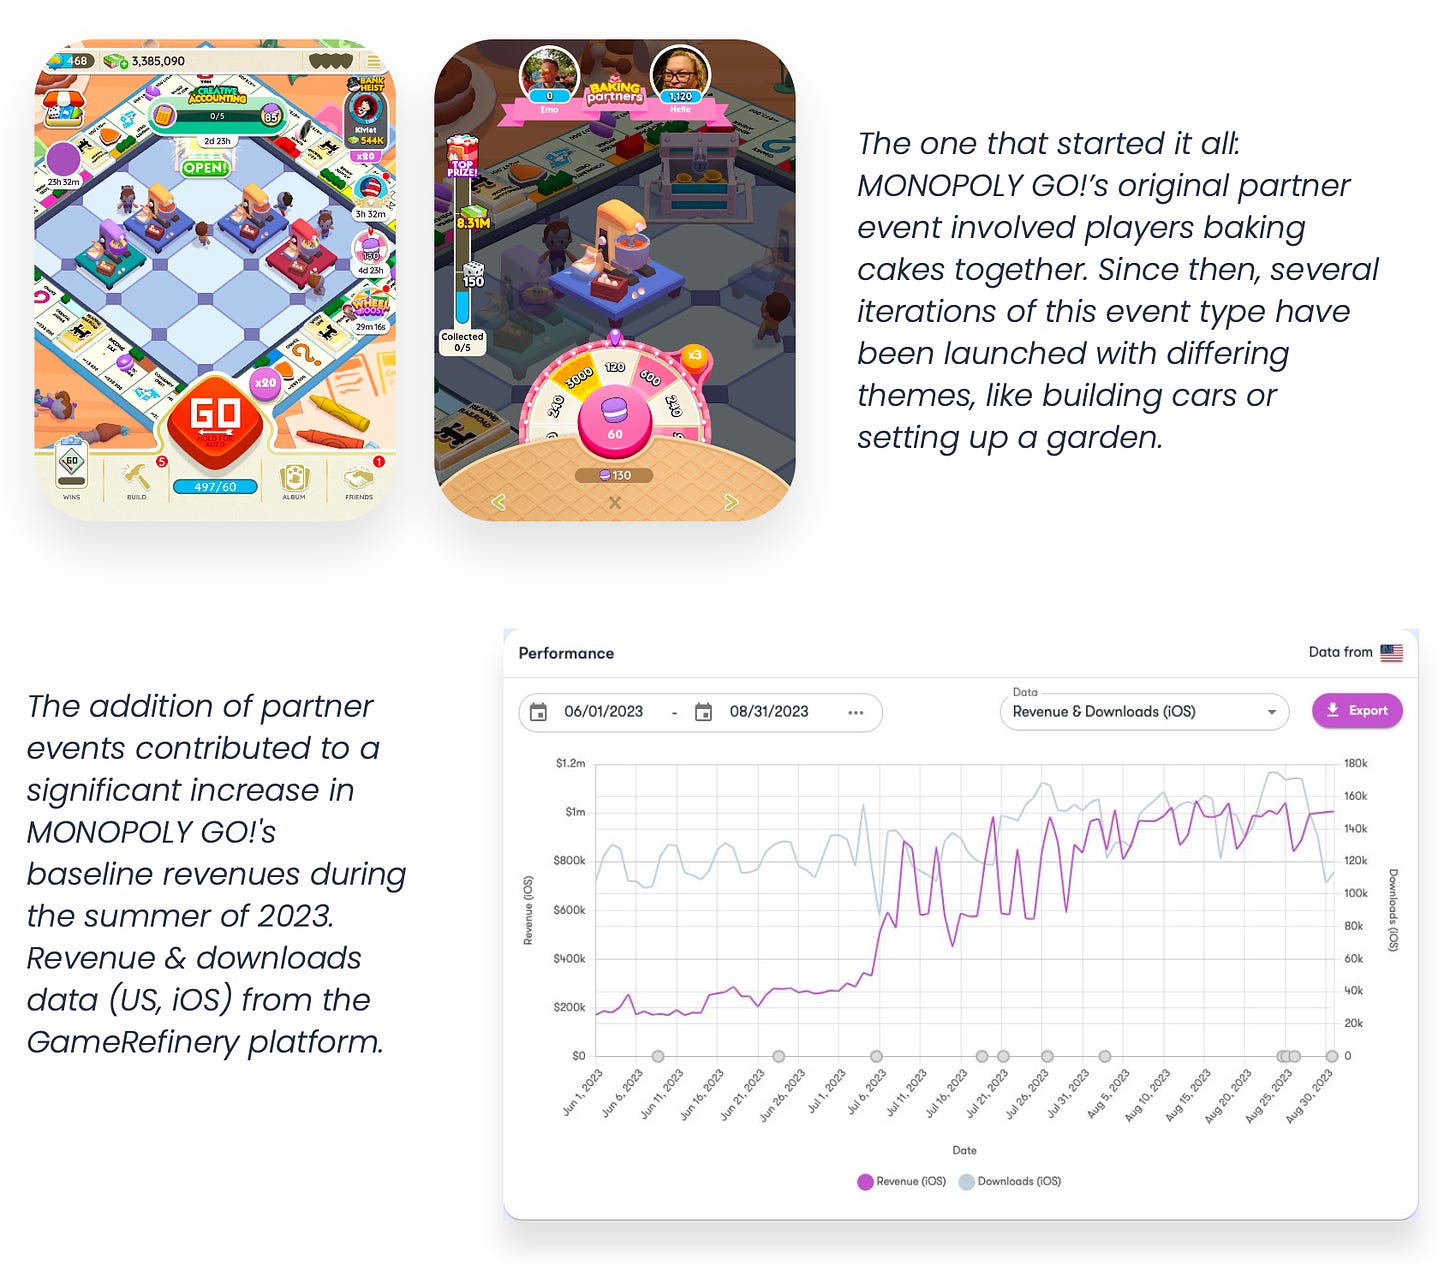
3. Partnership events. The essence of the mechanic is to unite users towards a common goal (for example, in Monopoly GO! - bake a cake).
Monetization Trends
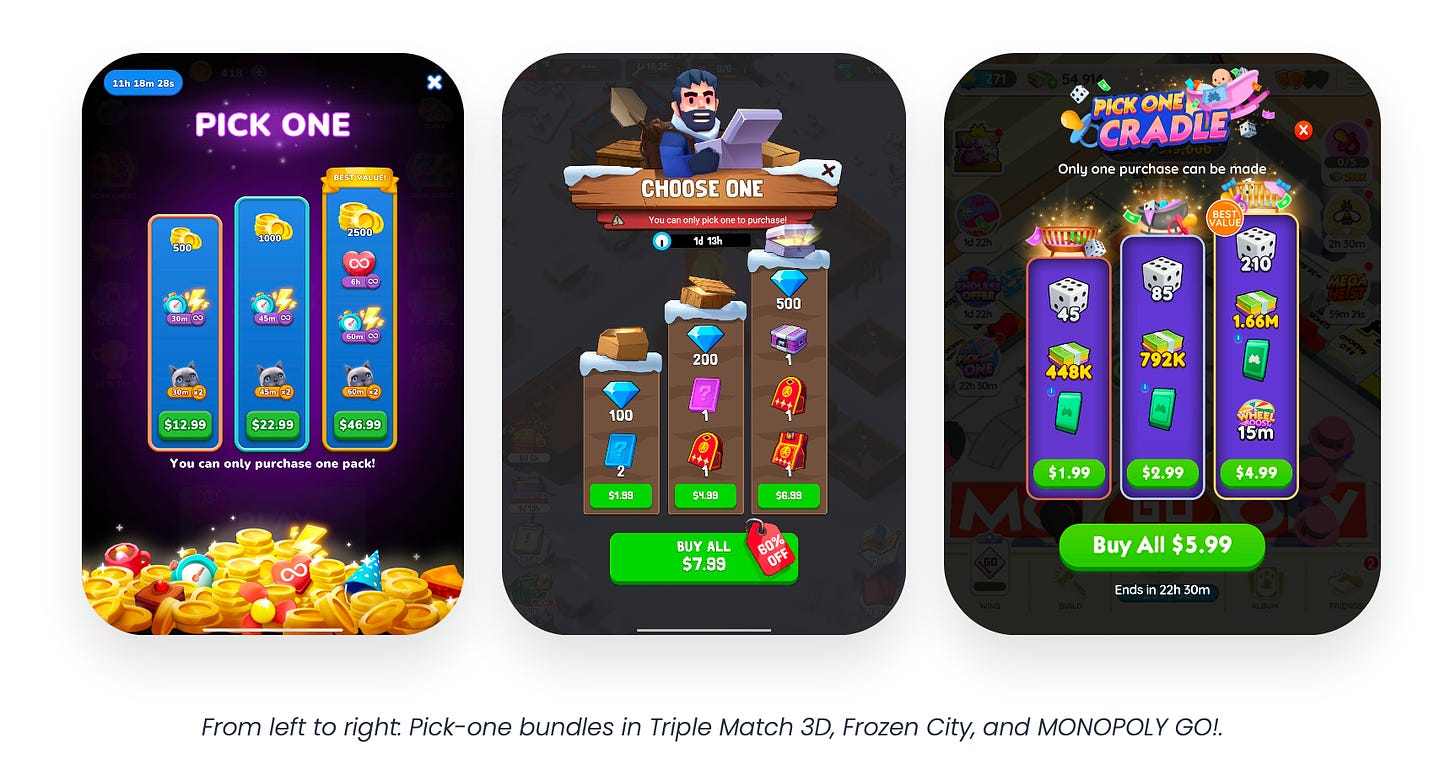
1. Pick-one Bundles. In 2024, developers increasingly offer the player to choose one offer from several (usually three) with different prices and values.
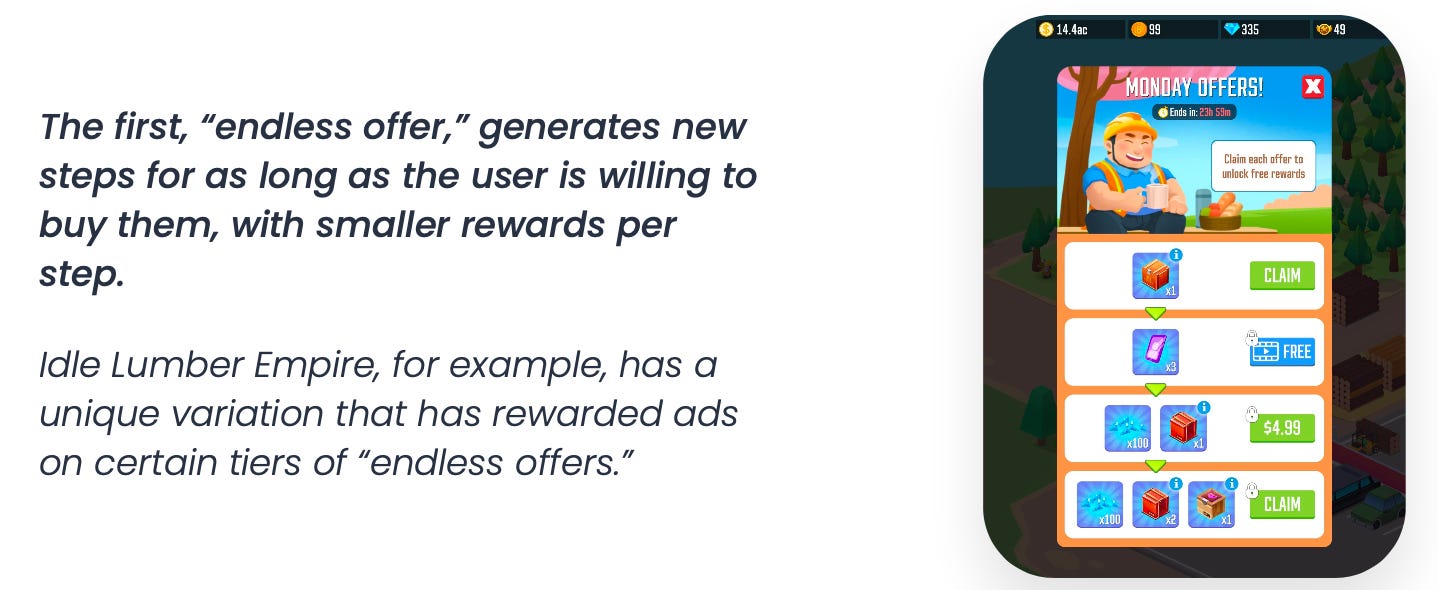
2. Progressive offers. First introduced by Royal Match in June 2021, they continue to gain popularity. Now this type of offer can be found in 70% of casual games in the top 25 in the USA by revenue. The mechanic is simple - a chain of offers is proposed, where the first (or several first) offers are free, and then a paywall is set, behind which there are several more "free" rewards.
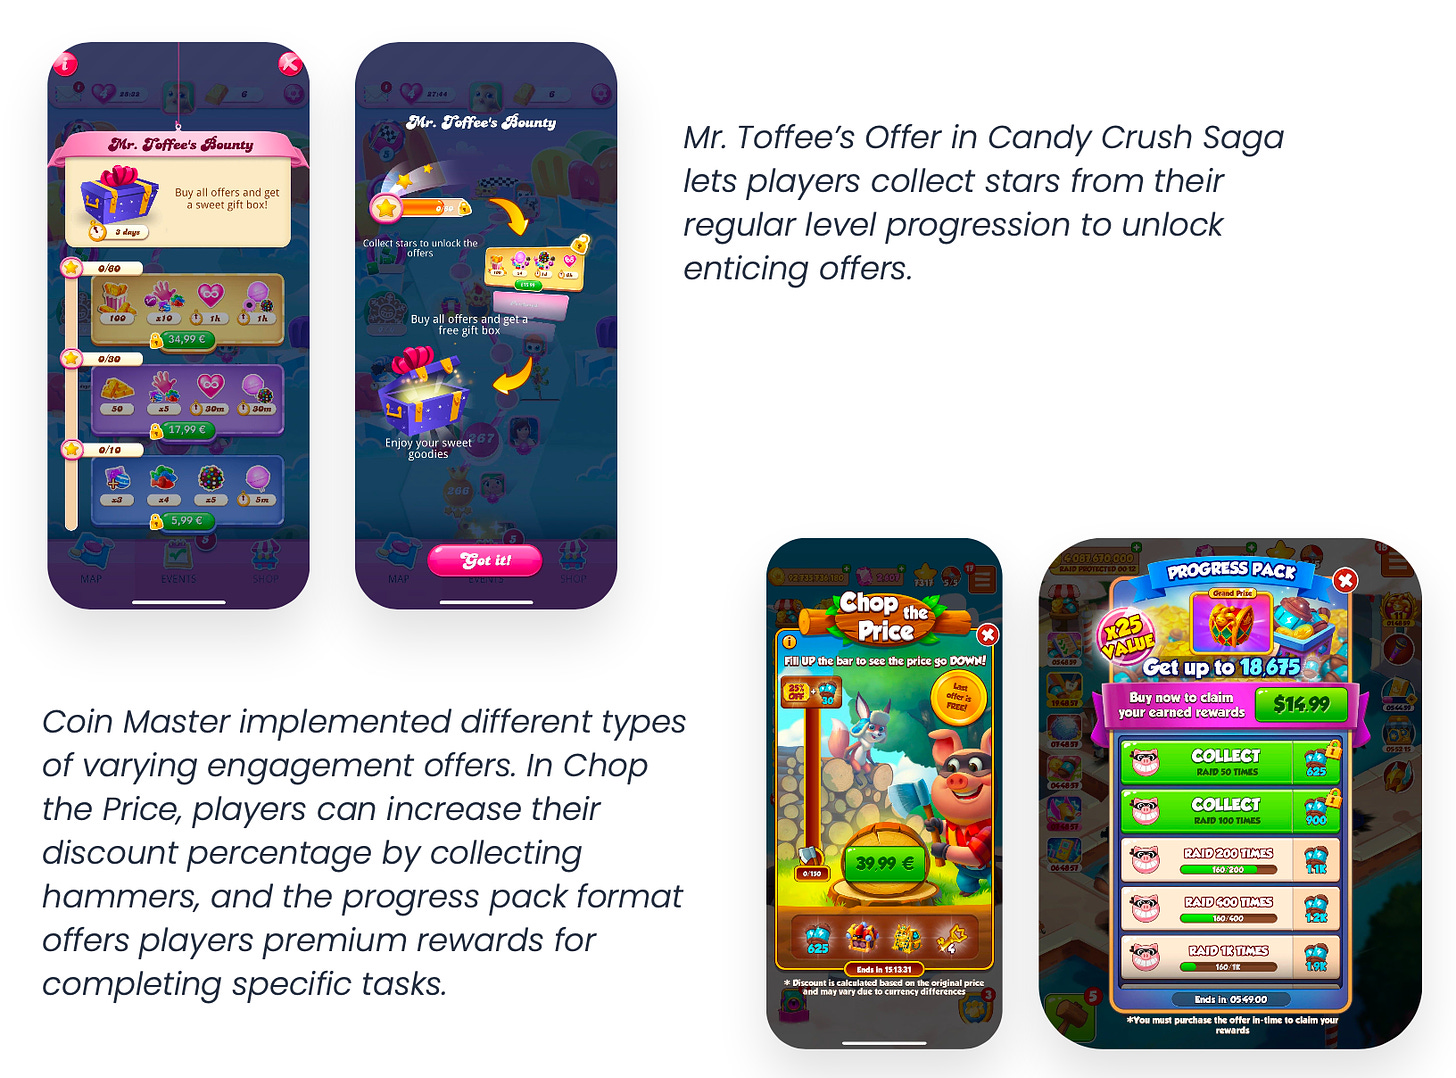
3. Engagement offers. GameRefinery first noted them at the end of 2023. This type of offer combines Battle Pass, Piggy Bank, and other monetization mechanics. The player is offered to perform certain actions to improve the offer/increase the discount.
Newzoo: Top 20 PC/Console games in March 2024 by Revenue and MAU
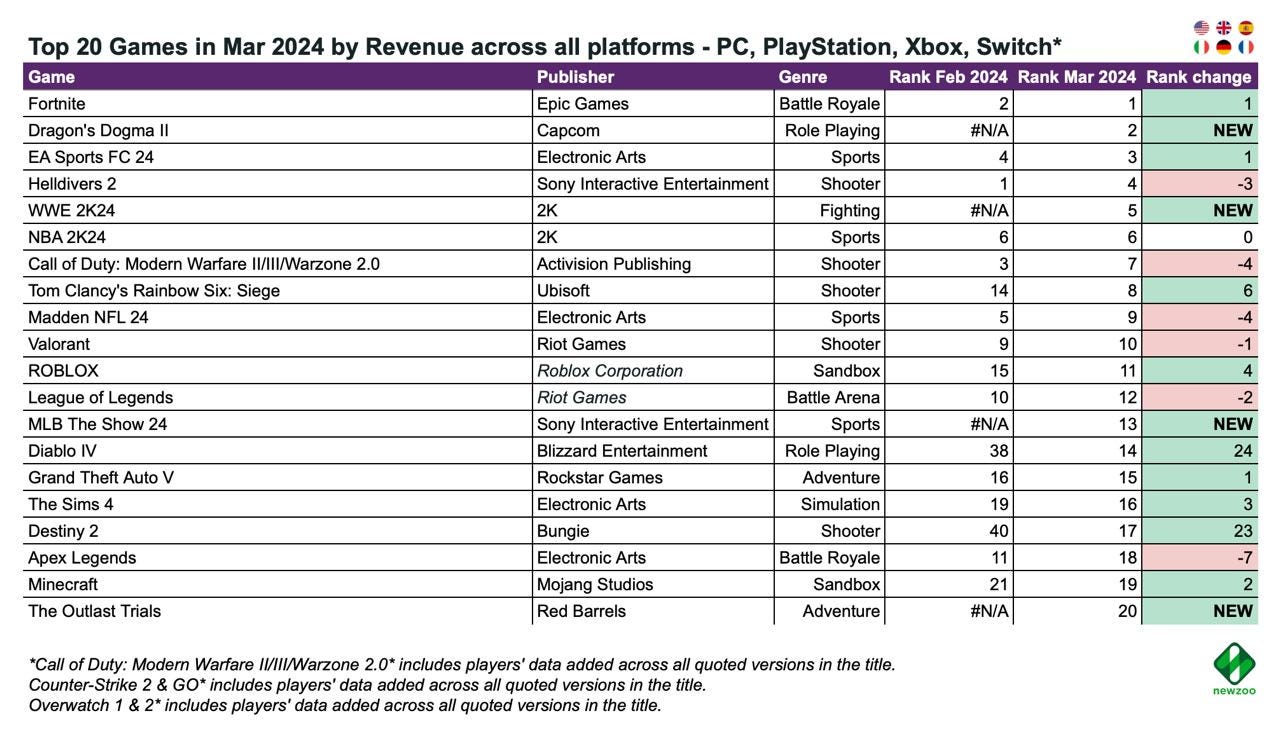
Newzoo accounts for data in the USA, UK, Spain, Italy, Germany, and France.
Revenue - all platforms
-
Dragon’s Dogma II became the second highest-grossing game in March, managing to surpass even EA Sports FC 24 and Helldivers II.
-
Among other new releases in terms of revenue for the month were WWE 2K24 (5th place); MLB The Show 24 (13th place); and The Outlast Trials (20th position).
-
Diablo IV and Destiny 2 significantly increased their revenue rankings (presumably due to a 50% discount at the end of March for Diablo IV and the Guardian Games event for Destiny 2).
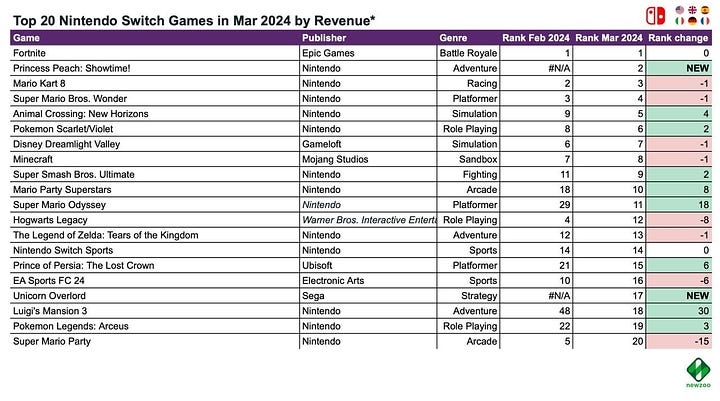
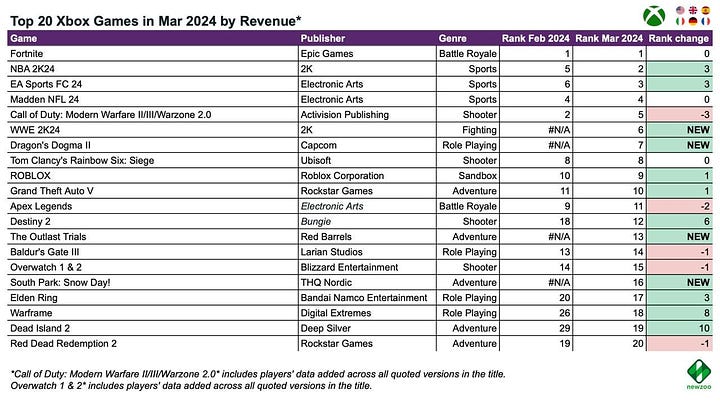
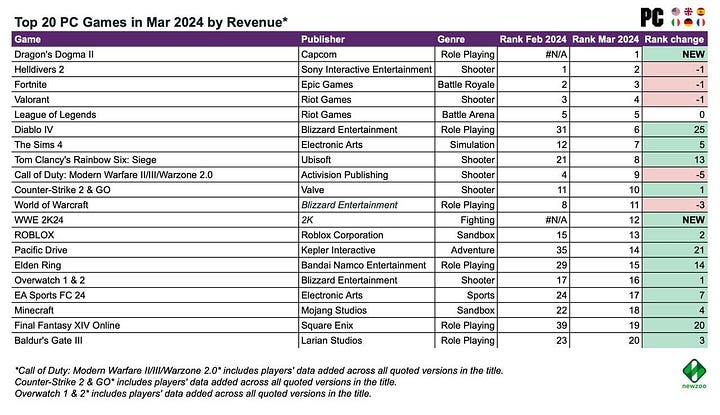
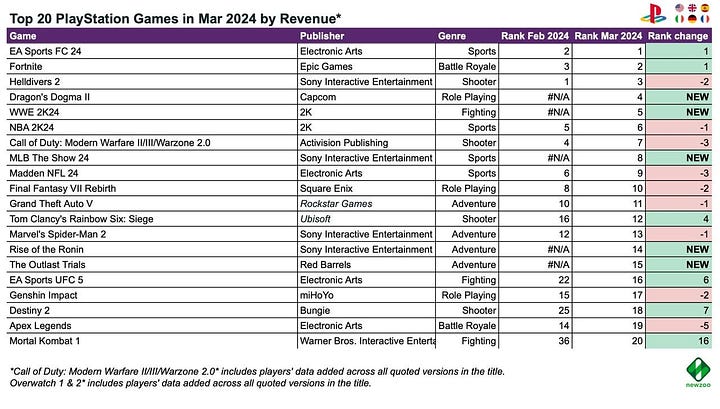
PC, PlayStation, Xbox, Nintendo Switch Revenue charts
-
The most active chart in terms of new releases was on PlayStation - 5 new games: Dragon’s Dogma II; WWE 2K24; MLB The Show 24; Rise of the Ronin; and The Outlast Trials.
-
Princess Peach: Showtime! on Nintendo Switch performed well, debuting at the second position in revenue, second only to Fortnite.
MAU - all platforms
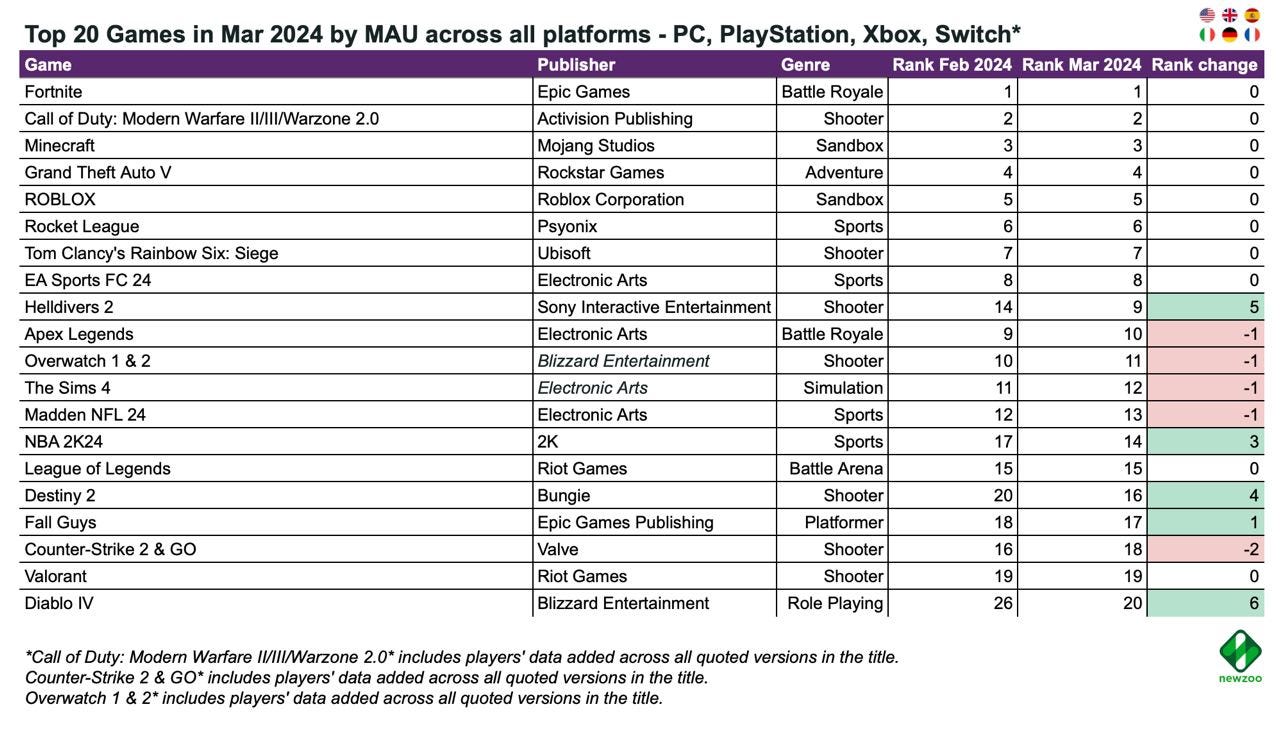
-
The MAU situation in the monitored markets remains stable. Fortnite; Call of Duty; Minecraft; Grand Theft Auto V; Roblox; Rocket League; Tom Clancy’s Rainbow Six: Siege; and EA Sports FC 24 are the leaders.
-
In March, Helldivers II continued its active growth in MAU.
MAU - by platforms
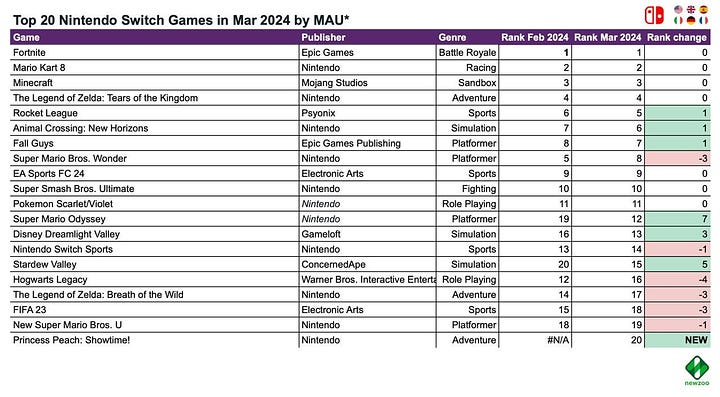
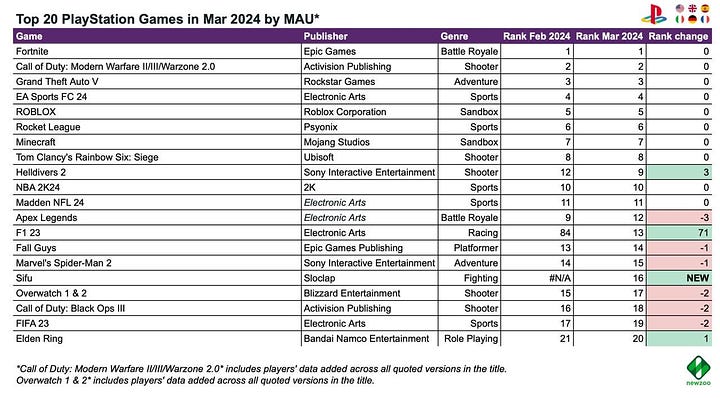
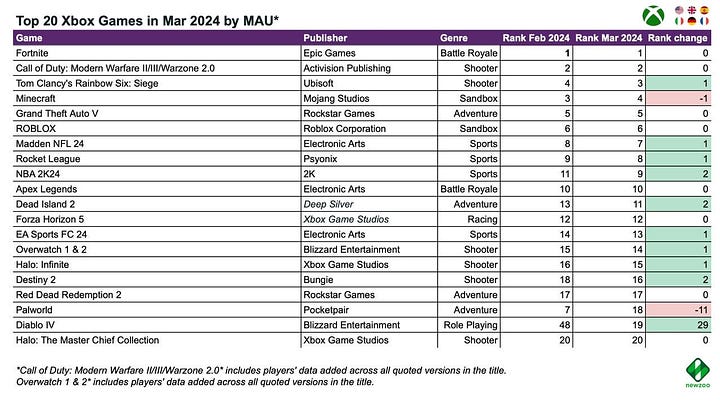
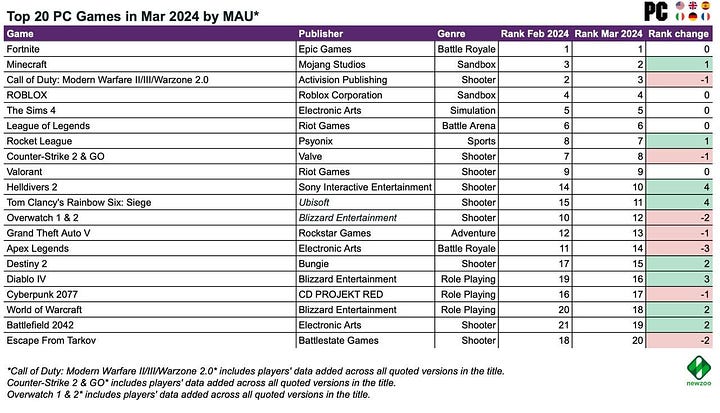
PC, PlayStation, Xbox, Nintendo Switch MAU charts
-
F1 23 and Sifu entered the top 20 MAU chart on PlayStation. Thanks to the PS Plus.
-
Palworld fails to retain its audience. The game dropped out of the top 20 in MAU on PC, and on Xbox, it fell from 7th place to 18th.
Lurkit: State of the Streaming market in Q1’24
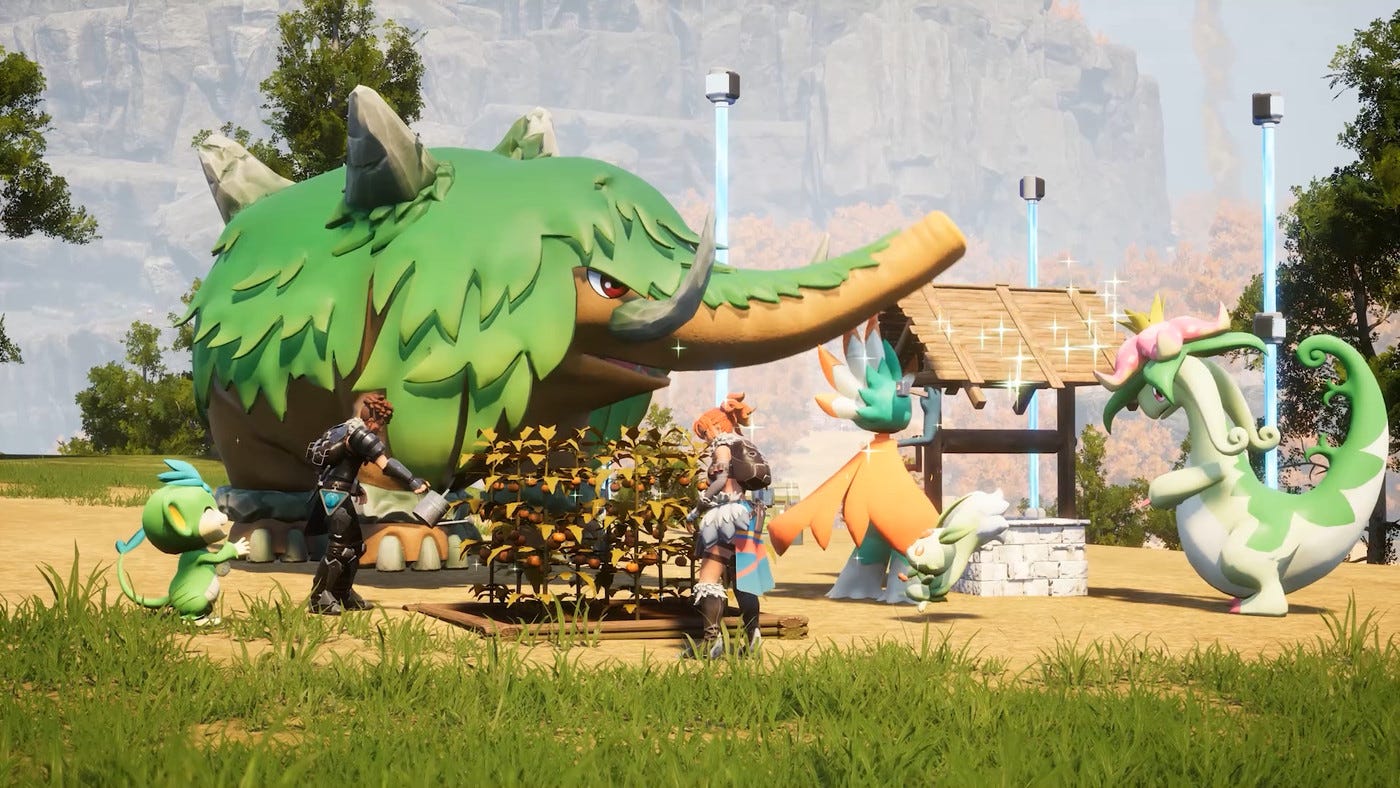
The company analyzed the top 500 games on Twitch by the hours watched.
Key findings
-
In Q1’24, 52,108 games appeared on Twitch. The top 500 accounted for 69.8% of all viewing hours.
-
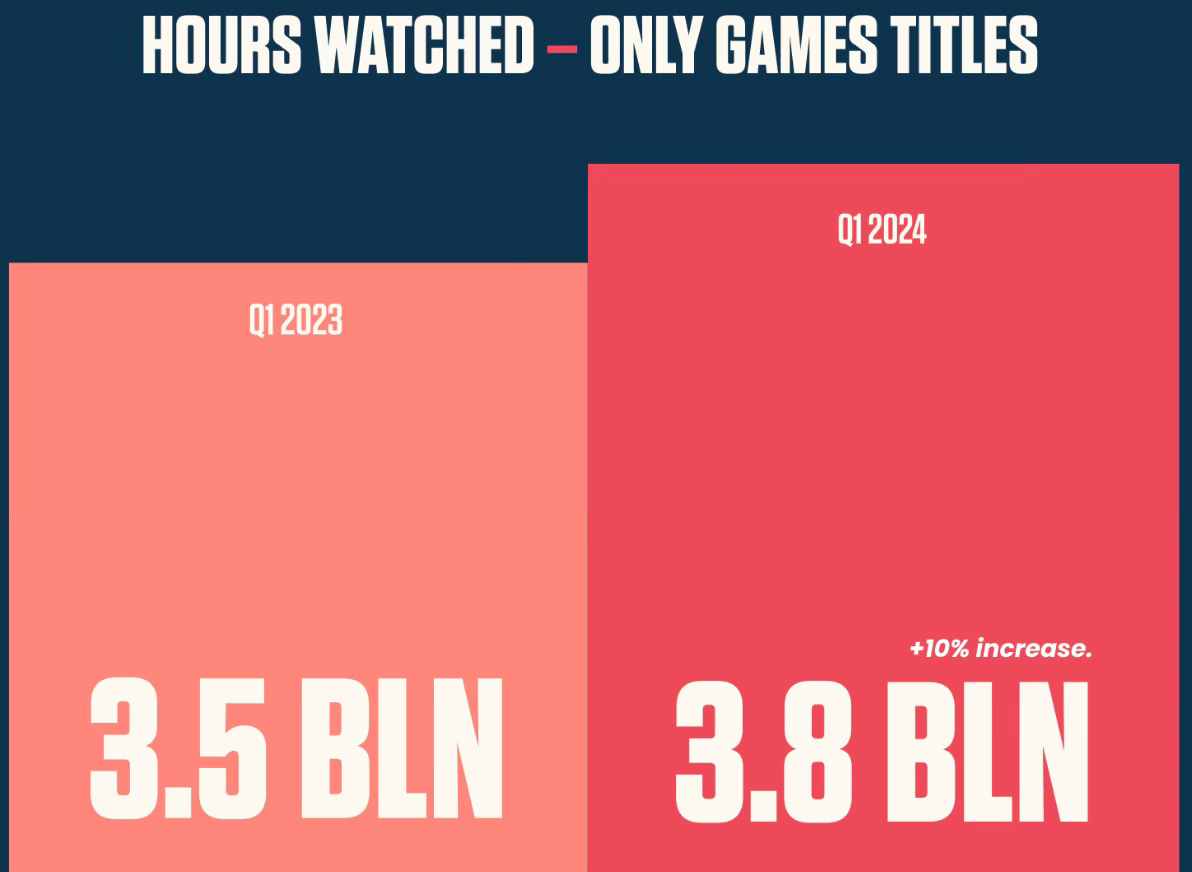
The number of hours users spent watching games from the top 500 reached 3.8 billion hours. This is 10% more than in Q1’23.
-
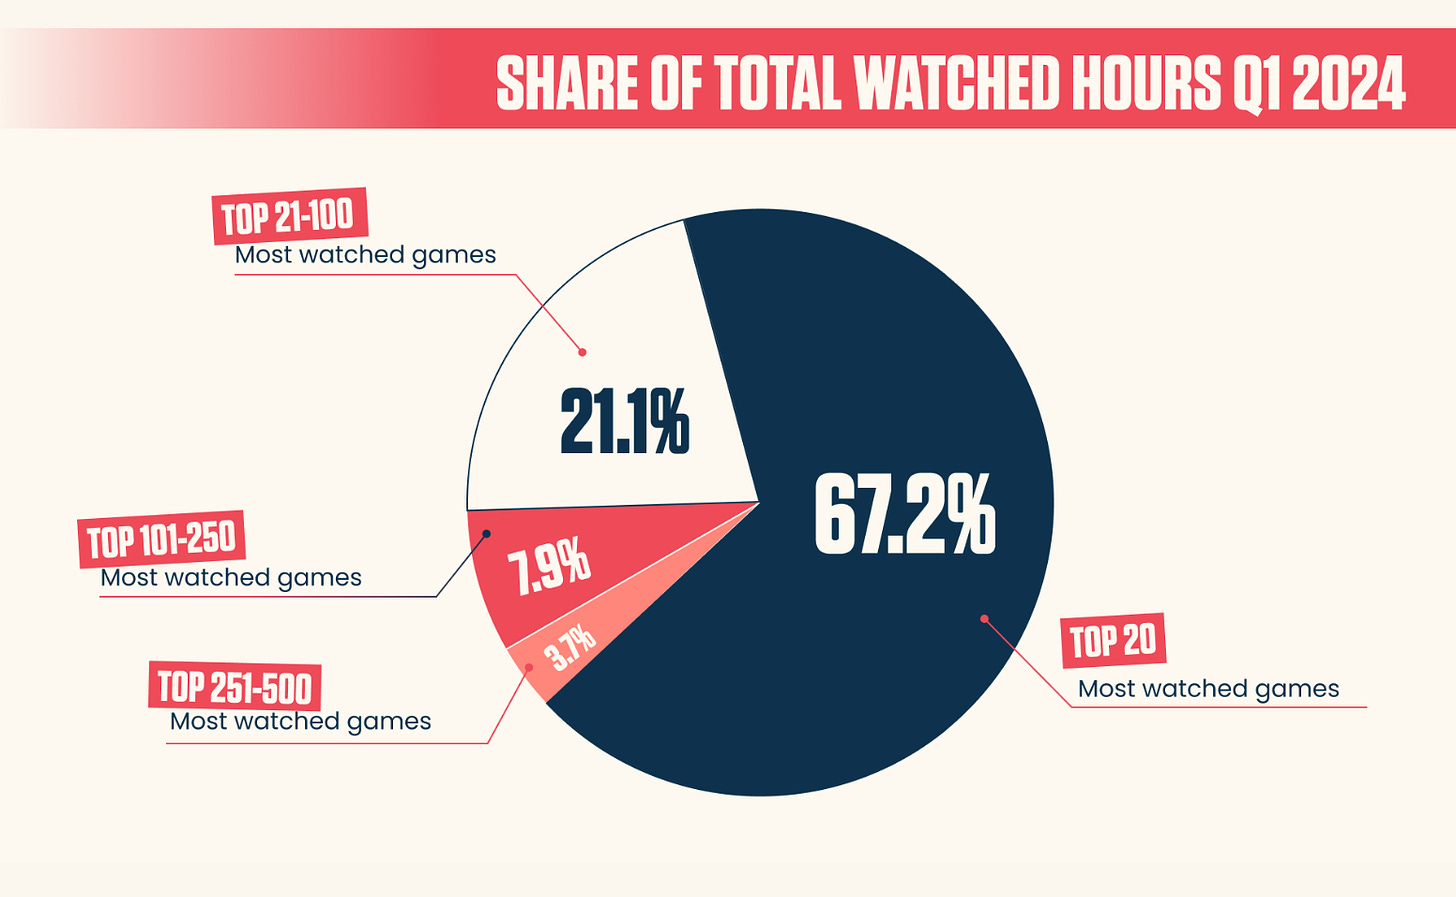
67.2% of hours watched are accounted for by games from the top 20. 88.3% - for games from the top 100.
-
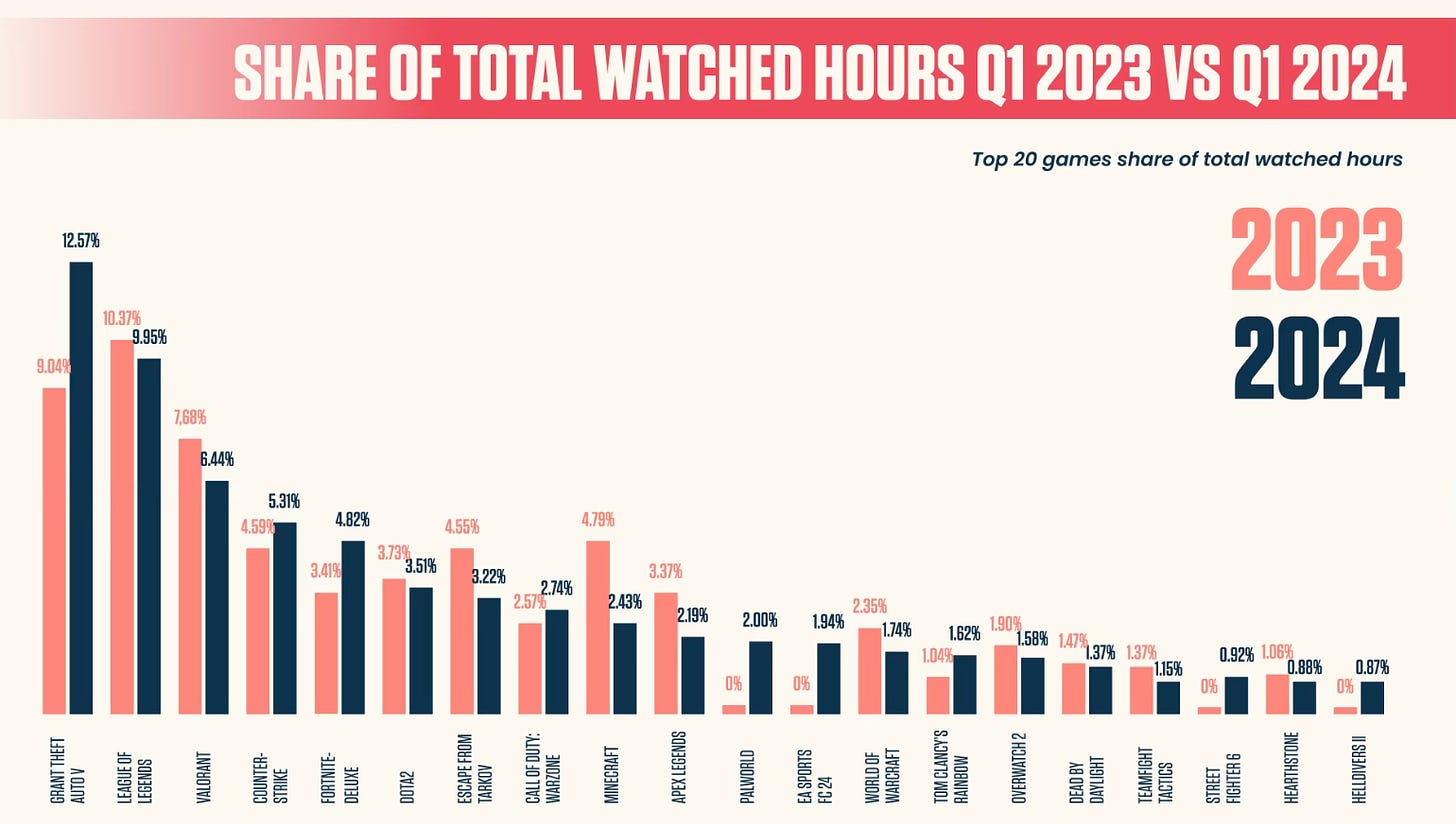
Grand Theft Auto V (479 million hours) is the most viewed game in the first quarter.
-
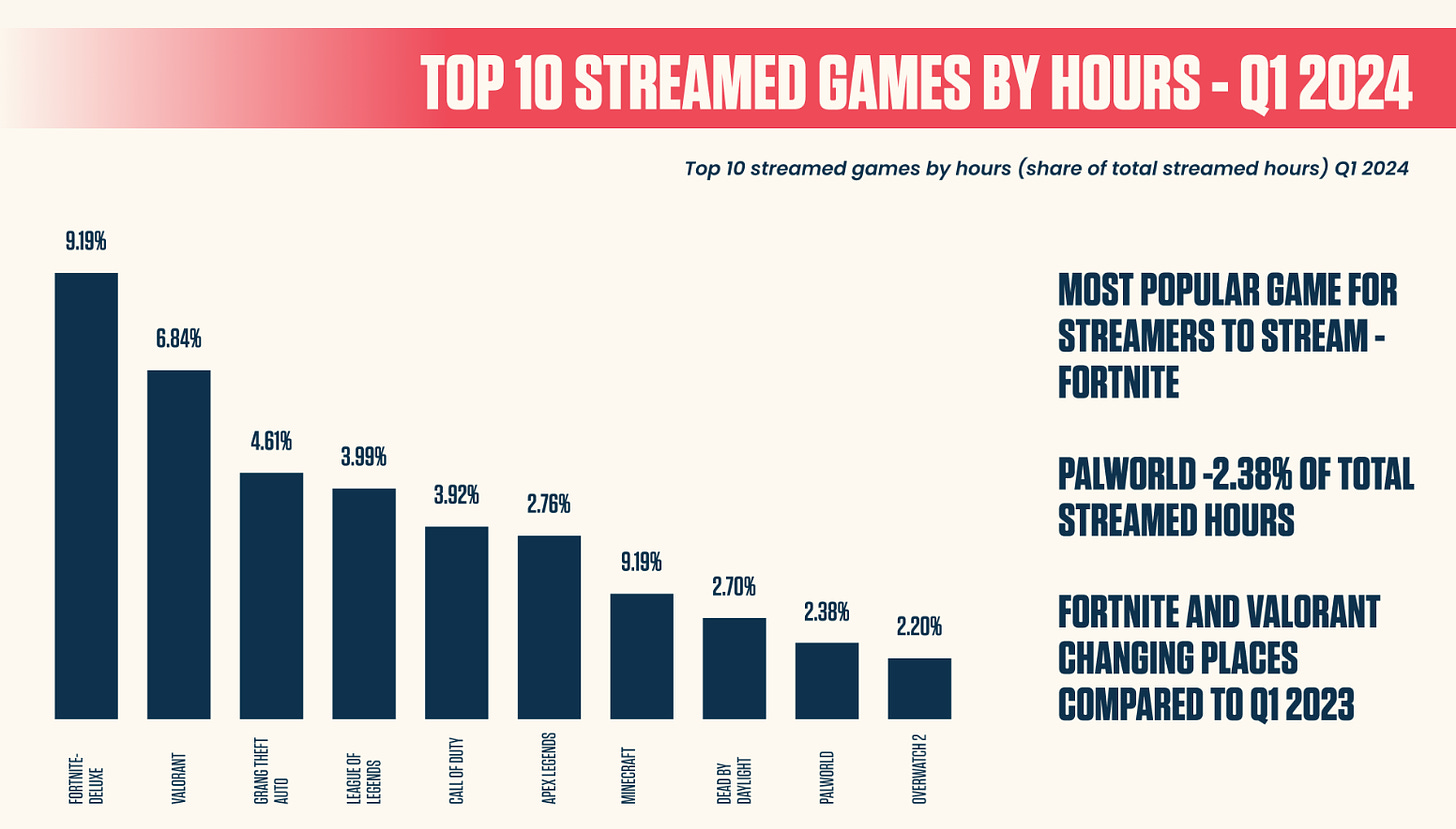
Fortnite is the top game in terms of streaming hours. It accounts for 8.12% of all streaming hours among the top 500 games.
- The top 10 most successful developers' games account for 59% of all hours watched. This is less than 63% in Q1’23. Riot Games is the most successful developer in terms of watched hours (671 million hours across all games).
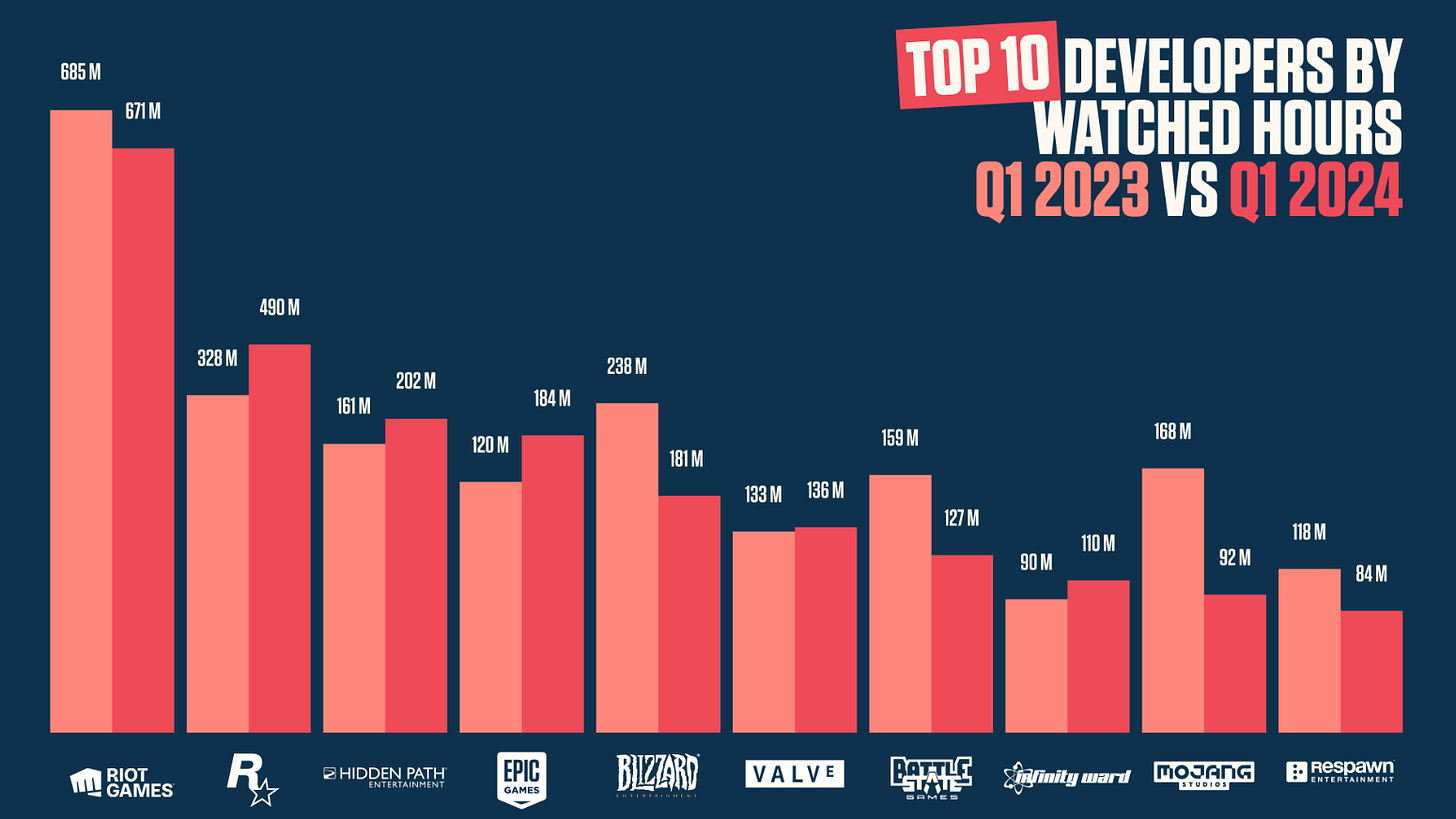
❗️Lurkit included Hidden Path Entertainment in the list of most successful developers. In reality, it is a studio that helped Valve create CS:GO, so when data is exported for CS2, it is listed among the creators.
-
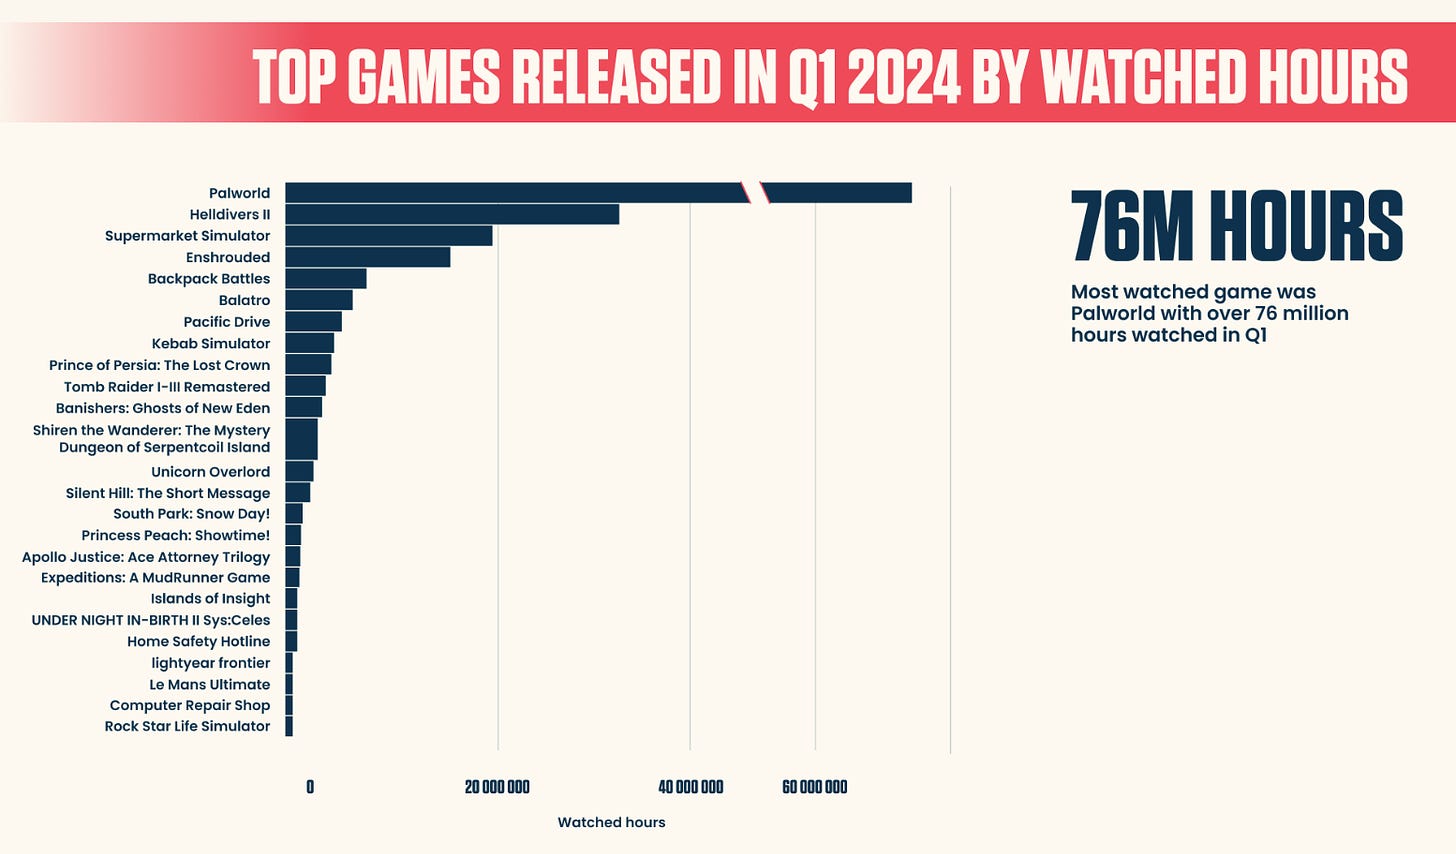
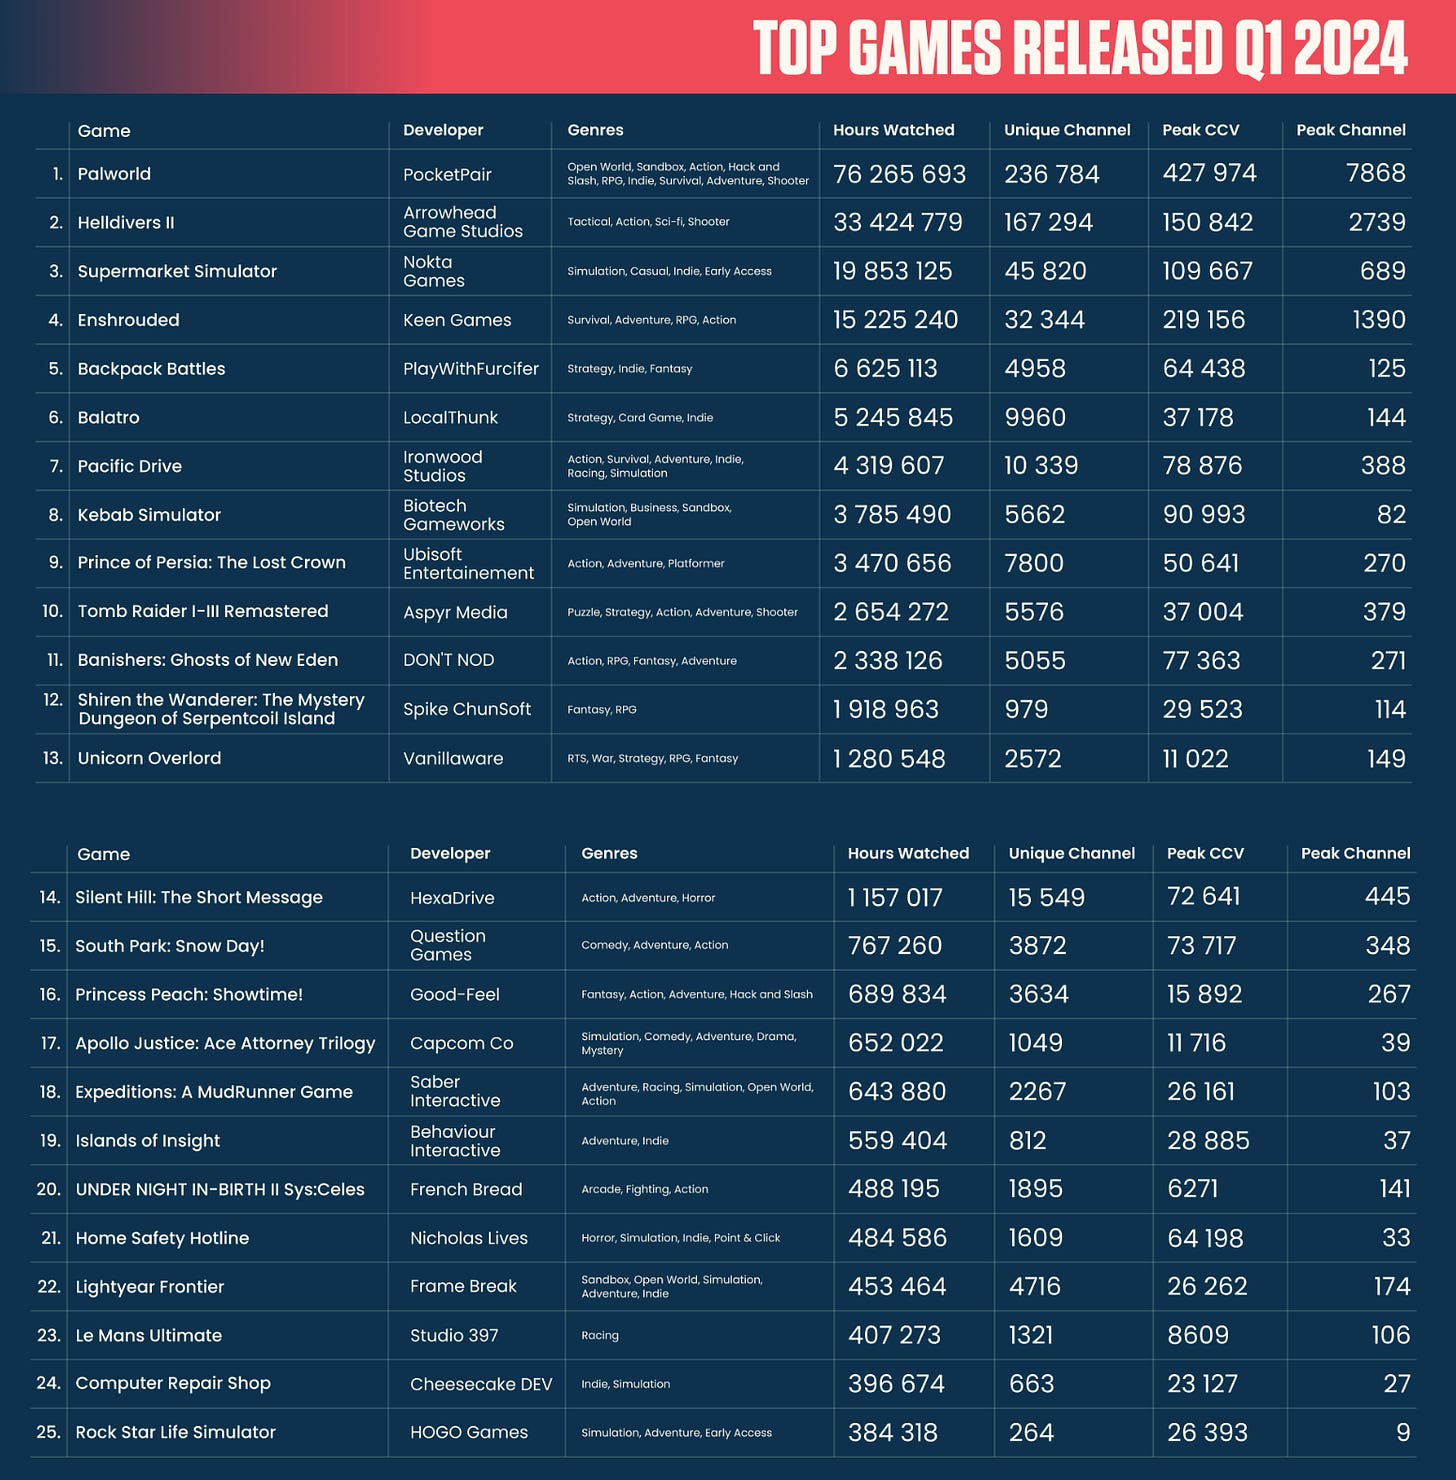
25 games released in the first quarter of 2024 made it into the top 500 for Q1’24 in terms of hours watched.
-
Palworld is the most successful new game of the quarter, with 76 million hours watched. This is 128% more than Helldivers II.
Liftoff: CPI and D7 ROAS benchmarks in Mobile Games

The report is based on research results from January 1, 2023, to January 1, 2024. 602 billion impressions were analyzed; 49.4 billion clicks; 144 million downloads.
CPI - benchmarks for advertising formats in games
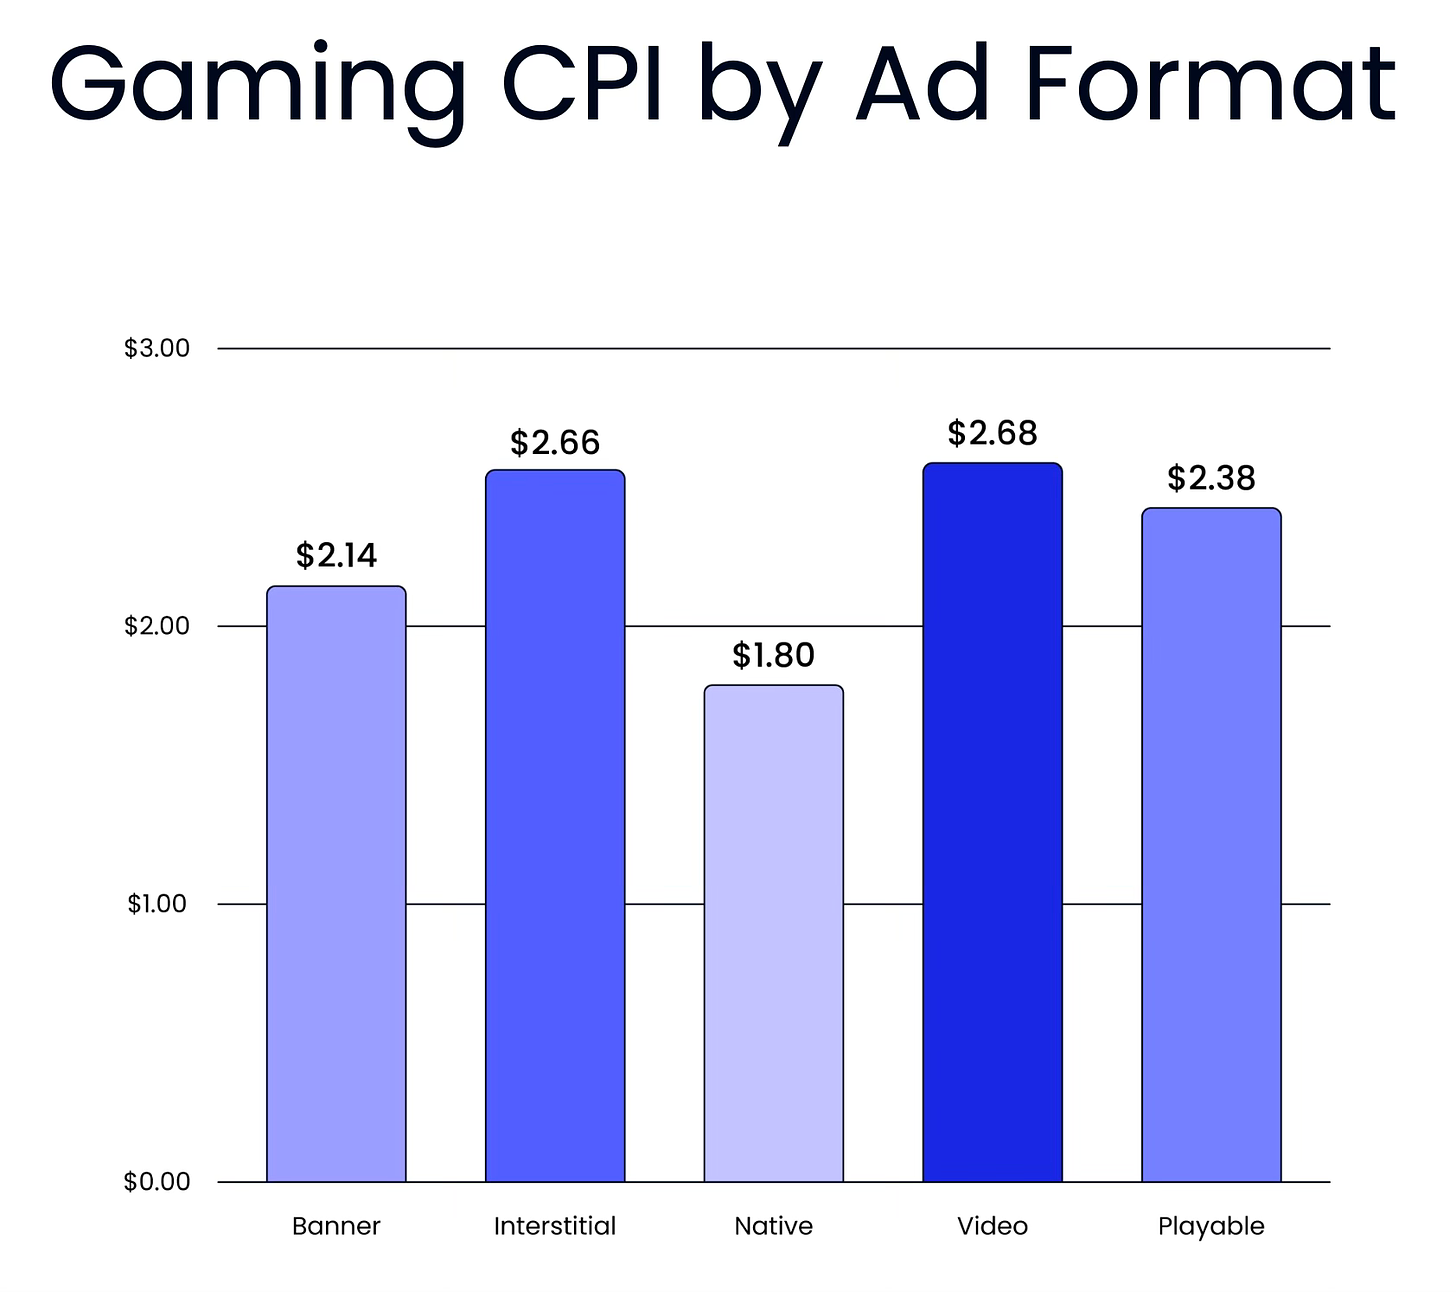
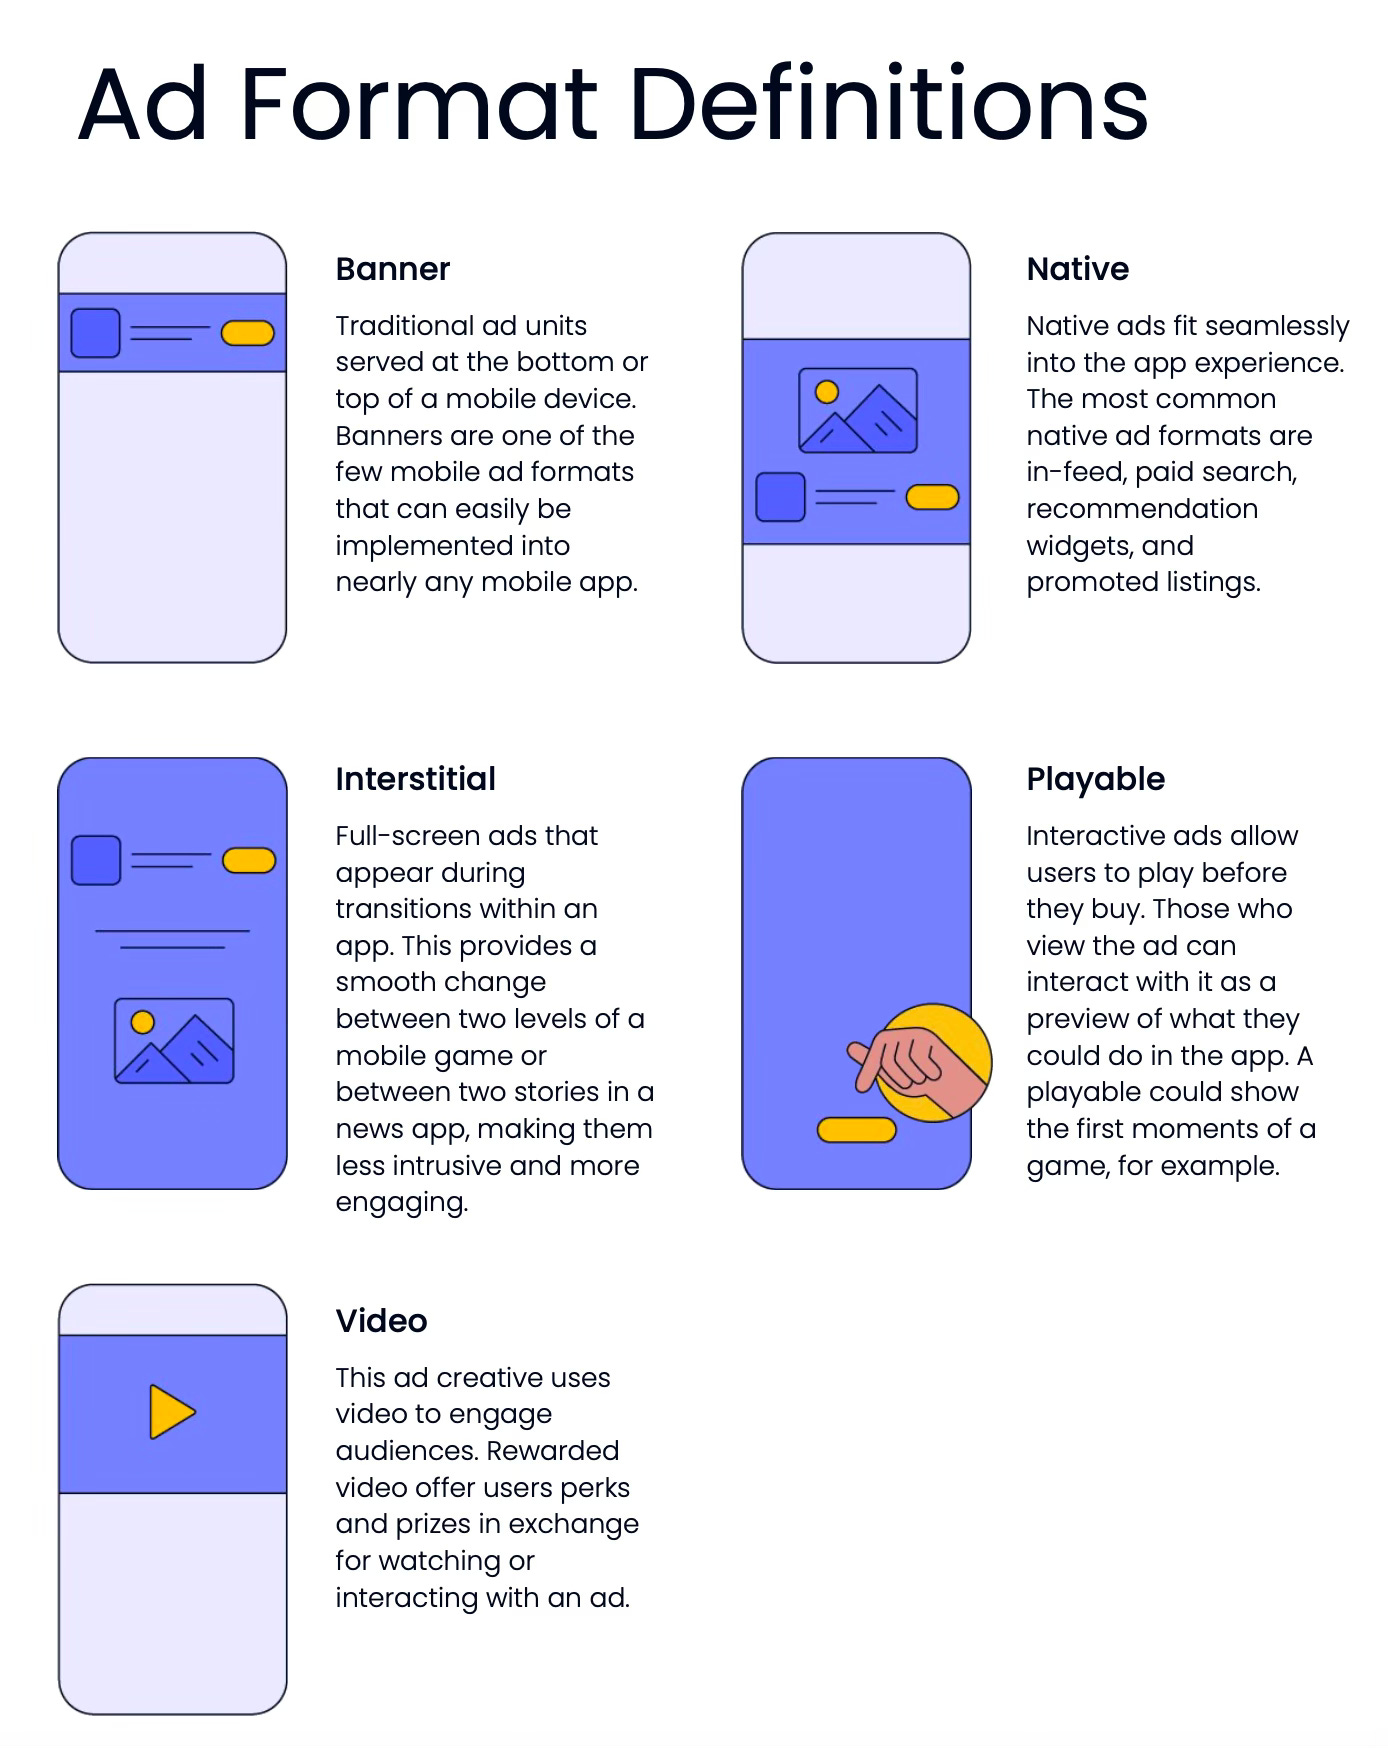
- The lowest CPI is for native formats (feed integration, widgets, etc.) - $3.09 on iOS and $1.22 on Android. $1.8 on average.
-
Banners are second ($2.14 on average - $3.26 on iOS and $0.88 on Android); Playable format is more expensive ($2.38 on average - $5.76 on iOS and $0.6 on Android).
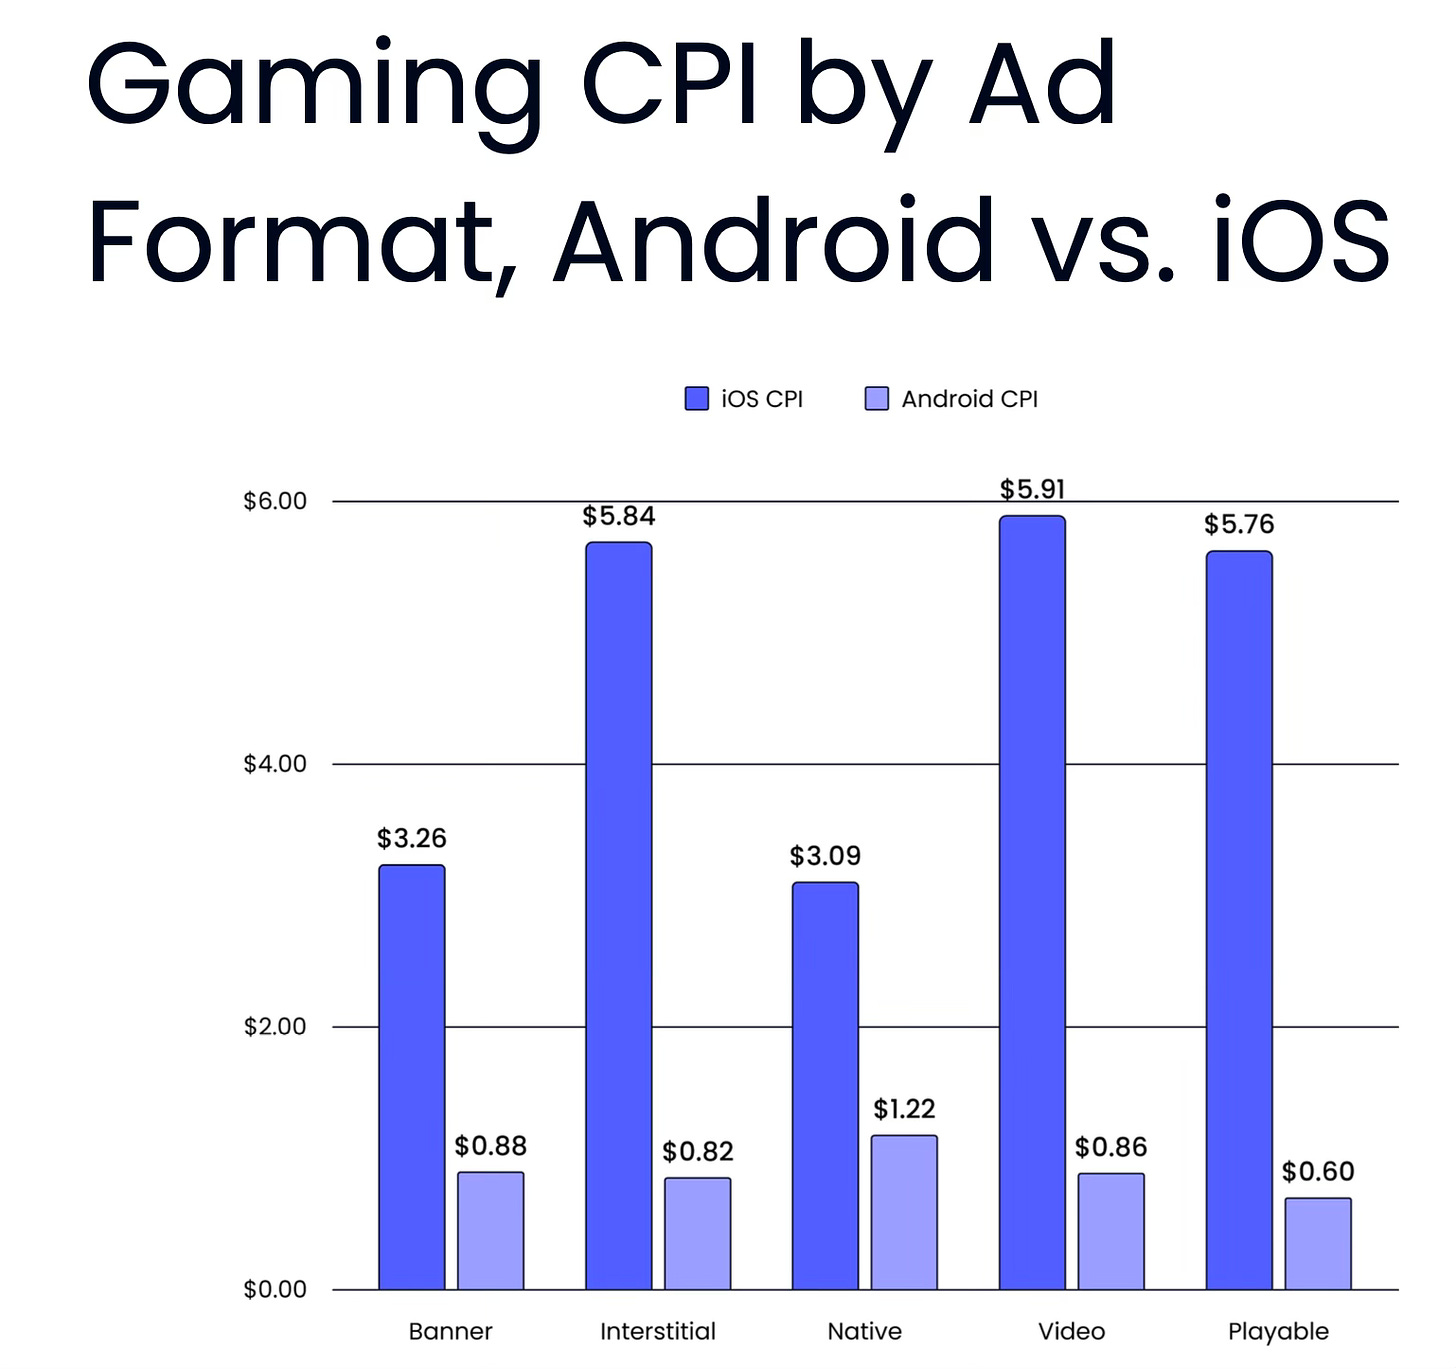
- The most expensive advertising formats on average are Interstitial ($2.66 on average - $5.84 on iOS and $0.82 on Android) and video ($2.68 on average - $5.91 on iOS and $0.86 on Android).
Conversion from impression to install
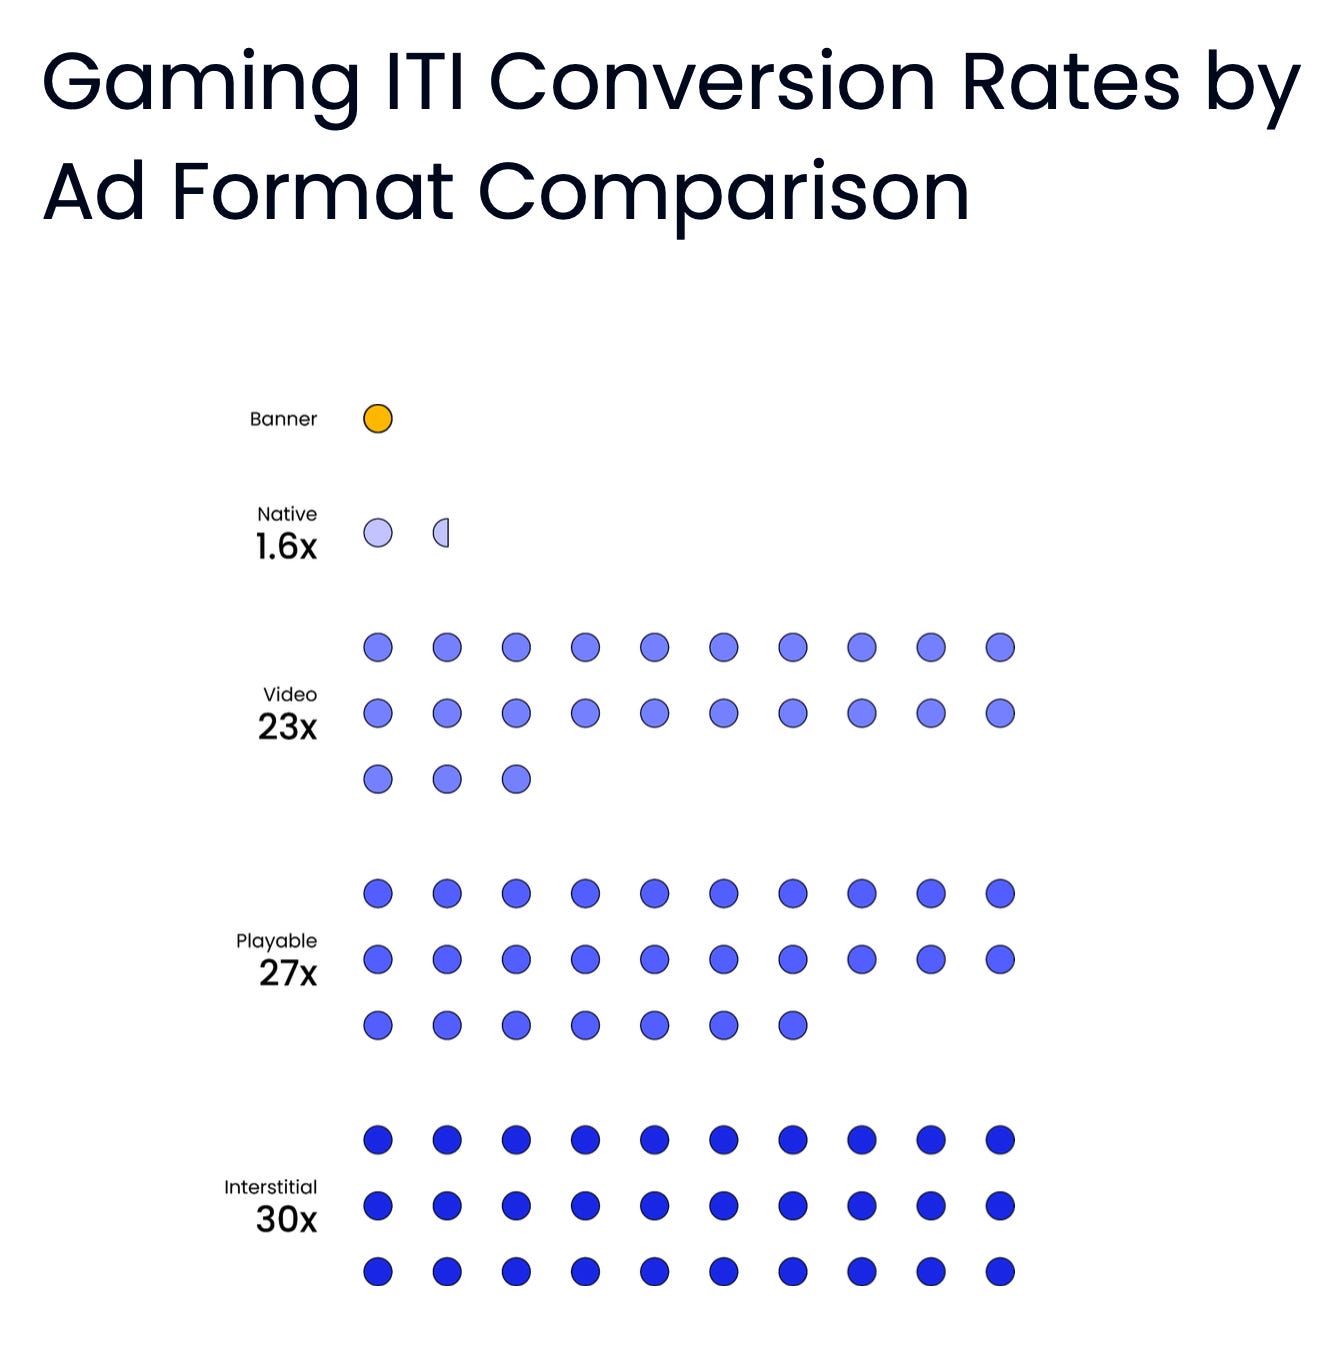
- The worst conversion is for banners. Liftoff took it as the baseline.
-
Results for native advertising formats are 1.6 times better.
-
There is a significant difference with video ads (conversion is 23 times better than banners); Playable ads (conversion is 27 times better) and Interstitial (conversion is 30 times better).
Day 7 ROAS - benchmarks in games
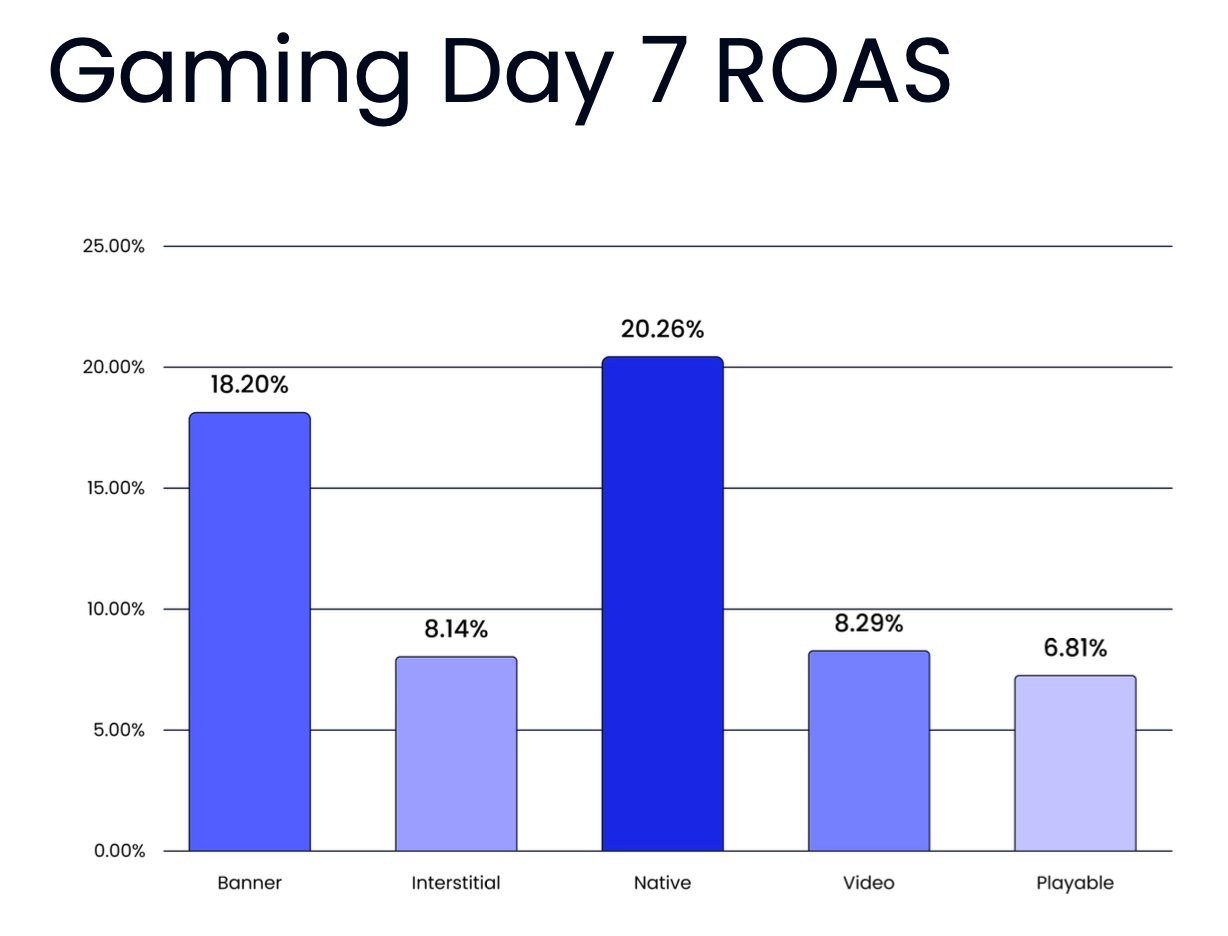
- The worst D7 ROAS results are for Playable ads (6.81%); Interstitial format (8.14%) and video ads (8.29%).
-
The best results are for banners (18.2%) and native advertising (20.26%).
❗️Liftoff notes that the situation regarding D7 ROAS can vary dramatically depending on the genre, audience, spending level, and many other factors. This is an average figure overall.
Stream Hatchet: Streaming Market Trends in Q1’24
Stream Hatchet tracks all streaming platforms in the market.
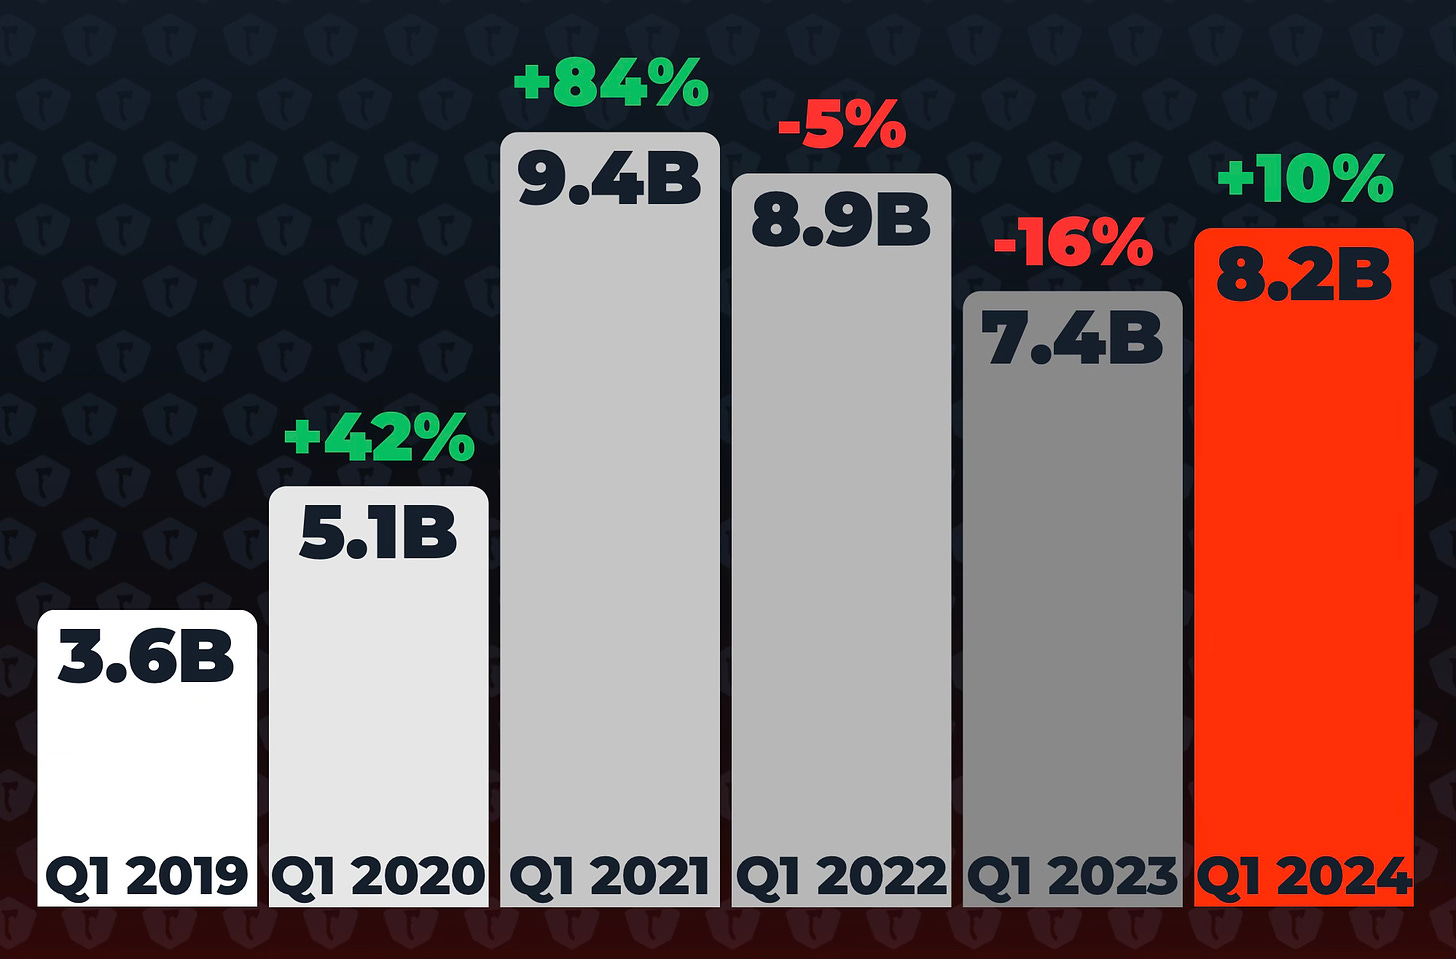
- After a two-year decline, the number of viewing hours in Q1’24 increased by 10% compared to Q1’23, totaling 8.2 billion hours. This figure is 128% higher than in Q1’19 and 61% higher than in Q1’20.
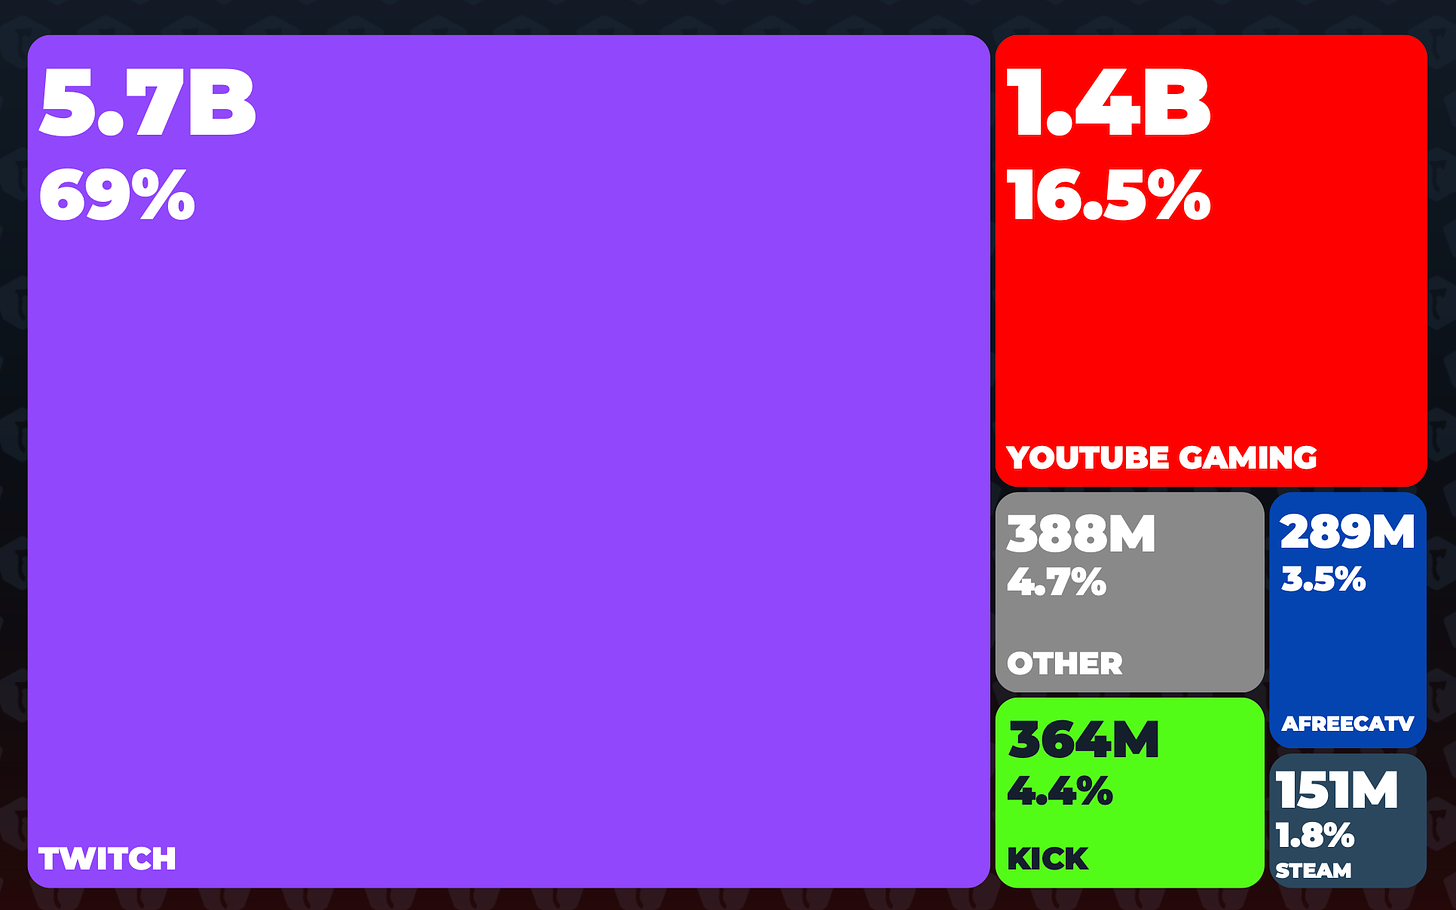
- Twitch remains the market leader, capturing 69% of the total viewing volume. YouTube Gaming follows with 16.5% of all hours. Kick, in its first year in the market, secured the third position with 4.4% market share; the platform is popular among gambling streamers. AfreecaTV (3.5% market share) ranks fourth, and Steam (1.8%) fifth.
- In Q1’24, Twitch accumulated 5.7 billion hours, up by 3% from Q1’23. YouTube Gaming grew by 19% YoY, reaching 1.4 billion hours. Interestingly, Steam emerged as the fastest-growing streaming platform (+109% YoY). VK also showed growth at 17%, albeit on a smaller scale (136 thousand viewing hours).
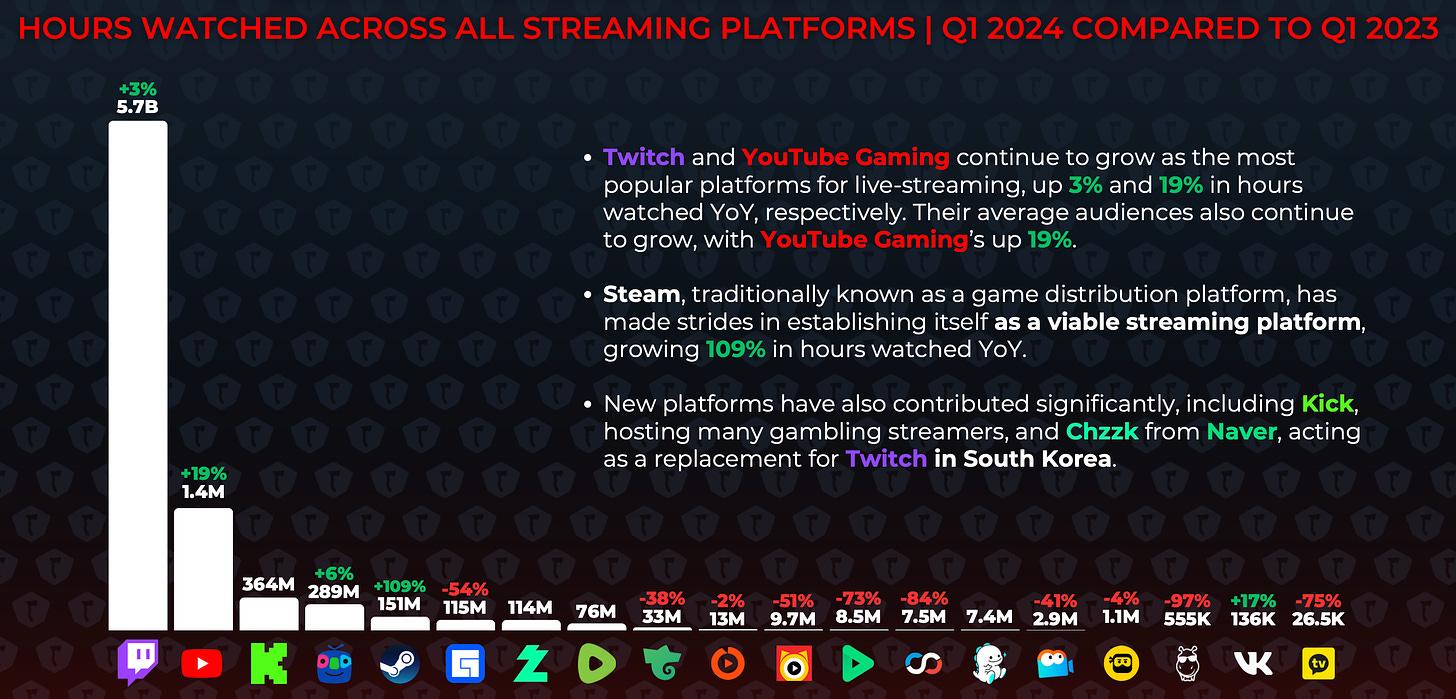
❗️It seems that Twitch growth almost stopped, while YouTube Gaming continues to actively attract/re-engage the audience.
-
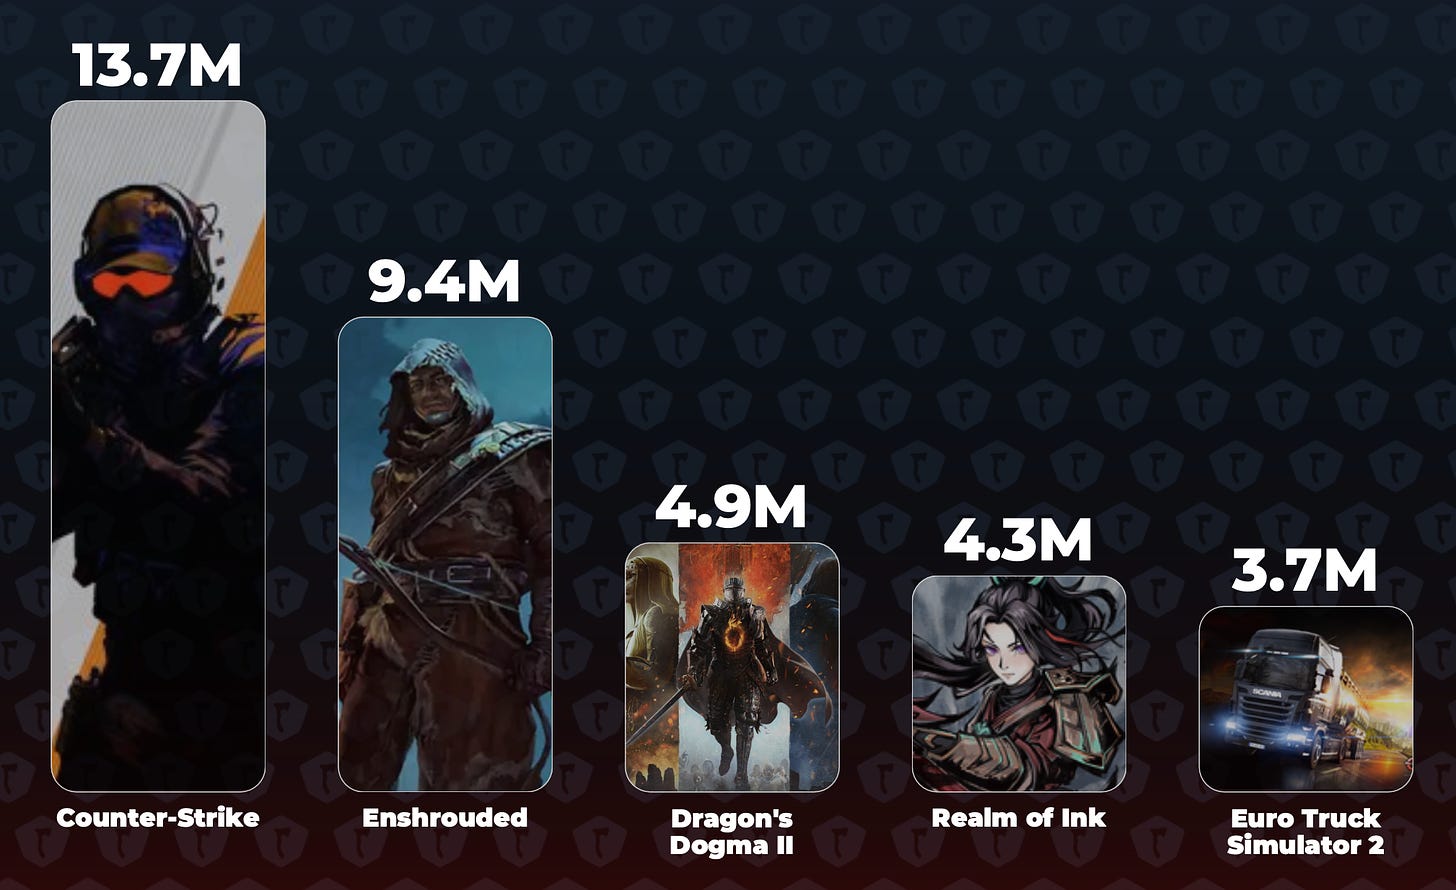
Counter-Strike 2 (13.7 million hours), Enshrouded (9.4 million hours), and Dragon’s Dogma II (4.9 million hours) were the most-watched games on Steam.
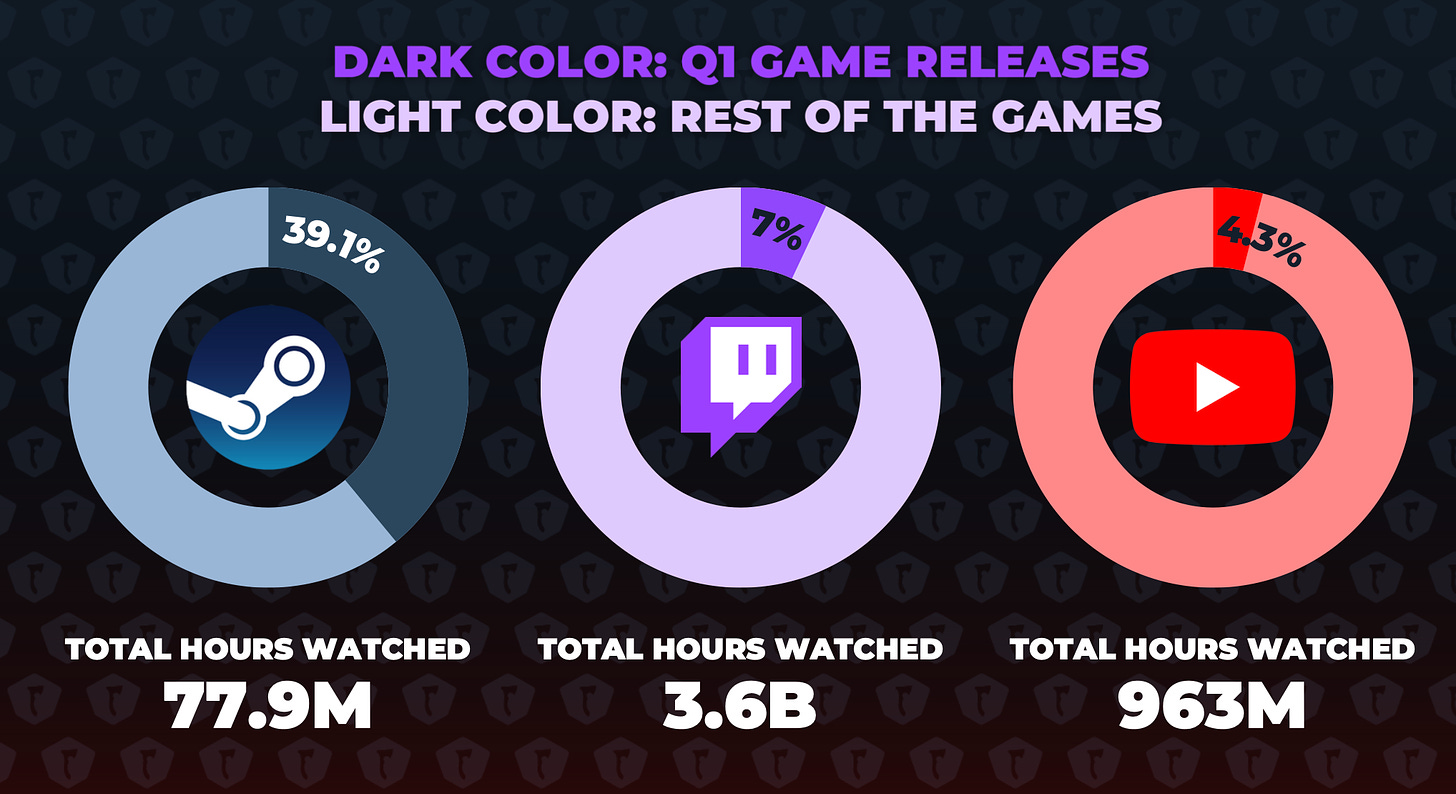
- 39.1% of all Steam views in Q1’24 were from new games. Twitch had only 7% from new games, and YouTube Gaming had 4.3%. Streaming new games on Steam appears to be an effective strategy.
-
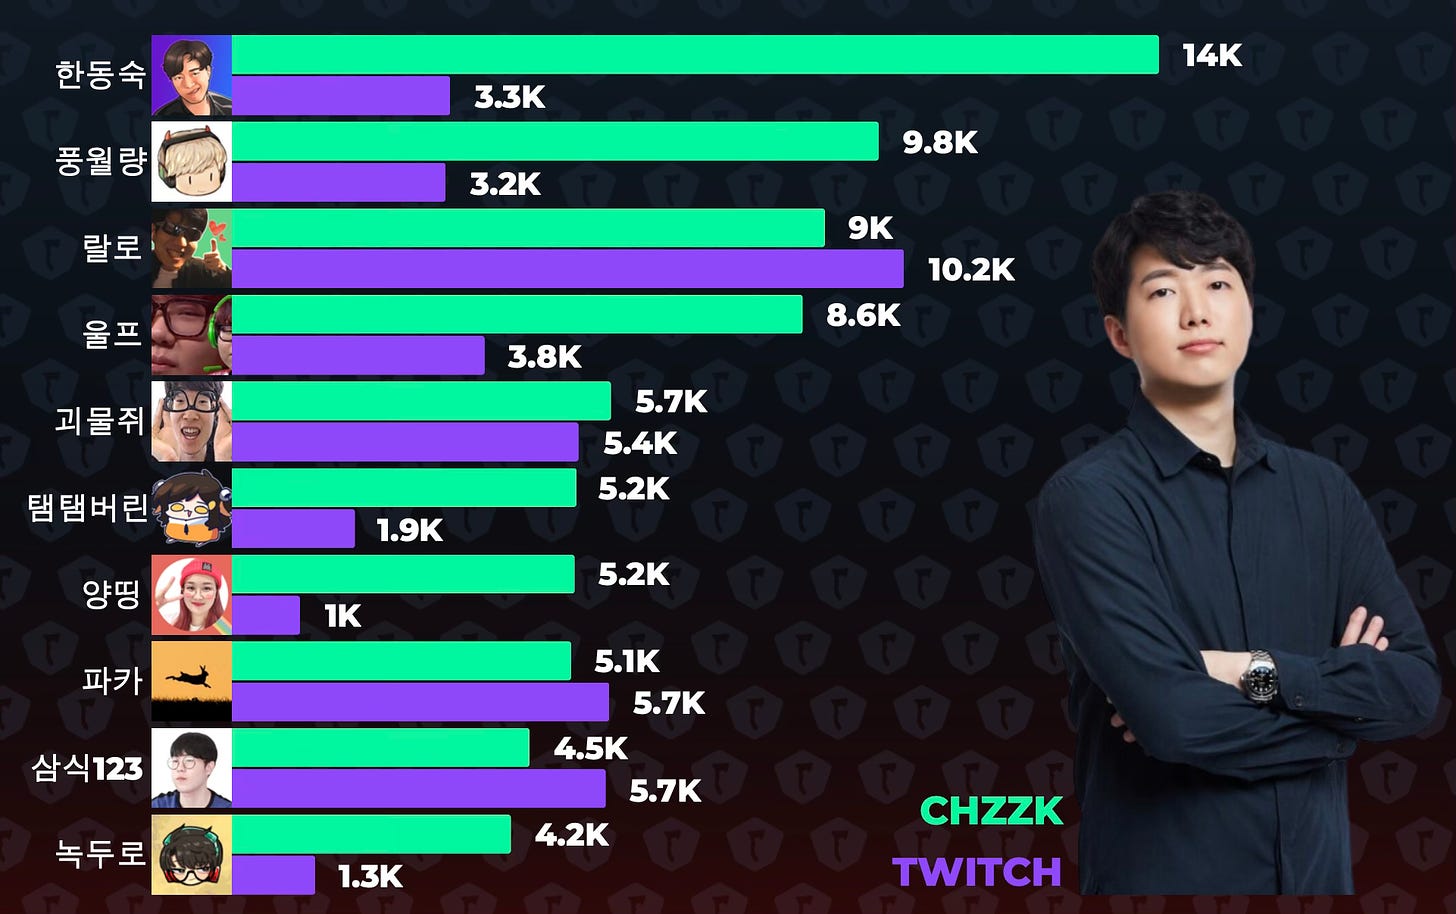
CHZZK and AfreecaTV confidently took the lead over Twitch in South Korea. The latter announced its exit from the market due to high operating costs. It turned out that the average views of the top 7 South Korean streamers on CHZZK are higher than on Twitch.
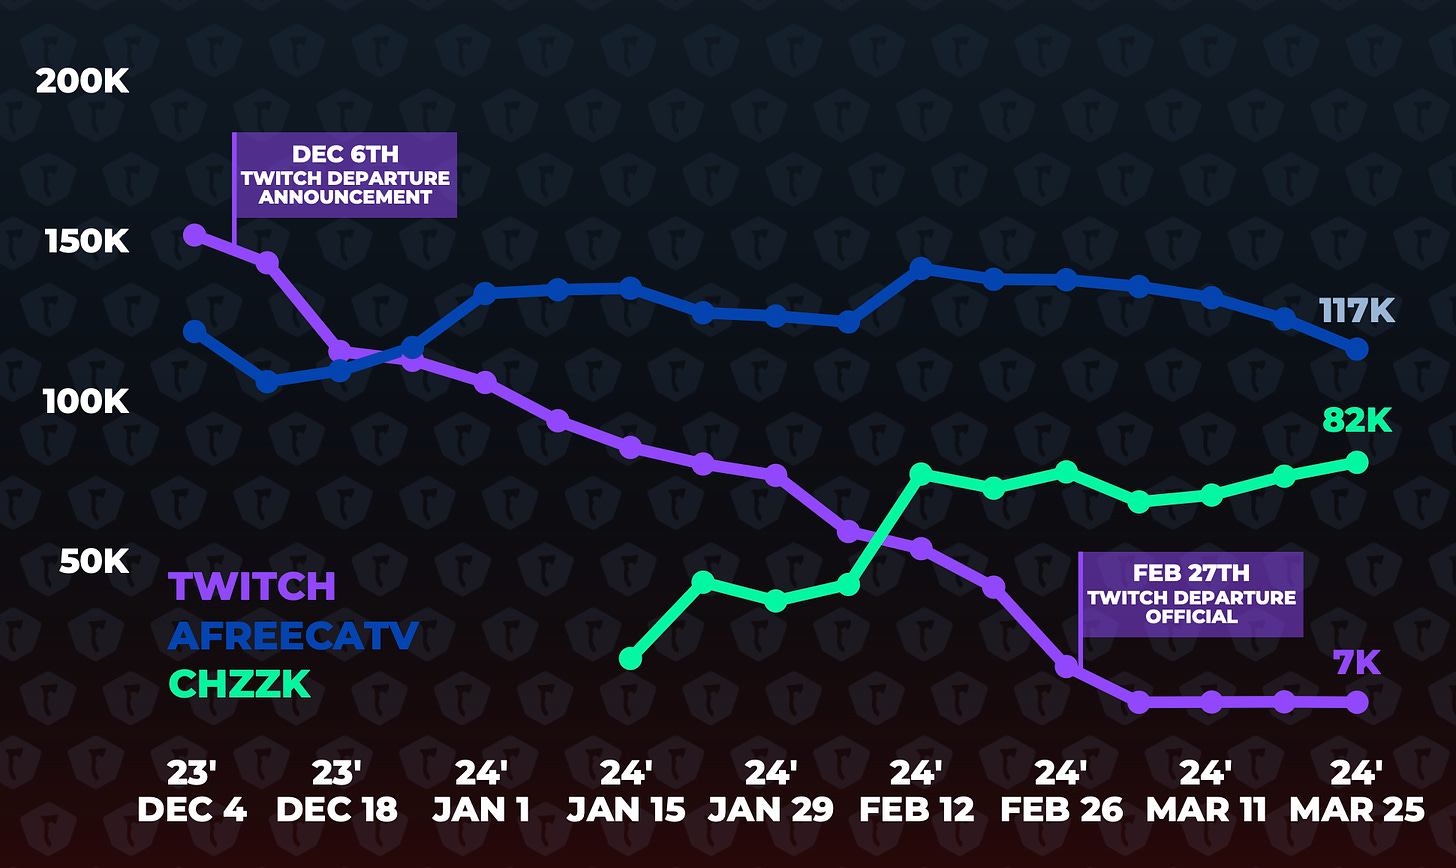
❗️CHZZK took the majority of the Twitch audience. AfreecaTV hasn’t benefitted that much. Curious to find reasons.
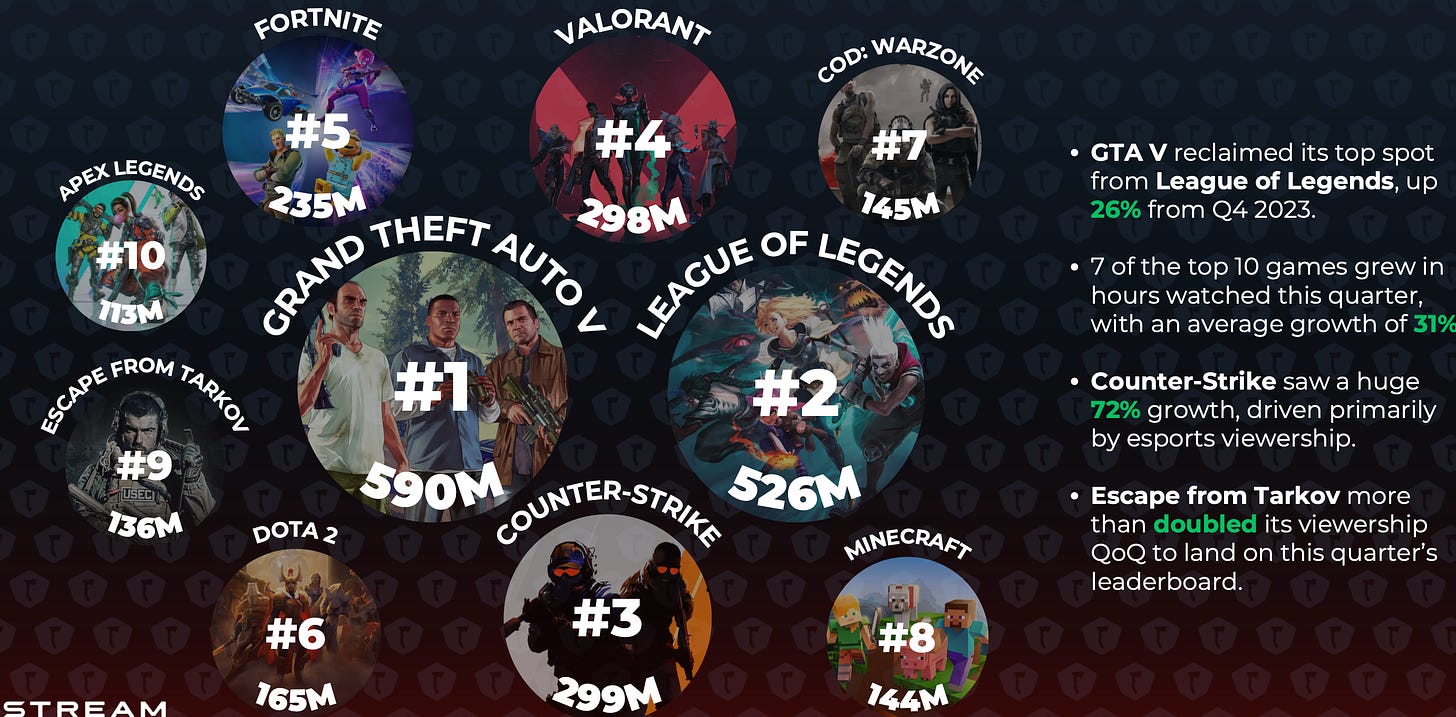
- Grand Theft Auto V (590 million hours), League of Legends (526 million hours), and Counter-Strike 2 (299 million hours, +72% QoQ) were the most-viewed games in the first quarter. Seven out of ten games in the top 10 saw growth in views, with an average increase of +31%.
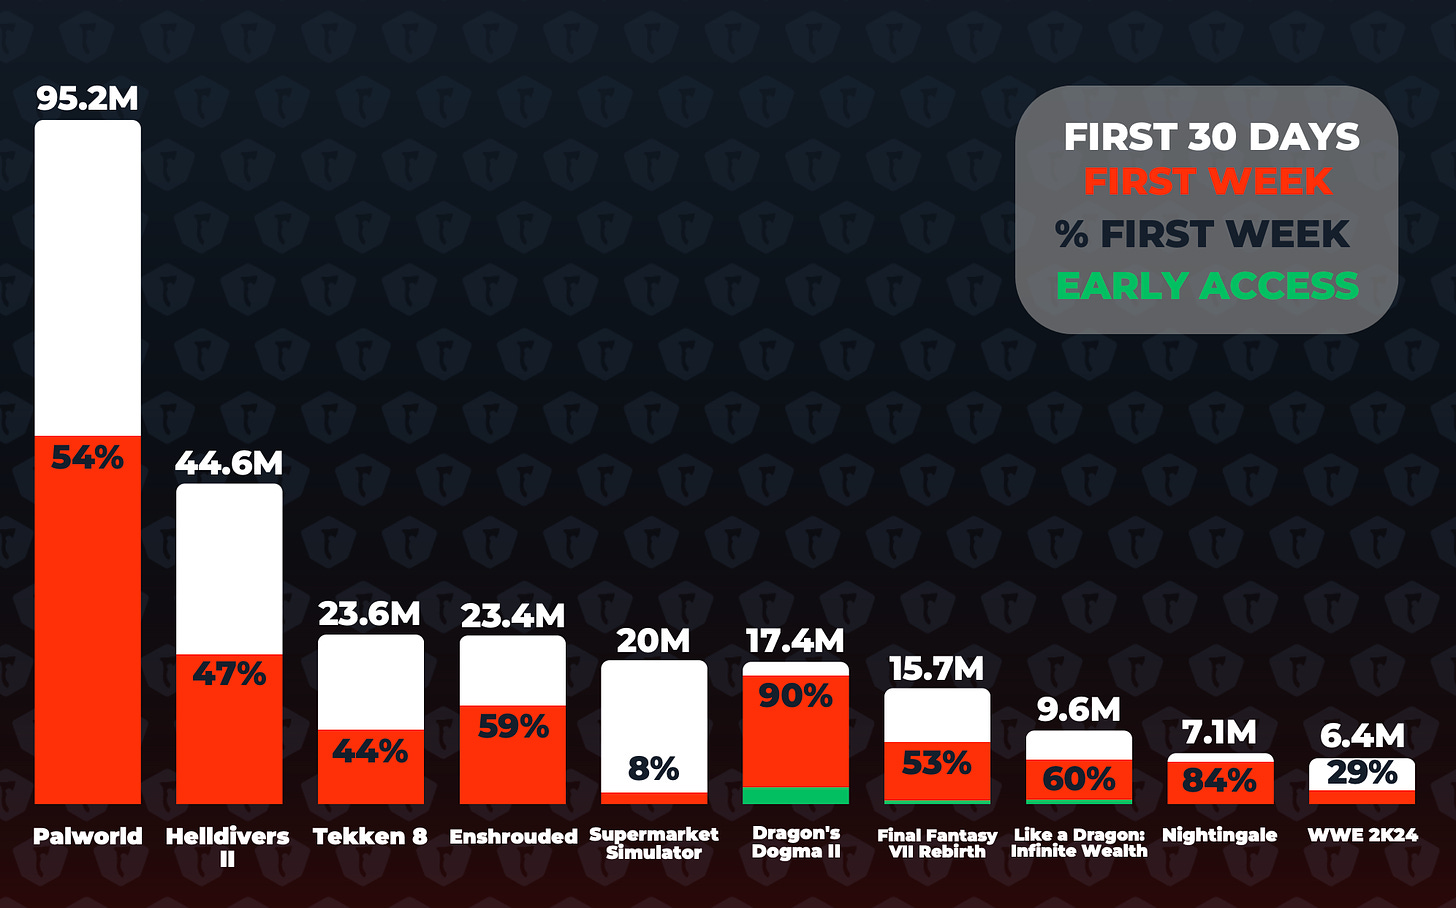
- Palworld was the most-viewed newcomer in Q1’24, garnering over 95 million viewing hours in its first month.
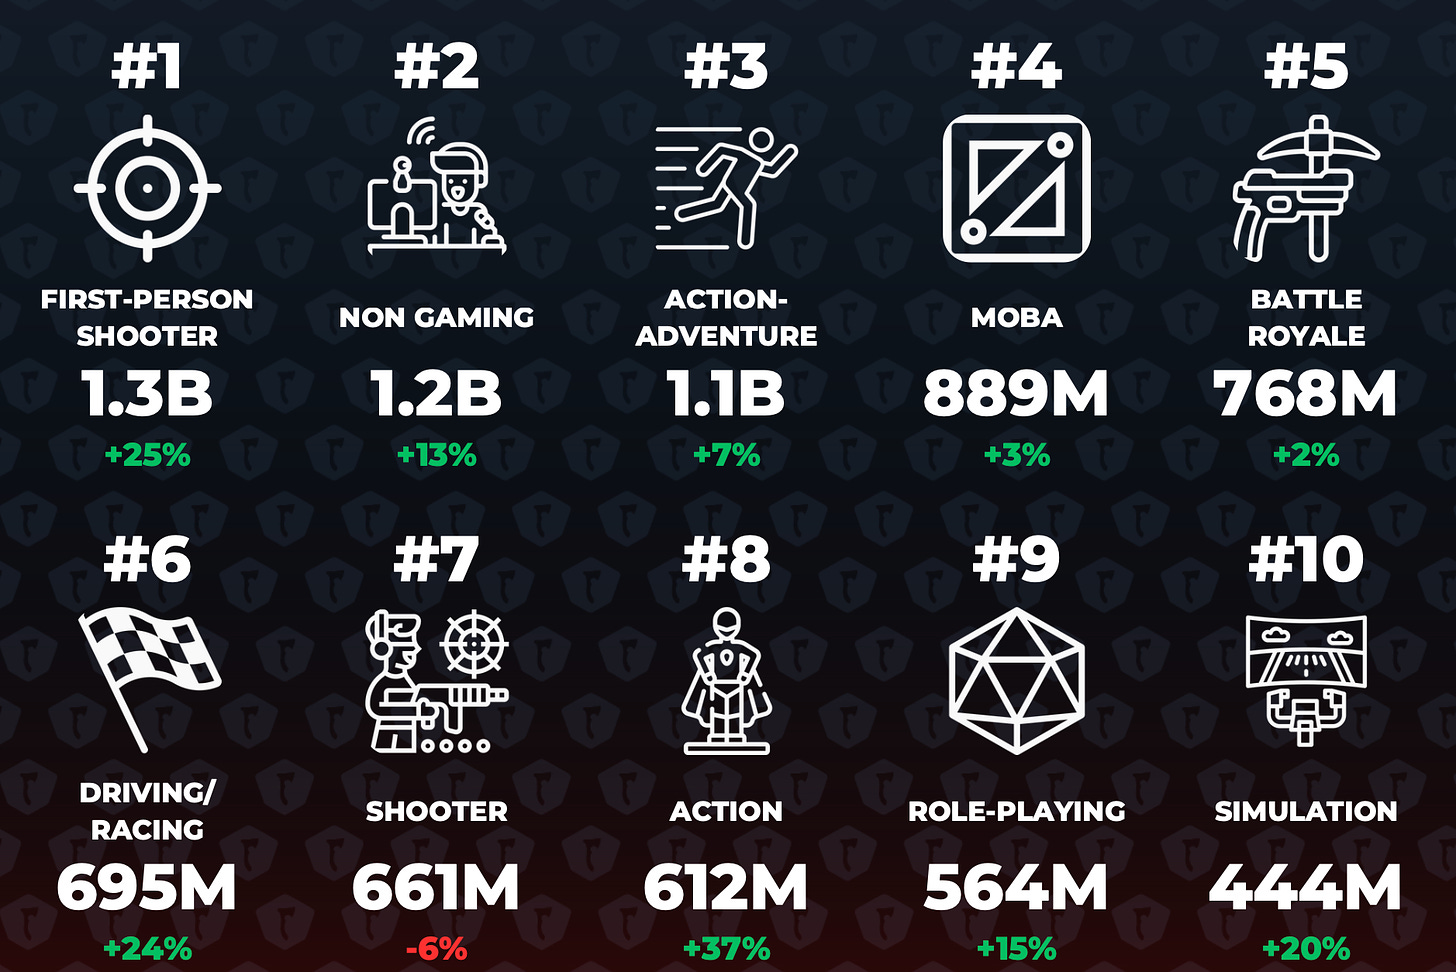
- FPS (1.3 billion hours, +25% QoQ), action-adventures (1.1 billion hours, +7% QoQ), and MOBA (889 million hours, +3% QoQ) were the most popular genres in the first quarter.
GameDiscoverCo: Data Consumption in Steam by Country in 2024
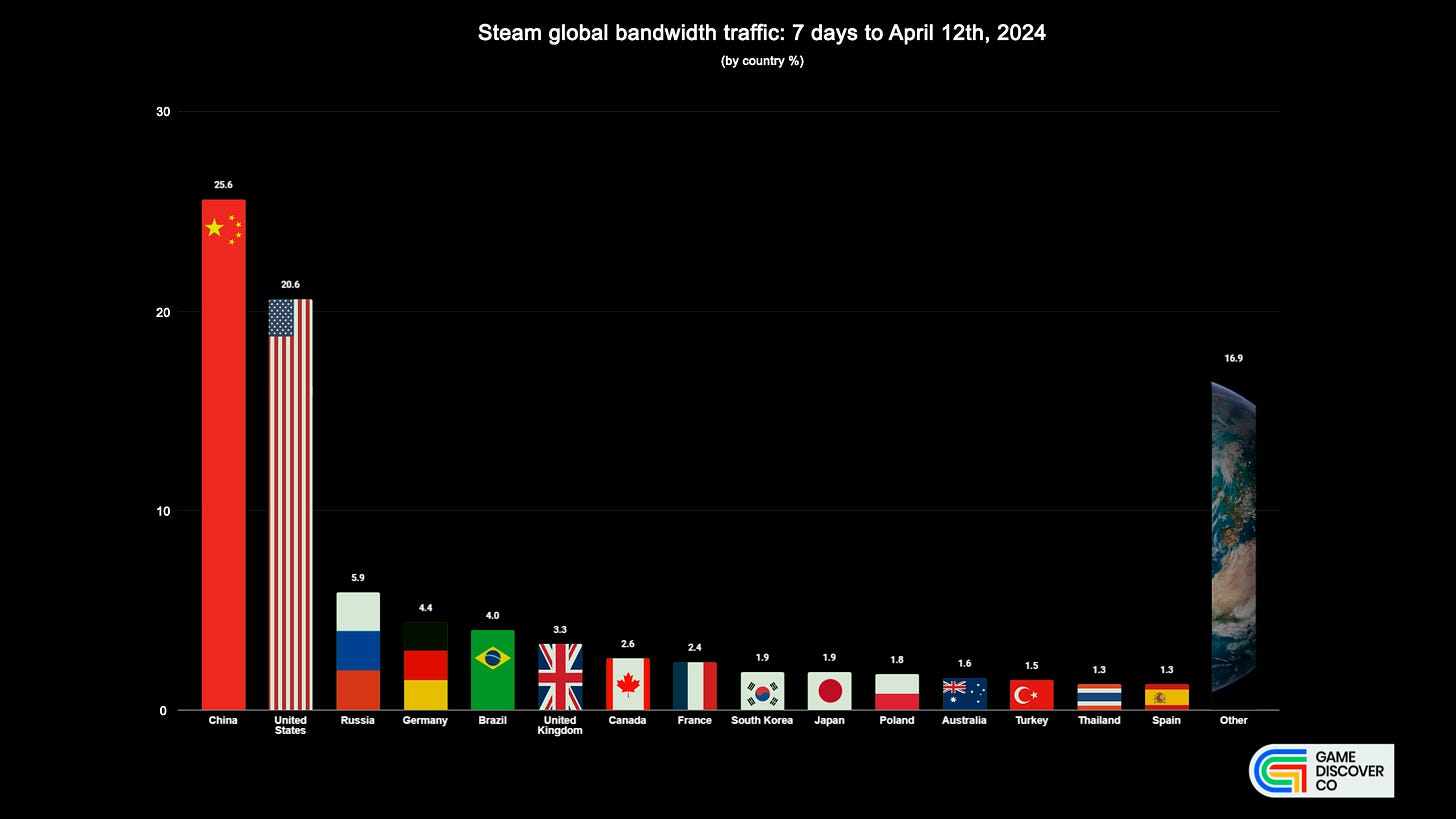
Data was collected from April 5th to April 12th, 2024.
-
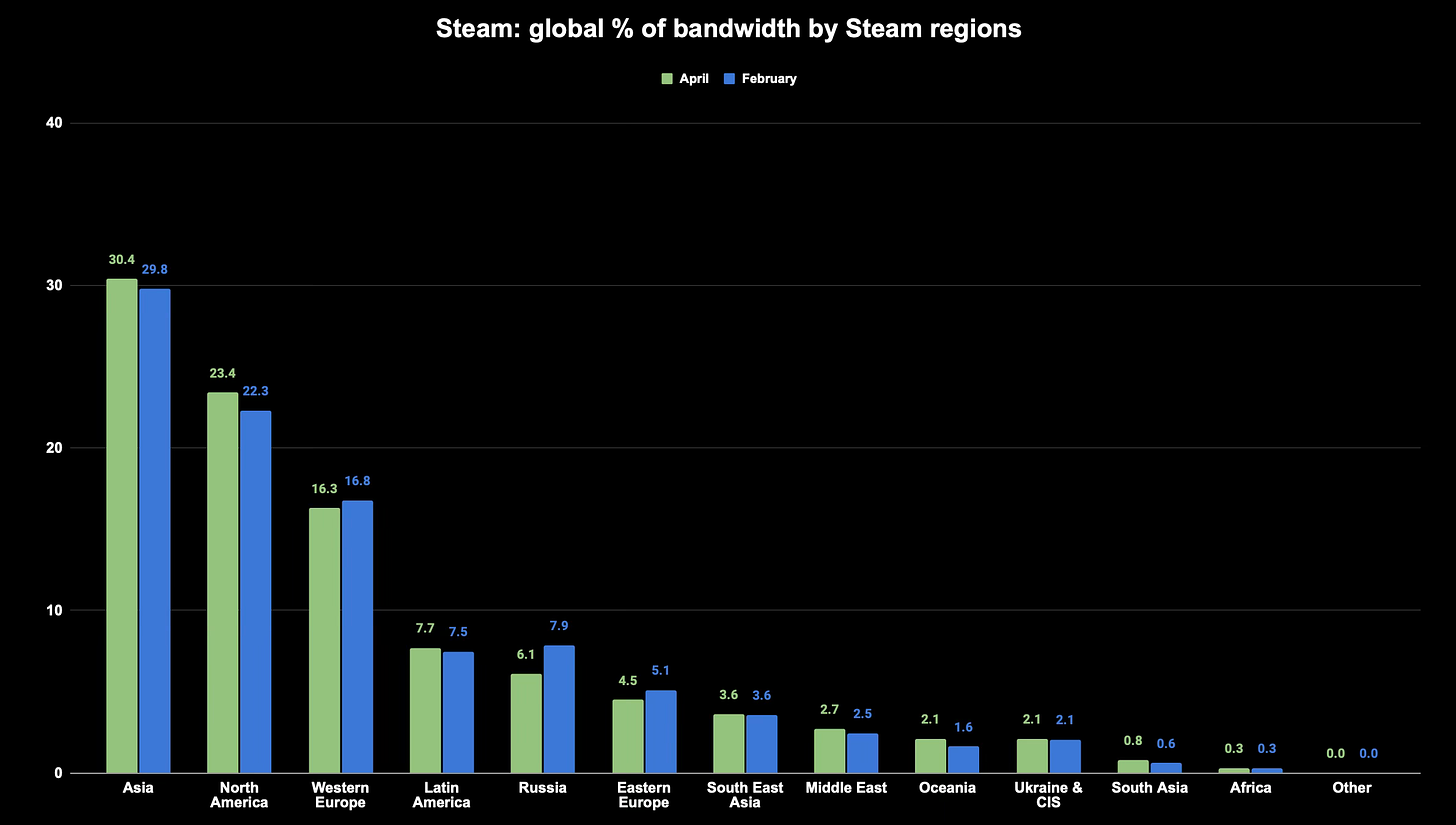
China accounts for 25.6% of all data consumption in Steam; the USA - 20.6%; Russia - 5.9%. These are the top three leaders.
❗️Bandwidth consumption does not indicate the number of users or revenue. Players may download more games or prefer more "heavy" projects.
-
It's unusual to see Thailand in the ranking. This country accounts for 1.3% of the total data volume.
-
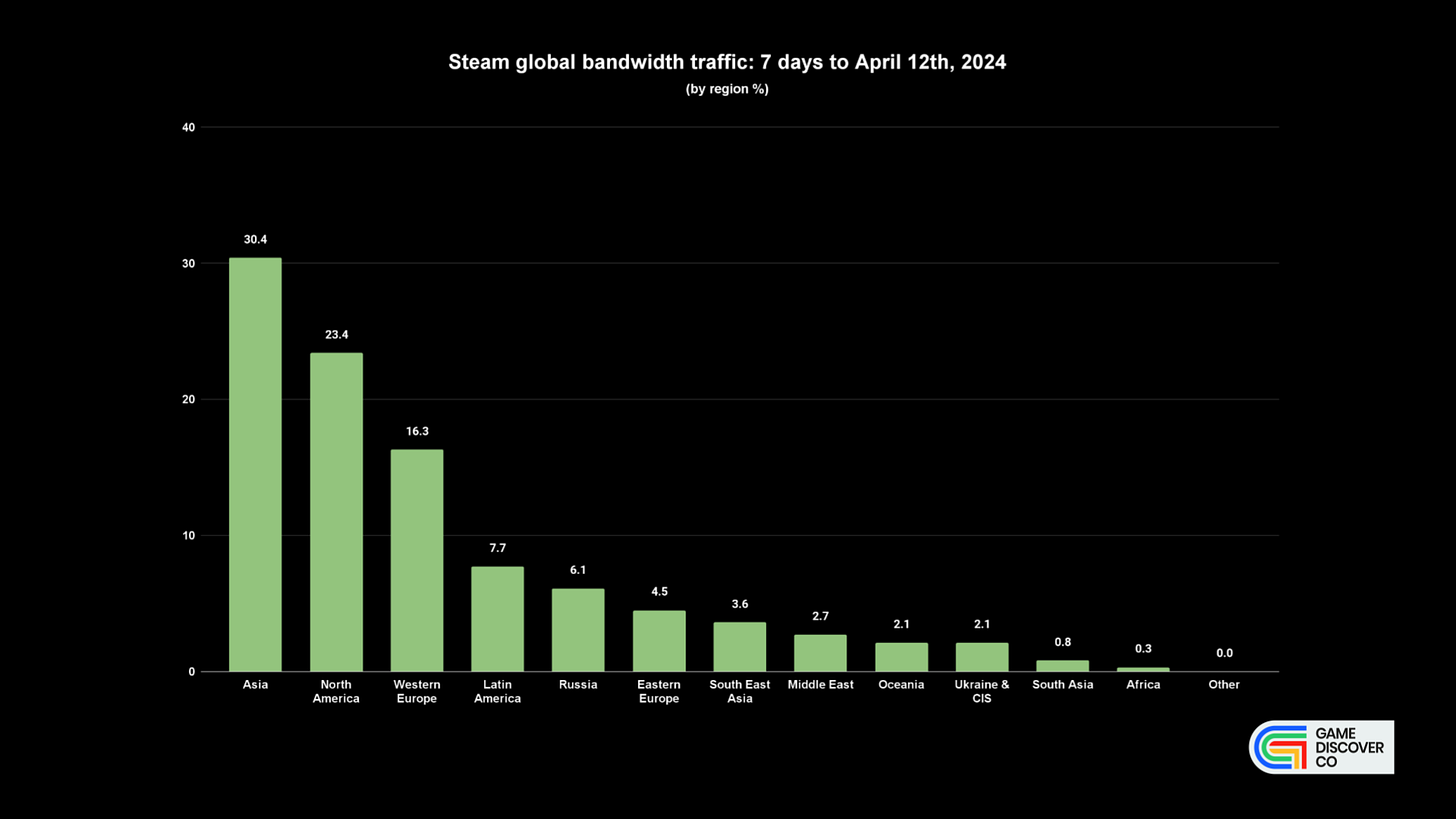
If we look at the distribution of data consumption by regions, Asia accounts for 30.4%; North America - 23.4%; Western Europe - 16.3%; Latin America - 7.7%; Russia - 6.1%; Eastern Europe - 4.5%; Southeast Asia - 3.6%; Middle East - 2.7%; Oceania - 2.1%; Ukraine and CIS - 2.1%.
By this link you will find the raw data and comparison with February data.
Newzoo: Outlast Trials became the top-grossing B2P adventure game of March

Newzoo is tracking data in 37 markets, excluding China and India.
-
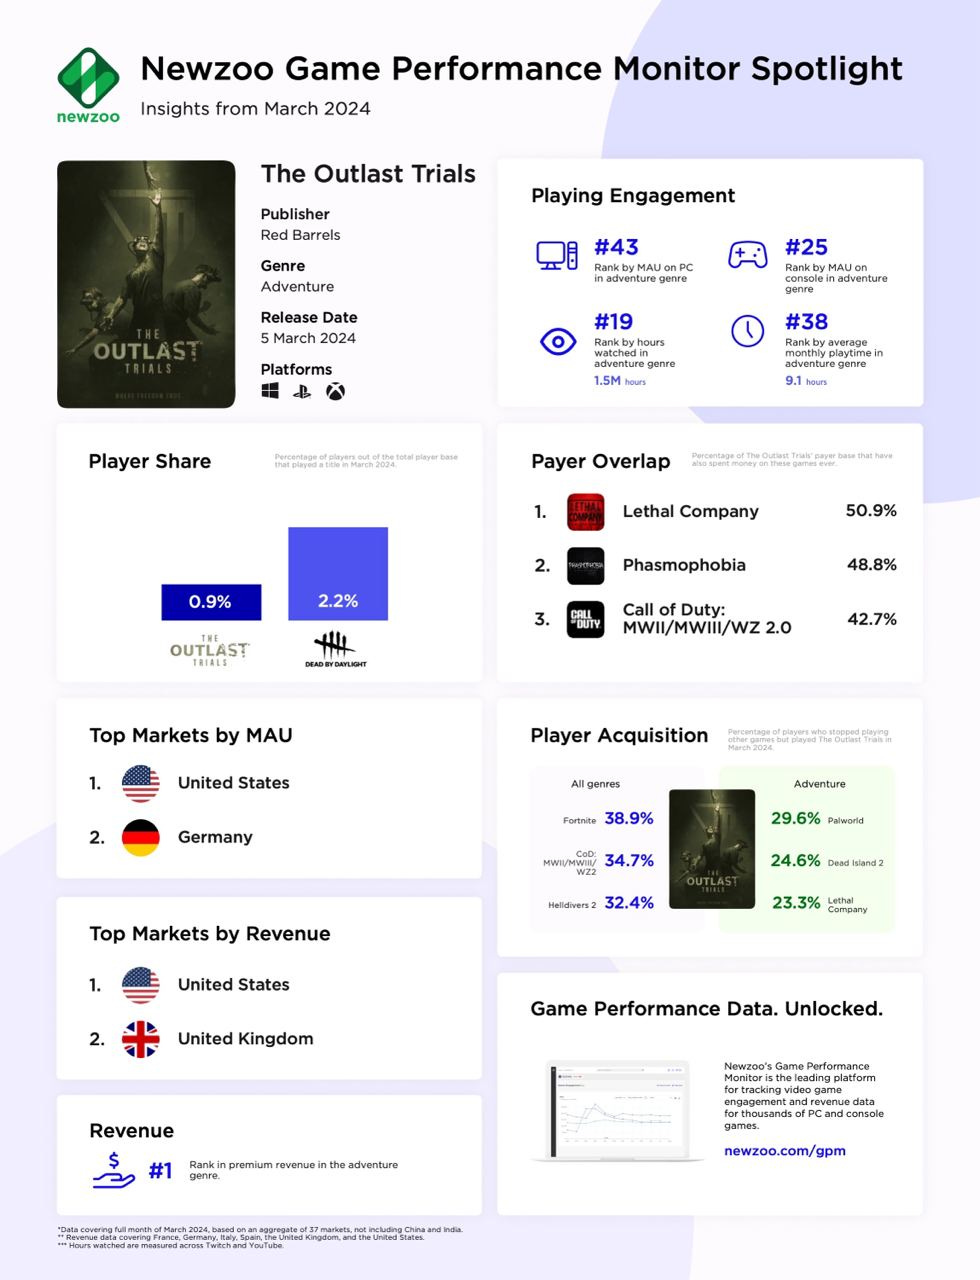
In terms of MAU, Outlast Trials ranked third among all games released in March. It was the top new adventure game in March based on this metric.
-
In overall MAU within the genre, the game ranks 30th. The majority of players are from the USA and Germany.
-
0.9% of the tracked audience played Outlast Trials. On average, they spent 9.1 hours in the game.
-
Users spent a total of 1.5 million hours watching content related to the game on Twitch and YouTube.
-
The highest number of users in Outlast Trials came from Fortnite (38.9%), Call of Duty (34.7%), and Helldivers II (32.4%). If we’ll look at adventure genre alone, most players came from Palworld (29.6%), Dead Island 2 (24.6%), and Lethal Company (23.3%).
-
The largest audience overlap with Outlast Trials is with Lethal Company (50.9% of users). Following are Phasmophobia (48.8%) and Call of Duty (42.7%).
-
Regarding overall revenue, GTA V leads in the genre. However, considering the business model, Outlast Trials is the top among paid games. It also ranks 7th in this metric among all games in March.
❗️You can question the taxonomy, though. What is adventure games, and what’s not.
-
The primary markets for Outlast Trials are the USA and the UK.
GameDiscoverCo: Conversion benchmarks of Steam wishlists into sales in the first month
700 games on Steam released since September 2023 were examined, each having at least 5,000 wishlists and 500 sales in the first month.
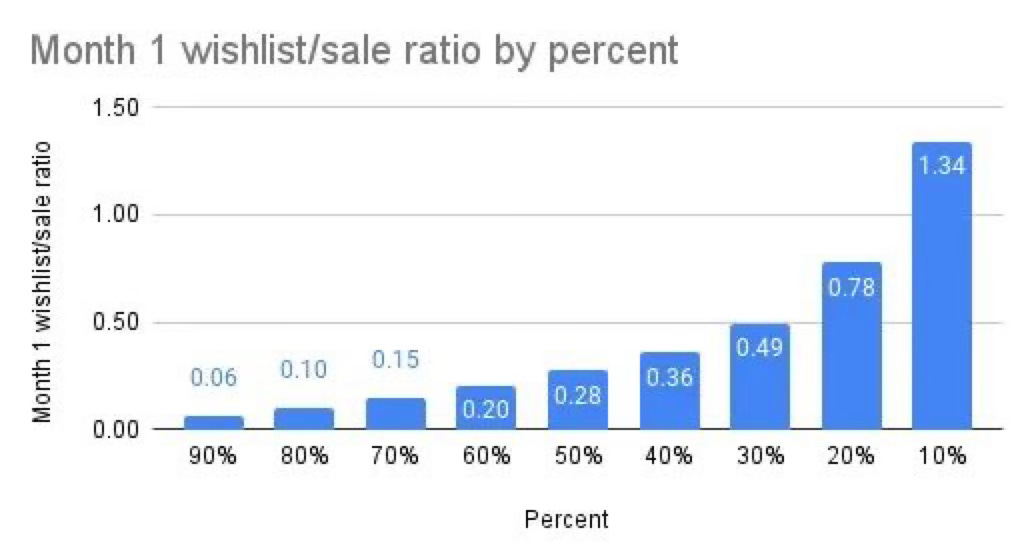
- Conversion in the first month ranges from 0.06 (10th percentile) to 1.34 (90th percentile).
-
The median conversion rate of wishlists to sales in the first month is 27%. In the first week, it is 22%.
-
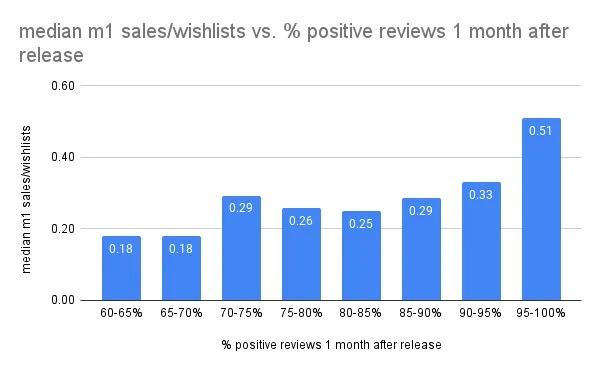
The higher the game's rating, on average, the higher the conversion rate from wishlists to sales. This is especially noticeable at ratings of 95%+ (Overwhelmingly Positive) - in such cases, the conversion is 0.51 in the first month.
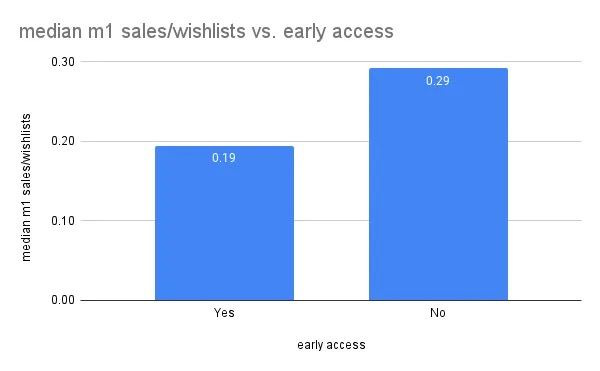
- On average, the conversion of wishlists to sales in Early Access is lower than at full 1.0 launch by third.
-
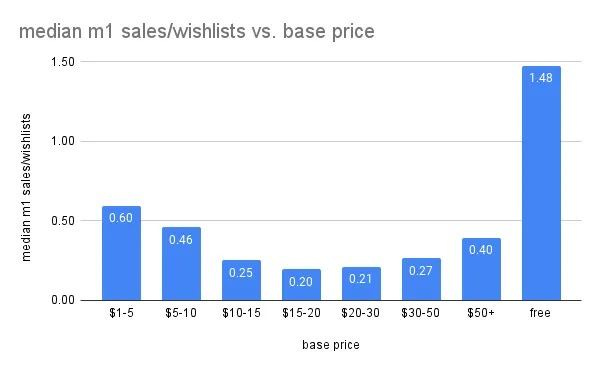
There is a correlation between conversion and price. For games priced between $1 and $10, and for free projects, the conversion is higher than for others. Conversion is worst for games priced at $15-30.
IGDA: Developer Satisfaction Survey 2023

The research was conducted from May 17th to October 20th, 2023. 777 people participated in it.
Demographics
-
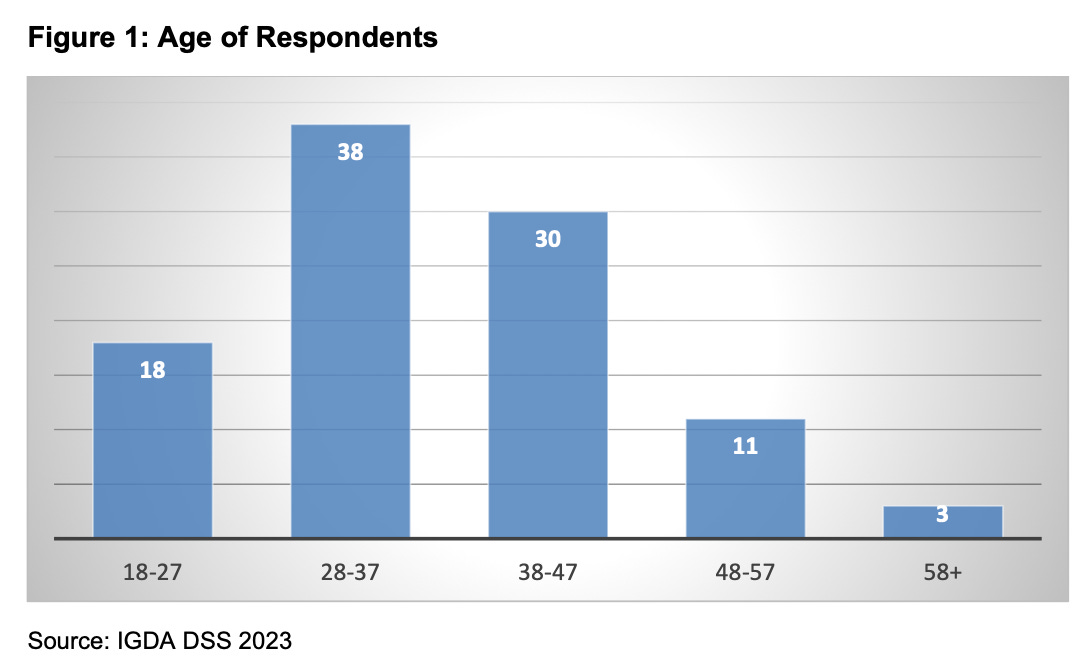
Most of respondents (68%) are between the ages of 28 and 47.
- Among the respondents, 63% are male, 31% are female, and the remaining 8% identify as non-binary individuals.
-
63% are married or in a relationship; 34% are single; 2% are divorced. 1% is missed somewhere. 27% of respondents have children.
-
IGDA notes that the sample had more white people and did not have enough representation of Latin Americans, African Americans, and Asian people.
-
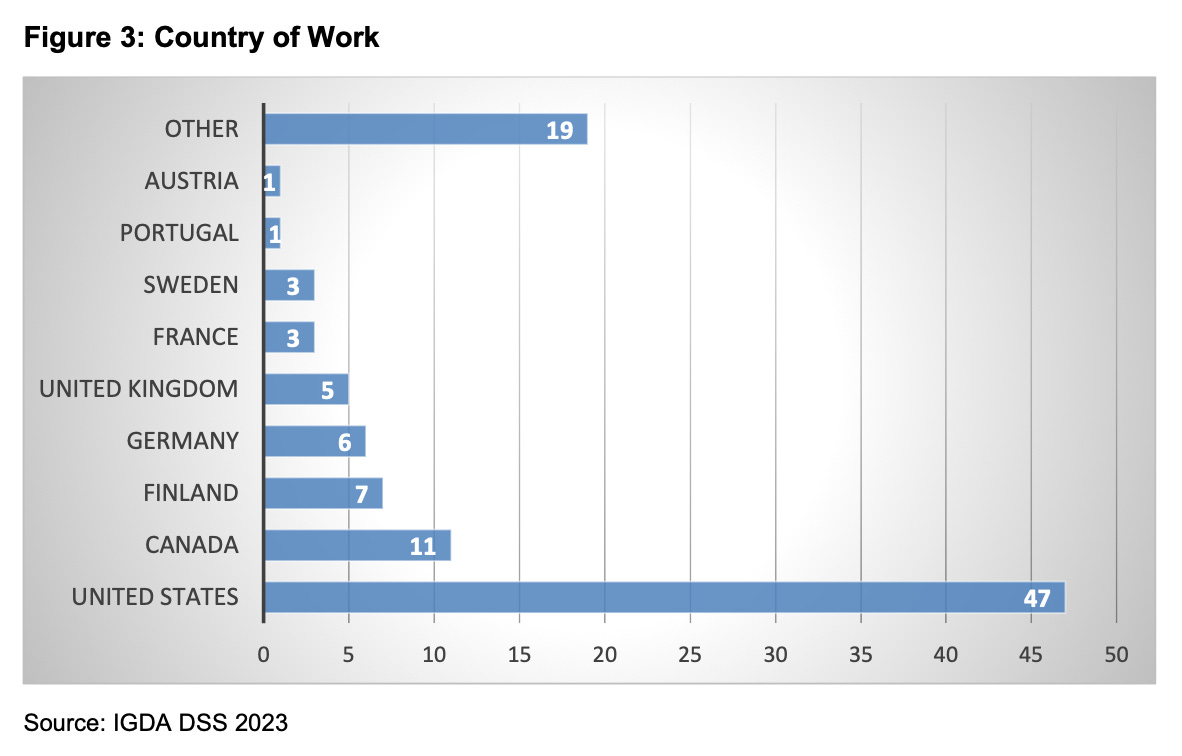
47% of respondents work in the USA; 11% - in Canada; 7% - in Finland; 6% - in Germany; 5% in the UK.
-
44% have mental or physical disabilities. 24% indicate they have neurodiversity; 15% report having mental illnesses.
Equality, Inclusion, and Diversity at Work
-
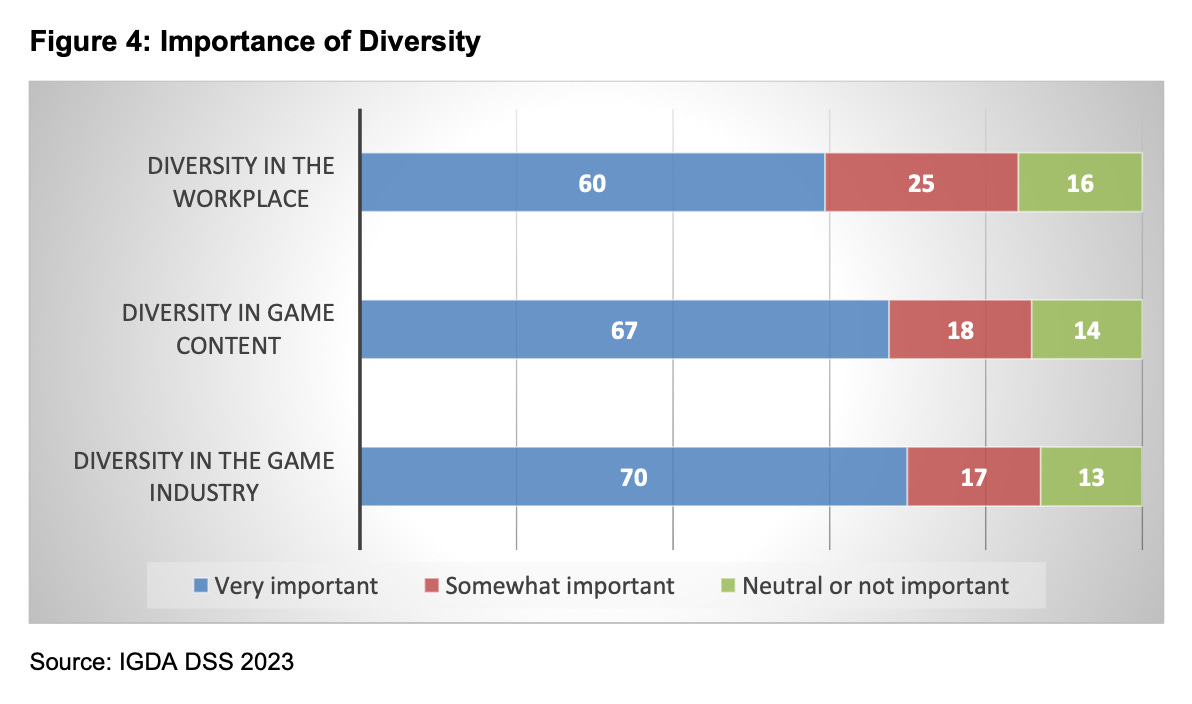
85% of respondents believe that equality, diversity, and inclusion are important in the workplace, in games, and in the gaming industry overall (87%).
-
58% of respondents believe that the gaming industry has become more inclusive and diverse in the past 2 years.
-
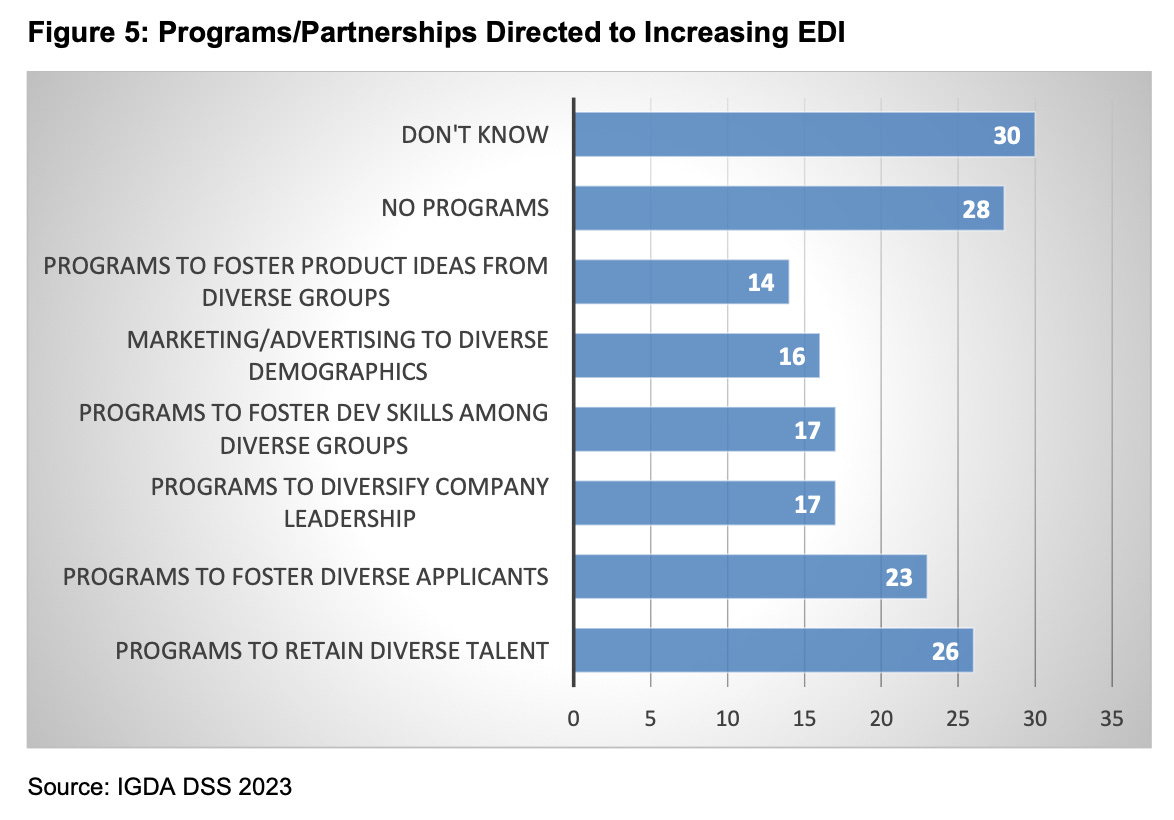
However, 28% note that their companies lack EDI programs. 30% don't know.
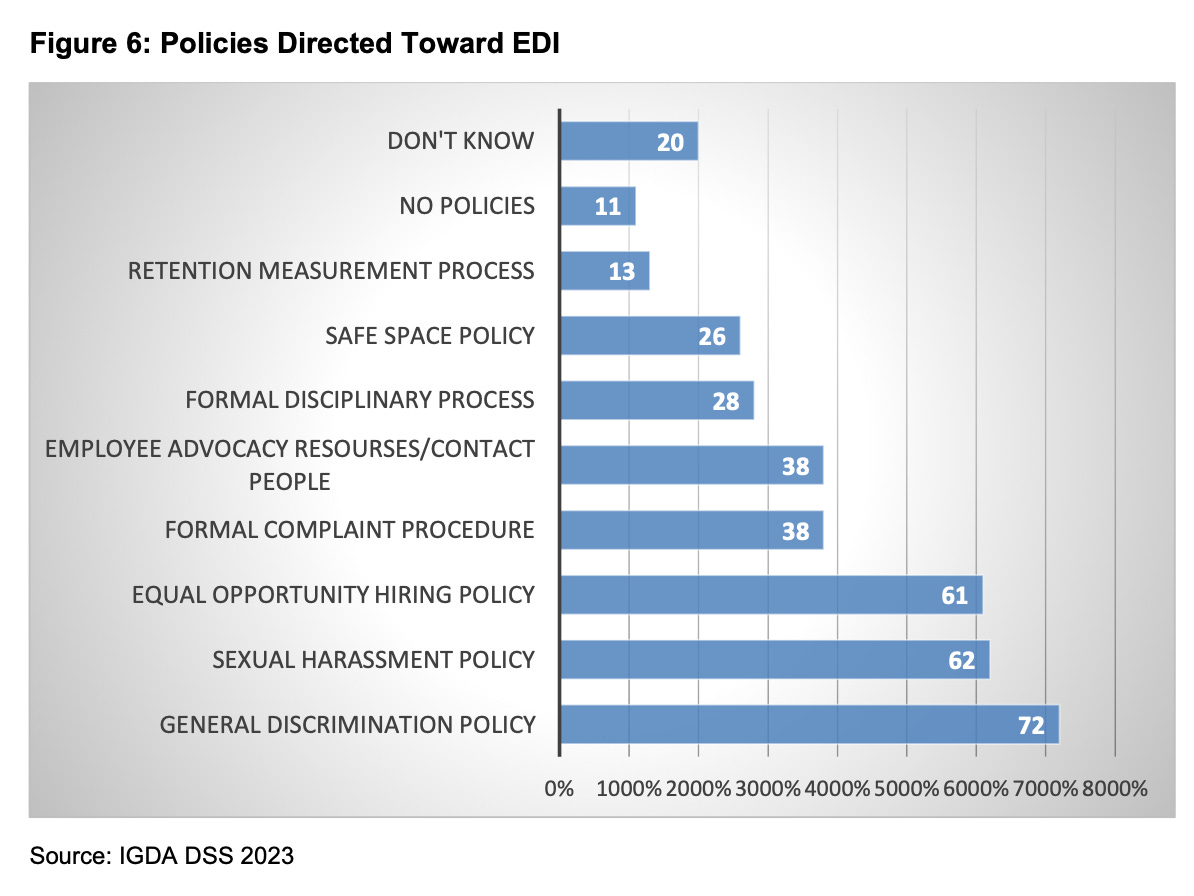
- 72% of respondents note that their companies have policies against gender discrimination. 61% note that companies adhere to inclusive hiring policies. 62% say that companies have programs against sexual harassment.
-
However, only 43% of respondents believe that all these policies actually work and are correctly implemented.
-
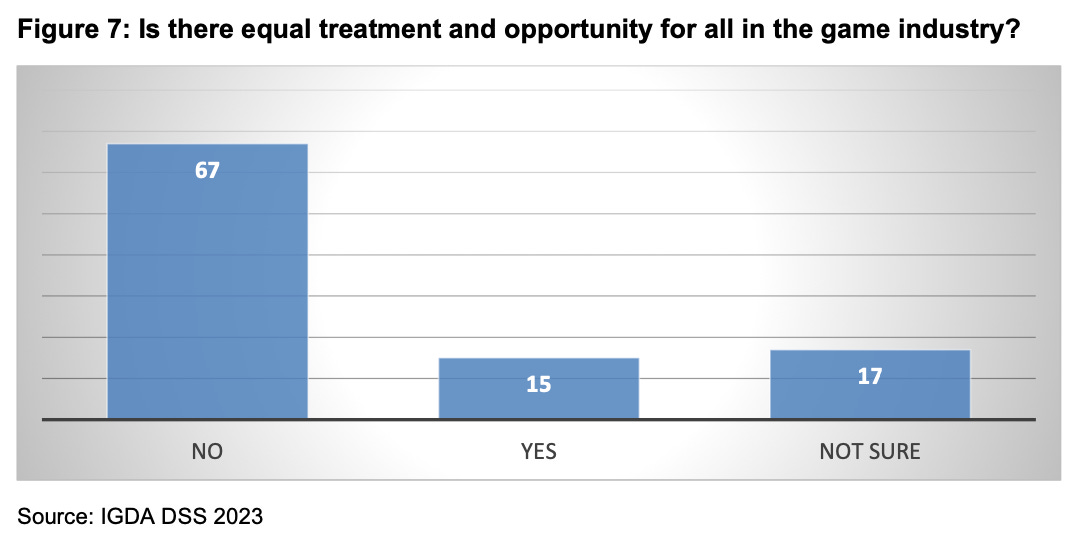
67% of respondents believe that there is discrimination in the gaming industry.
-
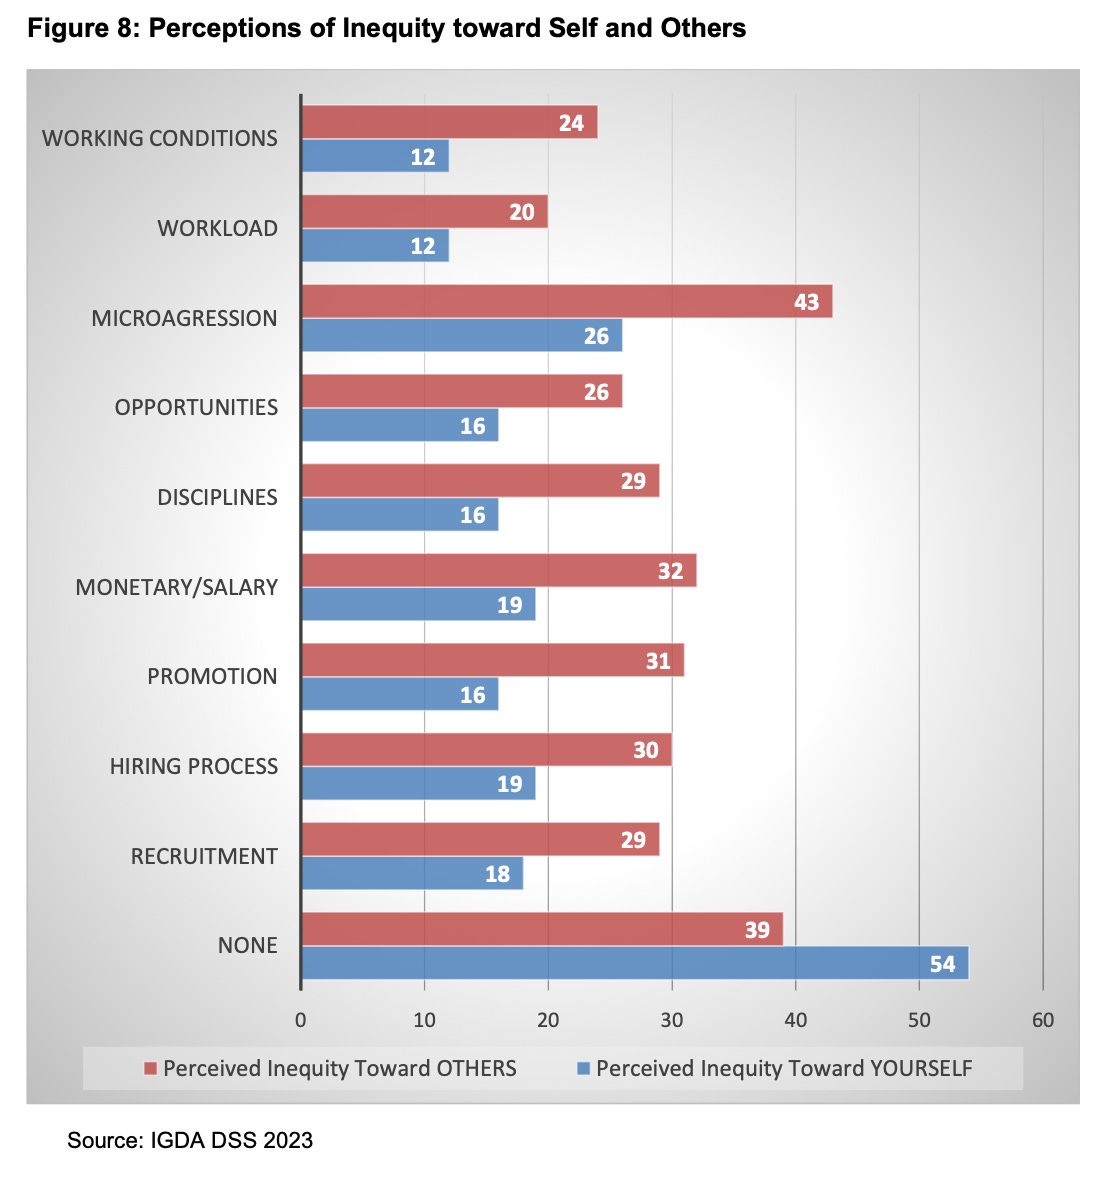
However, 54% of respondents have never personally experienced discrimination; 39% have never experienced it themselves and have not seen such examples in the market.
Employment
-
Only 4.8% of respondents noted that they are actively seeking employment. 52% were laid off; 15% voluntarily left their companies; 11% left because their contract ended; 11% were fired; 11% are self-employed without a current contract.
-
30% of unemployed people have been looking for work for over a year. 22% cannot find work for 3 to 6 months. Almost all (93%) are looking for work in the gaming industry.
-
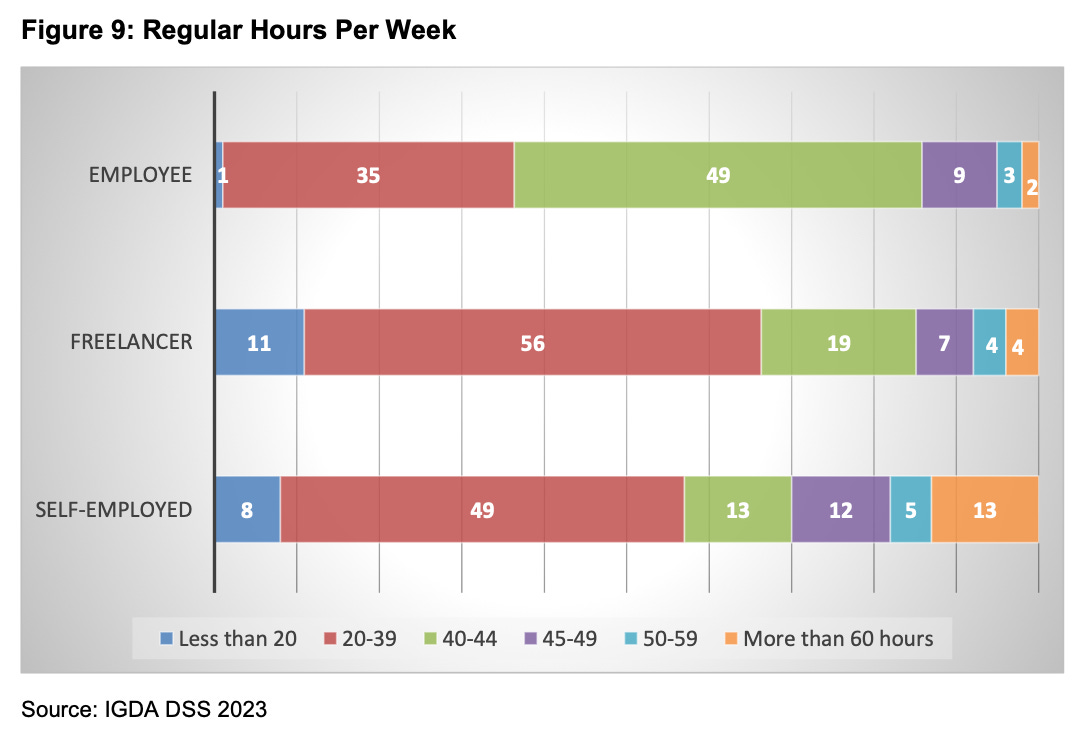
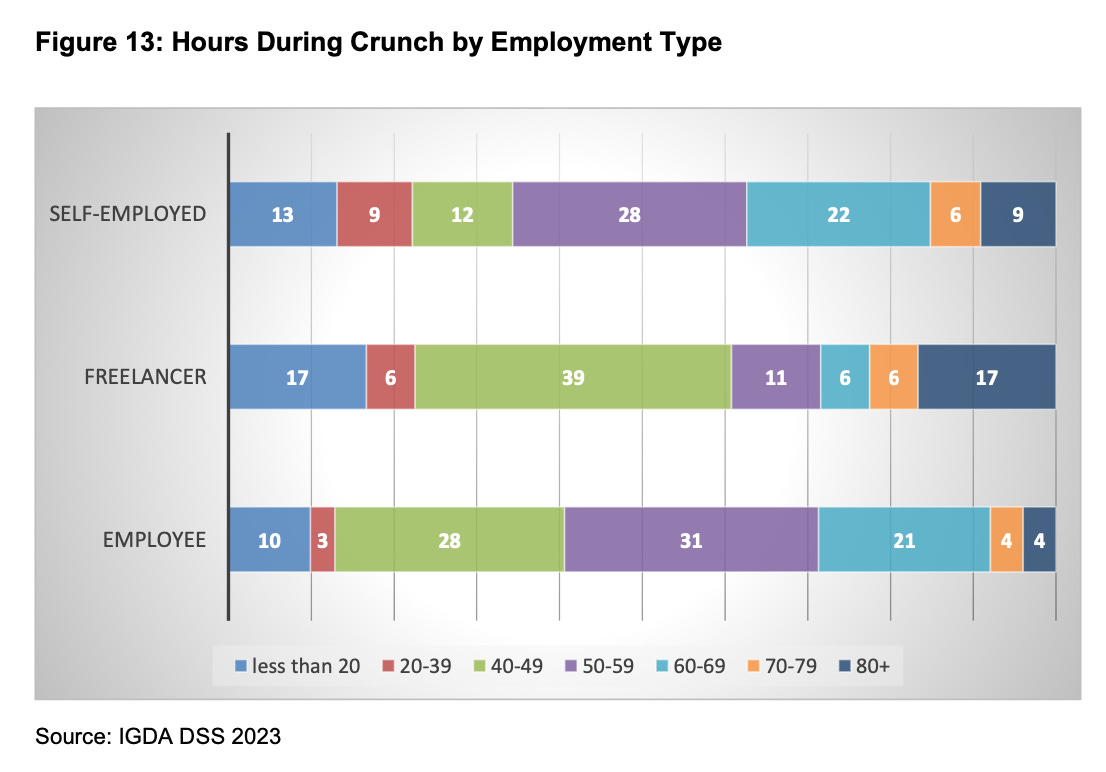
49% of employees work 40-44 hours per week. 35% work from 20 to 39 hours. However, self-employed individuals work overtime more often.
-
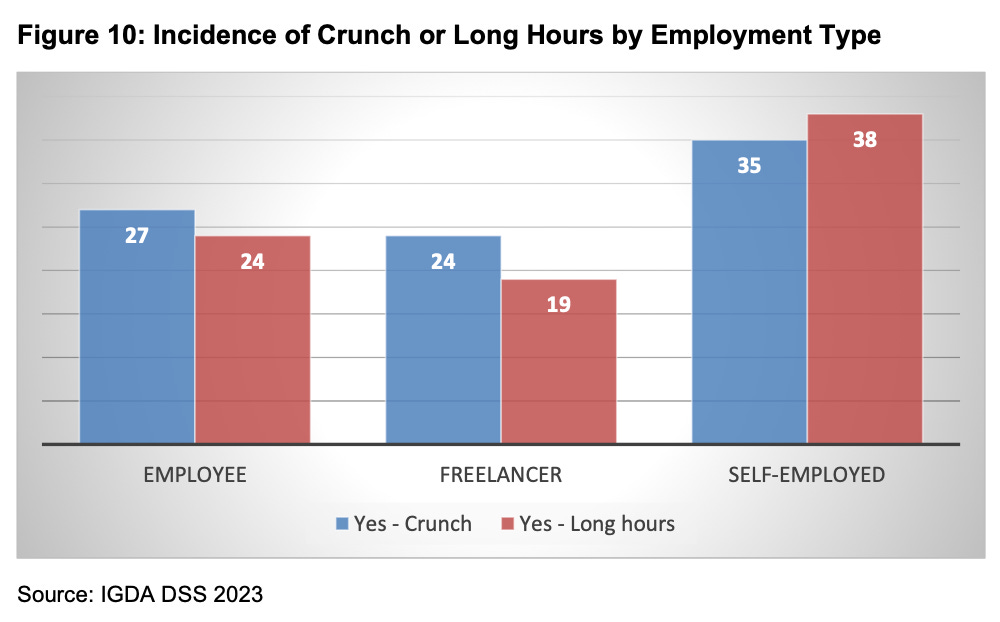
28% of employees note that they experience crunch; 25% reported that their work includes periods of long hours of overtime.
-
During crunches, 59% of specialists worked more than 50 hours per week. 10% had extreme overtime of 80+ hours per week.
Relationships with Employers
-
67% have good or excellent relationships with management. 23% described relationships as normal, and only 10% - as bad.
-
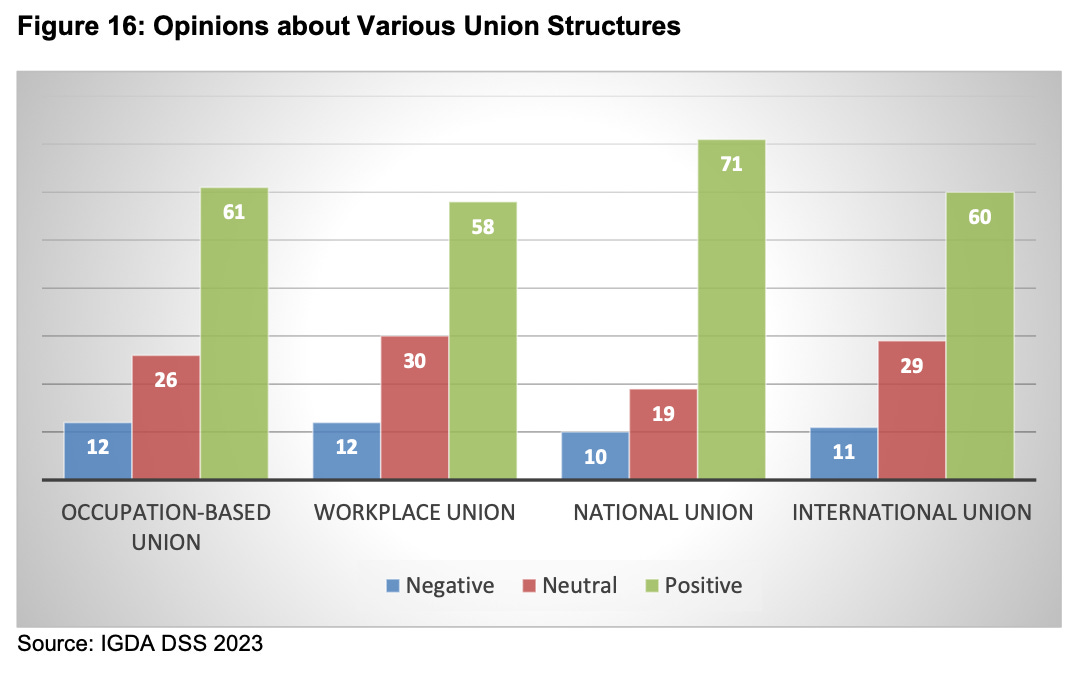
13% of respondents are members of a union. The percentage is higher than in 2021 (12%) and 2019 (6%). Most employees have a positive attitude towards unions.
-
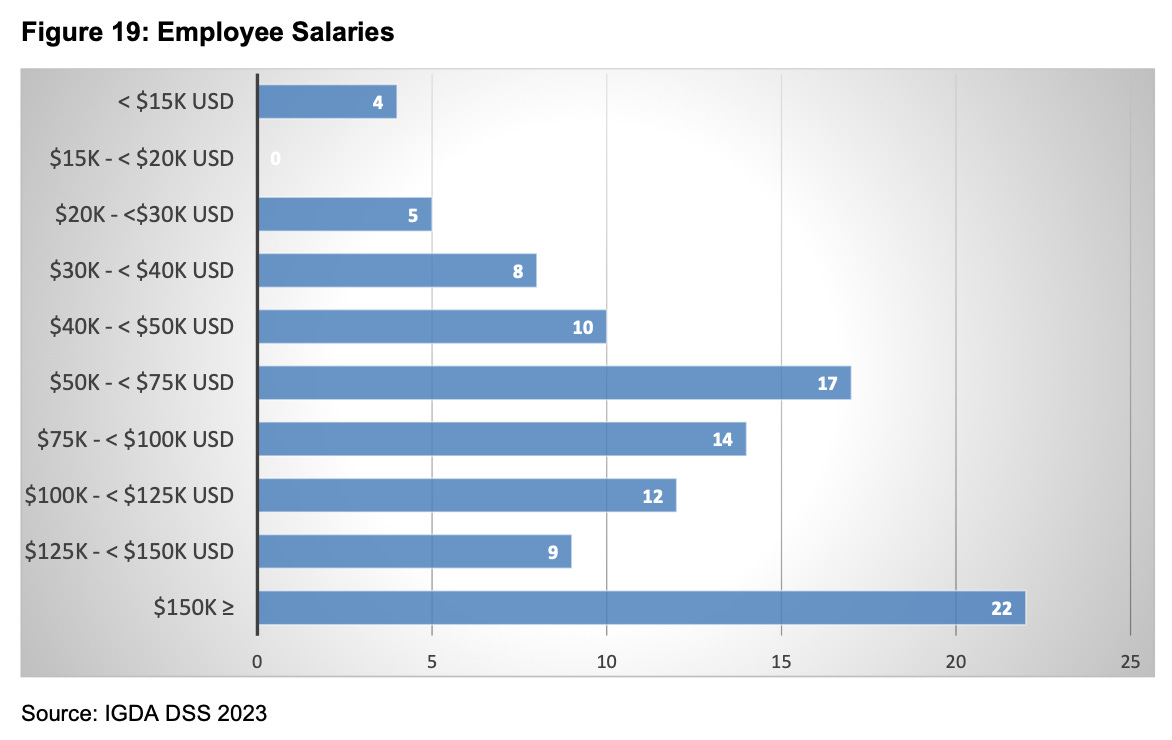
73% of full-time employees earn over $50,000 a year. However, 22% earn over $150,000 a year. Freelancers earn less on average; and self-employed individuals either earn very little (30% - less than $15,000 a year) or a lot (21% - over $150,000 a year).
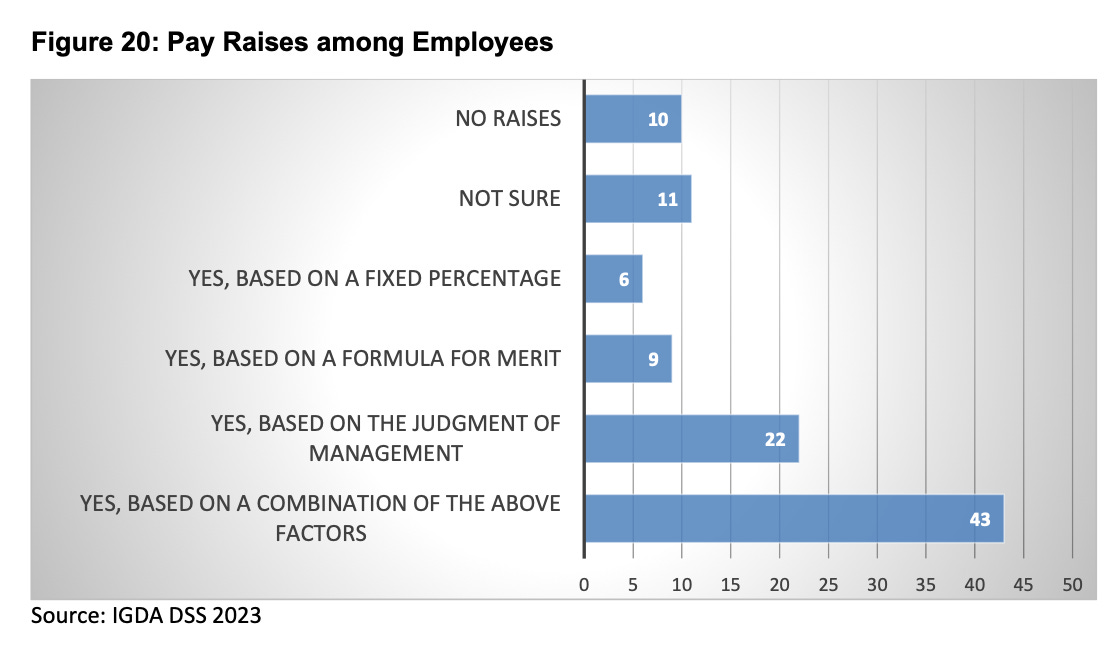
- 80% of full-time employees note that their companies have salary increase programs.
- 32% of employees do not receive any overtime compensation.
GSD & GfK: Fallout 4 became the best-selling PC/Console game of April in the UK
Analytical platforms report only the actual sales figures obtained directly from partners. The mobile segment is not taken into account.
Game sales
-
2.23 million games were sold in April 2024 in the UK. This is 7% less than the previous year. We should note, that Star Wars Jedi: Survivor and Dead Island 2 were released in April 2023, and they make the difference.
-
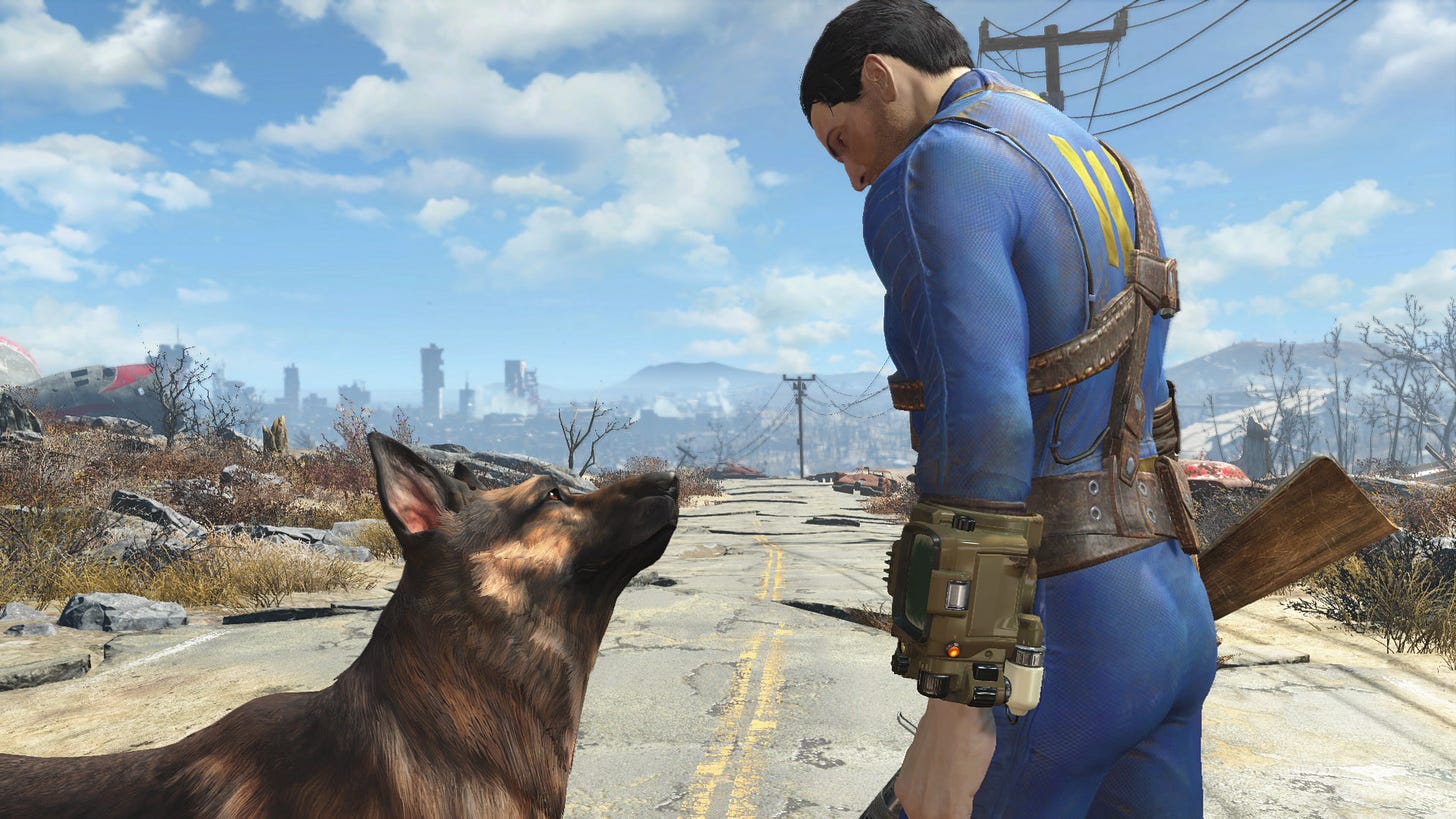
Fallout 4, amidst the success of the series, became the best-selling game in the UK. Fallout: New Vegas entered at 8th place; Fallout 76 - at 9th; Fallout 3 - at 11th.
-
Stellar Blade debuted at 12th place on the chart. The game is available exclusively on PlayStation 5.
-
EA Sports FC 24 (2nd place) and Helldivers II (3rd place) traditionally sell well.
Console sales
-
In April, 71 thousand consoles were purchased in the UK. The number of systems sold plummeted by 39% YoY.
-
PlayStation 5 and Xbox Series S|X sales decline is approximately the same (-25% YoY); Nintendo Switch fell by 38%.
❗️Here, presumably, GfK refers to a decline in sales in dollar terms.
-
530k accessories were sold in April - it’s 28% less than the previous month; but 7% more than in April of the previous year. DualSense is the sales leader.
PC/console games
-
Helldivers II sold 12 million copies in 12 weeks, surpassing the previous record holder, God of War: Ragnarok (11 million copies in 3 months).
-
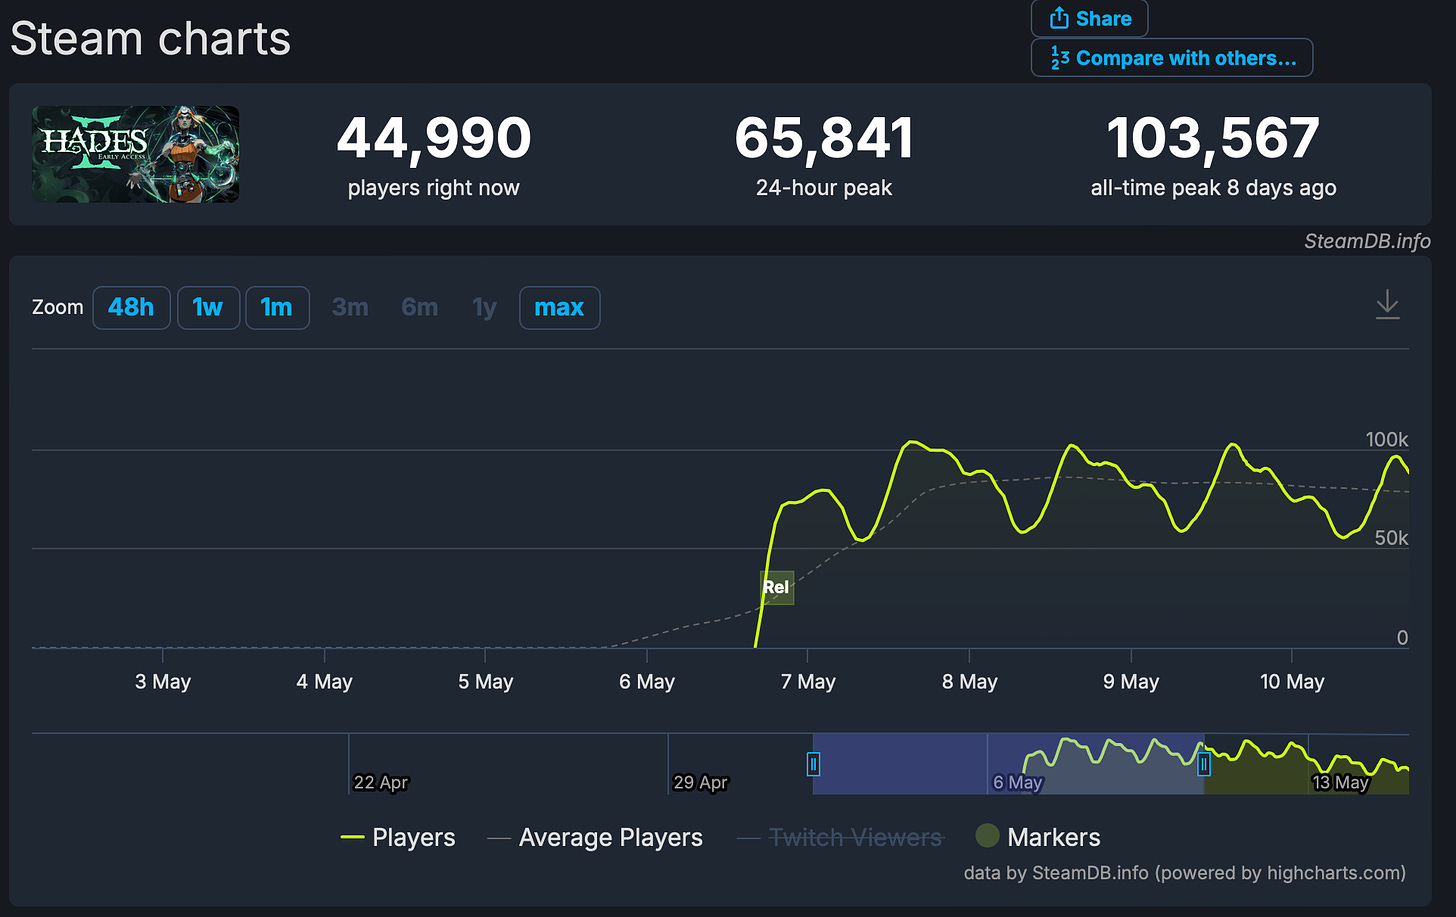
Hades II topped the chart of paid game sales on Steam from May 7th to May 14th. The peak online player count reached 103.5k. The first part's record was 37.7k. VG Insights estimates that the game has already been purchased 831 thousand times.
-
7 million people played Dead Island 2 over the year. These are not sales, as the game appeared on Game Pass in February. 2 million copies were bought in the first month.
-
Koei Tecmo reported that Rise of the Ronin's sales exceeded each of the two Nioh parts in the first month (the first part sold only 3 million copies; the second - 2 million).
-
Just two days after the release, Gray Zone Warfare sold 400 thousand copies.
-
Little Kitty, Big City, a game about a kitten's adventures in the city, was bought 100 thousand times in 2 days. The game is also available on Game Pass.
-
The Polish team Donkey Crew announced that Bellwright sold 150 thousand copies in 12 days. The game was released in early access on Steam on April 23rd.
Mobile games
-
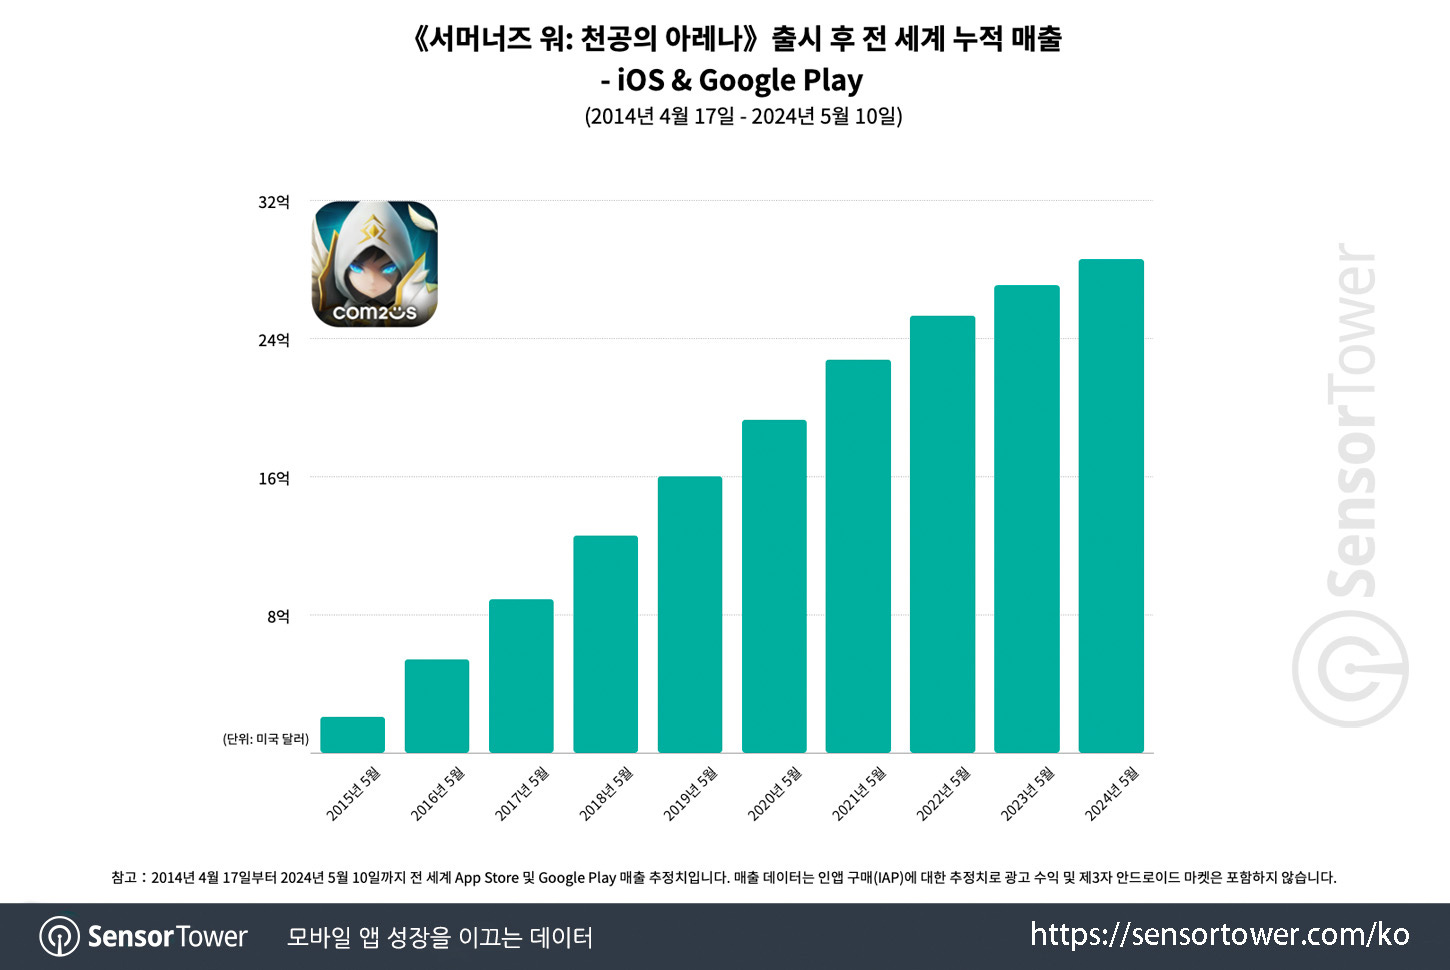
Sensor Tower reports that Summoner’s War has earned over $3 billion in revenue in the 10 years since its release. 30.4% of this amount came from the USA, and 18.1% from Japan. The game ranks 6th in the list of highest-grossing RPGs over the past 2 years.
-
Uma Musume Pretty Derby has earned $2.4 billion in three years, according to Sensor Tower. 90% of the revenue came from Japan. 78% of the audience are men.
-
Squad Busters reached 30 million early registrations in 11 days. The company aimed to achieve this figure by the release on May 29th.
-
Over 100 million people played AFK Arena. Lilith Games shared this figure in celebration of the project's 5th anniversary.
Shift Up, the creators of Goddess of Victory: Nikke, revealed that the project generated $750 million in revenue over 1.5 years. 61% of this amount came from Japan, 17% from the USA, and 14% from South Korea.
SGA: The Serbian gaming industry doubled its workforce in 2023

The study covers 80% of association representatives. Financial indicators represent the status of the country's top 21 companies.
Overall figures
-
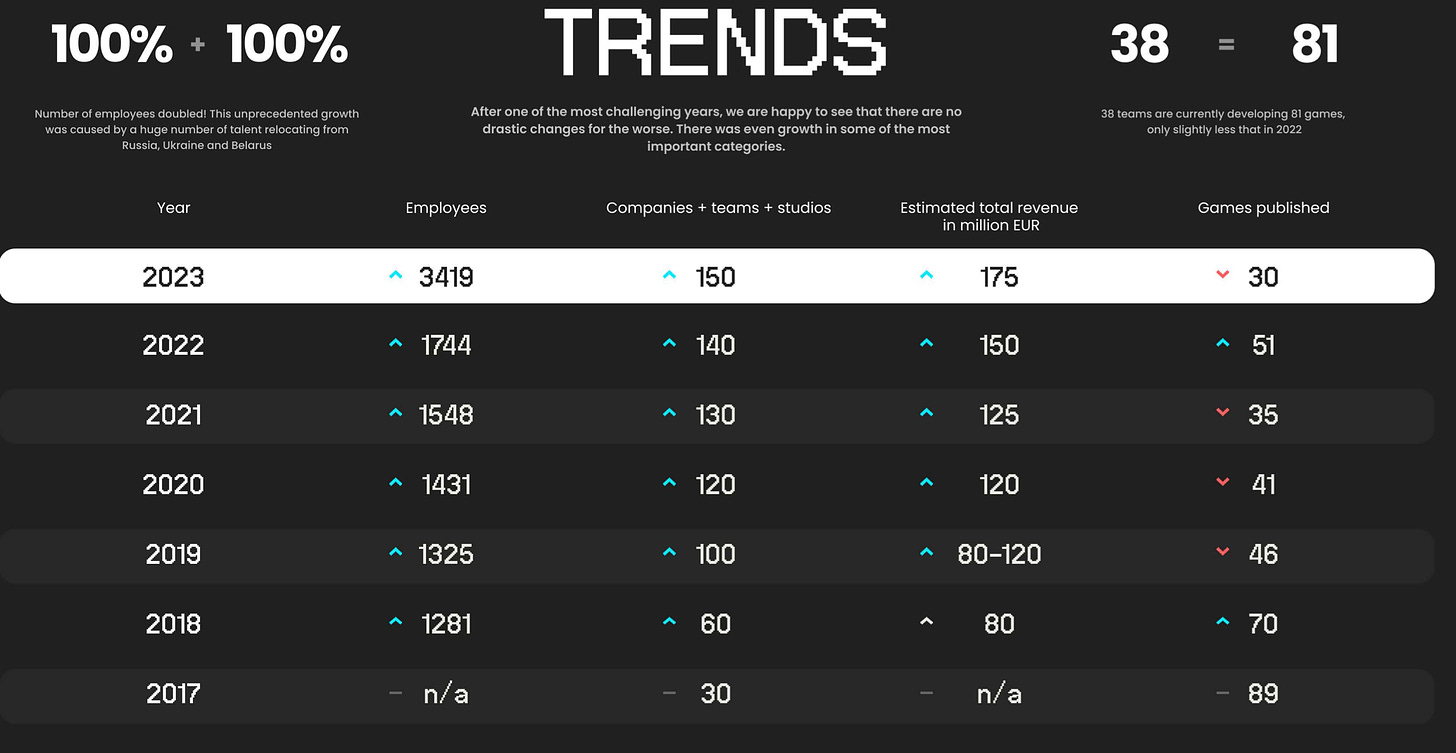
In 2023, the top 15 Serbian companies earned over €175 million in revenue (+17% YoY).
-
By the end of 2023, there were over 150 gaming companies and teams in the country.
-
Around 4300 gaming industry professionals reside in Serbia, with one-third of them being women. Moreover, half of the management in Serbian companies are female.
-
In 2023, Serbian companies released 30 projects, with 81 in development. PC remains the primary revenue platform.
Revenue
-
The main markets for Serbian companies are the USA, Europe, and the UK.
-
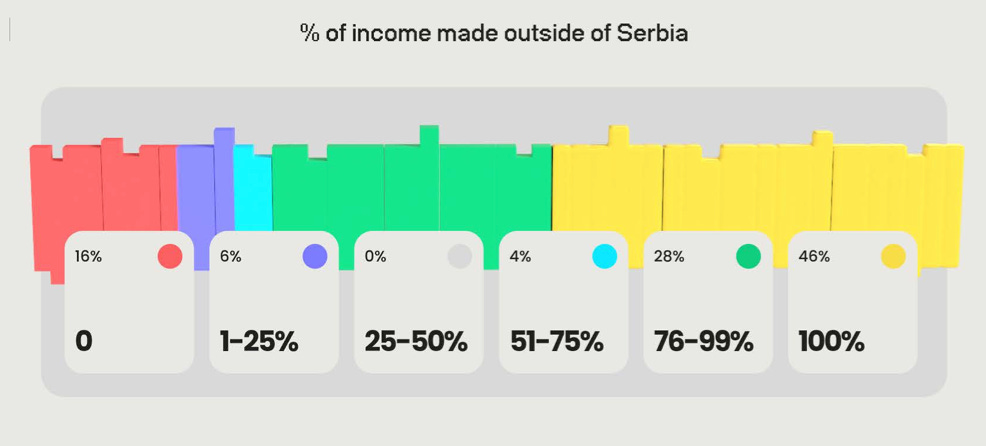
46% of Serbian companies earn 100% of their revenue abroad, with 16% having no revenue sources outside Serbia.
-
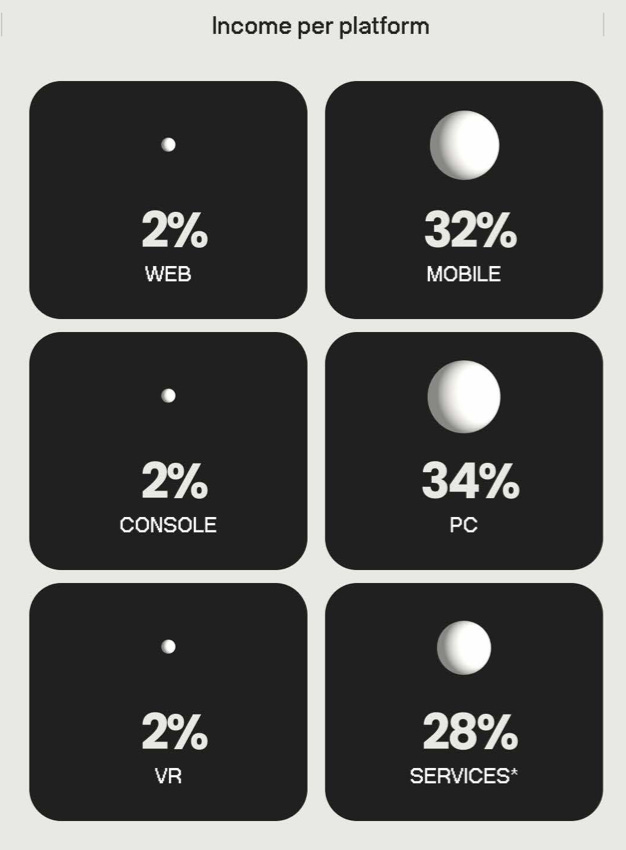
34% of the total revenue volume comes from PC projects, 32% from the mobile segment, and 28% from various services.
Business in Serbia
-
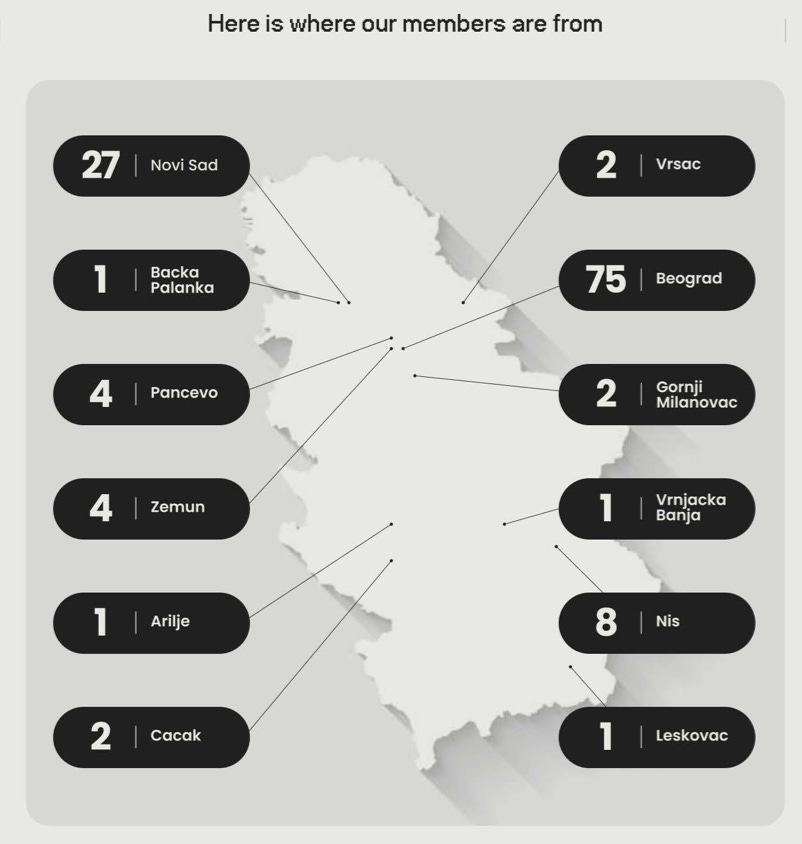
Most gaming studios are located in Belgrade (75) and Novi Sad (27).
-
57% are developers working on their IP, 11% are outsourcers, 7% are art outsourcers, and 6% develop their own technological solutions.
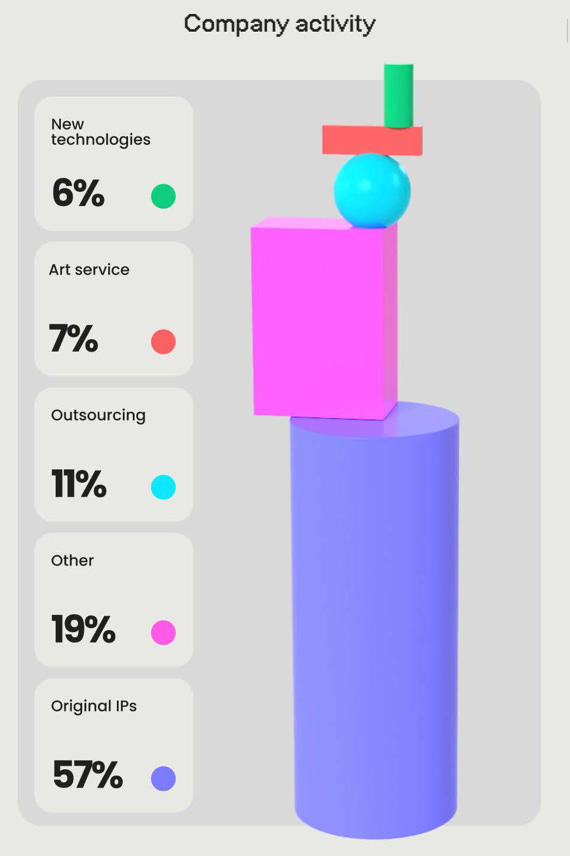
-
33% of companies represented in Serbia have branches abroad.
-
82% of Serbian teams consist of up to 20 people.

Games from Serbian companies
-
In 2023, Serbian studios released 6 mobile and 24 PC/console games. Action, adventure, and RPG are the three most popular genres.
-
41% of projects are distributed with the B2P model, while 59% are F2P, with different monetization focuses.
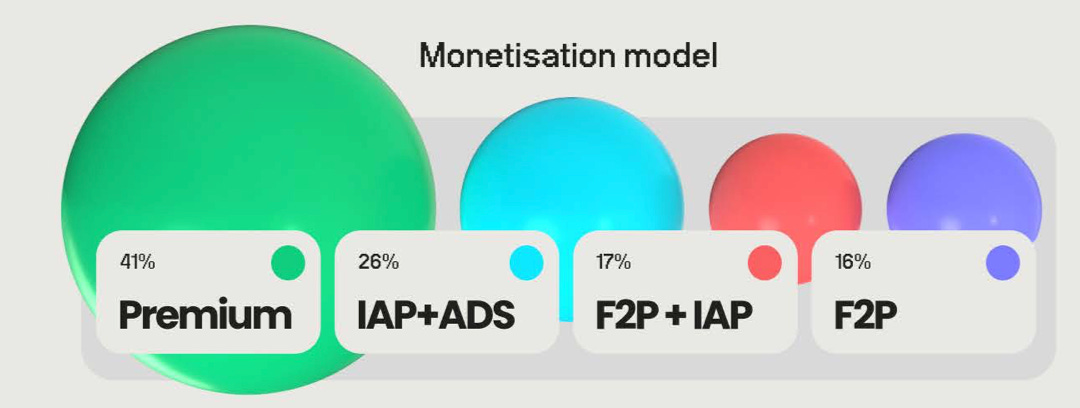
-
47% of games are made in Unity, 28% in Unreal Engine.
-
51% of projects are planned for release on PC, 43% on mobile devices, 23% on consoles, 11% on VR/AR, 8% on the web, and 2% on social networks.
-
17% of projects have a budget exceeding $1M, while 80% have less than $500 thousand.

Talents in Serbia
-
The number of gaming industry workers in Serbia increased by 98% to 4300 people in 2023, mostly from Russia, Belarus, and Ukraine, influenced by the relocation of Wargaming, Sperasoft, Playrix, and other big Eastern European companies.
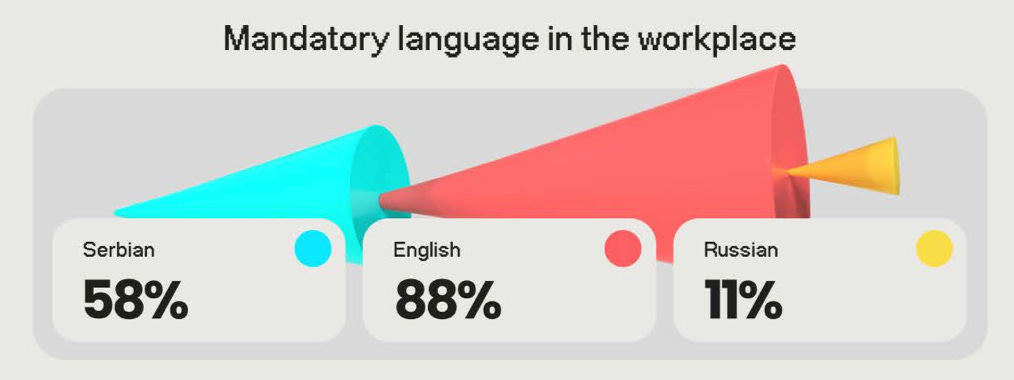
-
Currently, 48% of all employed industry workers in Serbia are foreigners.
-
Most people in Serbia are involved in programming, art, and QA.
-
60% of companies plan to expand their staff in Serbia in 2024.
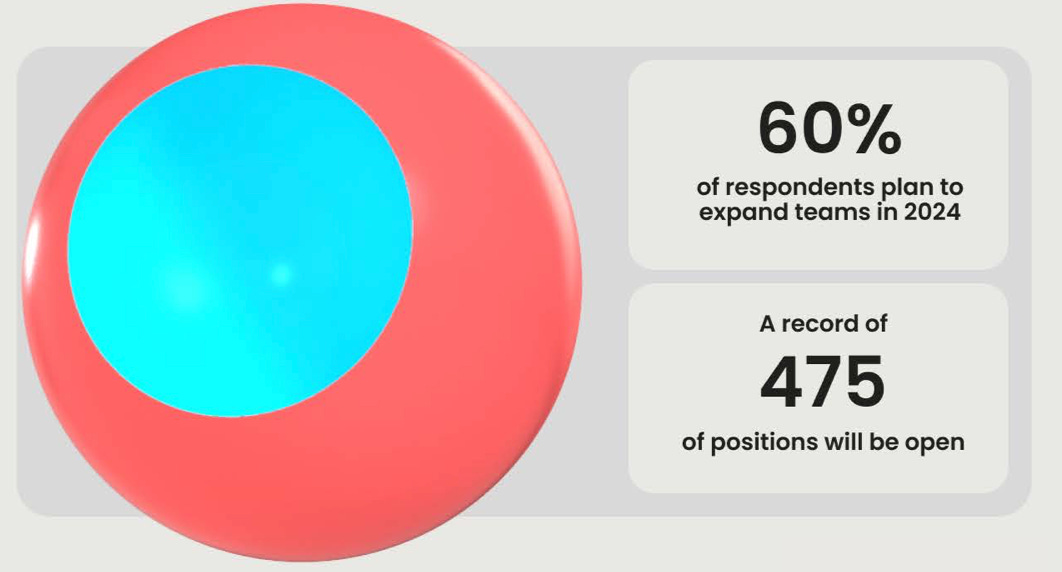
Ecosystem in Serbia
-
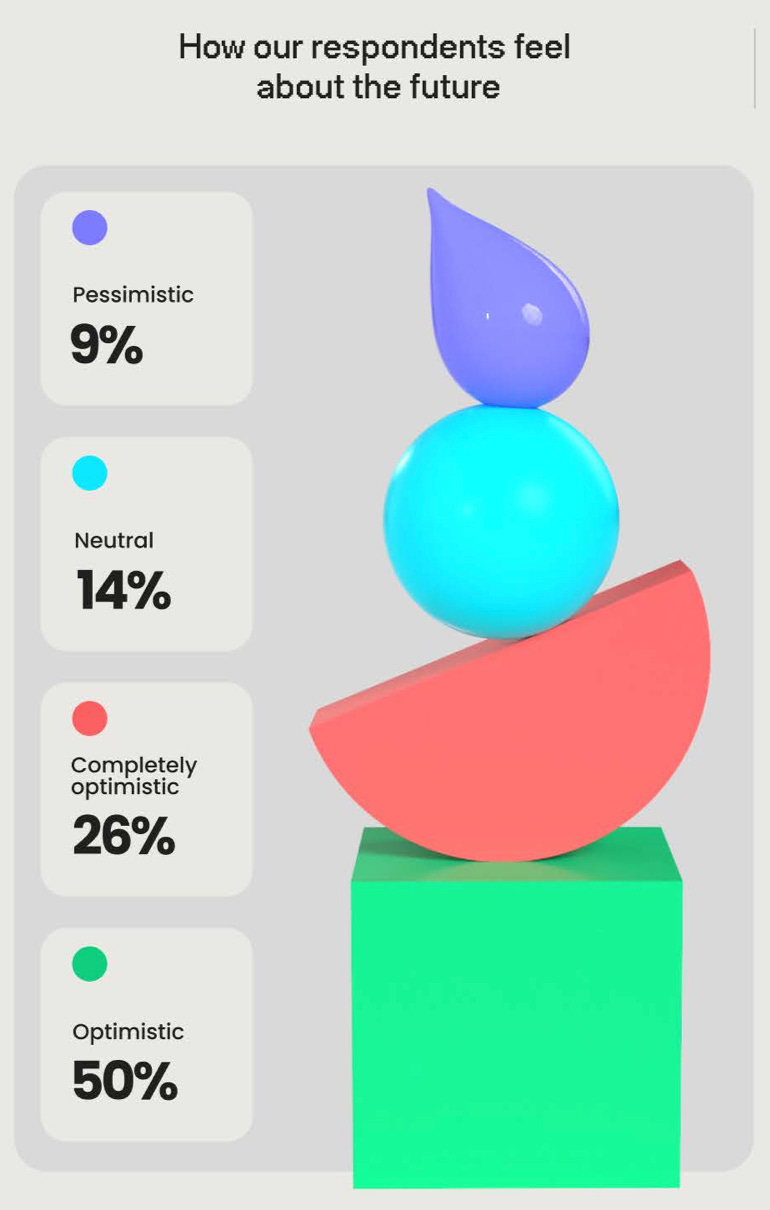
76% of respondents are optimistic about the future of the gaming industry in Serbia.
-
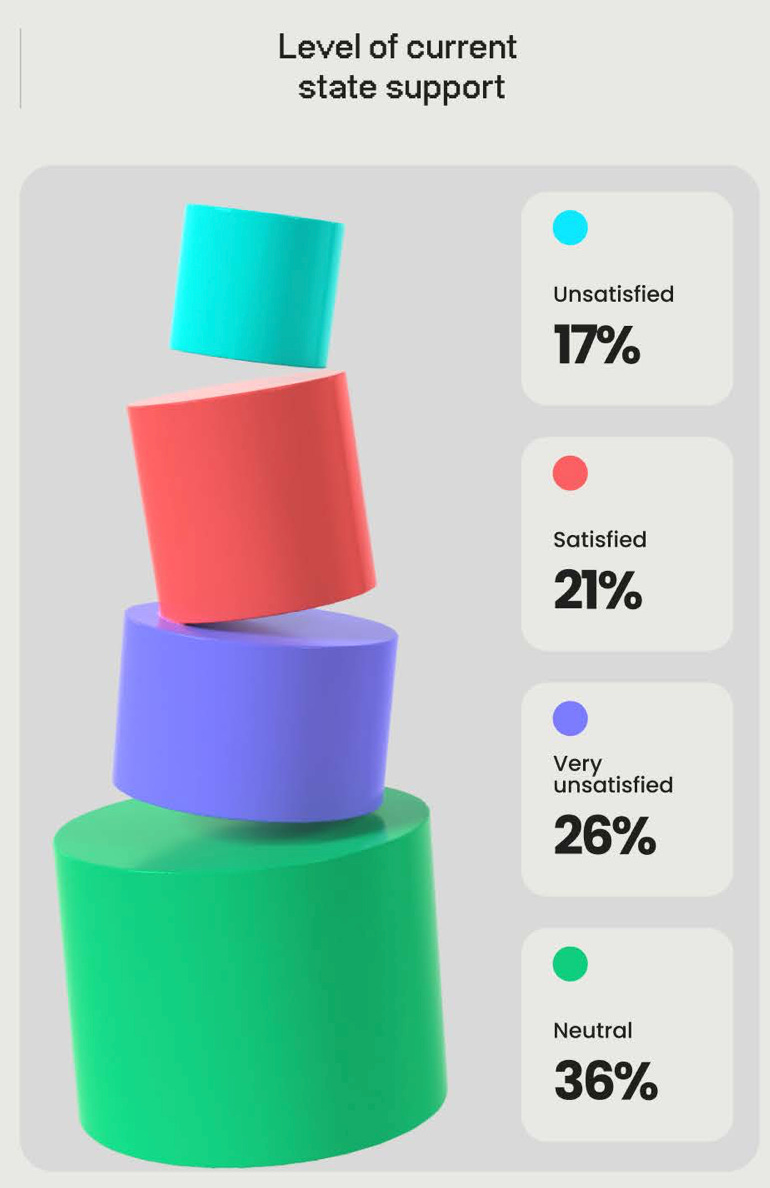
However, only 21% are satisfied with the government support measures in Serbia. Tax incentives (78%) and improving education (55%) are the most required.
GSD & GfK: PC/Console game sales in Europe dropped in April 2024

Analytical platforms report only actual sales figures obtained directly from partners. The mobile segment is also not taken into account.
Game sales
-
10.5 million games were sold in Europe in April of this year. This is 6.2% less than in April 2023.
-
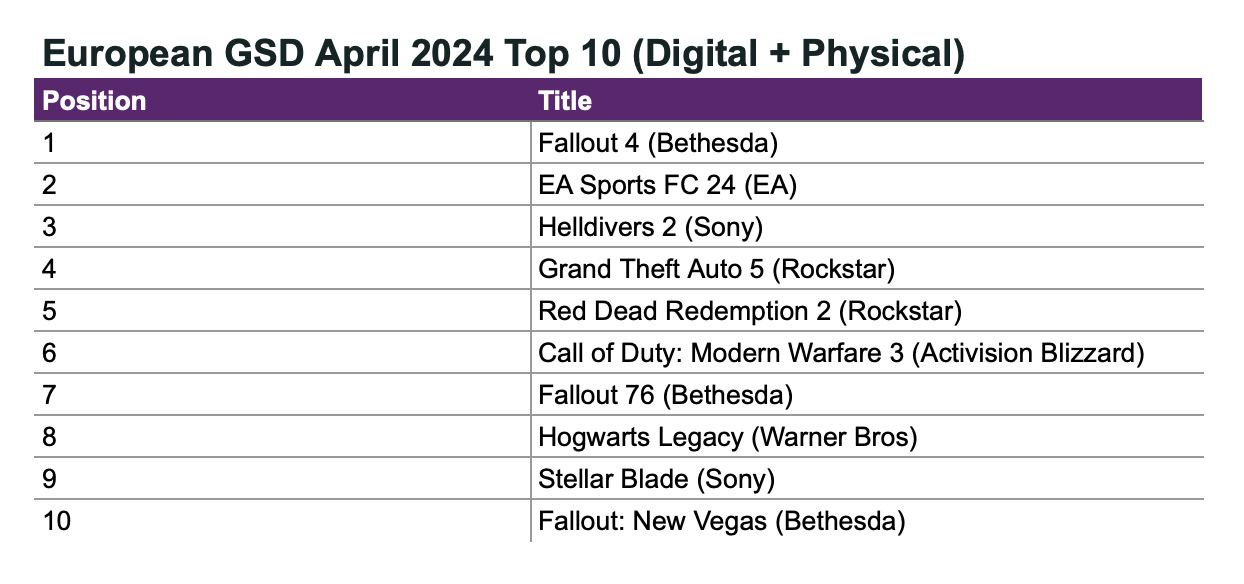
Stellar Blade is the only new entry this month to make it into the top 10. The project debuted at number 9.
-
Fallout 4 became the best-selling game of the month. Earlier, it was reported that the game achieved similar success in the UK. More than half of all sales were attributed to the PC version.
-
Also in the top 10 were Fallout 76 (7th place) and Fallout: New Vegas (10th place). Fallout 3 took the 14th spot on the chart.
-
EA Sports FC 24 narrowly outsold Helldivers II. They hold the second and third spots on the chart, respectively.
Console sales
Data does not include the UK and Germany.
-
Console sales in European countries dropped by 47%. This is attributed to both the restoration of console availability in stores (there was a sales surge in April 2023 after a shortage) and the absence of major system sellers.
-
Accessory sales fell by 17% - slightly over 1 million different devices were sold in April 2024. DualSense was the top-selling accessory.
Mistplay: Spending habits of Mobile Gamers in South Korea in 2024

The study is based on a survey of more than 200 players aged over 18 from South Korea, as well as a previously published report on the payment habits of players from different countries.
Key Habits
-
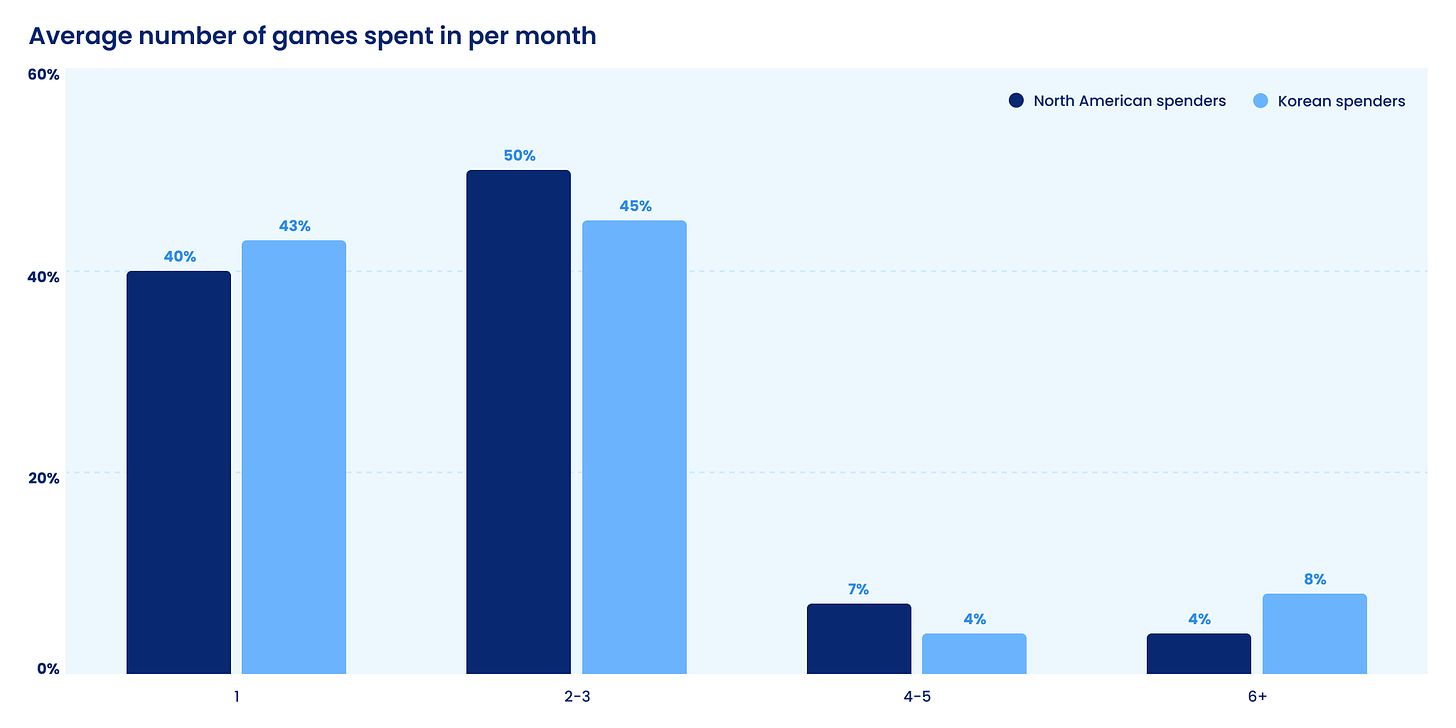
South Korean users are twice as likely to spend in 6 or more games than North American users.
-
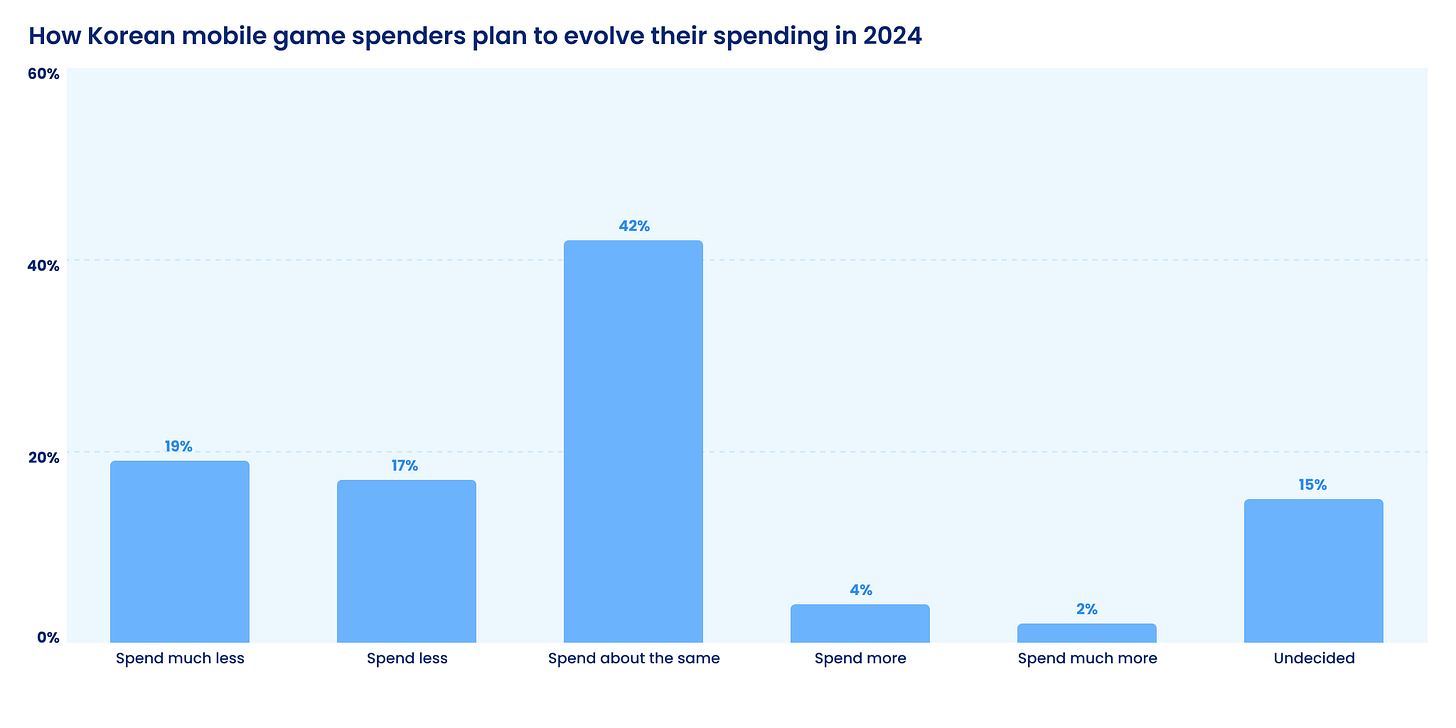
In 2024, 42% of Korean players plan to spend the same amount as last year. 36% want to reduce their spending; 6% - on the contrary - increase it.
-
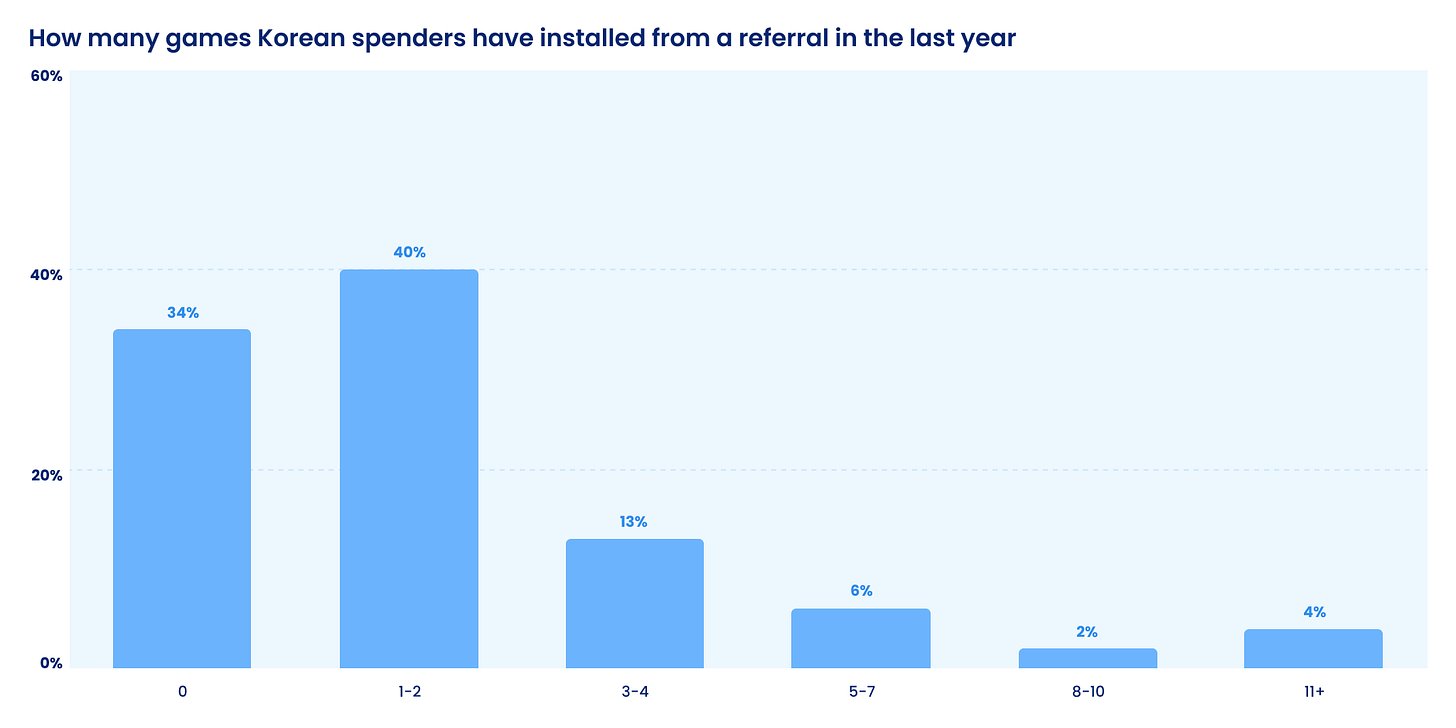
66% of Korean players installed games via referrals (including word-of-mouth) over the past year.
-
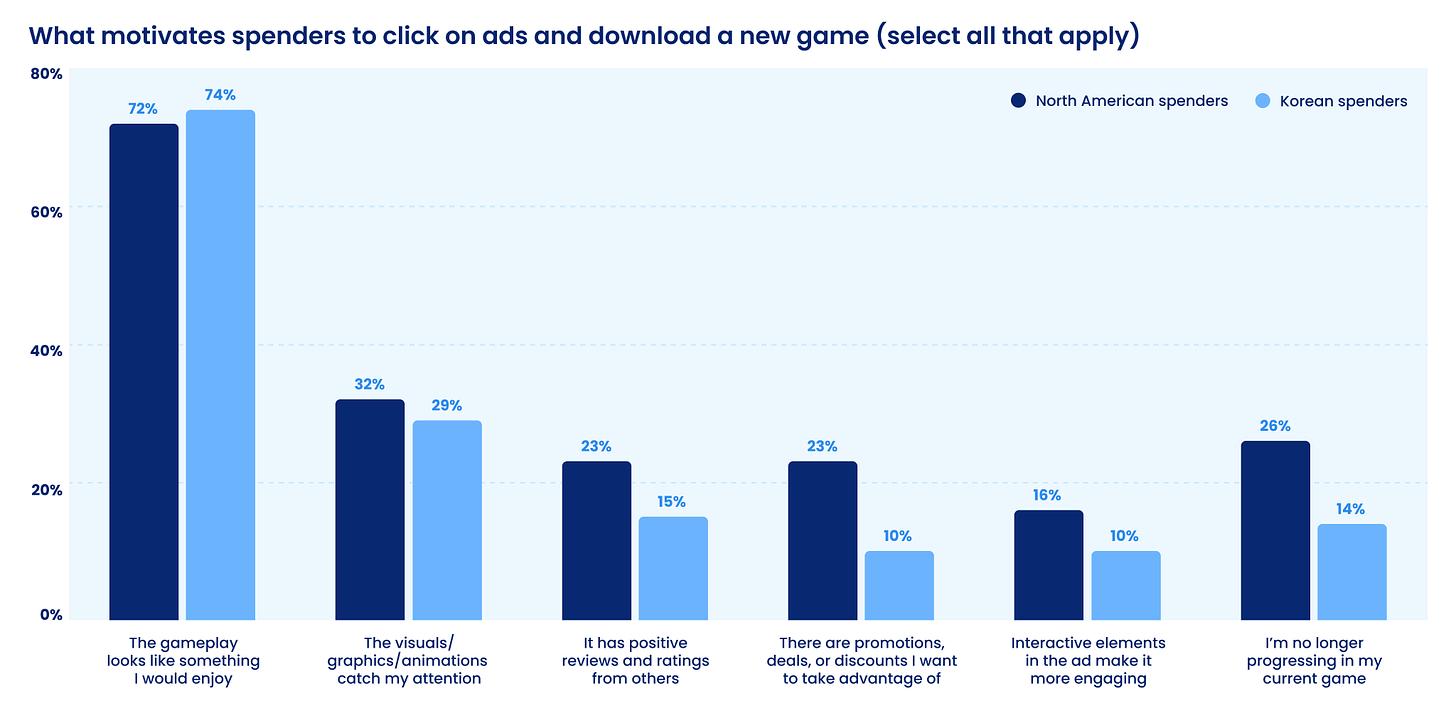
Overall, South Korean players are less responsive to positive ratings, discounts, and offers when deciding to download a new game compared to North American users.
-
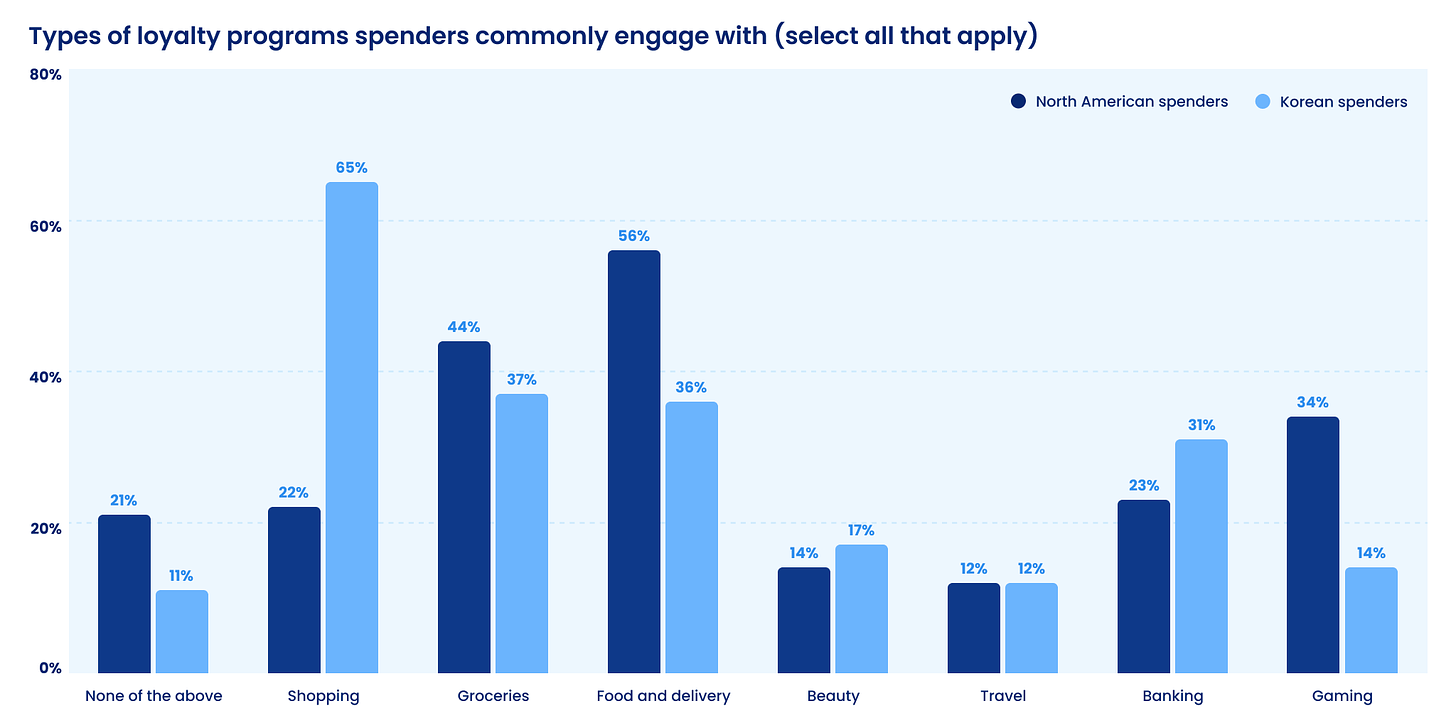
89% of the Korean audience participates in various loyalty programs. Only 14% of this volume is gaming-related.
How Korean Users Pay
-
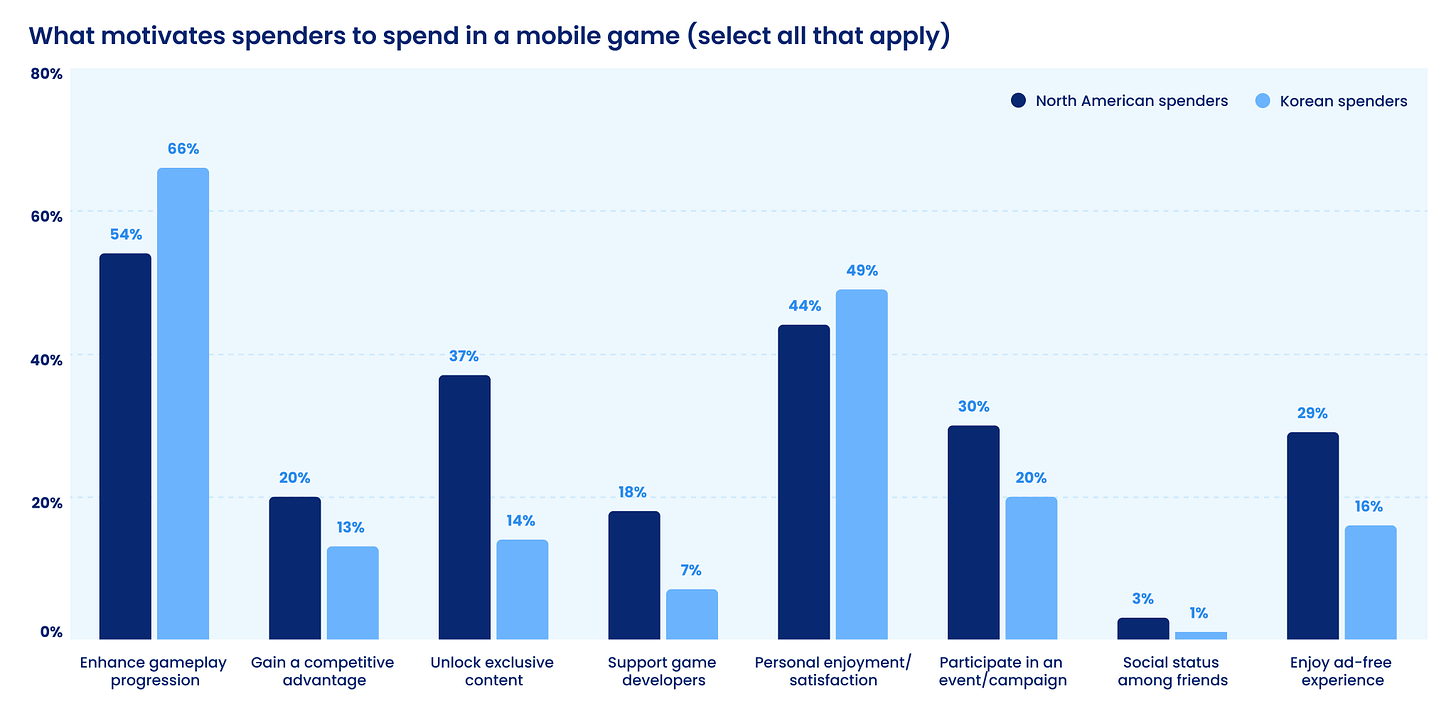
The key motivation for spending among Koreans is the opportunity to progress further in the game (66% of respondents named this motivation). Also, 49% of users noted that they make in-app purchases just for their own personal enjoyment and satisfaction.
-
Only 14% of South Korean users are willing to pay for access to exclusive content. In North America, this figure is 37%. Additionally, South Korean players are not particularly motivated by ad removal (16% vs. 29% in North America) and the opportunity to support developers (7% vs. 18% in North America).
-
The main types of purchases in South Korea are in-game currency (50%), bundles (31%), extra lives or hints (27%). Loot boxes account for only 9%.
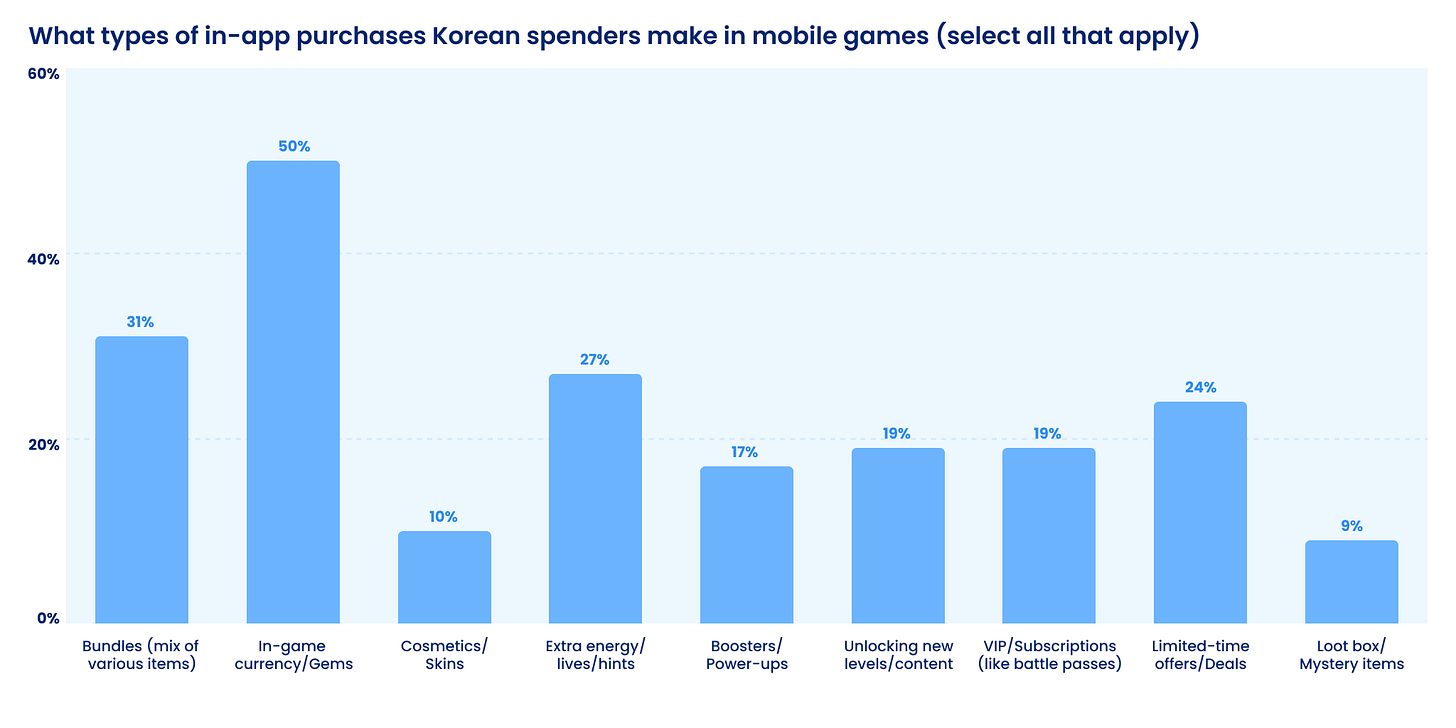
❗️This may be related to the regulation of loot boxes in the country. Developers are required to disclose item drop rates.
-
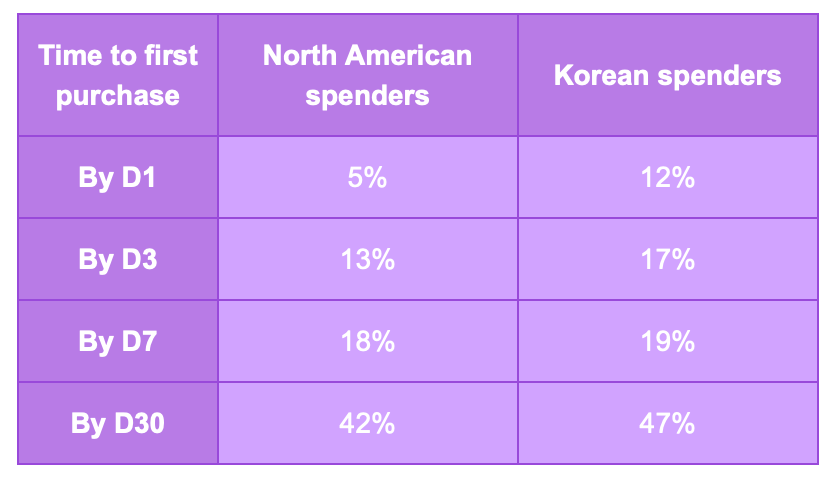
47% of Korean users note that they make a purchase in a game within the first 30 days. At the same time, 12% of Korean players are ready to make a purchase on the first day (in North America, this figure is only 5%).
-
The main trigger for making a purchase for South Korean users is reaching a point in the game where further progress slows down without payment.
-
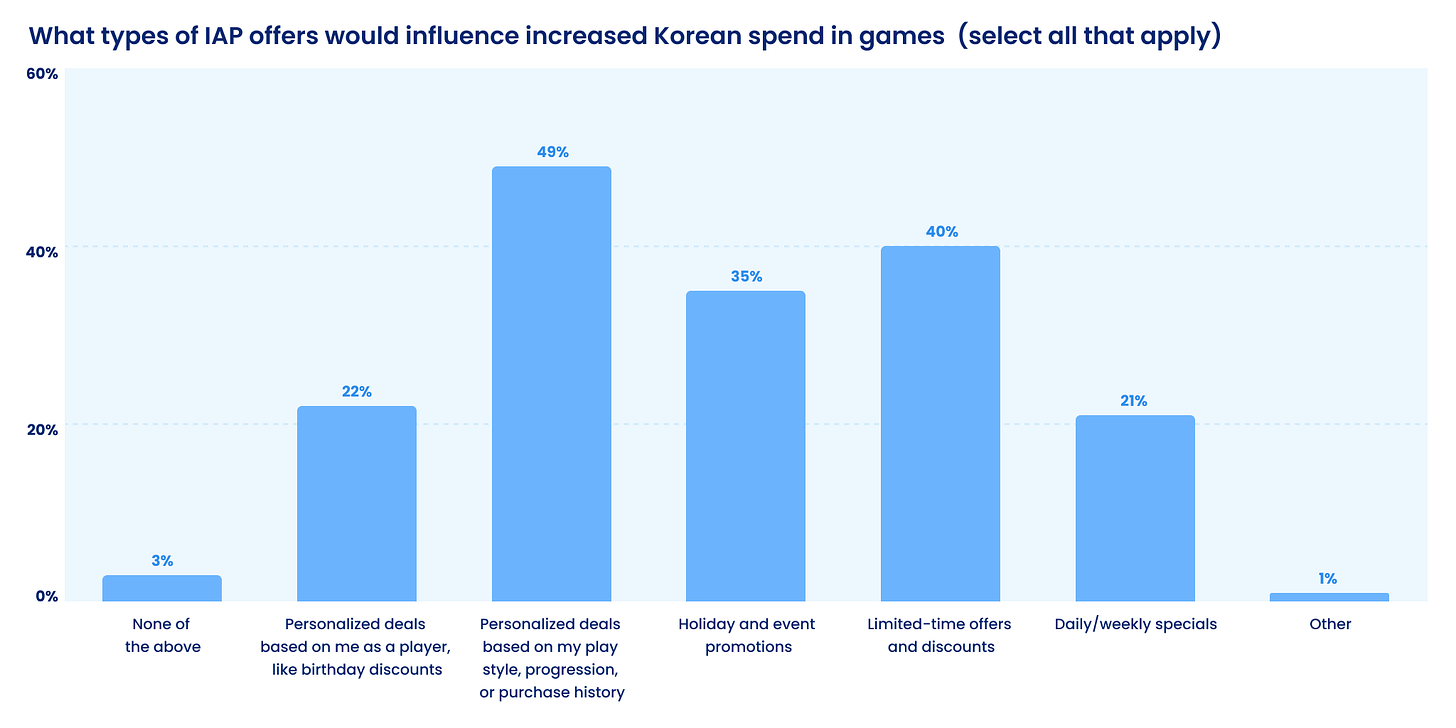
49% of users from South Korea noted that they would pay more if they saw personalized offers. 40% showed interest in time-limited offers; 35% - in seasonal offers.
-
Mistplay notes that the social component has a significant impact on purchases in South Korea. Users compete to be at the top of leaderboards - this is part of the local gaming culture.
-
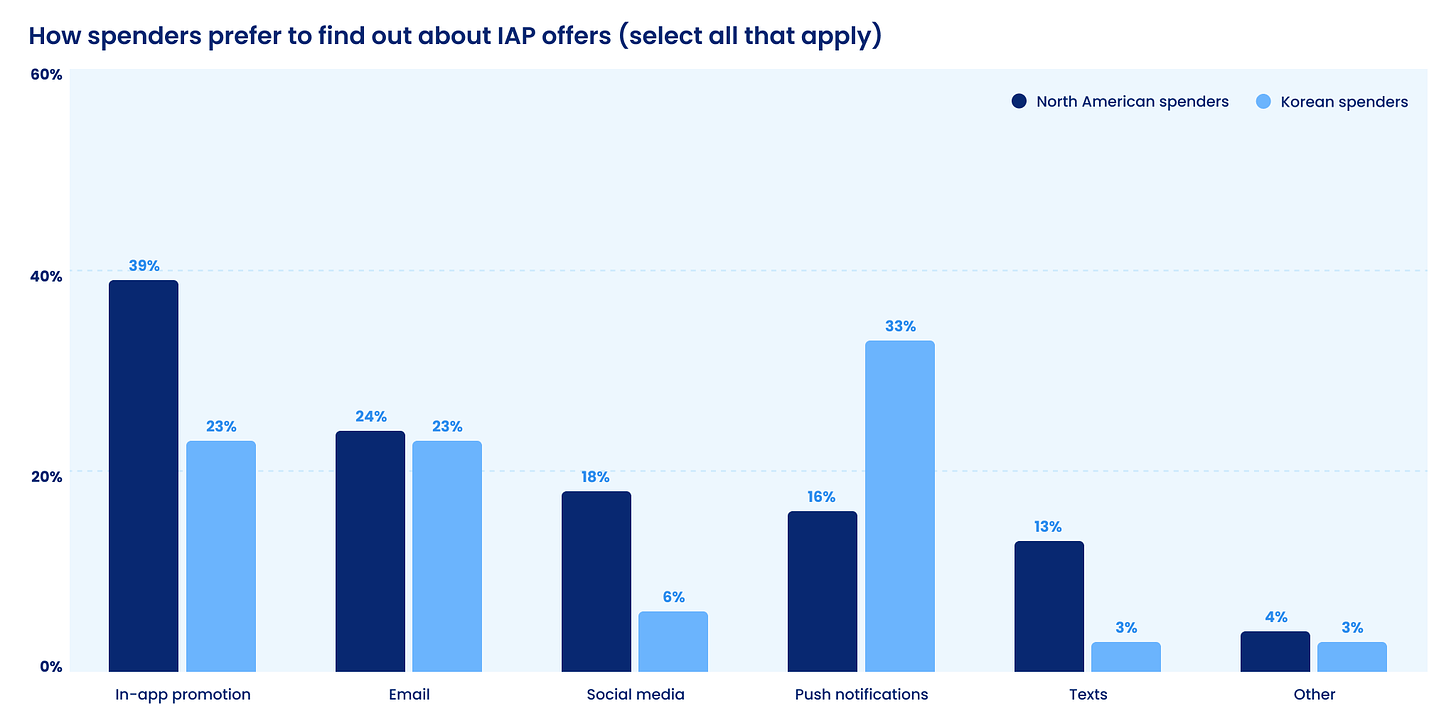
Korean users mostly learn about offers through push notifications (33%). For comparison, in North America, this figure is only 16%. In South Korea, notifications through social networks and text announcements are also not very popular. In-game announcements are also less popular.
Why Korean Users Play
-
The main motivation for South Korean users is the opportunity to relax (79%). They are also attracted by the opportunity to visit new worlds (29%) and try something new (25%).
-
Korean players surveyed are not very interested in the opportunity to express themselves (12%) or become the strongest (3%).
❗️However, above you can find out that many Koreans do invest in reaching the top of leaderboards.
Daniel Ahmad: Sony shipped 5 times more consoles to stores in Q1'24 than Microsoft did with the Xbox Series S|X
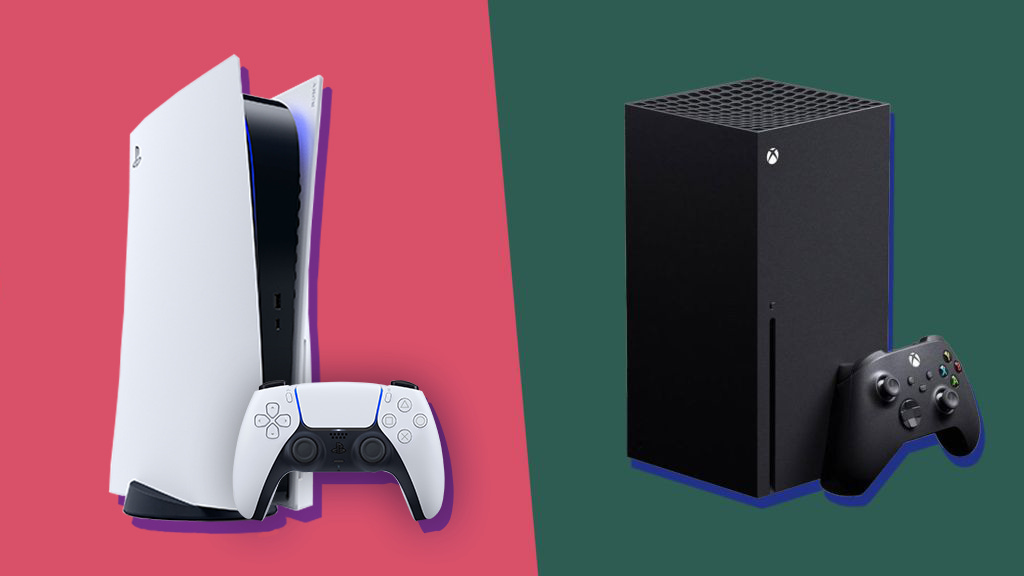
The Director of Research & Insights at Niko Partners analysed Sony's latest report.
-
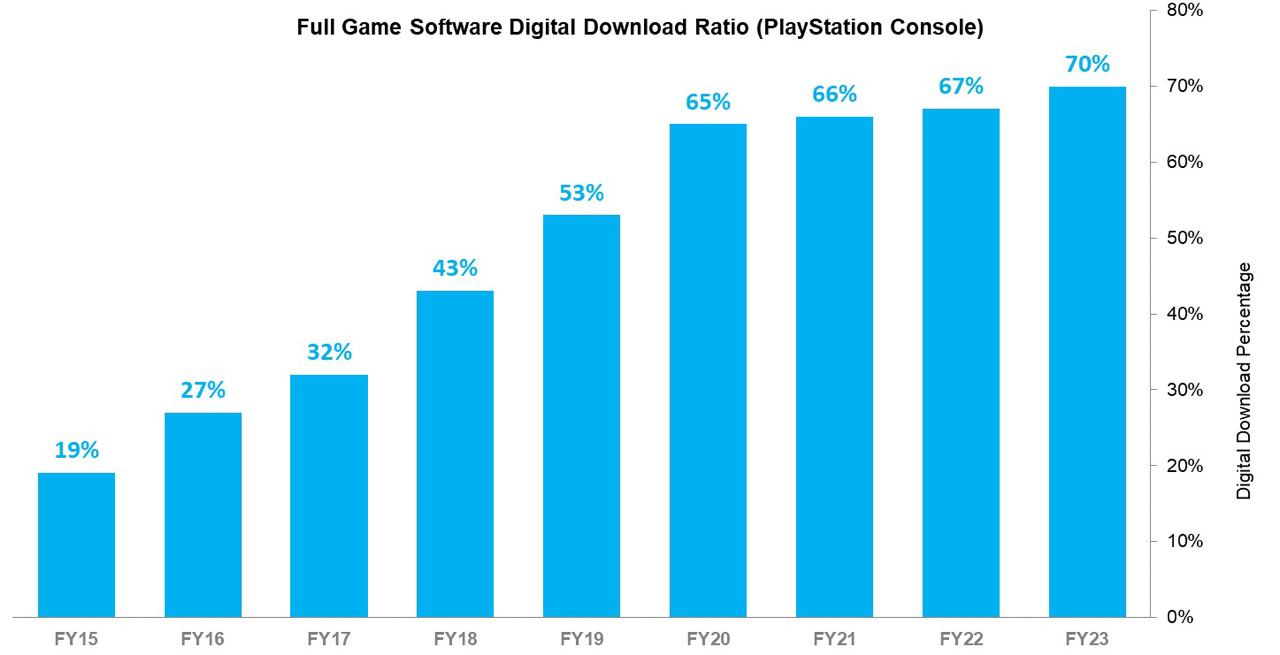
The share of digital sales on PlayStation platforms has reached 70%. It has doubled since 2017.
-
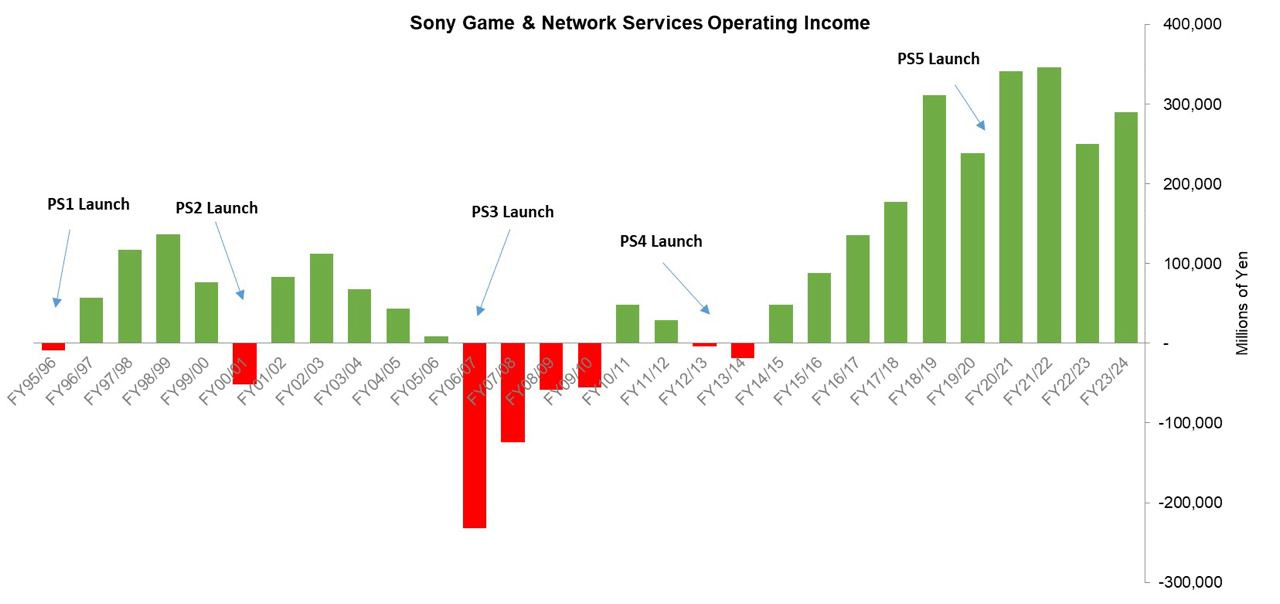
With the transition to PlayStation 5, Sony managed to break out of the loss cycle that preceded the launch of the new generation. The increase in digital sales positively impacts profitability, and subscriptions provide a stable cash flow.
-
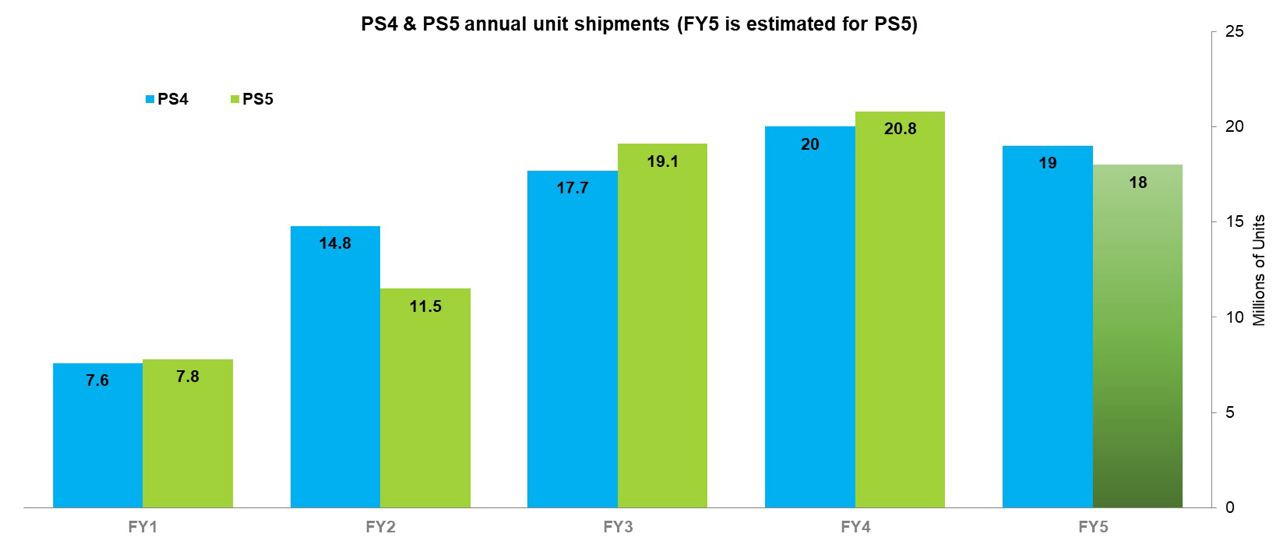
As of the end of March 2024, PS5 has sold 59.2 million units. This is slightly less than the PS4 over the same period (60 million). Despite good sales, Sony has not been able to increase the console customer base. Hence, the company's heightened interest in GAAS projects and increasing ARPU.
-
According to Daniel, Sony shipped 4.5 million PS5s in Q1'24. This is 5 times more than the Xbox Series S|X.
Newzoo lowered its Forecast for the Gaming Market in 2023

Revenue
-
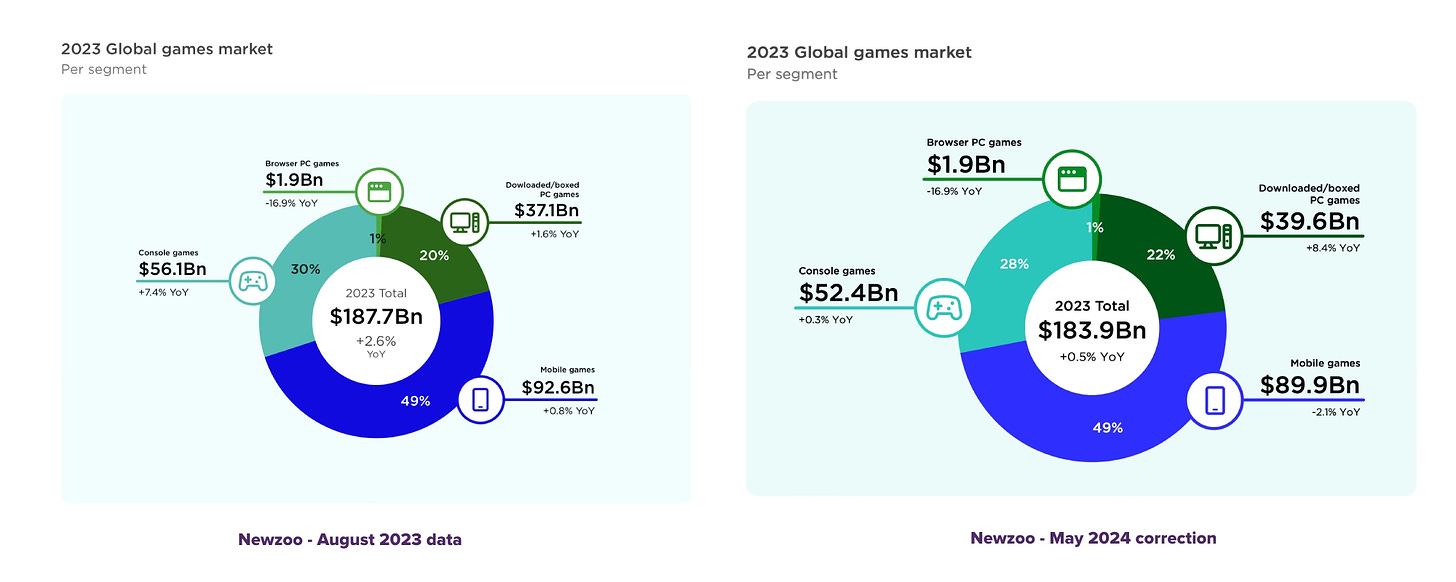
The market volume forecast has been lowered from $187.7 billion (+2.6% YoY) to $183.9 billion (+0.5% YoY).
-
As a result of the reevaluation, the mobile market in 2023 declined by 2.1% instead of the previously reported growth of 0.5%. The console segment grew by only 0.3% YoY instead of the previously reported 7.4%. However, the PC segment in the new version increased by 8.4% YoY instead of the initial 1.6%.
-
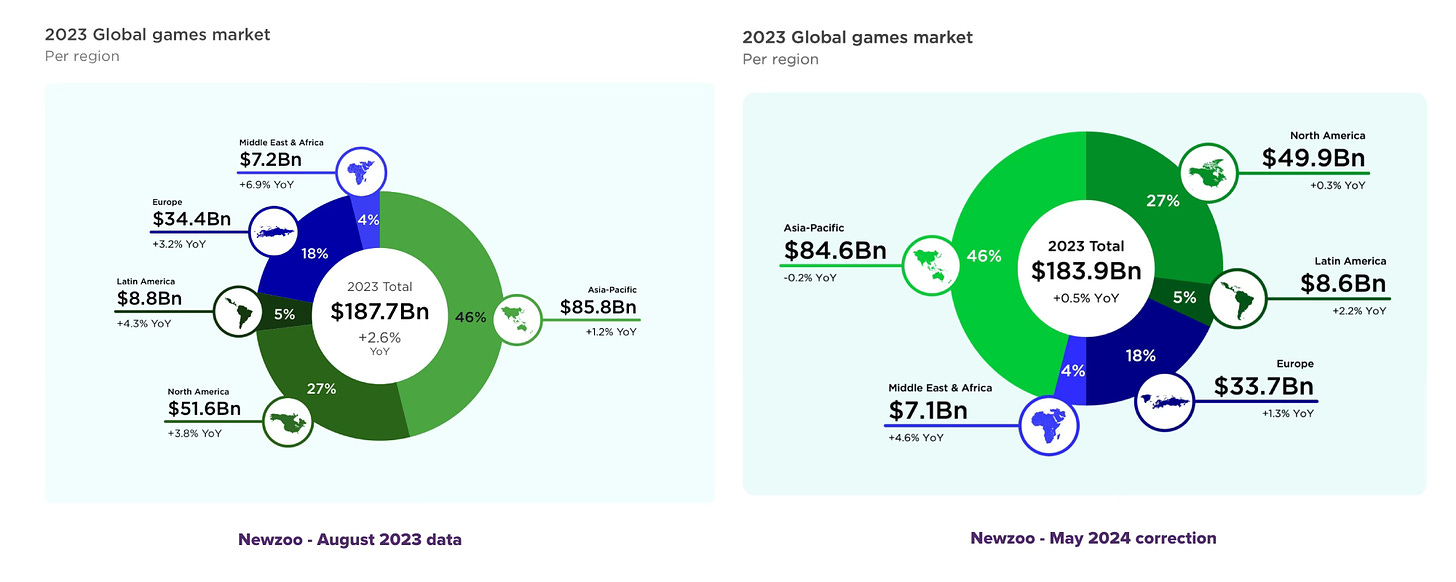
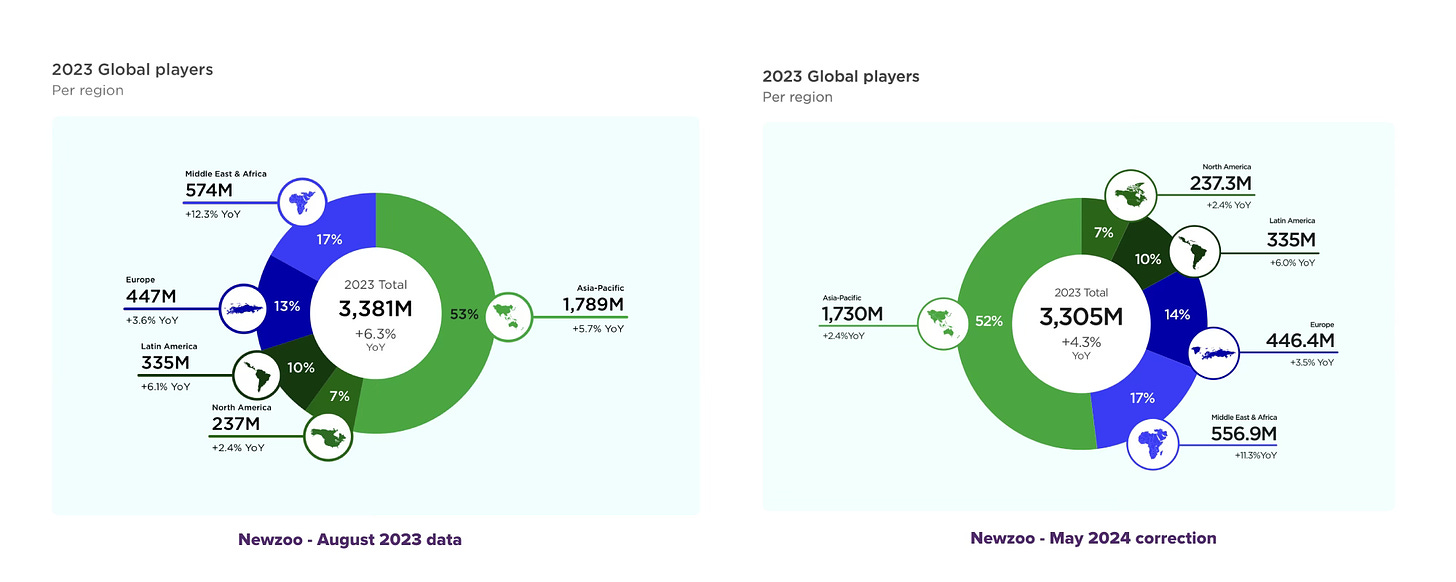
The reevaluation affected regional statistics. The Asia-Pacific region, as a result, declined by 0.2% instead of growing by 1.2%. North America grew by only 0.3% instead of 3.8%. The growth in the MENA region (Middle East and North Africa) of 6.9% turned into 4.6%. Europe grew by 1.3% YoY instead of 3.2%. Latin America increased by 2.2% instead of 3.8%.
-
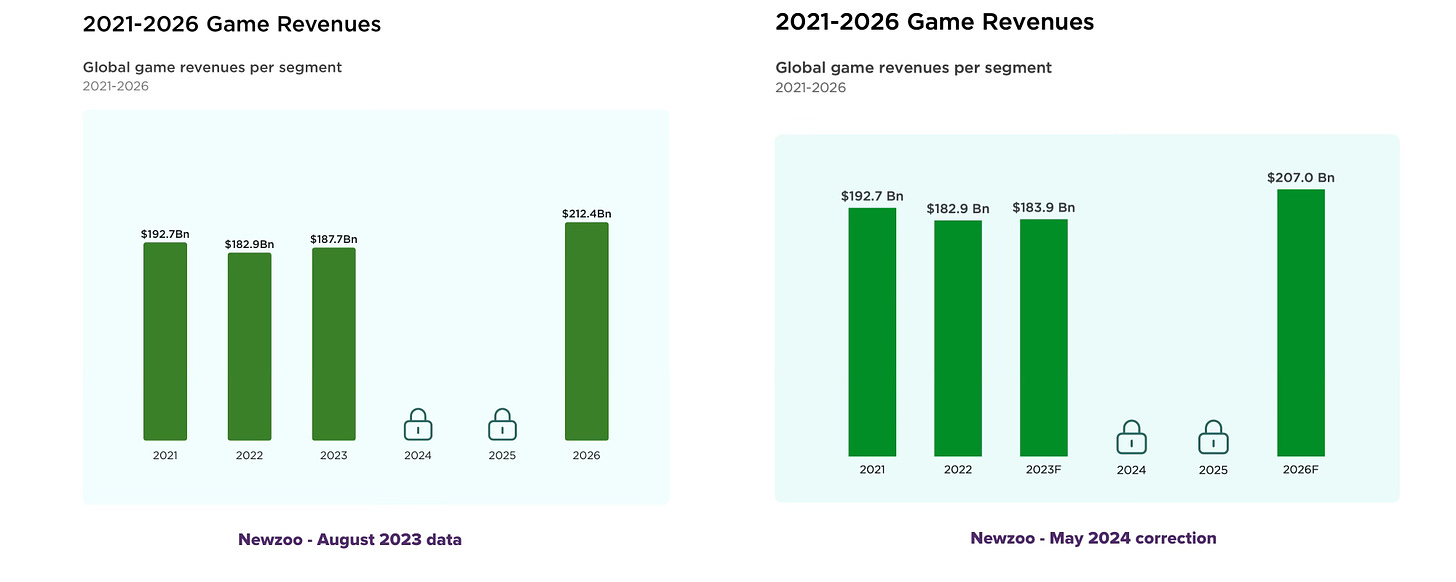
Newzoo lowered its revenue forecast for 2026. Previously expected $212.4 billion turned into $207 billion.
Users
-
The company lowered its forecasts for the number of players worldwide in 2023 (from 3.38 billion to 3.3 billion). Moreover, the growth forecast has been reduced, with Newzoo now expecting 3.68 billion players in 2026 instead of 3.79 billion.
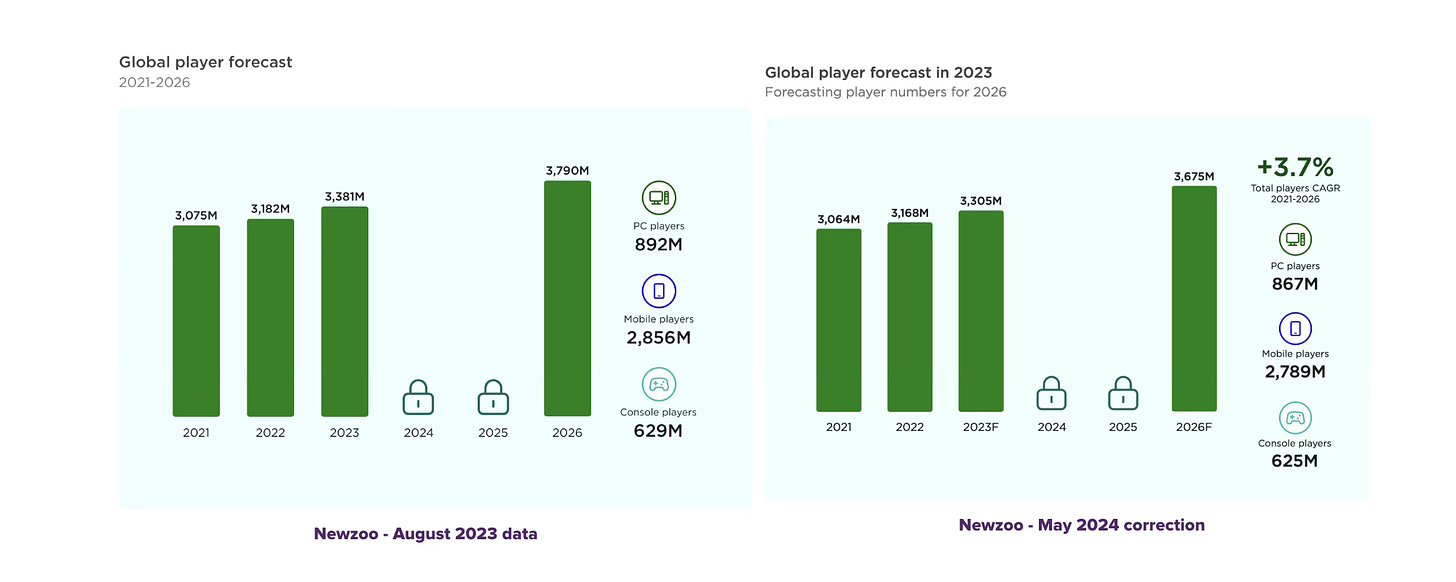
-
The reevaluation significantly affected the Asia-Pacific region. Its YoY growth fell from the initial estimate of 5.7% YoY to 2.4% YoY.
Notes of the Nintendo FY'24 report
I’ll leave aside the company's financial performance and focus only on the platform/game results.
Nintendo Switch
-
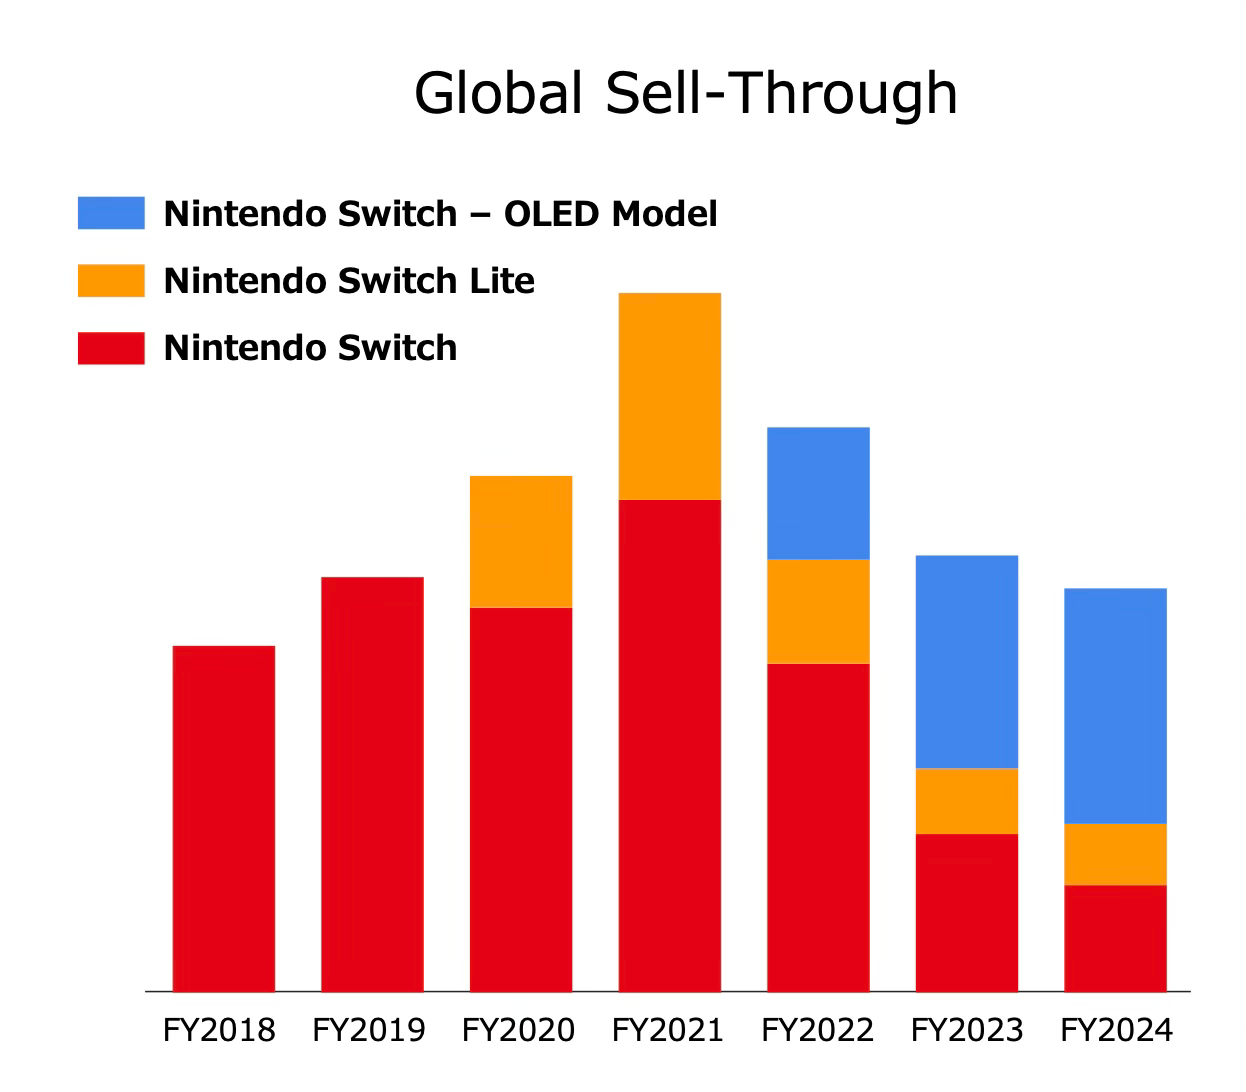
In the fiscal year 2024 (from April 2023 to March 2024), the company sold 15.7 million Nintendo Switch units. The trend is declining for 4th year straight, which is normal for the end of the lifecycle.
-
The company reported a total of 141.32 million Nintendo Switch units sold.
❗️ Currently, the Nintendo Switch is the second best-selling console in history. The PlayStation 2 is in first place with 155.1 million units sold.
-
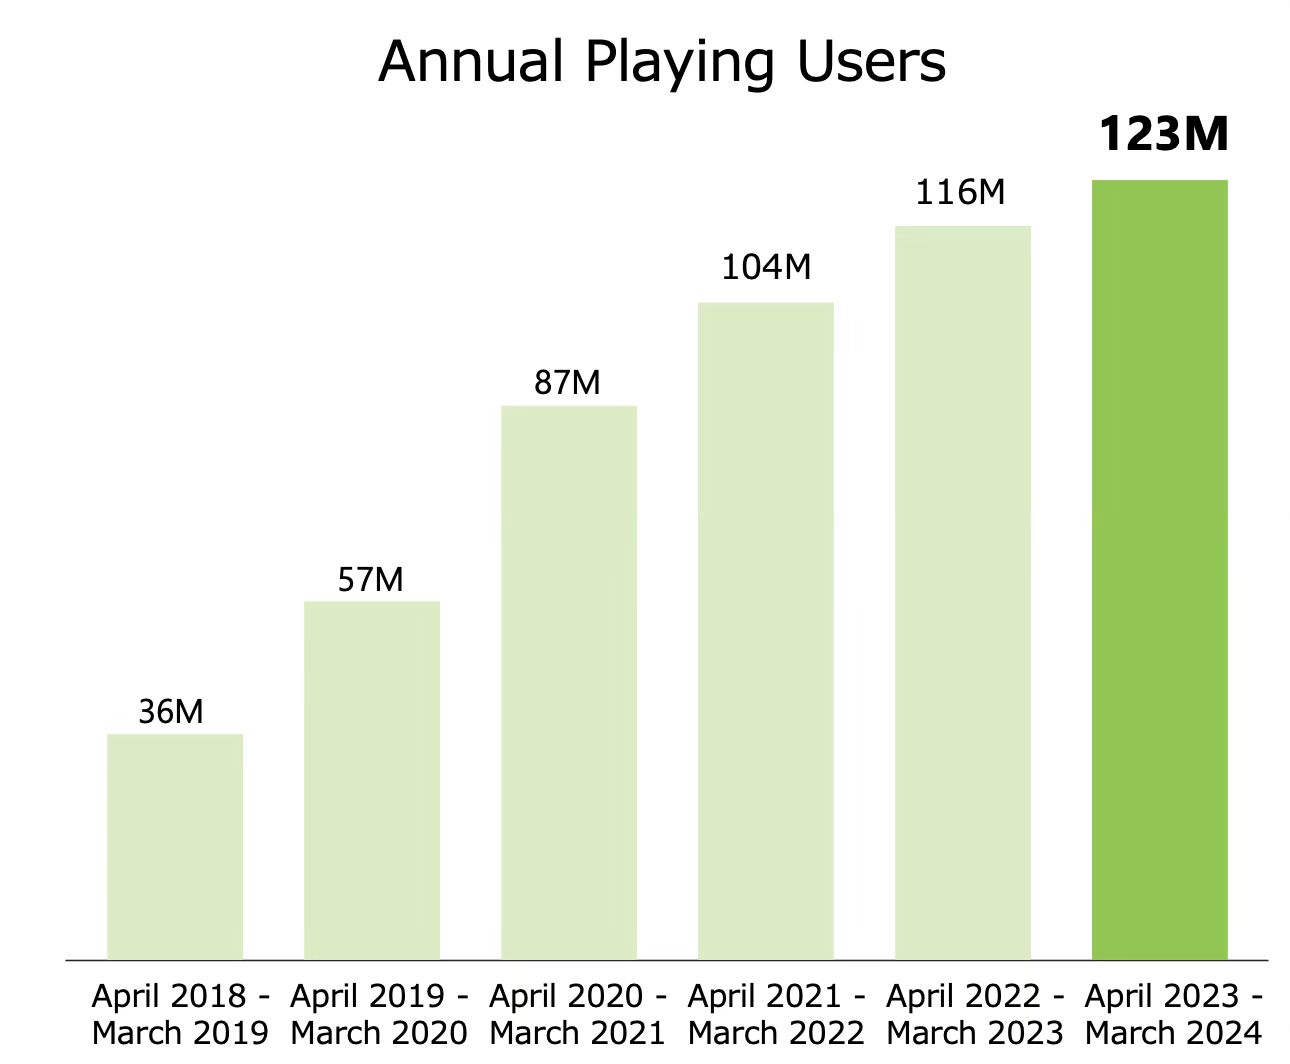
The number of active users has been steadily increasing since 2018. In the fiscal year 2024, the number of users reached 123 million.
Game Sales
-
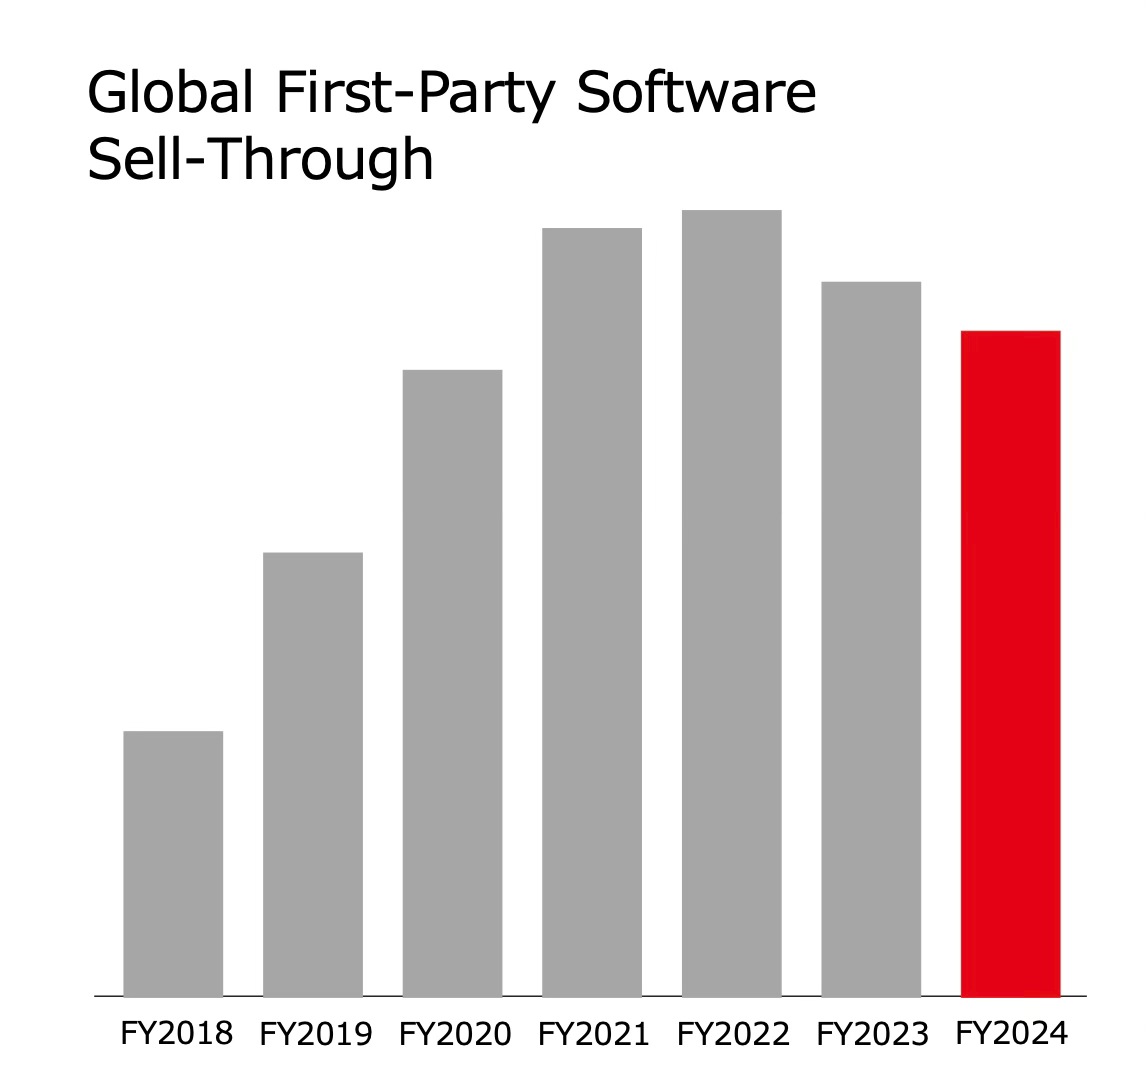
Global sales of Nintendo's first-party lineup have been declining for the second consecutive year, despite the successes of The Legend of Zelda: Tears of the Kingdom (20.6 million), Super Mario Bros. Wonder (13.4 million copies), and others.
-
In 2024, 31 games on Nintendo Switch surpassed the 1 million copies mark. 20 of them were Nintendo's own games, while 11 were from other publishers.
-
The share of digital sales on Nintendo Switch in the fiscal year 2024 was 50.2%. Last year it was 48.2%.

GameAnalytics: Benchmarks in Mobile Games for Q1’24
GameAnalytics studied over 10,000 projects using their analytics. Each game was launched in at least 3 regions. The projects had 2.7 billion MAU. All figures were collected in the first quarter of 2024.
Retention Benchmark - Top 25% of Projects
-
The median D1 Retention across all markets and projects (not just the top 25%) is 22.91%; D7 Retention is 4.2%; and D28 Retention is 0.85%. Below, top-25% of projects in the market are covered.
-
North America leads in engagement rates on days 1, 7, and 28.
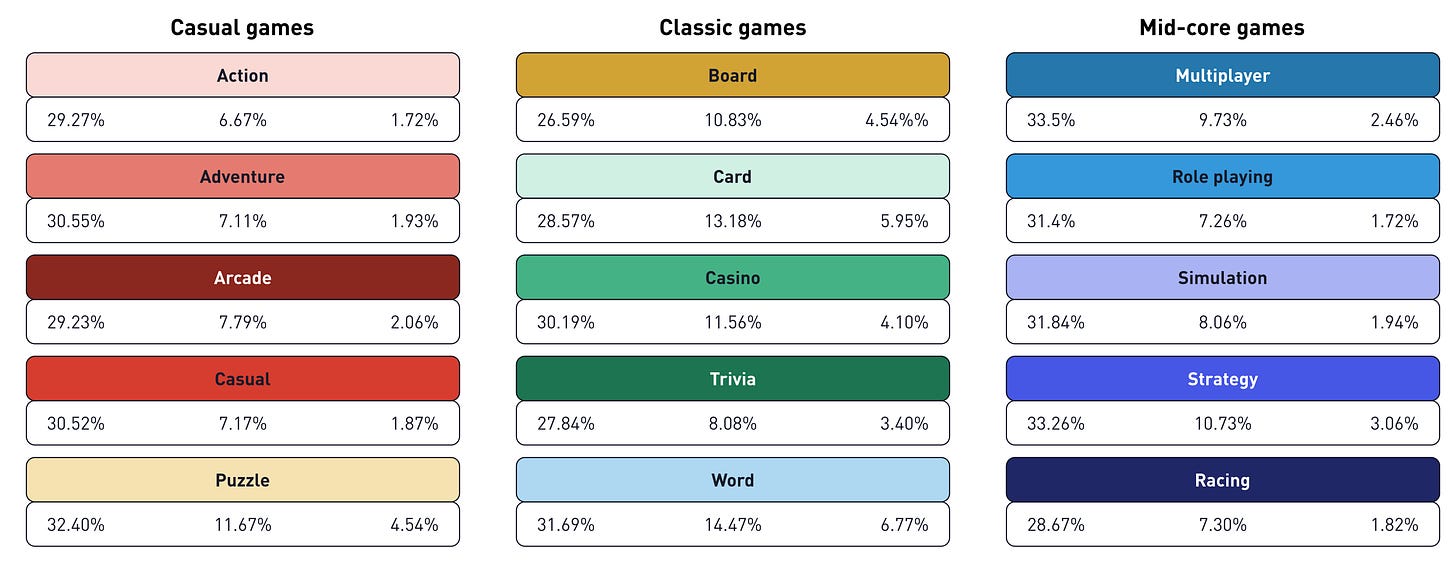
- Europe leads in short-term retention for casual projects.
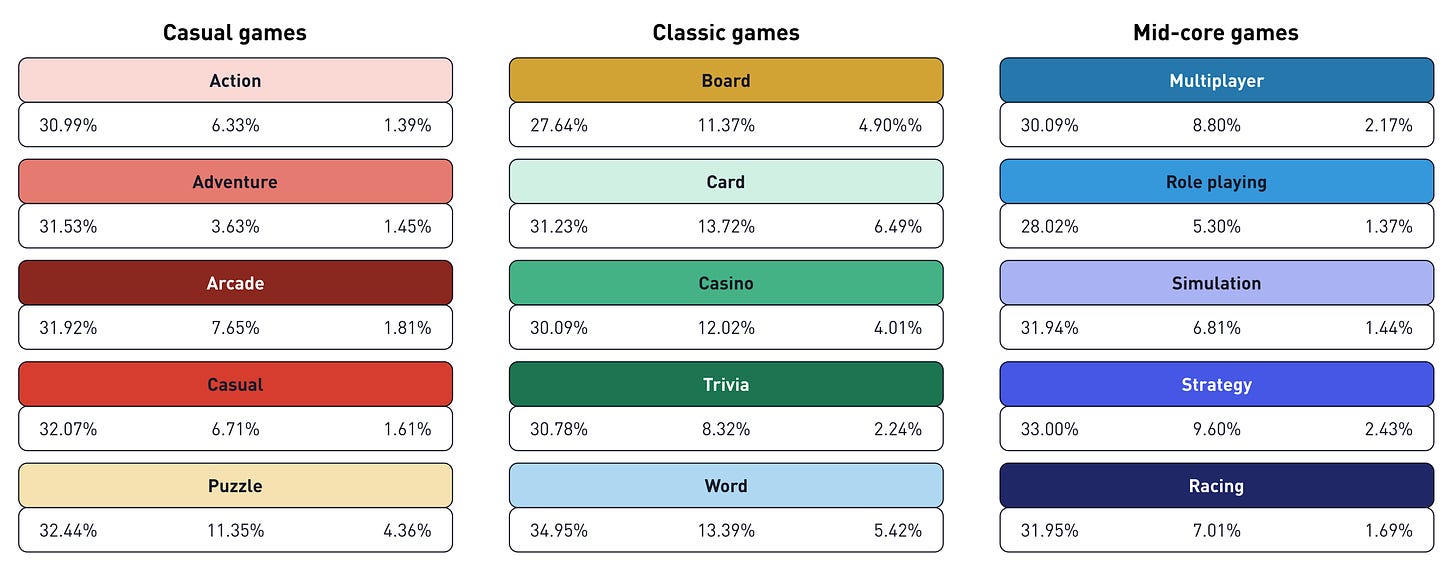
-
In the Middle East, users favor classic (as defined by GameAnalytics) games such as board, card, and word games. They lead in Retention rates on days 1, 7, and 28. However, casual and mid-core projects show lower figures than in North America and Europe.
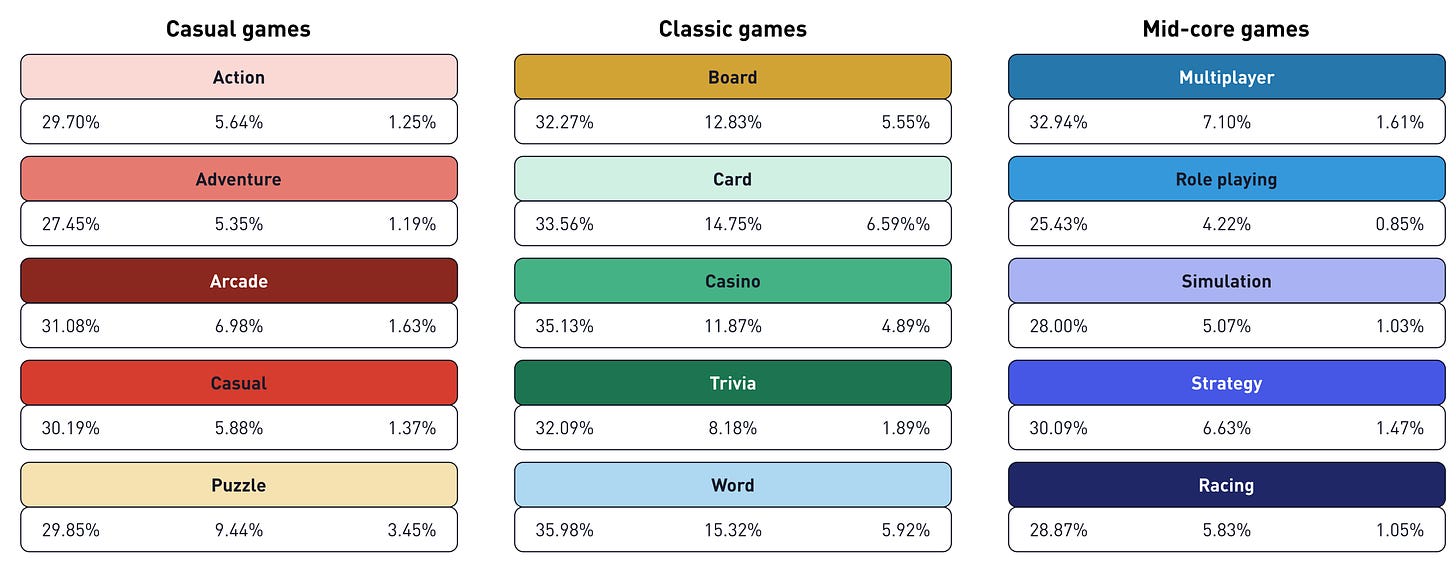
-
Classic games, when considering all regions, do not have the best D1 Retention; but they excel over other categories in D7 and D28 Retention.
-
In Asia, Retention rates are generally lower than in other regions across all genres and days. This is likely due to high competition.
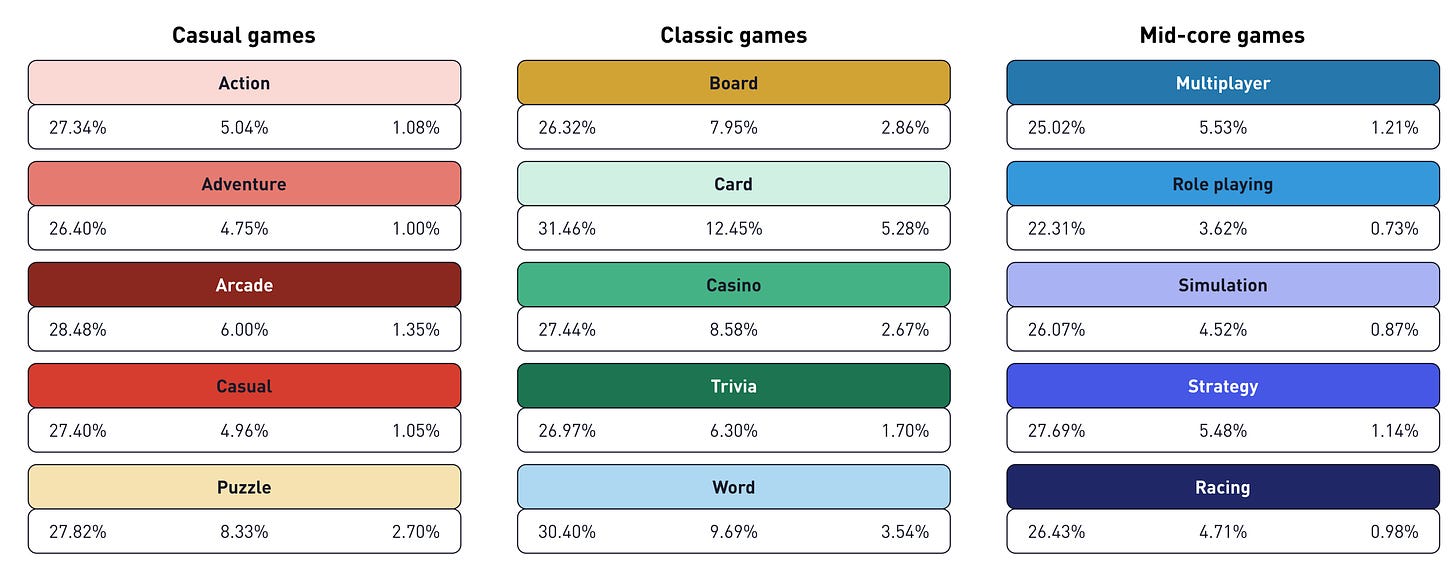
-
Puzzle games show the highest D7 Retention among all other genres.
Session Time Benchmarks
Here, all projects in the market are considered. The top 25% of projects, the median, and the bottom 25% are taken into account.
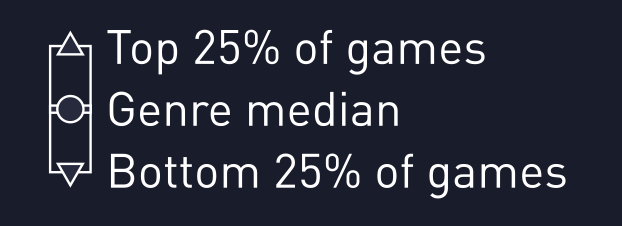
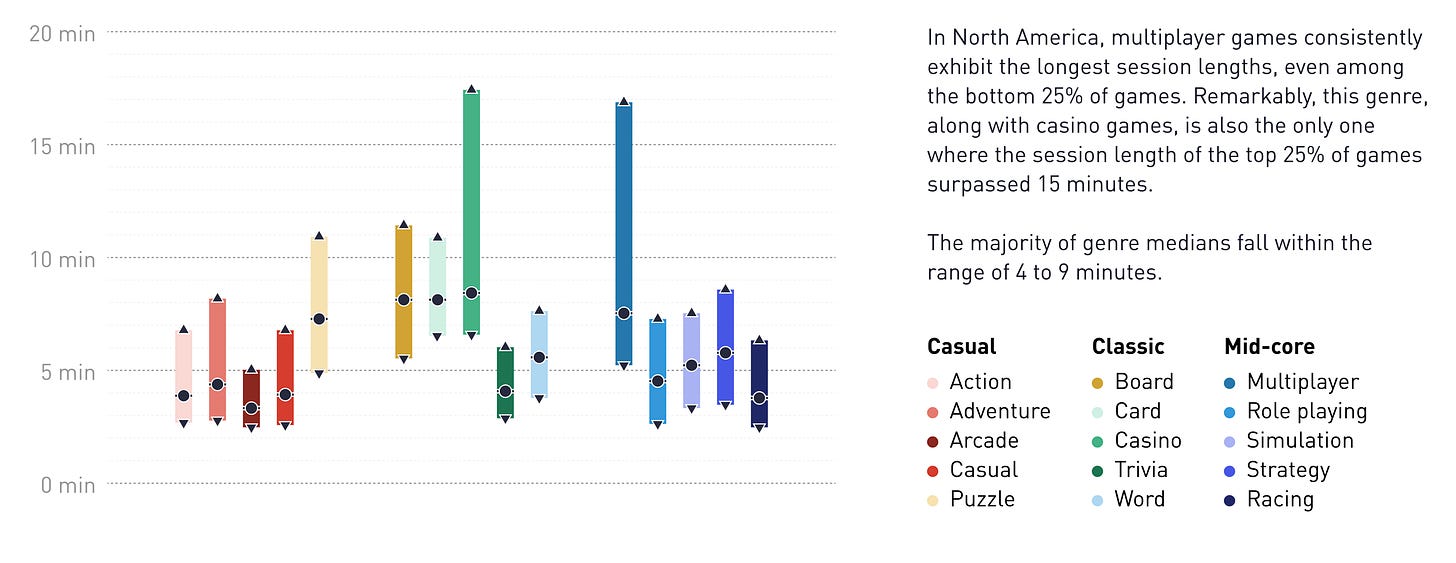
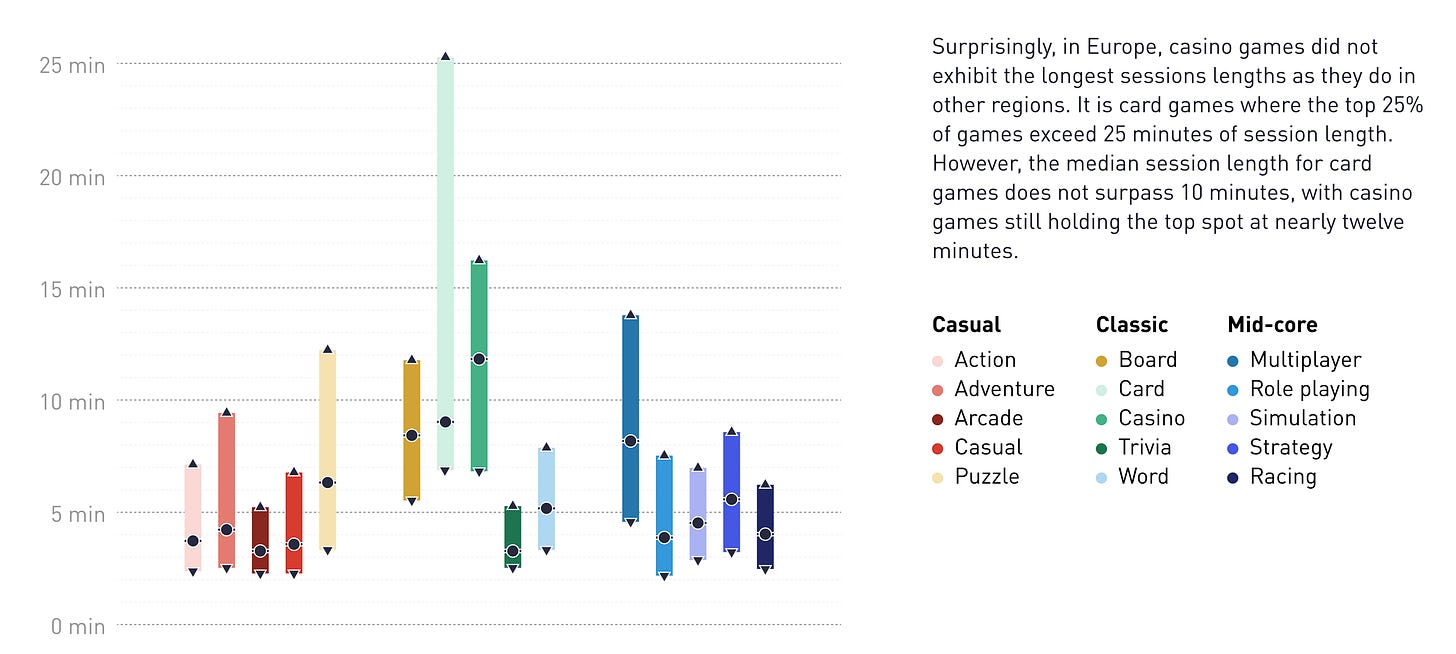
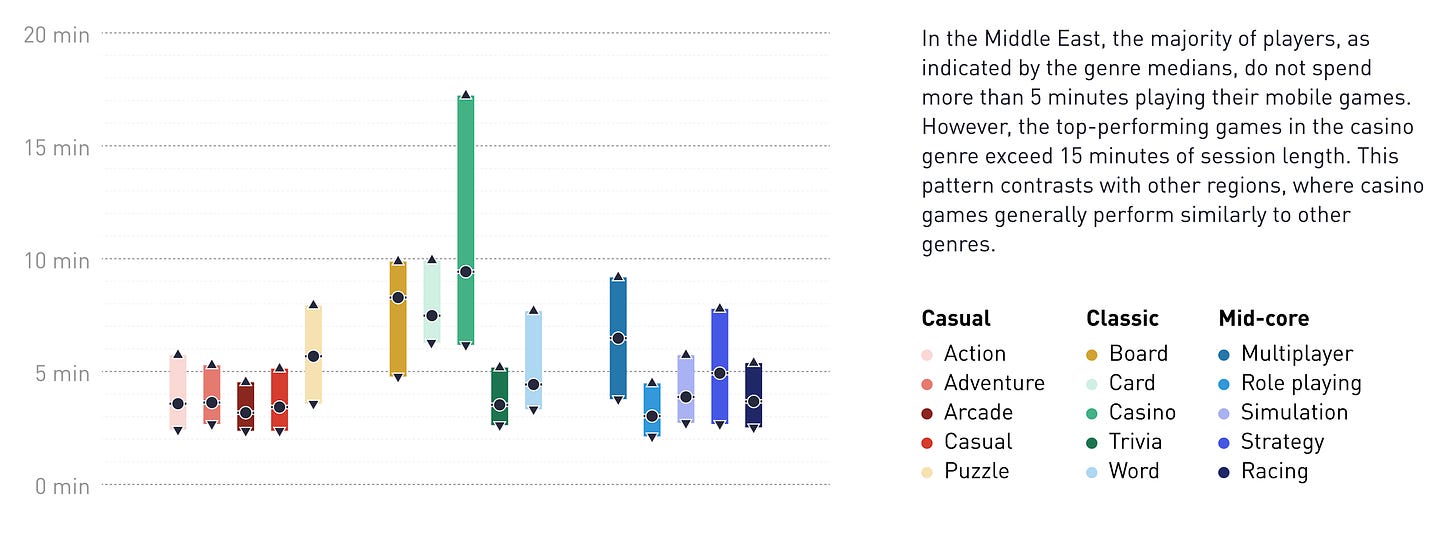
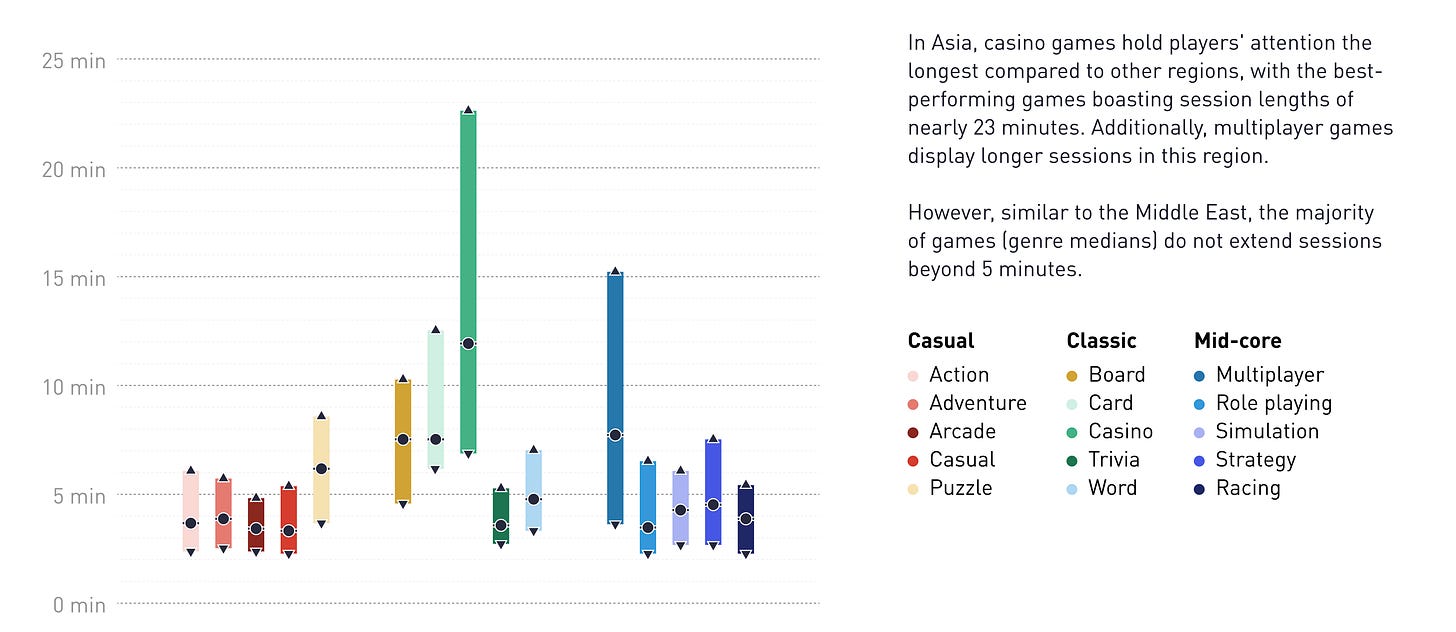
- The median session time across all regions is 4 minutes 45 seconds.
- In North America, the highest session times are for casino and multiplayer projects.
- Game sessions in Europe are above the average for other regions.
-
The leader in session time, considering the top 25% of projects, is card games. However, the median session time is still higher for casino games.
-
Most players in the Middle East play games for no more than 5 minutes per session. Leading genres are casino and mobile adaptations of board games.
-
Asian players also enjoy casino games as much as in other regions. However, most genres do not show more than 5 minutes per session when considering median values.
Session Count Benchmarks
The methodology is similar to the above - the top 25% and bottom 25% of projects, as well as the median value, are considered.
-
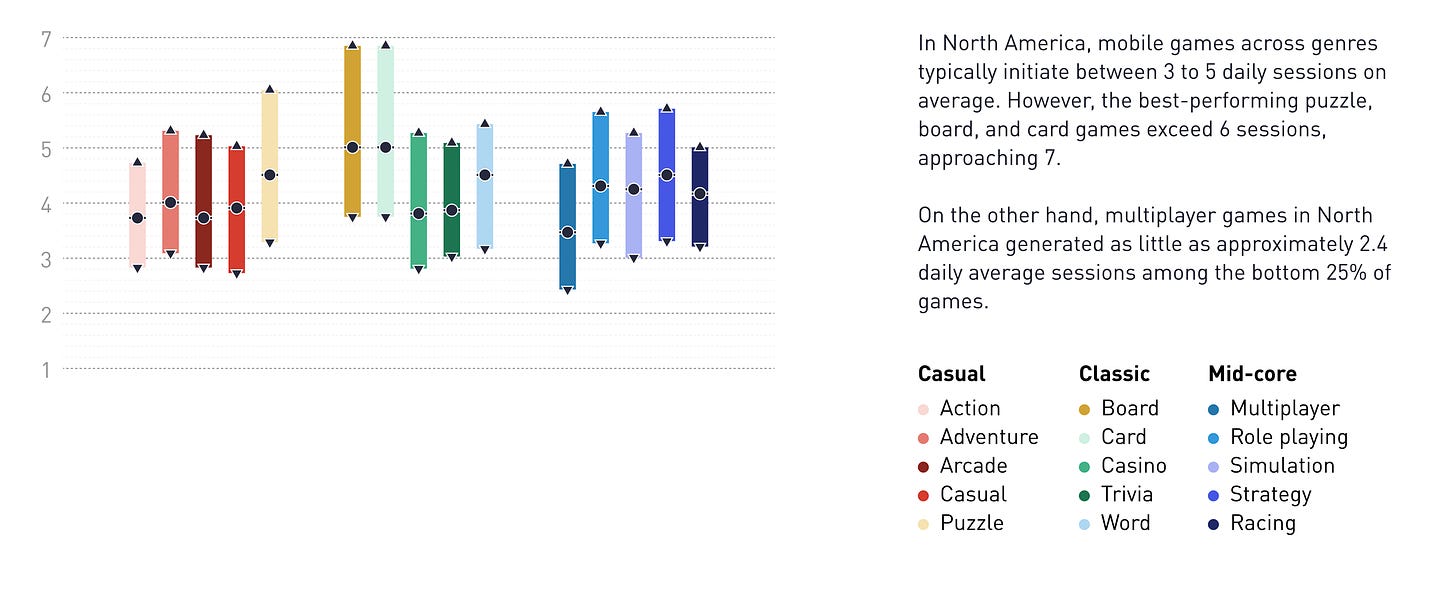
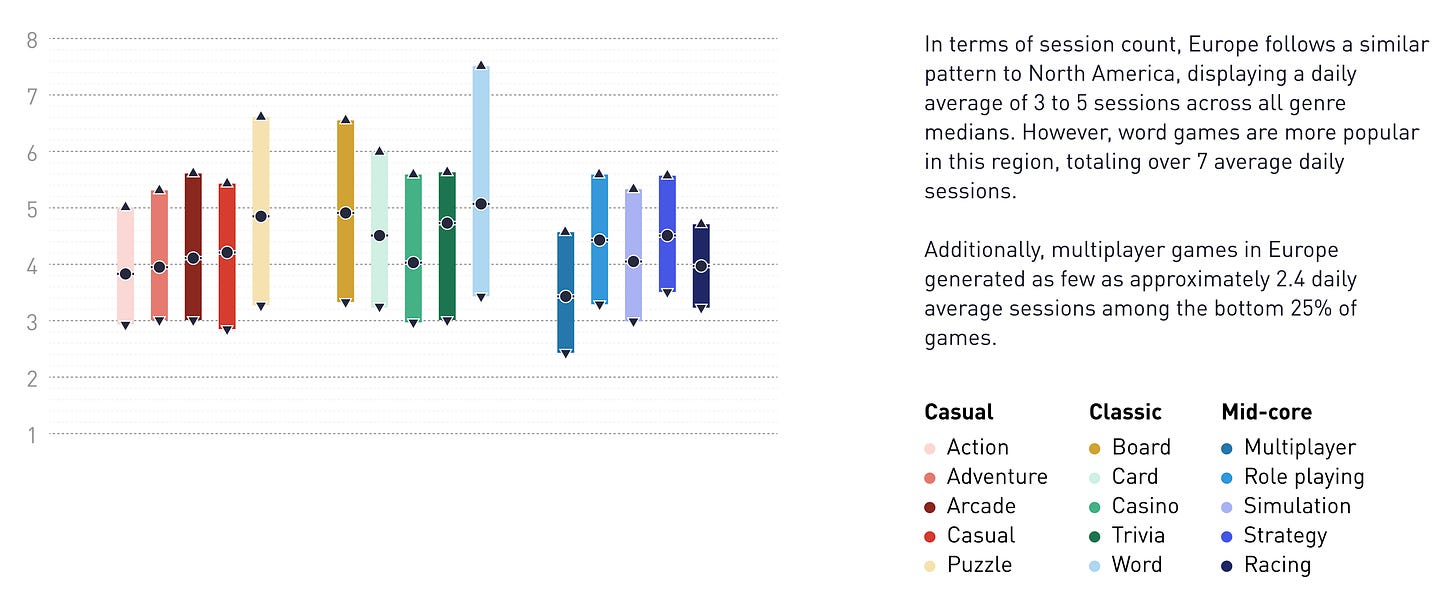
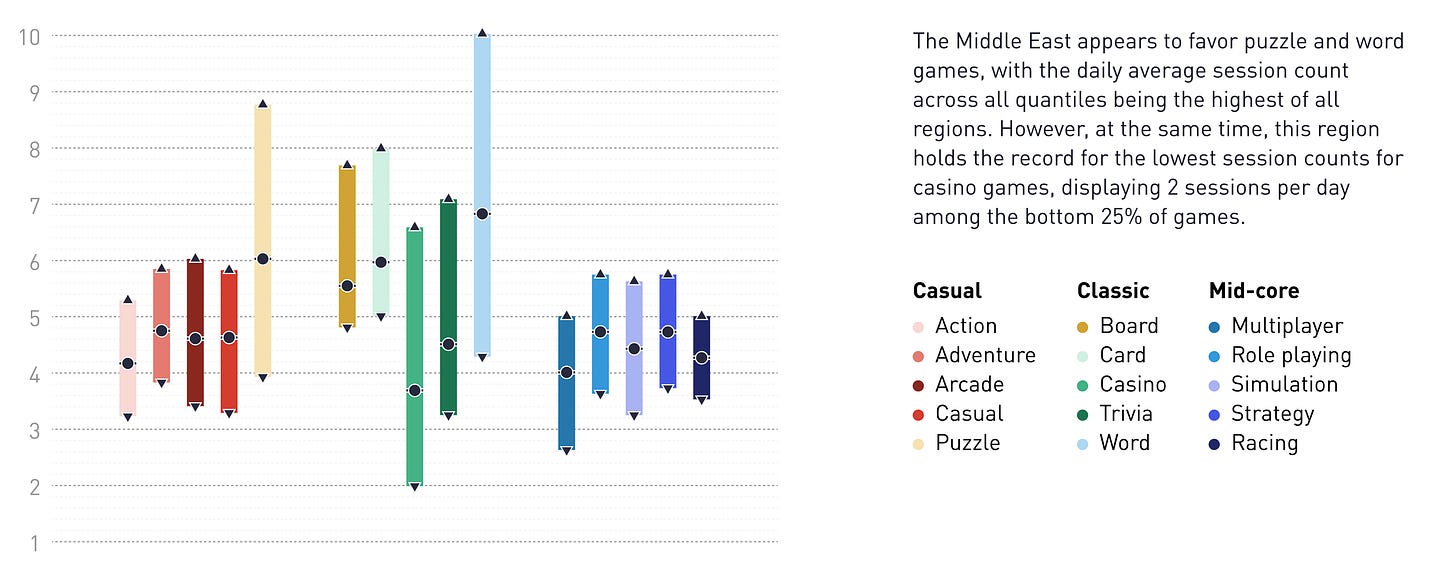
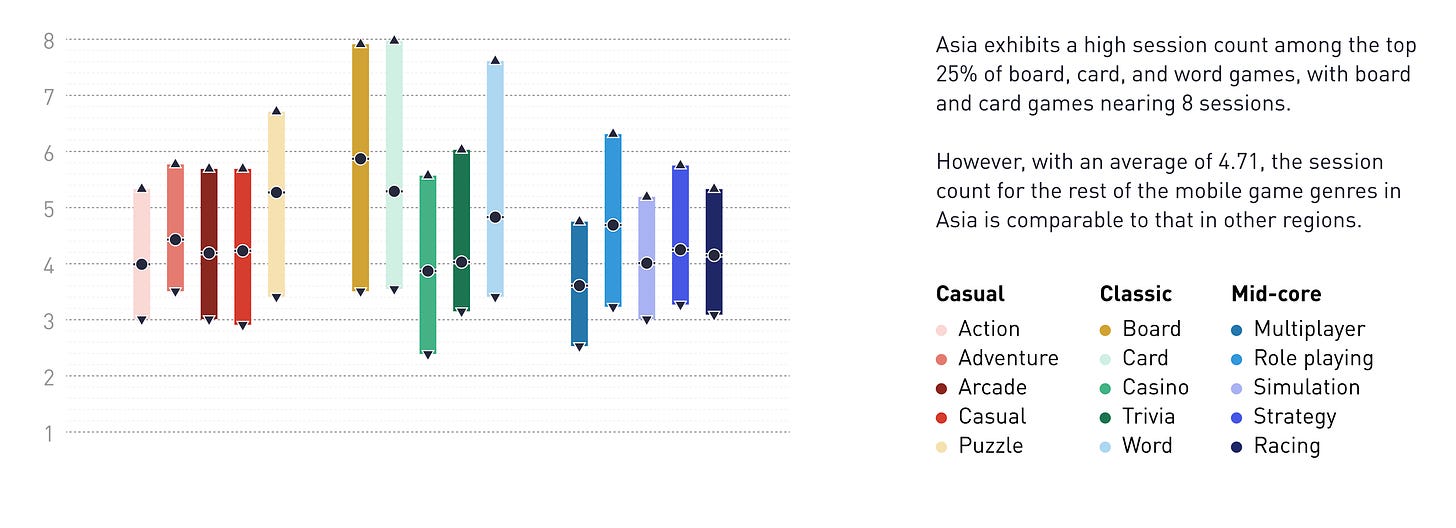
On average, users across all regions have 4-5 sessions per day.
-
In all regions, classic games (board, card, casino, etc.) have more sessions than other genres.
-
In North America, players typically have 3-5 sessions per day. The highest median values are for board and card games.
-
In Europe, word games have the highest number of sessions, reaching up to 7 per day.
-
The number of sessions in games in the Middle East is higher than in other regions. Leading genres are puzzles and word games.
-
In Asia, there are no significant statistical anomalies. The number of sessions in games is on par with other markets.
Famitsu: Nintendo Switch has become the best-selling console in Japan's history
-
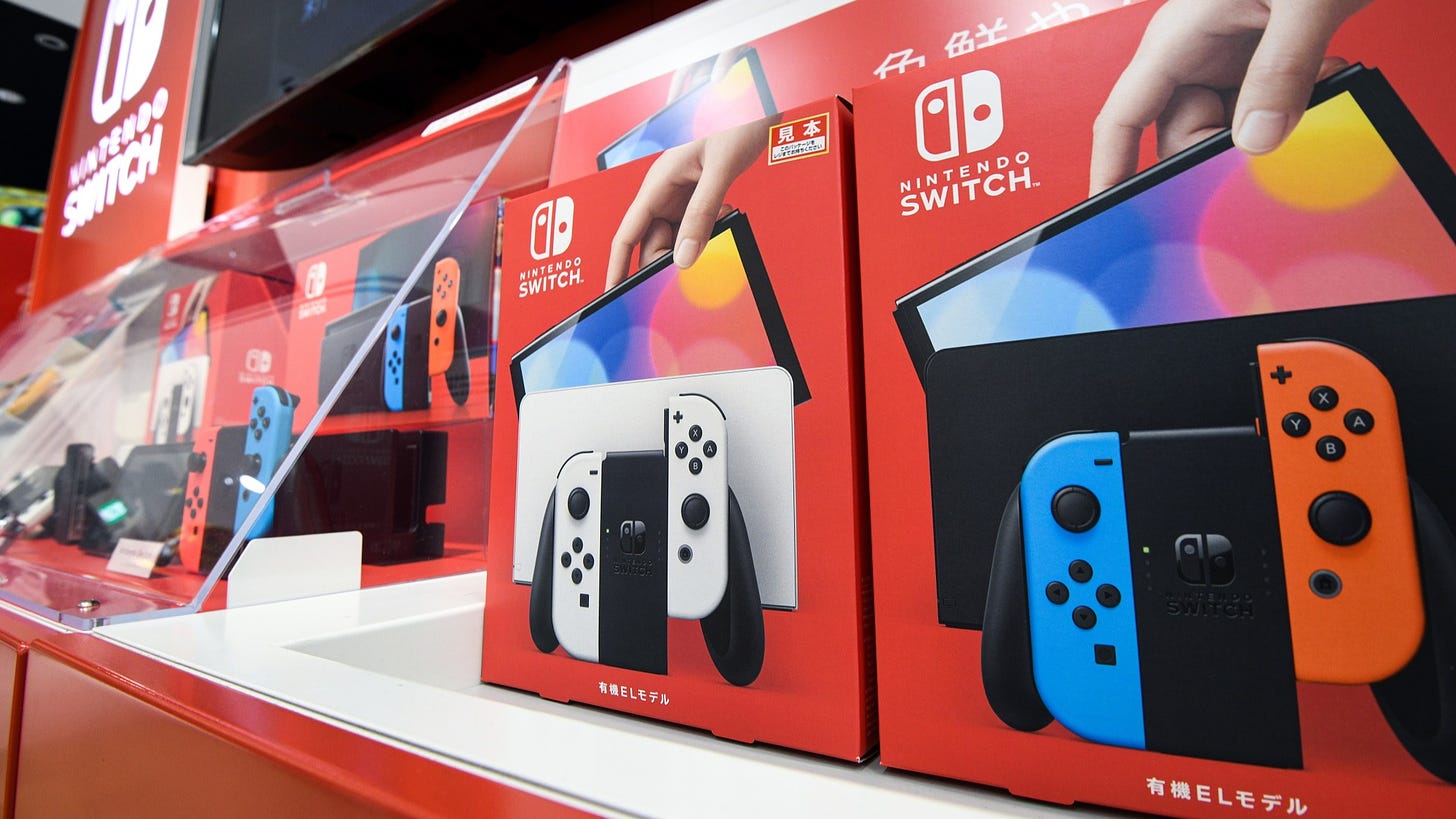
According to the publication's estimates, sales of the Nintendo Switch in the country have surpassed 32.9 million units.
-
The previous record was held by the Nintendo DS with 32.86 million systems.
-
Nintendo Switch is selling faster. It took 377 weeks to set the record, whereas sales of the Nintendo DS were recorded over 425 weeks.
StreamElements & Rainmaker.gg - State of the Streaming Market in April 2024
StreamElements tracks only Twitch data.
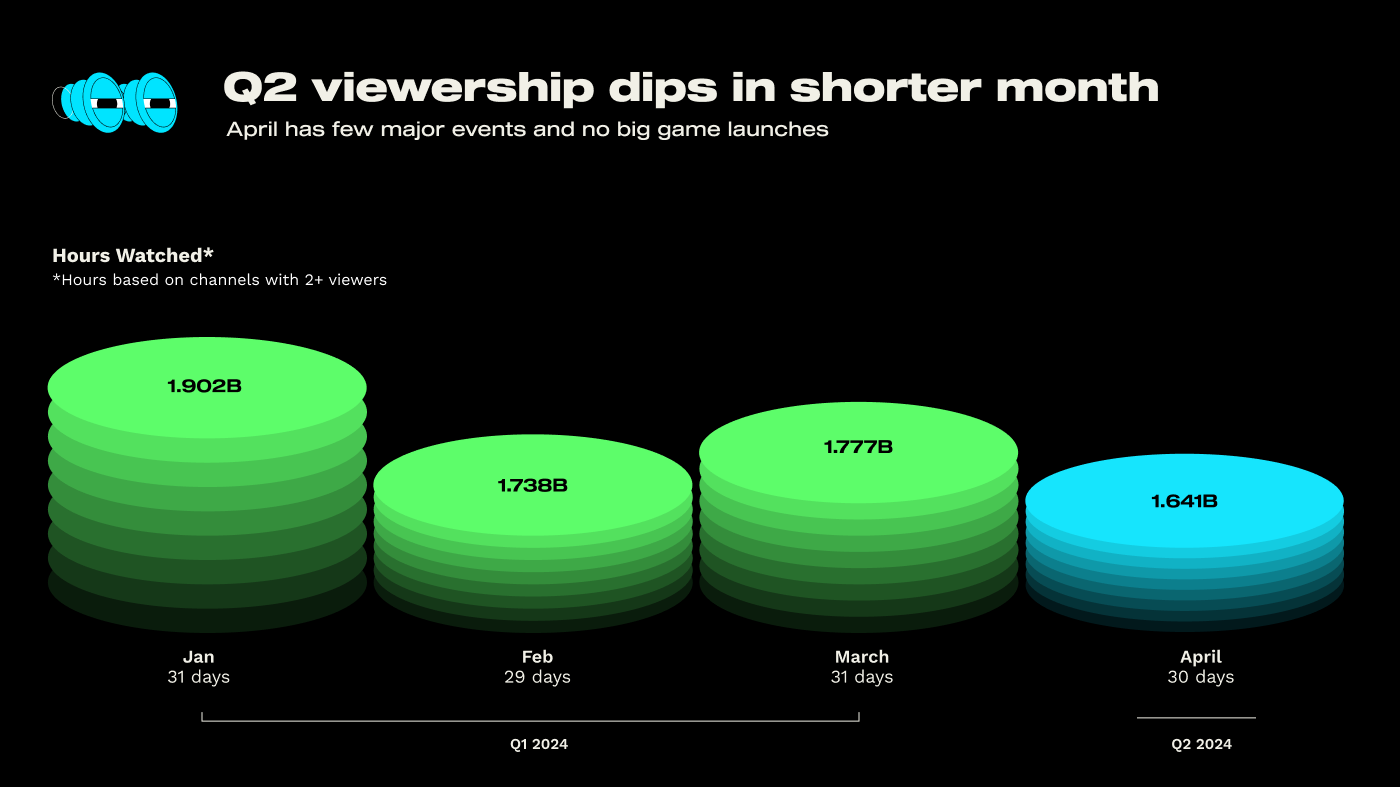
- The number of hours watched on Twitch in April dropped by 8% compared to the previous month. When compared to April 2023, the decline was less than 2%.
-
Additionally, when comparing daily viewership, there was a decrease of about 5% from March 2024.
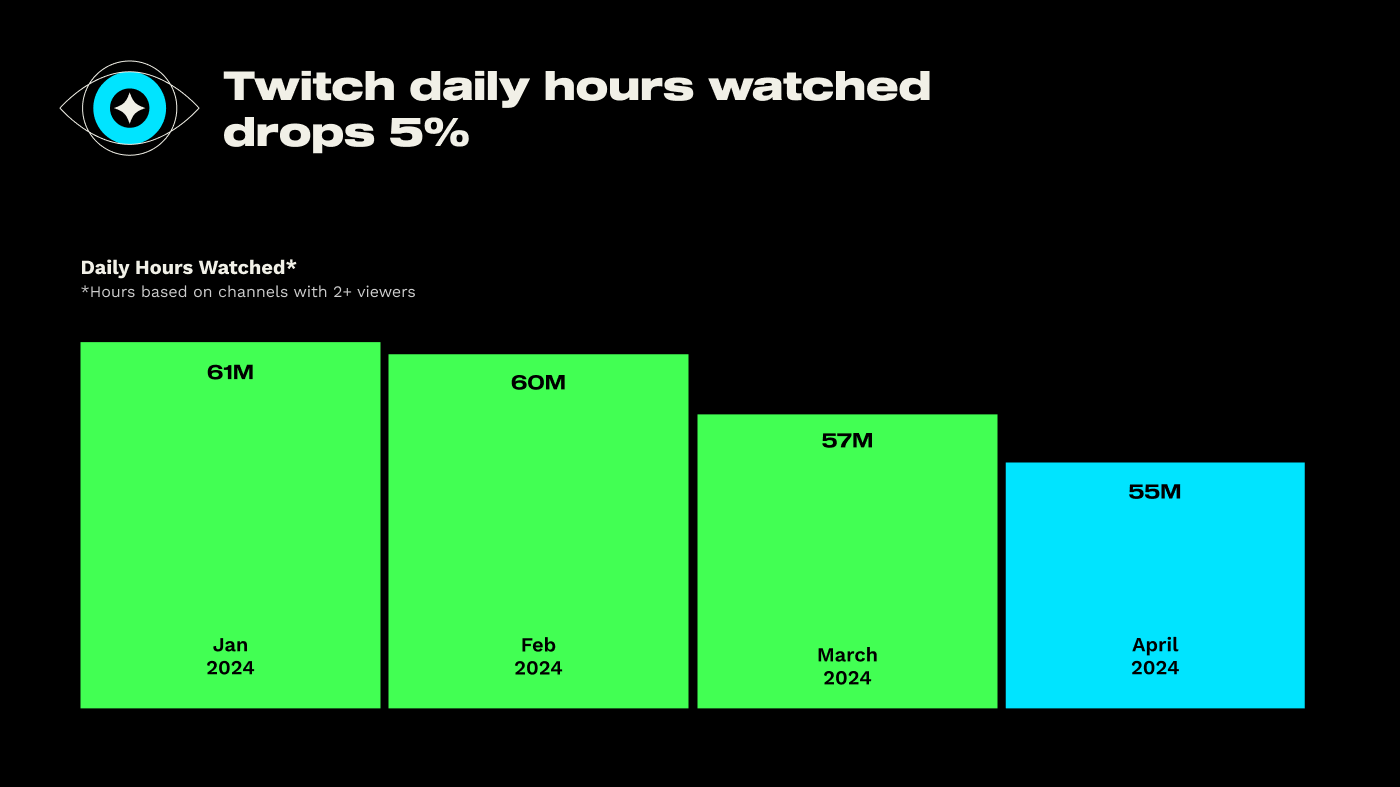
❗️The decline is attributed to the absence of major events in the esports scene and major releases.
-
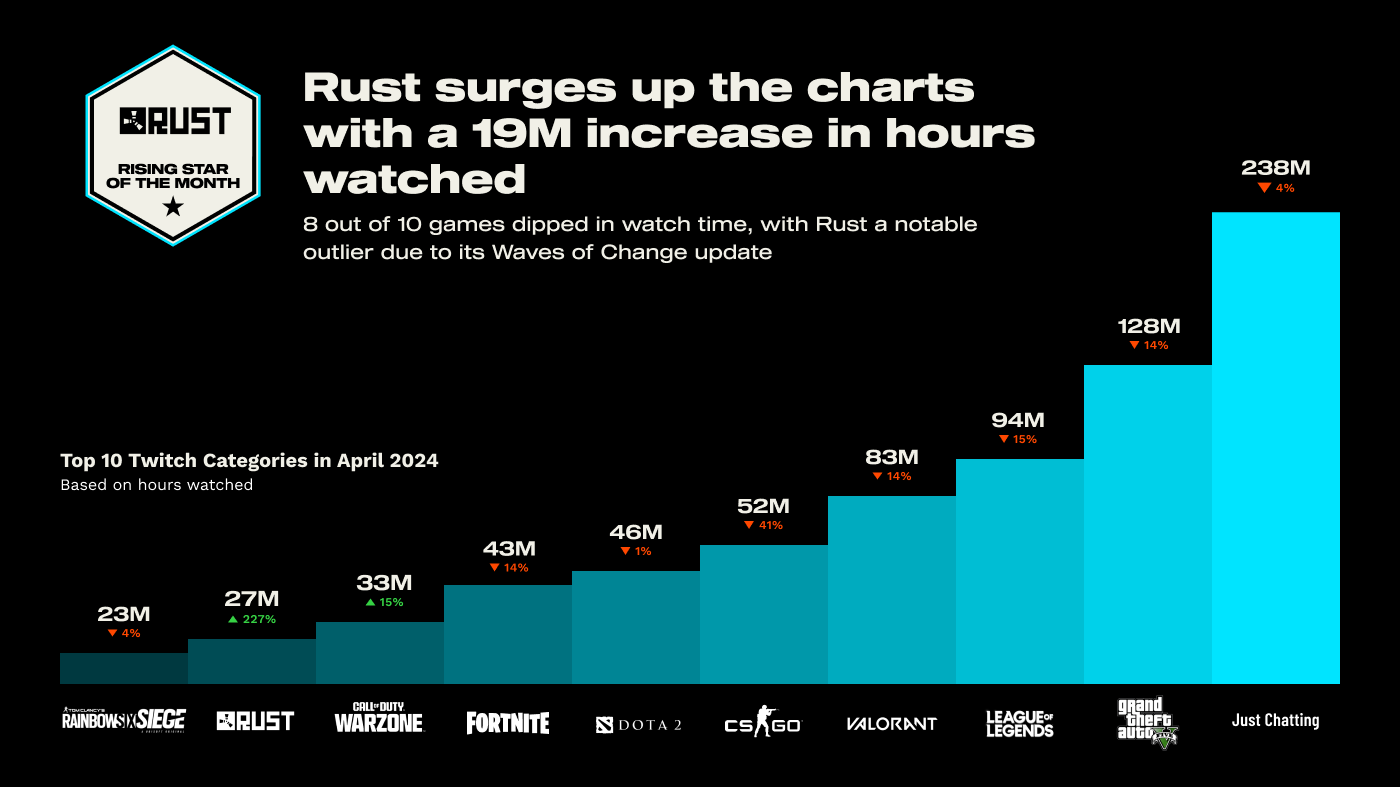
Rust climbed to 8th place in viewership on Twitch in April 2024. The number of hours watched in April increased by 227% due to a new update.
-
The leaders in viewership remain the same - Grand Theft Auto V (128 million hours); League of Legends (94 million hours); and Valorant (83 million hours).
Games & Numbers (15.05.24 - 28.05.24)

PC/Console Games
-
Manor Lords reached two million copies sold in less than 3 weeks. The publisher revealed that the conversion from wishlists to sales was 26%. The project had over 3.2 million wishlists at launch - a Steam record. The first million copies on Steam were sold in the first 24 hours.
-
Abiotic Factor, a cooperative survival game, sold 300 thousand copies in less than a month. The game was released on Steam on May 2.
-
Another Crab’s Treasure sold over 250 thousand copies in less than a month. 60% of sales were on Steam; 20% on PlayStation 5; 20% on Nintendo Switch.
-
Bellwright sold 200 thousand copies in its first month of early access. This is an RPG with survival elements set in a medieval setting.
-
Little Kitty Big City was downloaded over 1 million times through the Xbox Game Pass subscription. Sales in the first couple of days exceeded 100 thousand copies.
-
Gaming insider Tom Henderson reported on the success of XDefiant. The first million users came to the game 2.5 hours after launch; in two days, the audience reached 3 million users. On release day, the project's CCU (concurrent users) reached 500 thousand people.
Mobile Games
-
Rush Royale has earned more than $300 million since its release. The game has been downloaded over 83 million times.
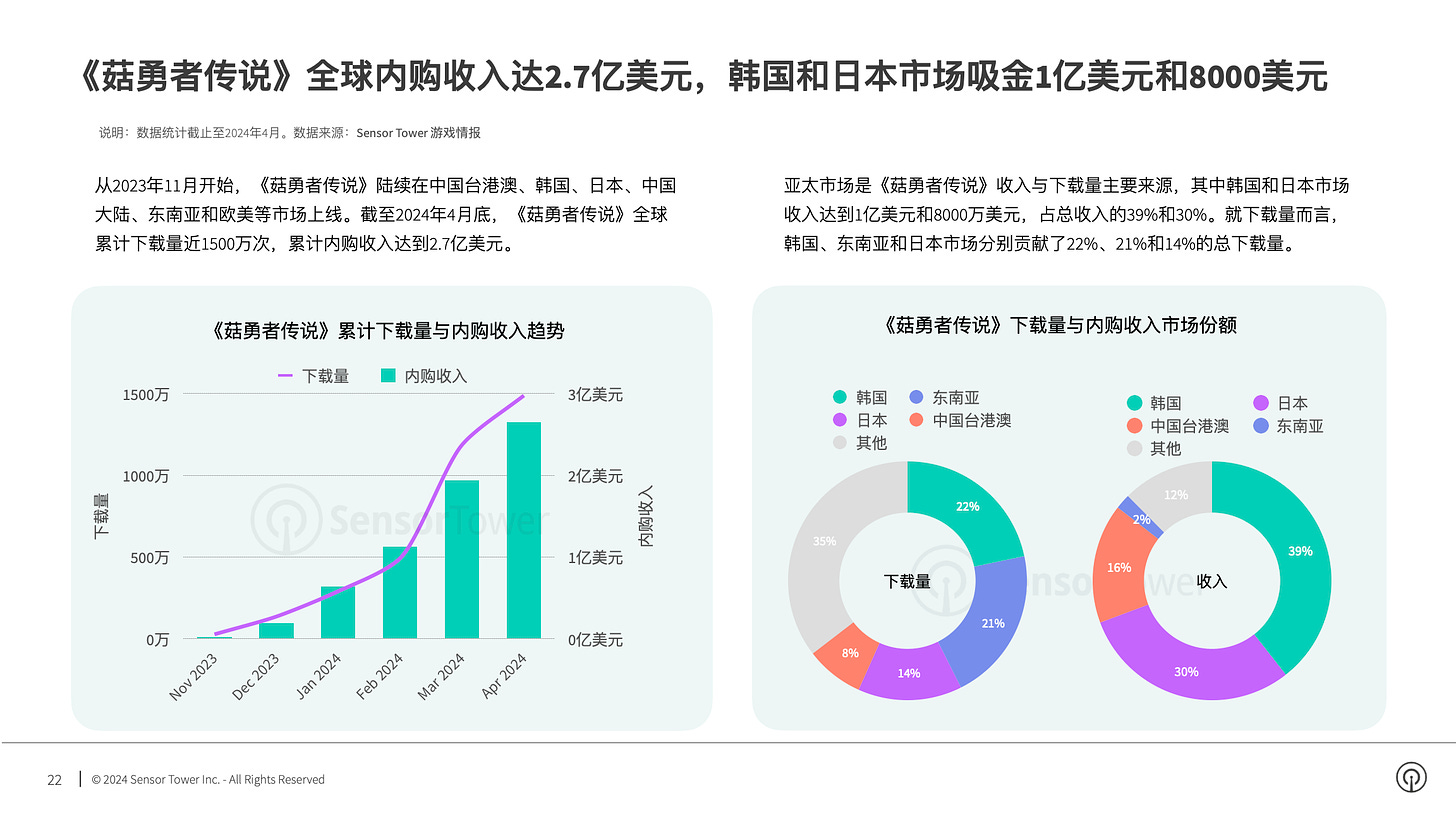
- Revenue for Legend of Mushroom reached $270 million by the end of April 2024. The majority of cash comes from South Korea (39.4%) and Japan (30%). In these countries, the male audience for the project exceeds 80%.
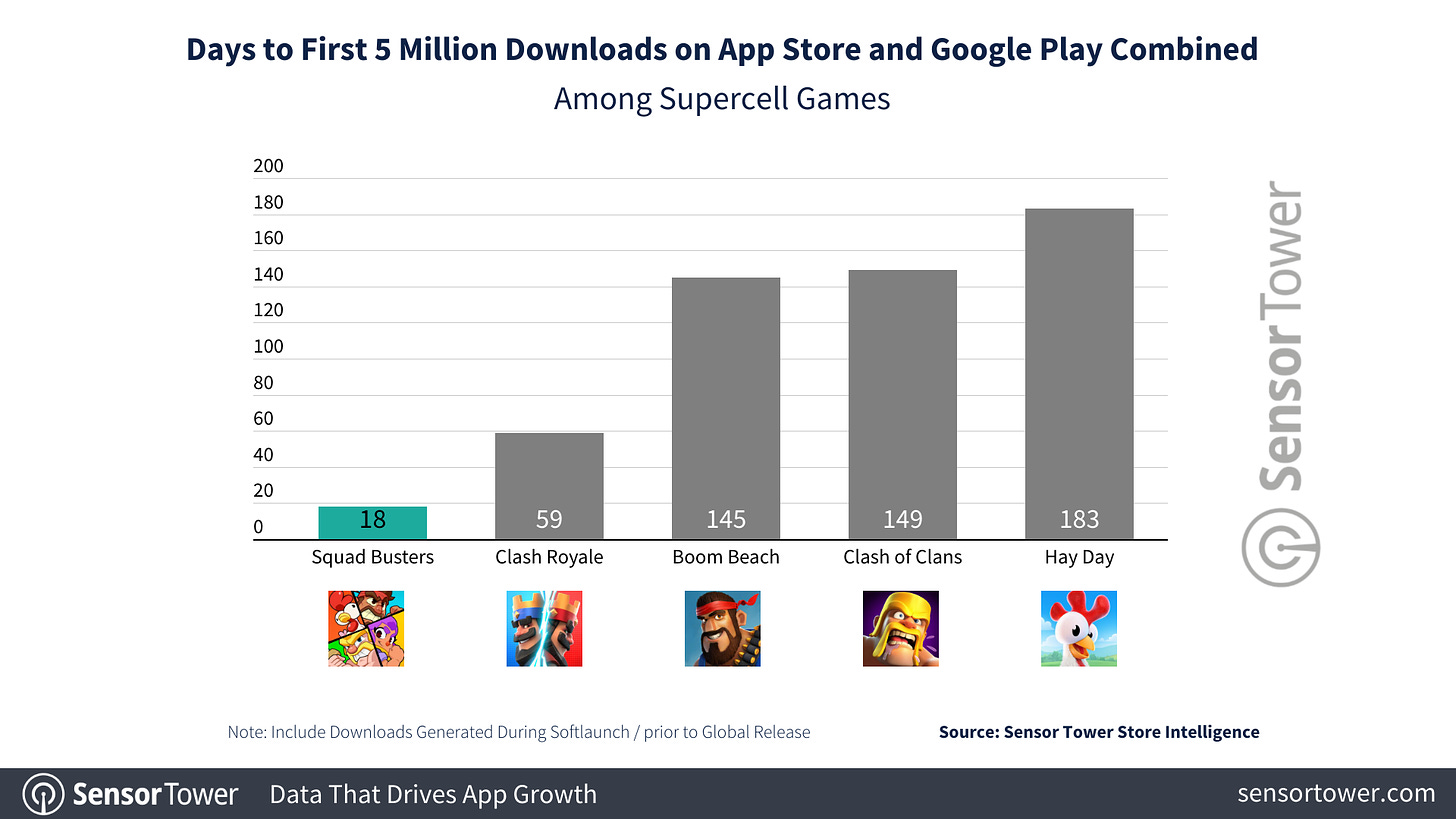
- Squad Busters reached 5 million downloads faster than any other Supercell game. It took the game only 18 days. The previous record was held by Clash Royale - 59 days. Meanwhile, the global release of the game will take place tomorrow, May 29.
-
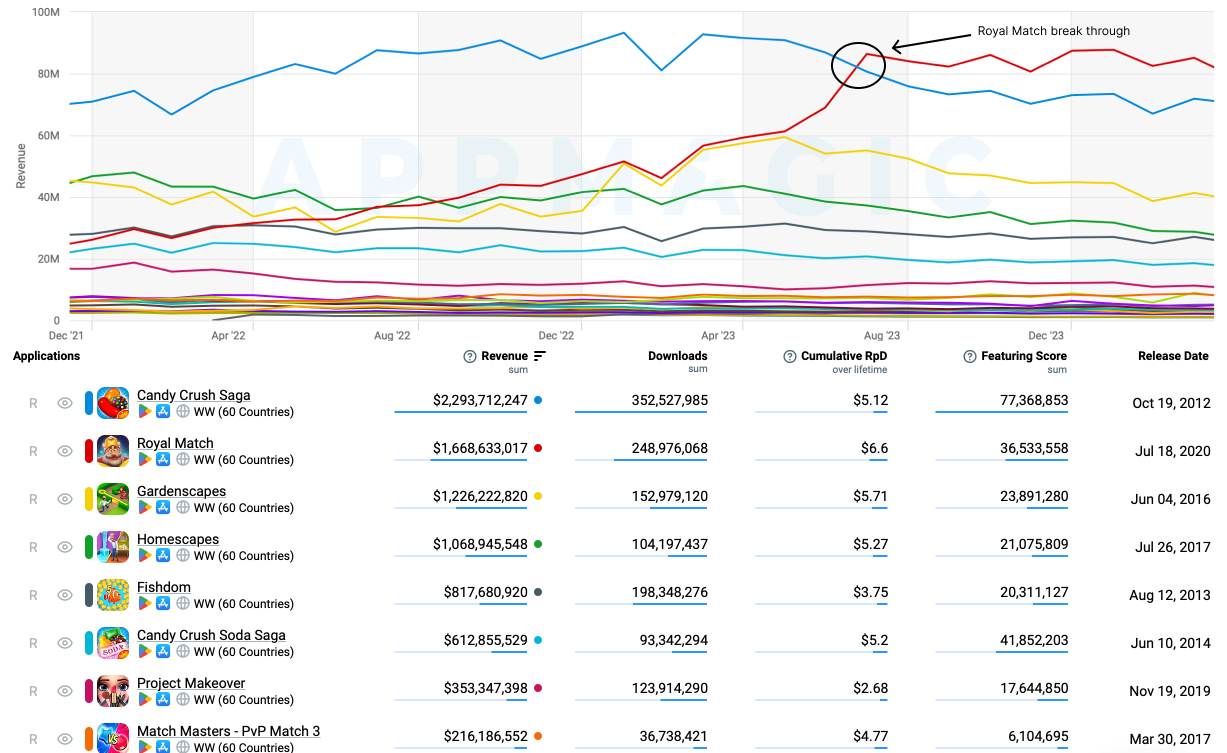
According to AppMagic, users have spent over 3 billion dollars on Dream Games. Royal Match generated 99% of the revenue; the remaining percent came from Royal Kingdom (the studio's new project in soft launch).
Big Games Machine: How People Discover New Games in 2024
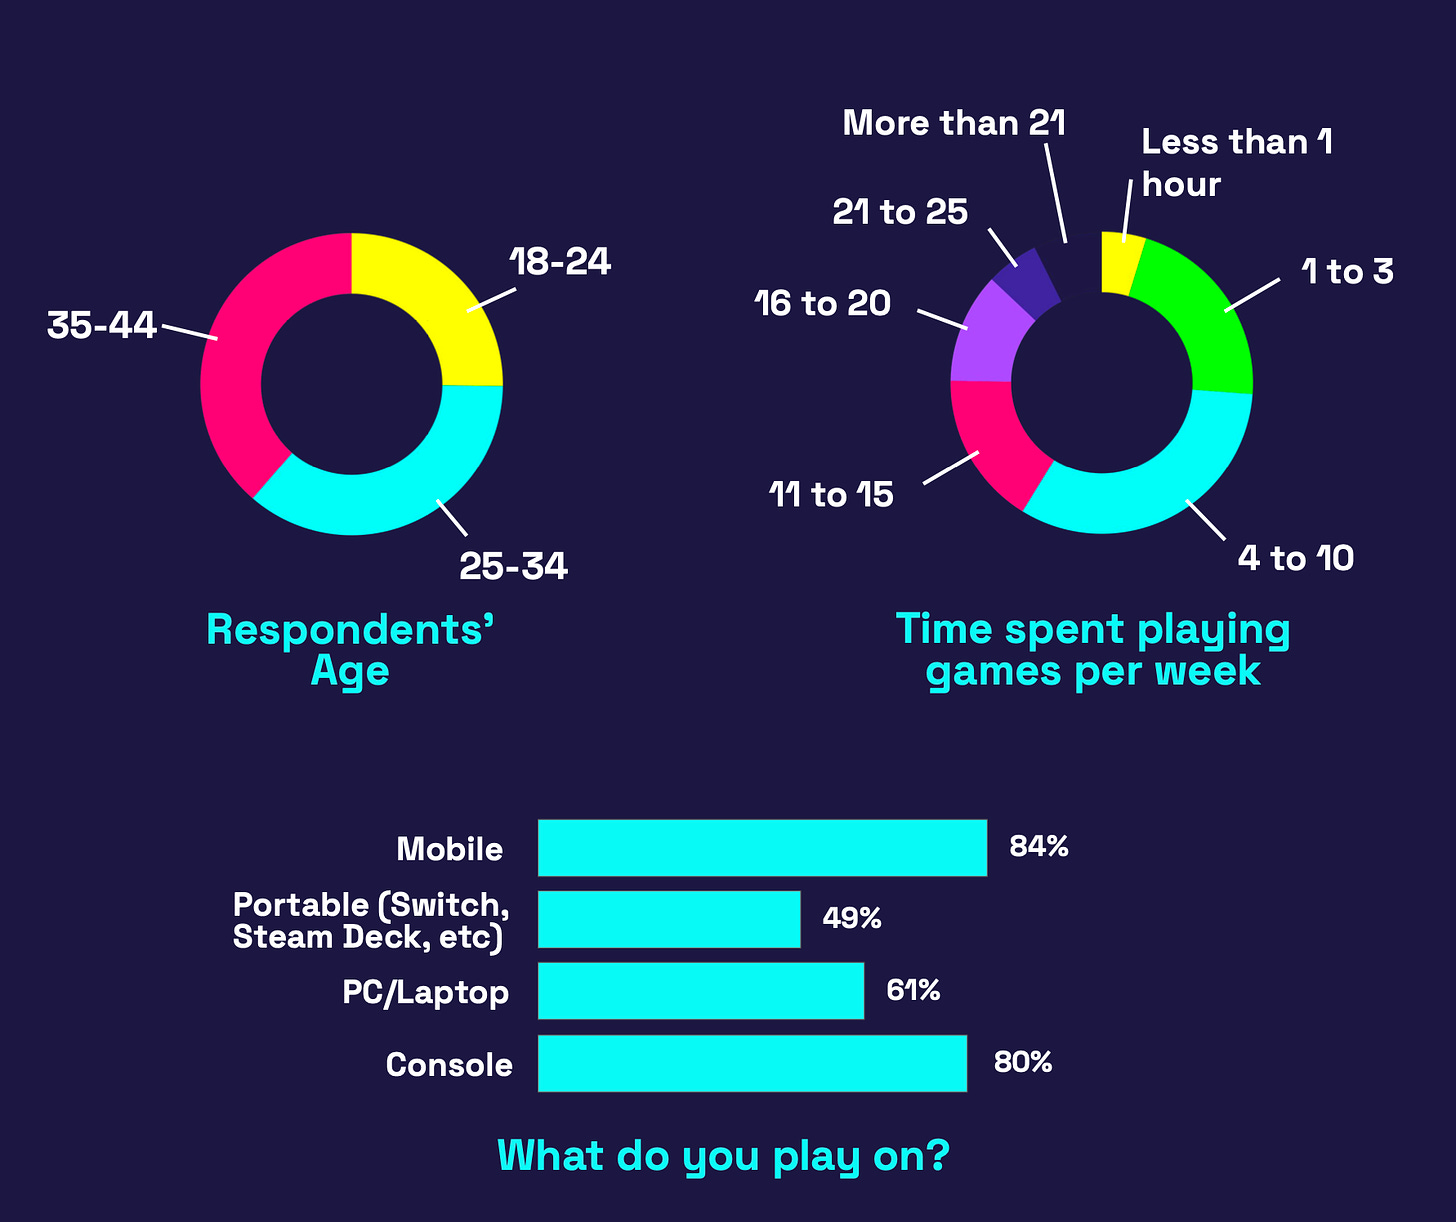
A survey was conducted with 1009 players from the USA. The number of men and women was equal. The age distribution (from 18 to 44 years old) was also almost equal.
-
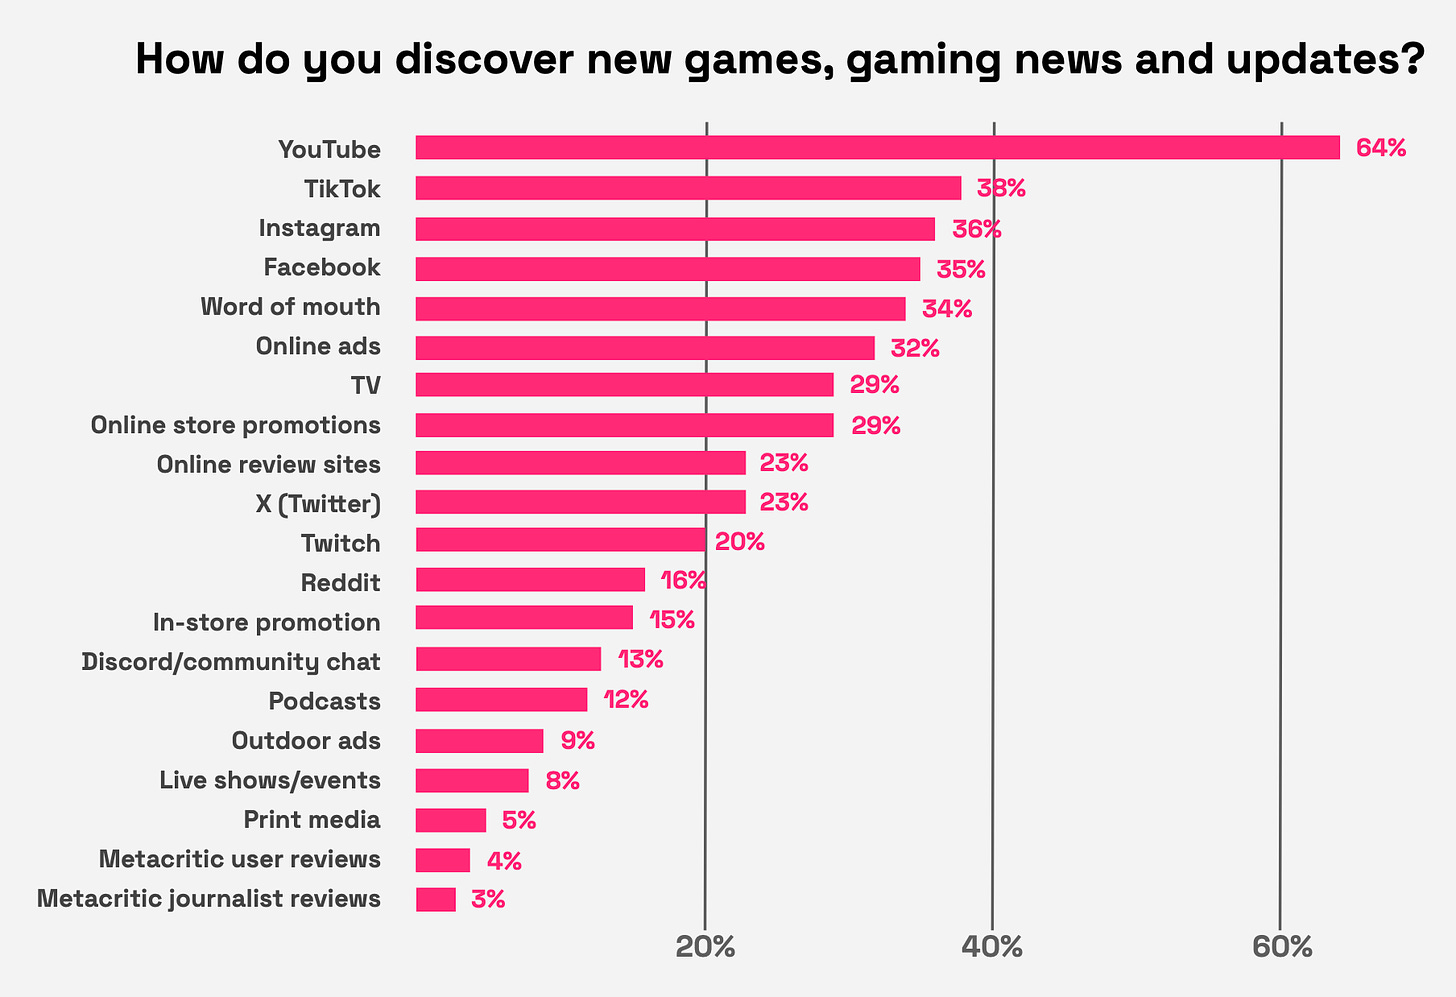
64% of players learn about new games from YouTube. This is the most popular channel.
-
TikTok (38%) is in second place. It is followed by Instagram (36%), Facebook (35%), recommendations from friends and acquaintances (34%), and advertisements (32%).
-
On average, users check 4 to 5 sources when they want to make a purchase decision.
-
Moreover, the younger generation uses TikTok (58% of 18-24-year-olds versus 29% of 34-44-year-olds) and Instagram (49% of 18-24-year-olds versus 29% of 34-44-year-olds) more often for game news.
-
Male gamers more frequently use Twitch and YouTube for game information. Females prefer TikTok more.
-
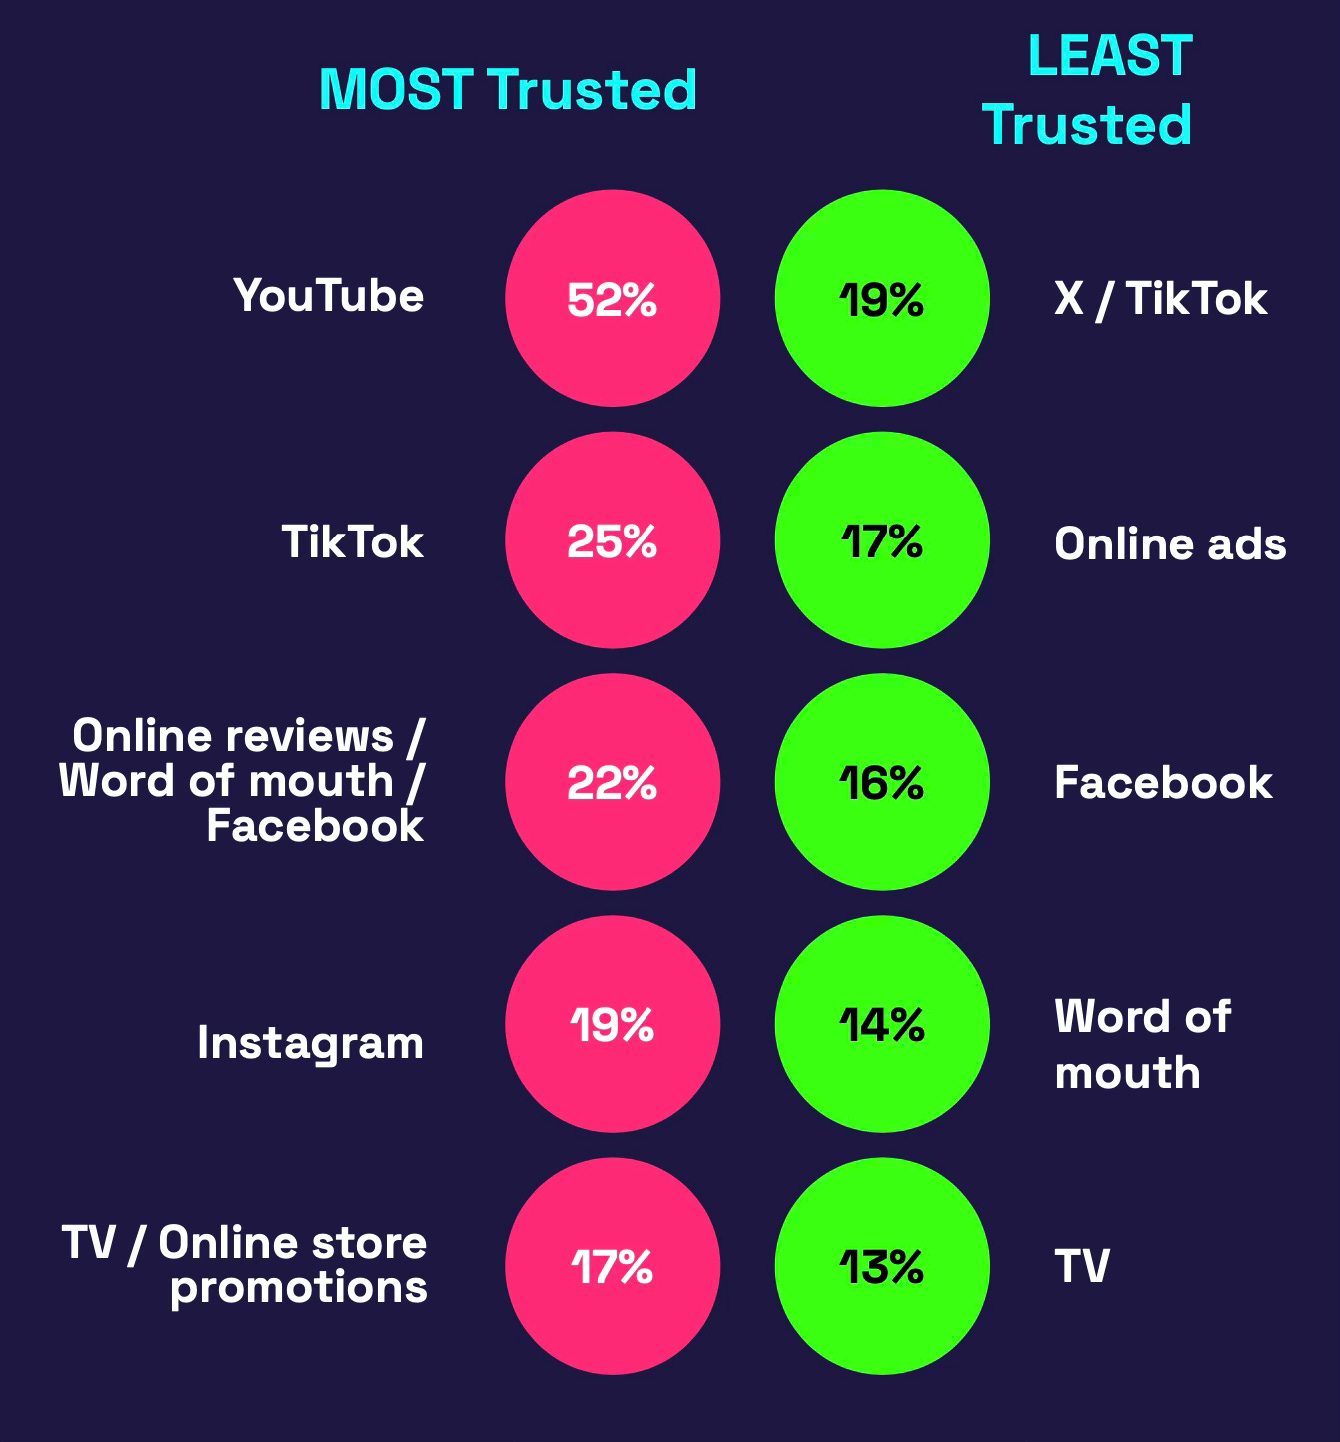
YouTube is the most trusted by players - 52% of respondents indicated this. TV advertisements are the least trusted - 13%. Opinions are polarized - for example, some people trust TikTok, while others do not.
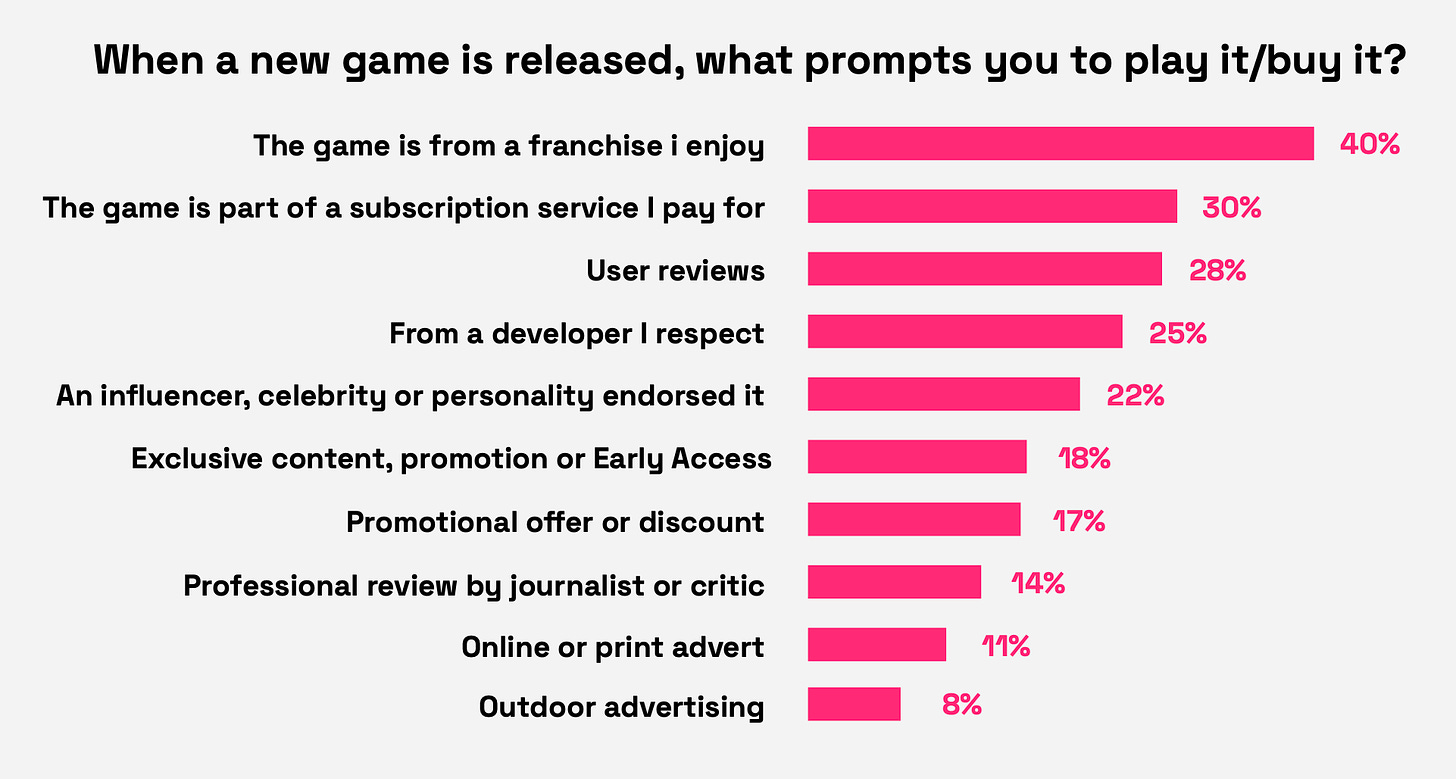
- People are inclined to try a new game if it is a new installment of their favorite franchise (40%); the game is included in a subscription (30%); it has good reviews from players (28%); it is released by a developer they like (25%). Overall, people prefer familiar franchises and developers.
Metaplay: How much does it cost to develop custom Backend Services in Mobile Gaming Companies?
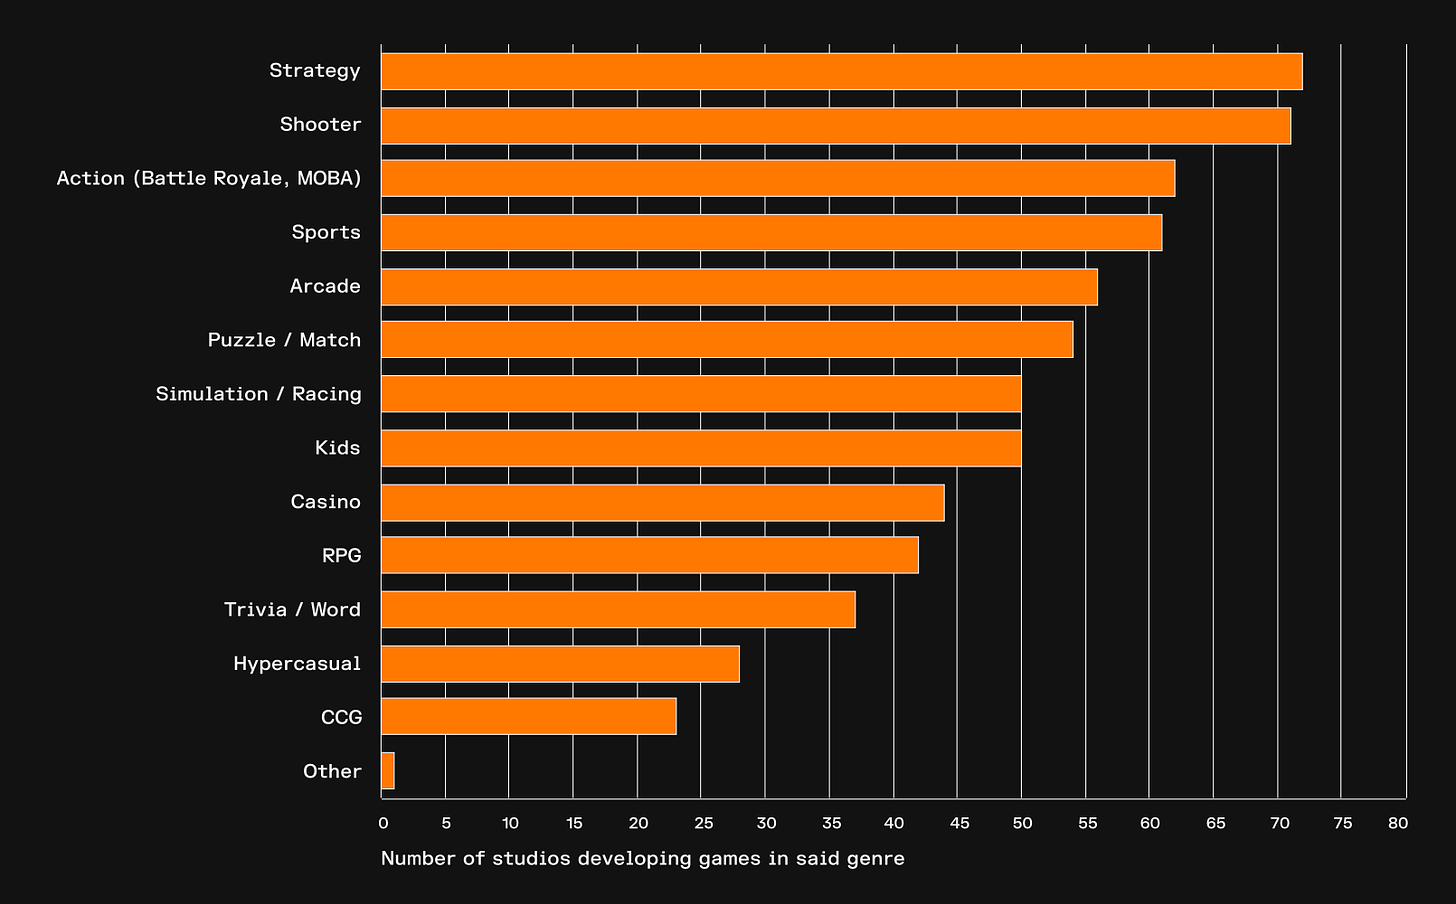
The company surveyed 125 people from companies with more than 50 employees in the US. All respondents were C-level executives or technical team leaders.
-
The average cost of building a custom backend is $21.66 million.
-
On average, 52 developers participate in the development of such solutions, with an average salary of $138,864 per year. The process takes 36 months.
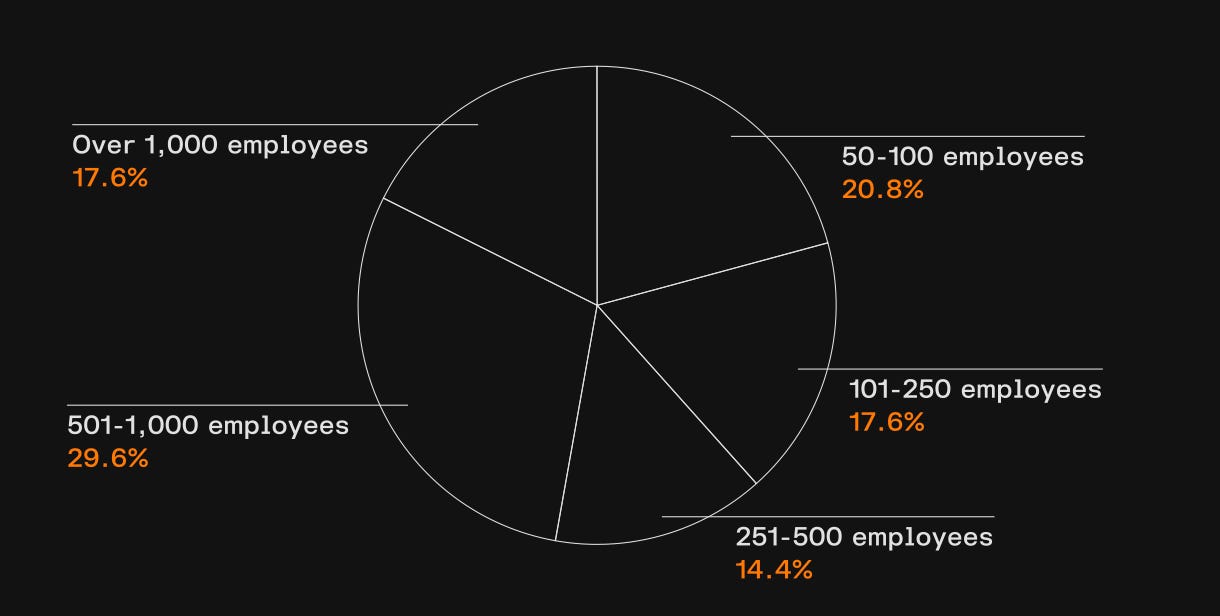
❗️The decision to create custom technological solutions is predominantly made by large teams. In the survey, 61.6% of the companies had more than 250 employees.
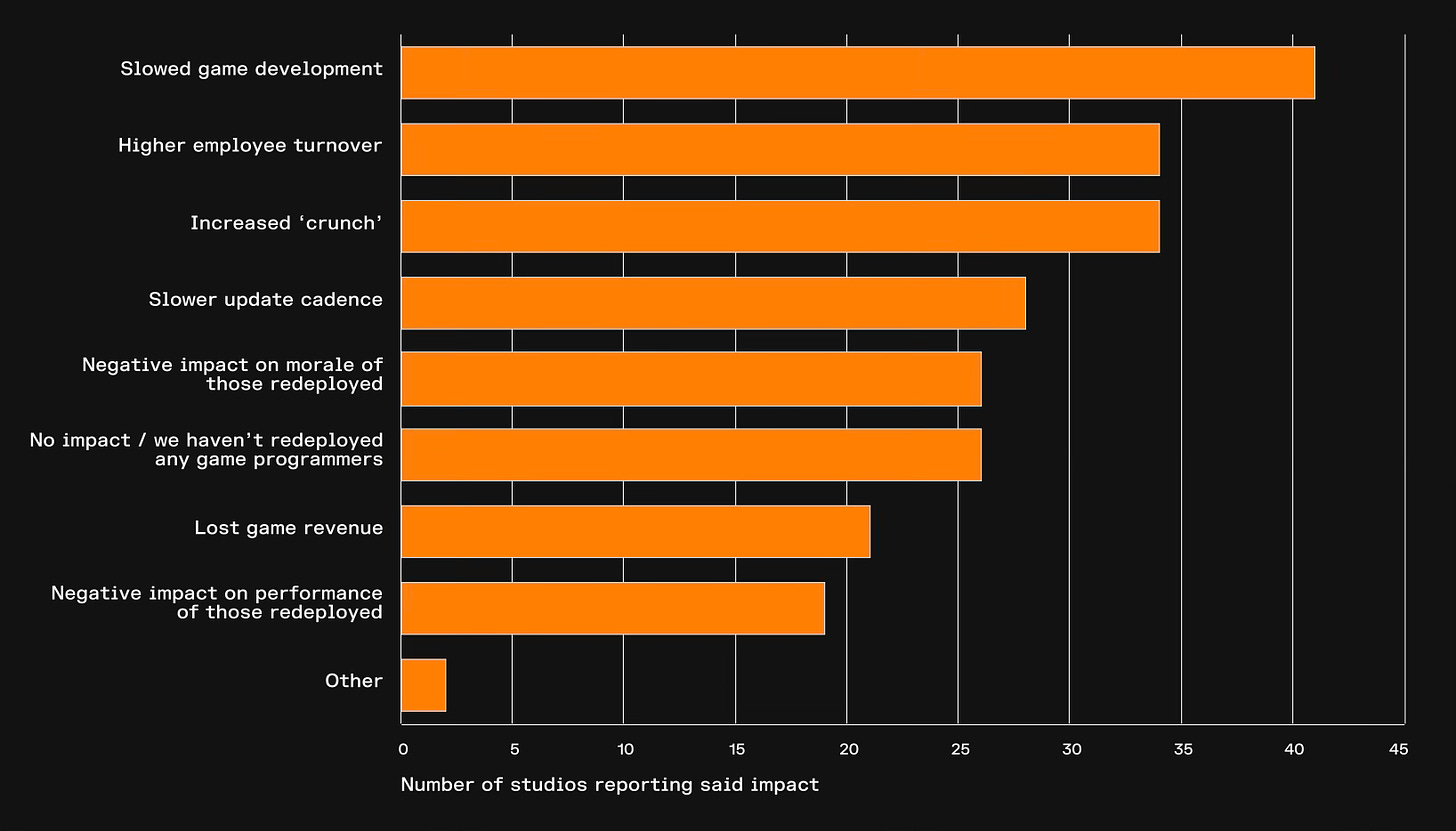
- Metaplay notes that every third studio reported negative effects from reallocating personnel to develop custom backend solutions. This slowed down product development, provoked employee turnover, and increased the amount of crunch.
❗️Metaplay is a company that provides backend services. Therefore, the results of the study may be biased.
Circana: The US Gaming Market Decreased by 3% in April 2024

Market numbers
-
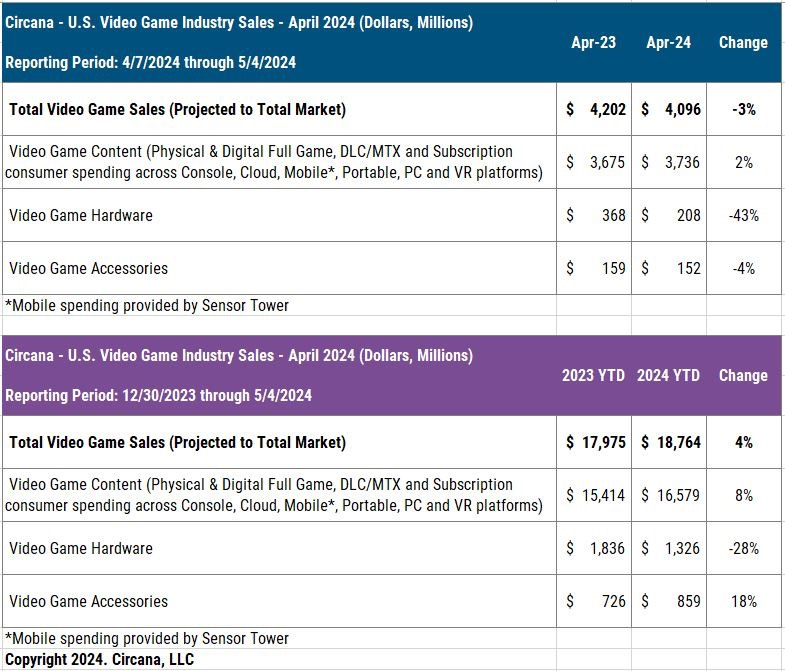
The volume of the US gaming market in April 2024 amounted to $4.096 billion. This is 3% less than a year earlier.
-
Sales of gaming content grew by 2% (to $3.736 billion).
-
Notably, this growth is driven by the mobile segment, which grew by 12% YoY, according to Sensor Tower. The console games segment is declining.
-
Gaming hardware sales plummeted by 43% (to $208 million). Accessory sales also fell by 4% (to $152 million).
-
PlayStation 5 ranked first in sales. The biggest decline was in Nintendo Switch sales, down 69% YoY, but this did not prevent the console from becoming the second best-selling device. Xbox Series S|X only outperformed the Nintendo Switch regarding dollar sales.
-
Currently, PS5 sales in the US are 8% ahead of PS4 sales for the same period. Xbox Series S|X is 13% behind Xbox One.
-
PlayStation Portal was the most successful accessory in April and overall in 2024 in terms of dollar sales.
-
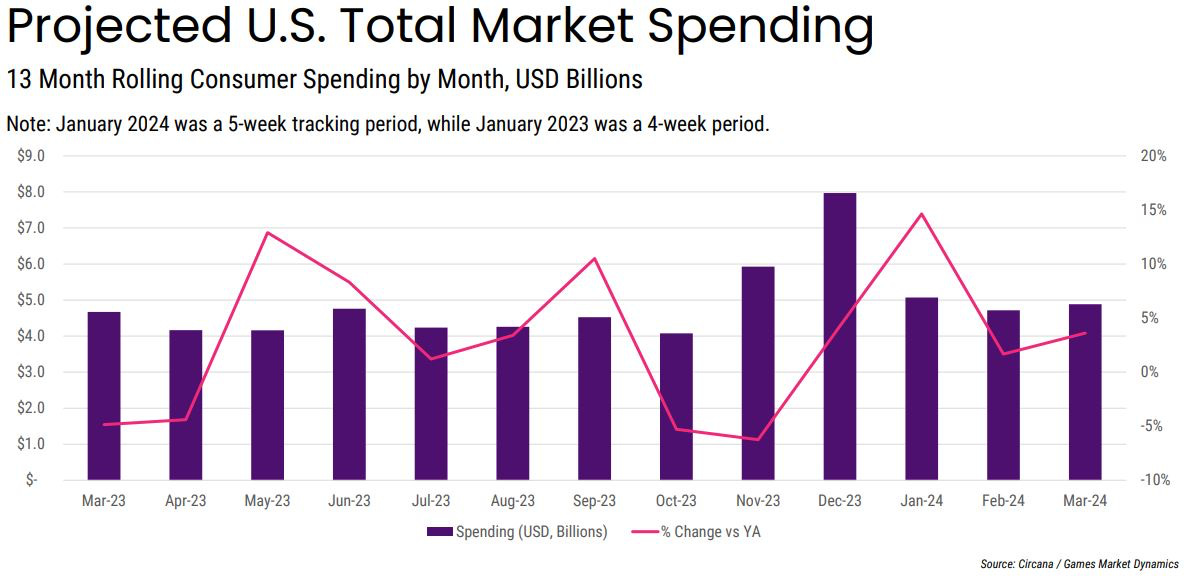
As of the first four months of 2024, the US market is 4% ahead of last year's figures for the same period.
Game Sales
-
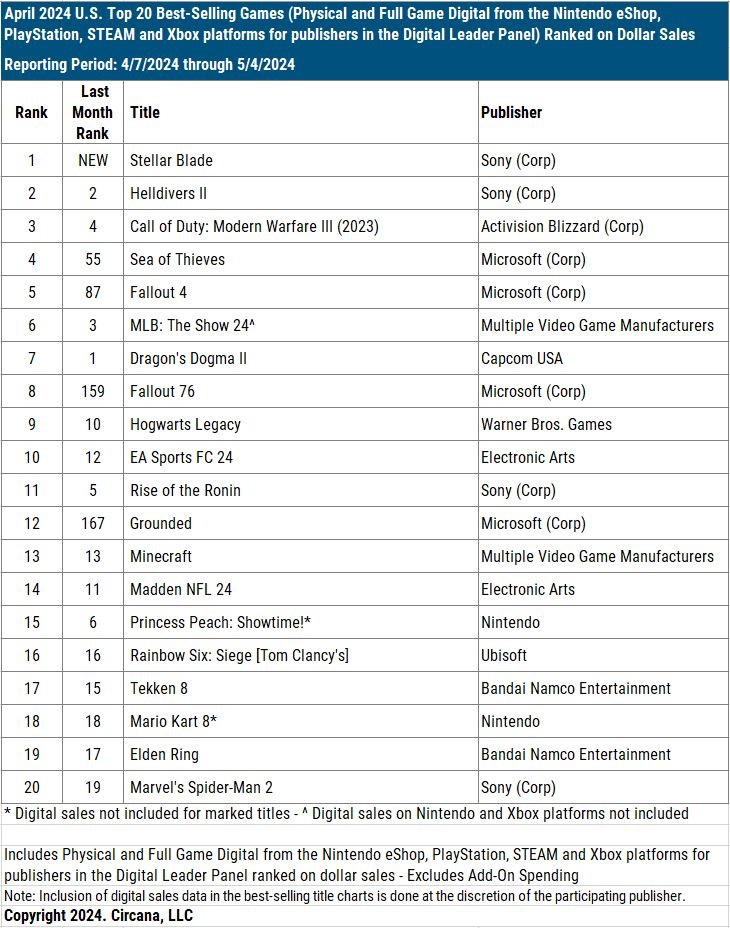
Stellar Blade became the best-selling B2P game in the US in April 2024. It ranks 16th overall. However, it leads with the fewest copies sold since April 2012, when Prototype 2 topped the chart.
-
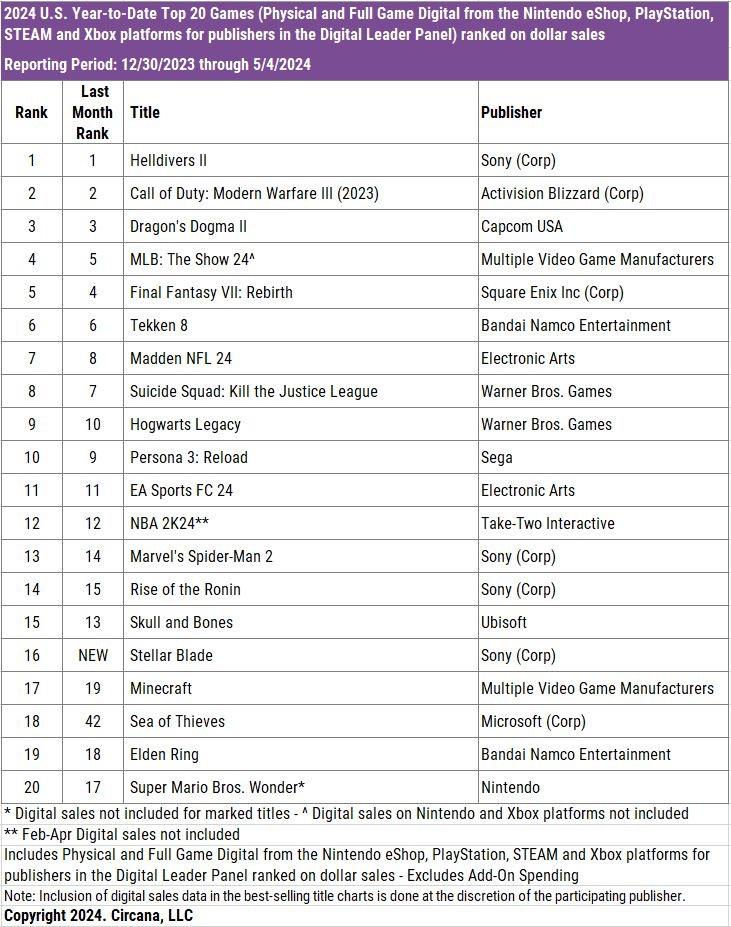
Helldivers II ranked second in sales. But the volume of copies sold fell by 70% compared to March this year. The game continues to confidently lead the overall sales ranking for 2024.
-
Sea of Thieves (4th place in April) and Grounded (12th place in April) significantly increased in sales after being released on PlayStation. In March, they were ranked 55th and 167th respectively.
-
Fallout 4 finished the month in 5th place in sales in April.
-
The leaders of the mobile market are MONOPOLY GO!, Royal Match, and Candy Crush Saga. Last War: Survival continues to grow actively, with revenue increasing by 16-18% compared to March 2024, according to Sensor Tower.
Games ranking by platforms
-
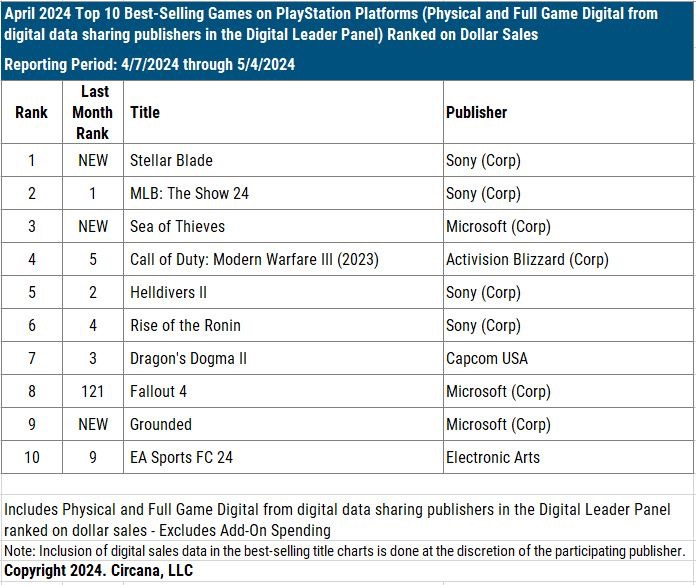
In the top 10 PlayStation sales, there are several new releases. Stellar Blade is in 1st place, Sea of Thieves is in 3rd place, and Grounded is in 9th place. Fallout 4 also returned to the top 10. Interestingly, these three games are published by Microsoft.
-
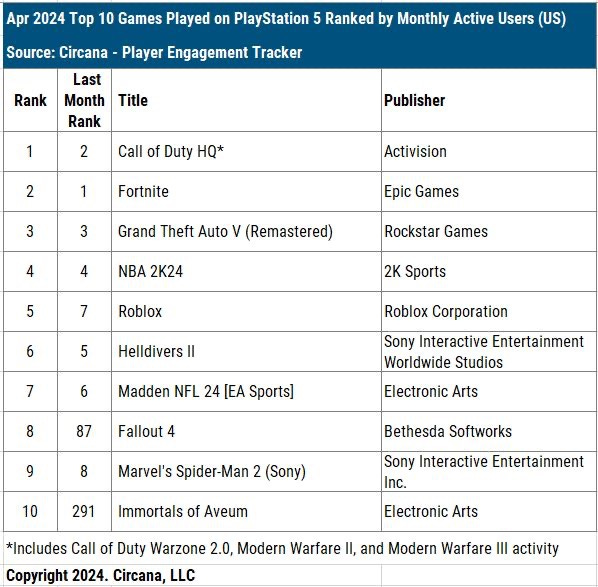
The leaders in MAU (Monthly Active Users) on PlayStation are Call of Duty (all games), Fortnite, and Grand Theft Auto V. Fallout 4 entered the ranking (thanks to the success of the series), as did Immortals of Aveum (the game is available in PS Plus).
-
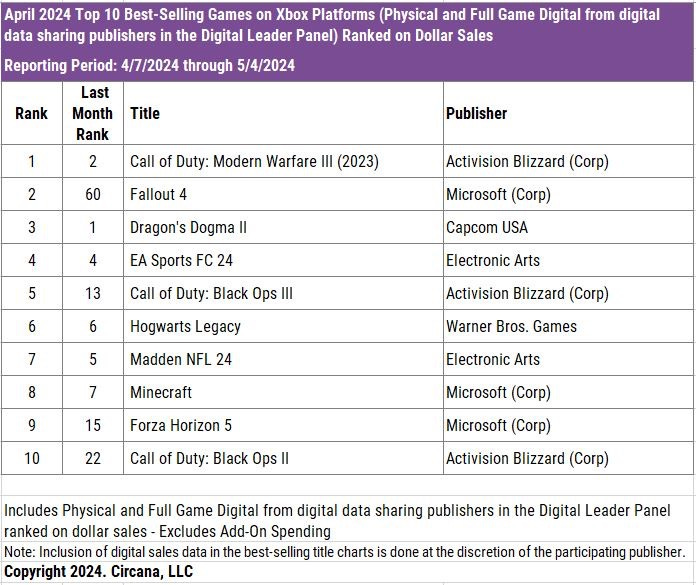
On Xbox, there are no new releases in the charts, but Fallout 4 returned to the top 10, ranking 2nd in April.
-
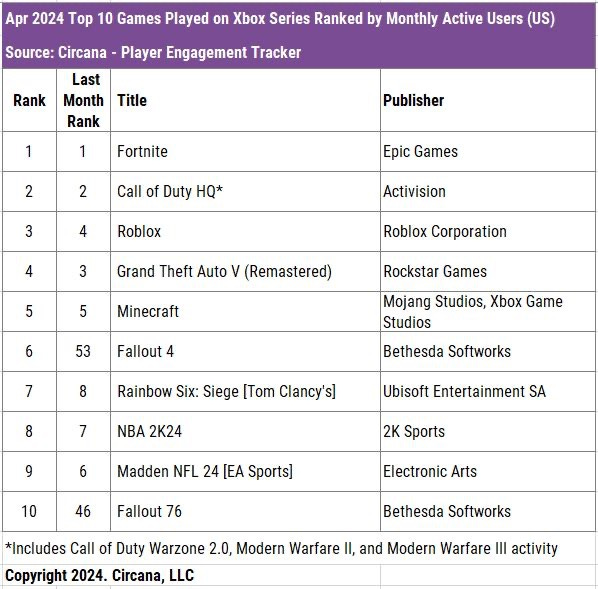
The leaders in MAU on Xbox are Fortnite, Call of Duty, and Roblox. Fallout 4 and Fallout 76 also made it to the top 10.
-
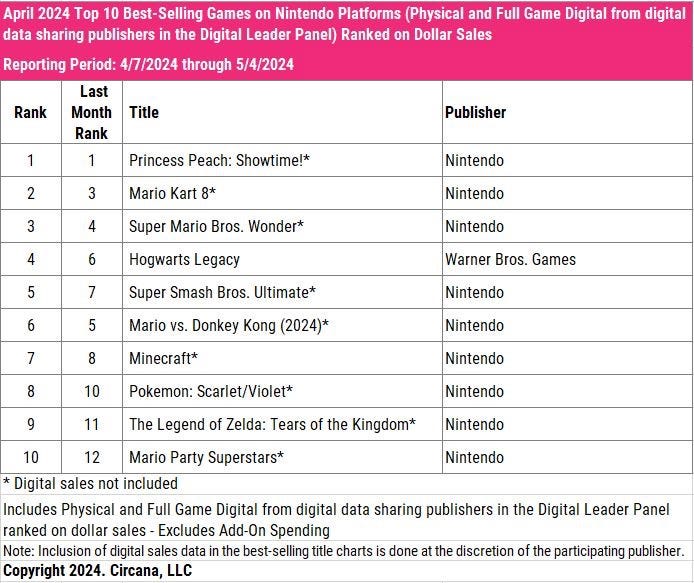
For Nintendo Switch, everything is stable—there were no new releases, and 9 out of the 10 best-selling games are published by Nintendo itself.
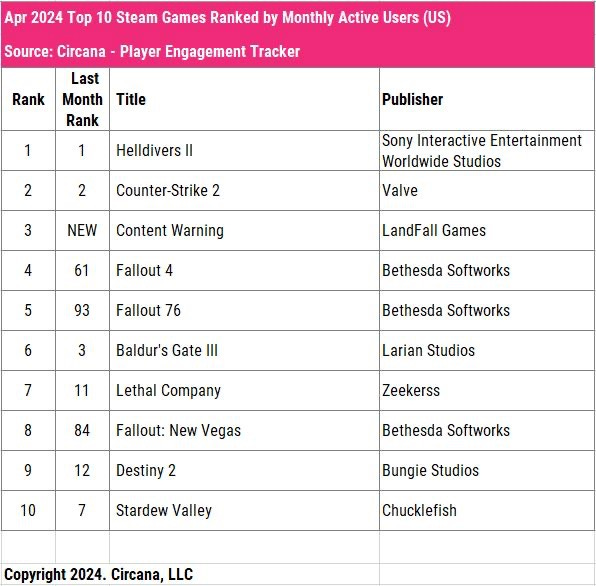
- The leaders in MAU on Steam are Helldivers II, Counter-Strike 2, and Content Warning from Landfall Games. Fallout 4, Fallout 76, and Fallout: New Vegas also made it to the top 10.
PlayStation 5 is the most profitable console for PlayStation & more from a new FY'23 PS business presentation
-
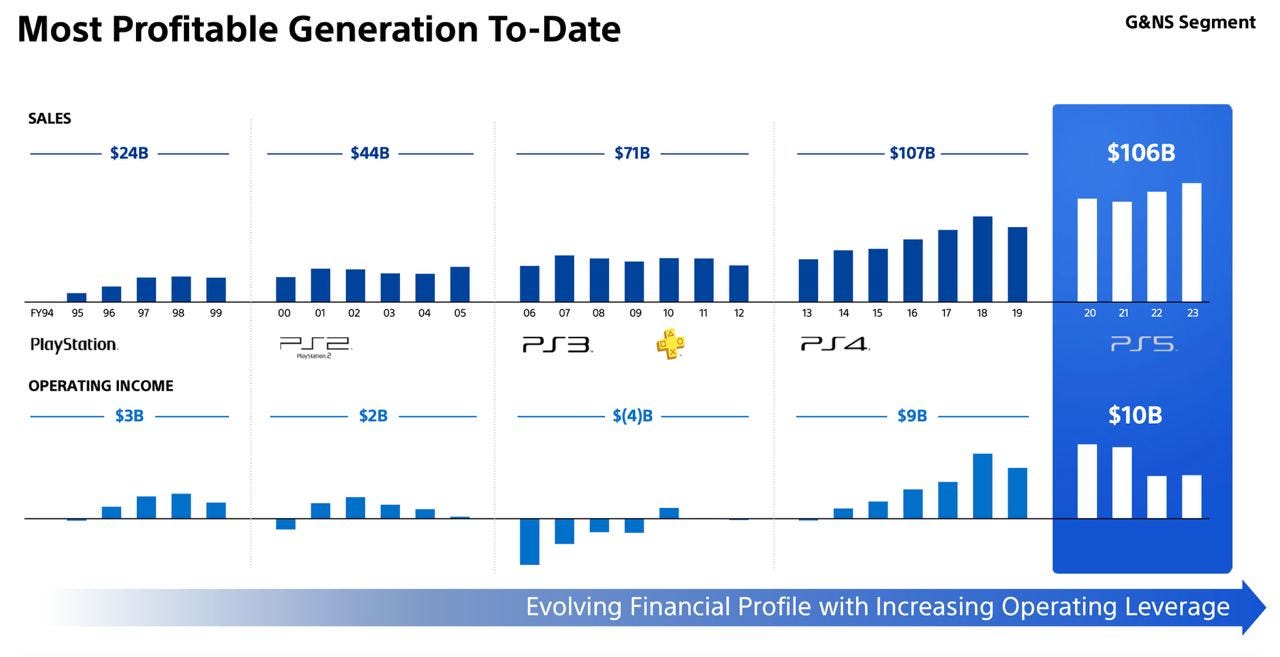
PlayStation 5 is Sony's most profitable console to date. It has already generated $106 billion in revenue (the record is still held by the PS4 at $107 billion), but operating income is already a record $10 billion (compared to $9 billion for the PS4).
-
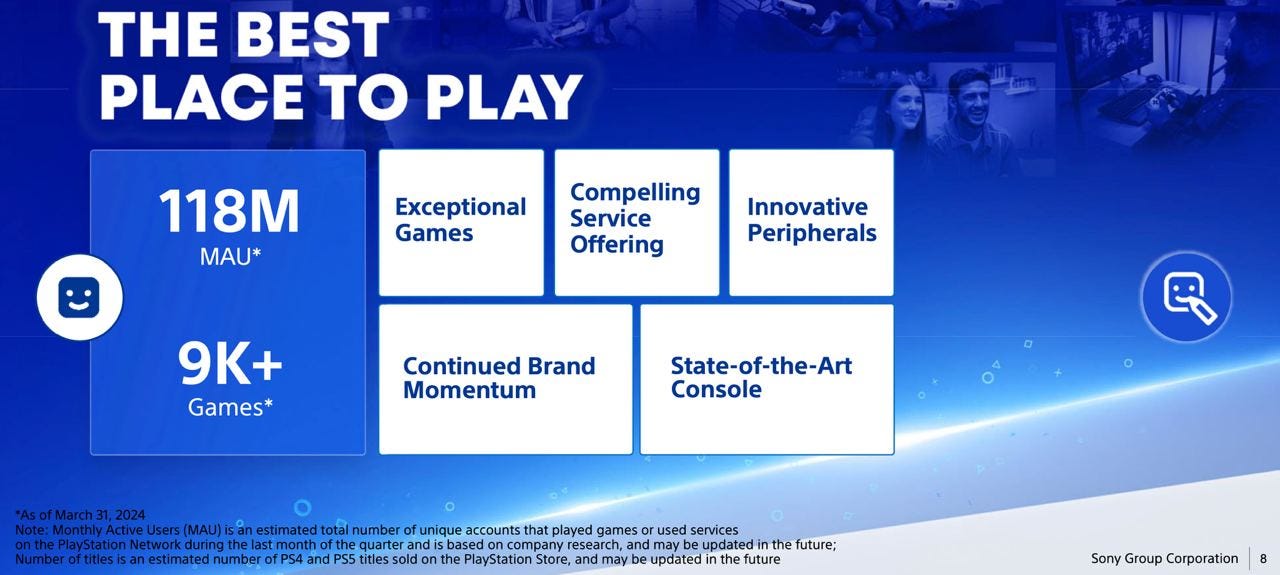
As of March 2024, PlayStation platforms had 118 million MAU (unique accounts are counted).
-
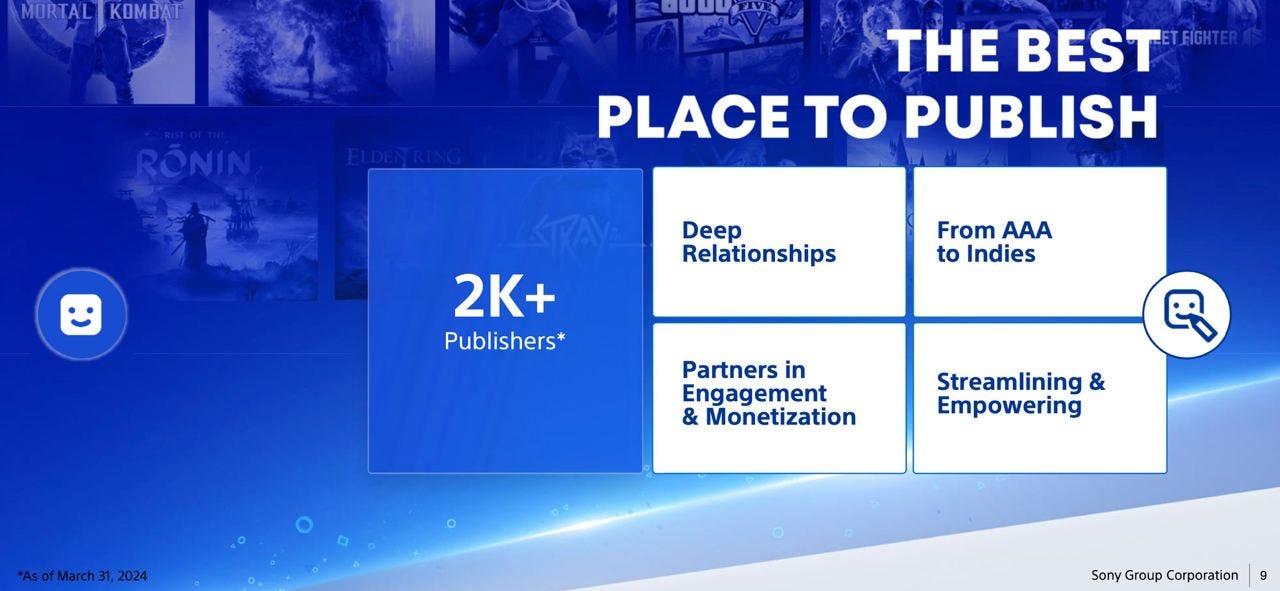
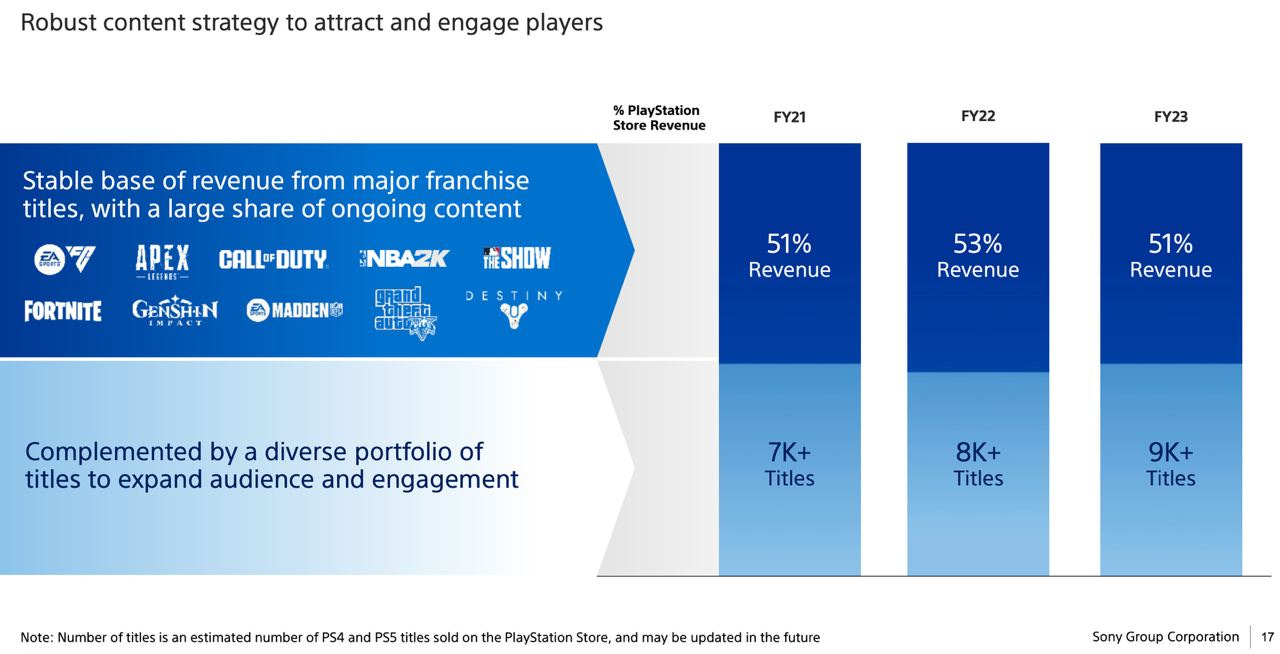
More than 2,000 publishers and 9,000 games are on the platforms as of the end of March 2024.
-
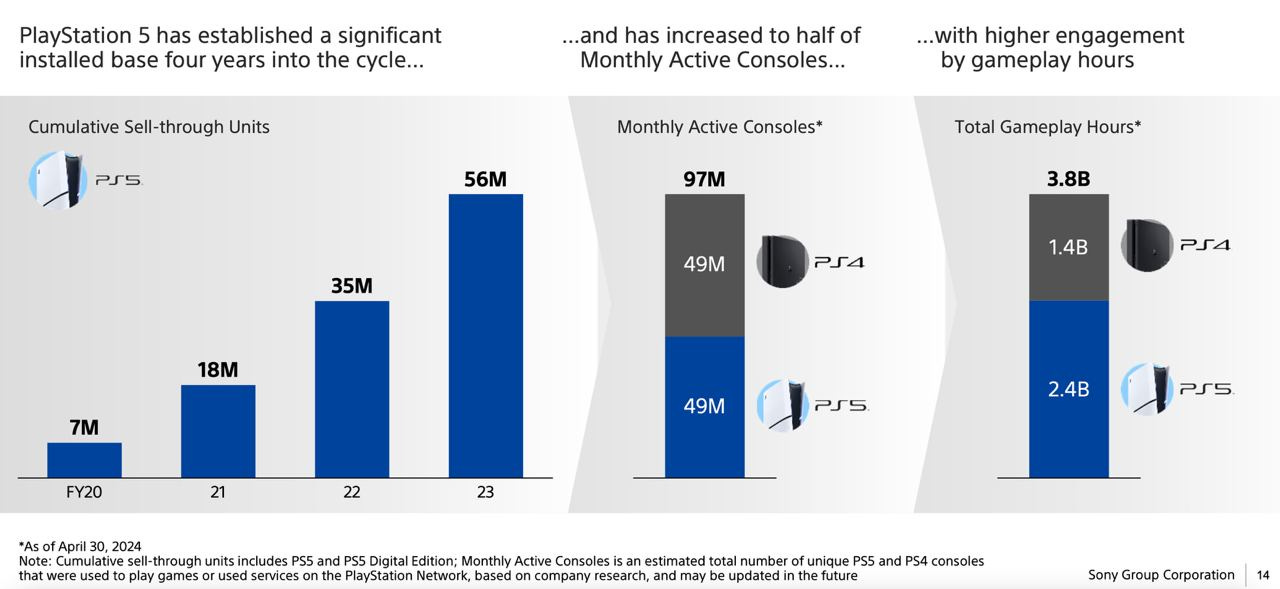
Sony's presentation includes the metric Monthly Active Consoles. According to this statistic, there were 97 million active PlayStation consoles worldwide in April 2024. Half of them are PS5s, and half are PS4s.
-
Of the total number of hours played in April 2024 (3.8 billion), 63% (2.4 billion hours) are on the PlayStation 5. User engagement on the PS5 is significantly higher.
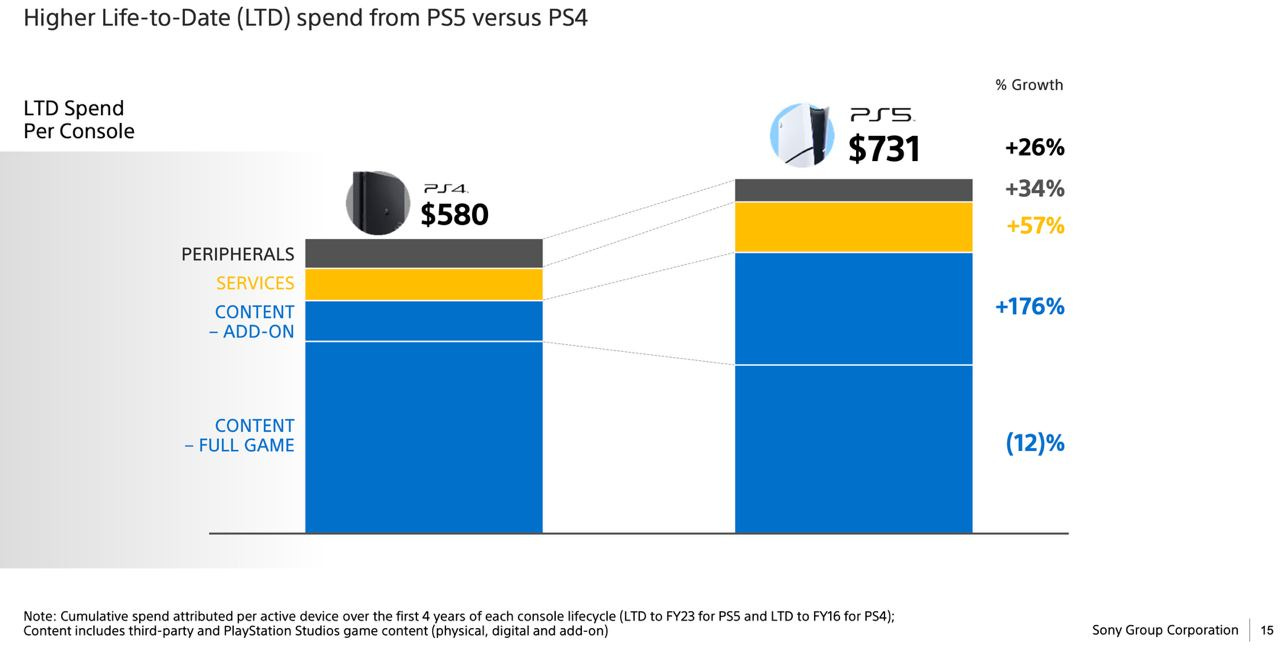
- The cumulative average user spending on the PlayStation 5 over 4 years is $731. This is 26% more than for the same period on the PS4 ($580). Almost all spending segments are growing - in-game purchases (+176%); service spending (+57%); peripheral spending (+34%). Only full game purchases have decreased - they are down 12% compared to the previous generation.
-
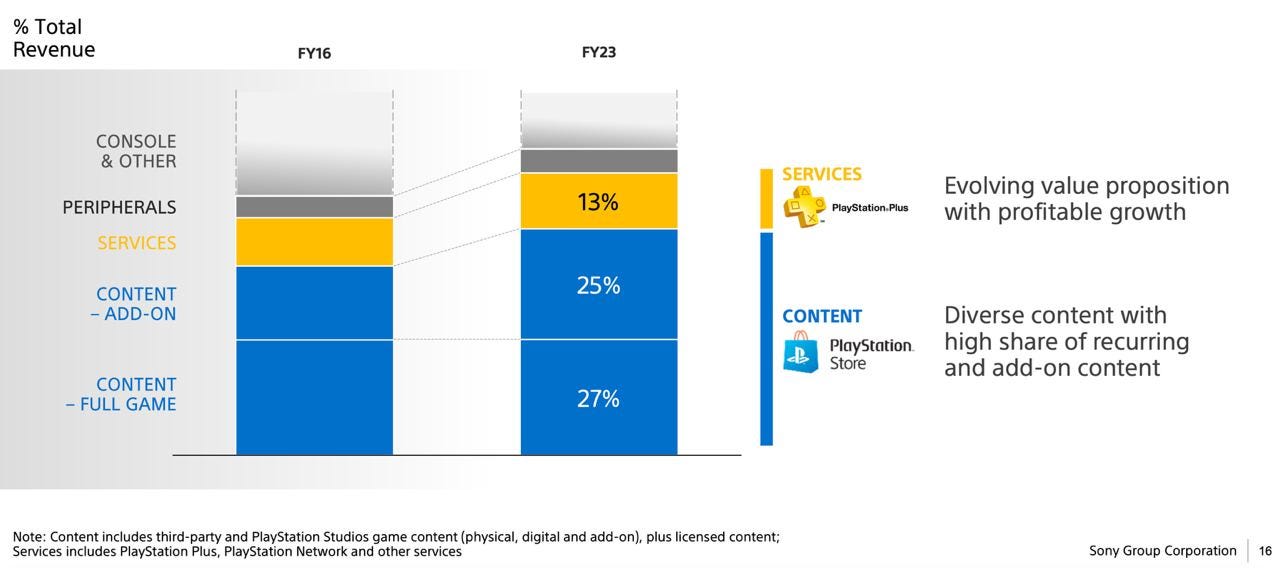
GAAS projects and major annual releases have generated 51-53% of all PlayStation Store revenue for three consecutive fiscal years.
-
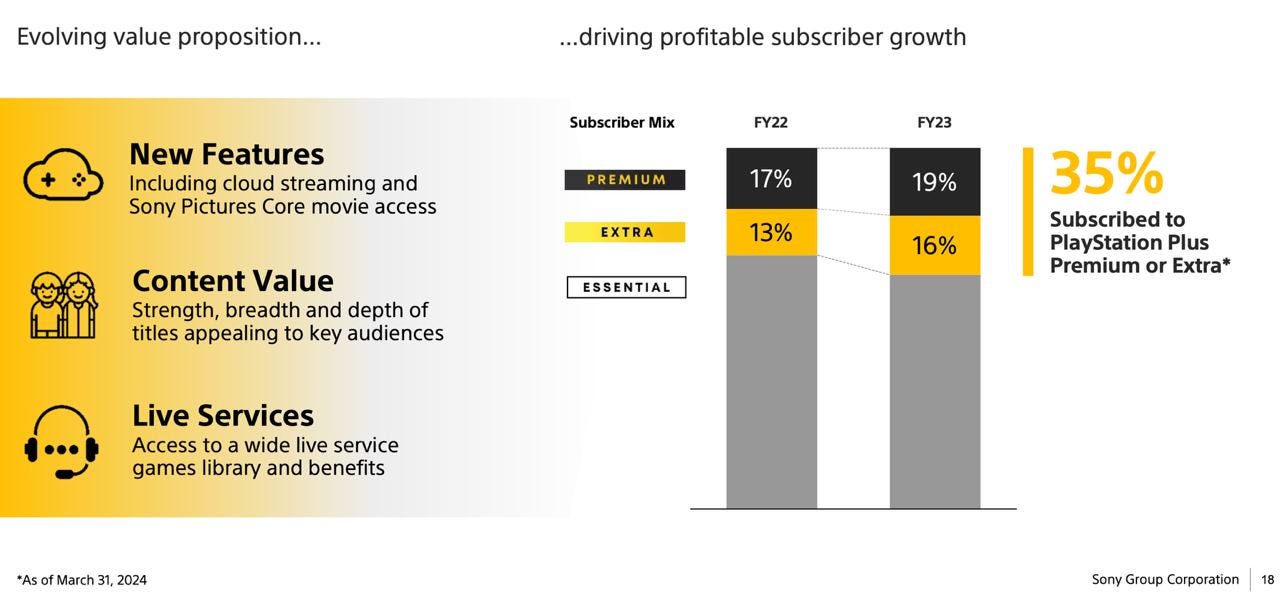
35% of PS Plus subscribers are subscribed to PS Plus Premium (+11% YoY) or Extra (+23% YoY).
-
Sales of Marvel’s Spider-Man 2 reached 11 million copies as of the end of April 2024. Helldivers II sold 12 million copies on PC and consoles as of May 5 this year.
-
The company plans to launch live service games simultaneously on PS5 and PC. Single-player projects will be released on PC with a delay.
Tune in next month for more updates!
In the meantime, you can take a look at our free demo to better understand how devtodev helps game projects grow and increase revenue.

