
Written by: Anastasia Bogapova, Growth Product Manager at devtodev, ex-Lead Product Analyst with 5 years experience in data.
Author’s note: This is the first introductory article on working with a product and improving its metrics. In the future, I will publish a series of articles on how to optimally work with analytics and get the most out of product changes. Stay tuned!
Contents
- Introduction
- Part 1: Analyzing the Current Situation
- Defining key product metrics
- Stagnation Level Analysis
- Identifying the Causes of Metric Decline
- Part 2: Formulating Hypotheses and Conducting Experiments
- Creating Hypotheses and Identifying Growth Points
- Testing Methods and Hypothesis Verification
- Part 3: Implementing Successful Changes and Monitoring
- Analyzing Experiment Results
- Continuous Optimization and Monitoring
- Integrating User Feedback into Analytics
- Conclusion
Introduction
In today's world of digital products and applications, one of the main tasks for any company is to ensure sustainable growth and development. However, it often happens that a product stops growing, which can worry the team and management. It is important to understand why this happened and what steps to take to fix the situation. Analytics plays a key role here, offering tools to identify causes, formulate hypotheses, and test them.
The first step is to see if the product has indeed stopped growing. Comparing current metrics with historical data and forecasts helps identify a slowdown in growth. It is necessary to consider both internal factors, such as changes in the product, and external ones, such as seasonal fluctuations or market changes.
Detailed analysis through analytics helps identify why metrics are dropping and lets us develop hypotheses. Without data, it is almost impossible to correct the situation, as any changes made blindly can lead to even bigger problems. Analytics gives us the full picture and helps us make informed decisions.
We will further discuss how to analyze the current situation, formulate and test hypotheses, and implement successful changes while tracking their results. This approach will help restore product growth and ensure it remains sustainable in the future.
Part 1: Analyzing the Current Situation
Defining Key Product Metrics
First of all, we need to determine the key metrics of the product, such as the North Star Metric, to orientate monitoring of product dynamics. This metric reflects the main value provided to users. The North Star Metric can vary depending on the type of product: for social networks, it may be the number of active users; for games, player retention; for e-commerce, sales volume. Defining the correct metric allows you to focus on the most important aspects of the product.
Just like in any task, it is important to decompose the change to find out which specific stages in the product or factors influenced the decrease in the North Star Metric. For example, if there is a drop in DAU and consequently a revenue decrease in the app, it might be due to a recent price increase (during the test, the average check was increased, but the impact on the North Star Metric was not evaluated, so the feature was rolled out). In this example, we linked the revenue decline to a decrease in DAU and an increase in the average check.
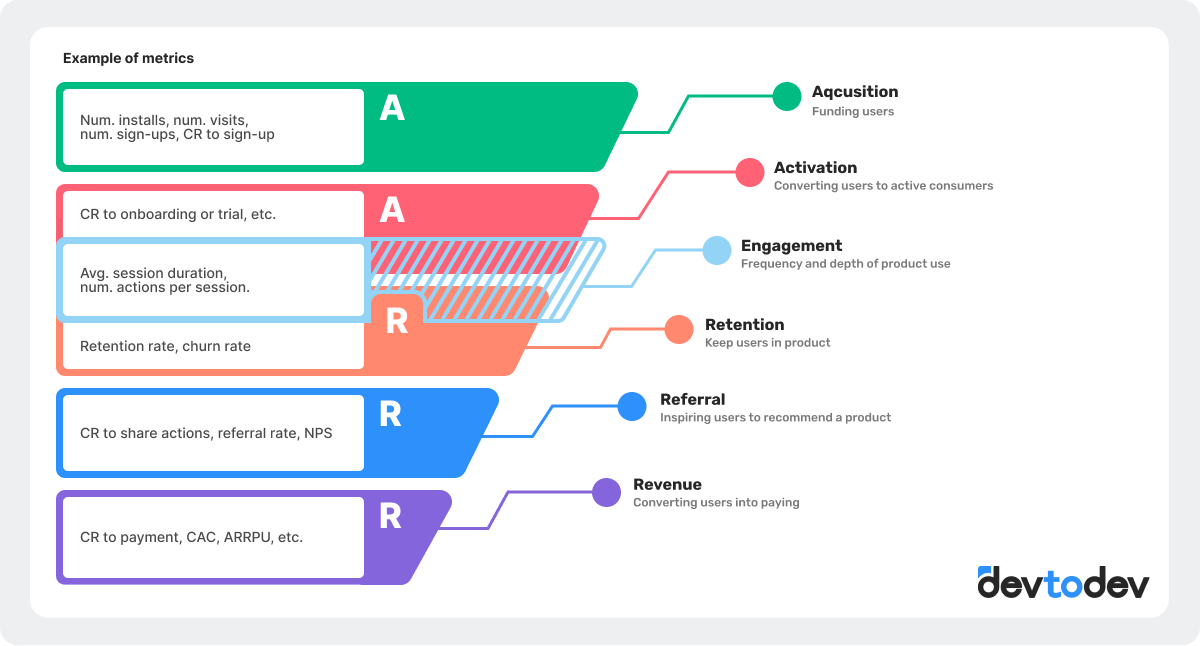
The AARRR model (Acquisition, Activation, Retention, Referral, Revenue) can help in the decomposition of metrics. It aids in understanding at which stage changes occurred. Additionally, using methods like the metrics pyramid or product funnel can be beneficial. The main task is to identify which metrics have changed alongside the key one and to dig down to the root cause. This will enable us to create more effective hypotheses for product growth.
Stagnation Level Analysis
We've identified the metrics to check, but how do we know if the product has really stopped growing?
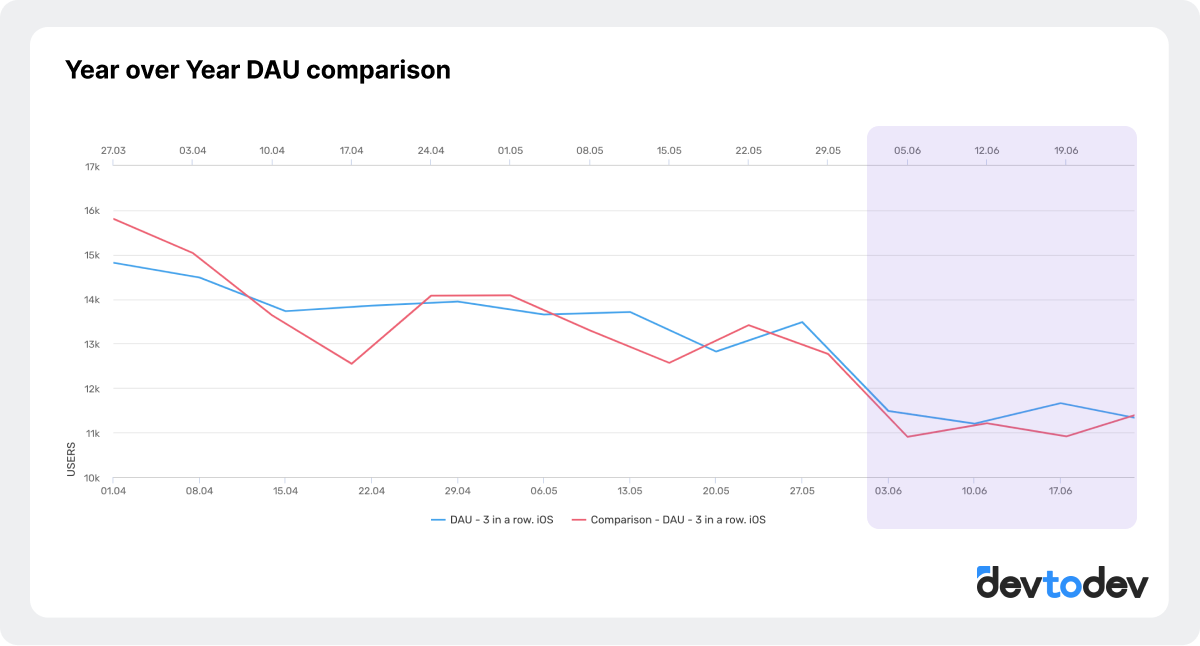
We can figure this out by comparing current indicators with historical data and forecasts. If the actual data is way off from the forecasts or the WoW/YoY indicators (week over week, year over year), this signals potential problems.
💡 Tip: Make sure that the data is collected and processed correctly. For example, if there is no data for certain periods, it can lead to incorrect conclusions about the growth decline. Checking the integrity of the data and their sources will help avoid technical errors.
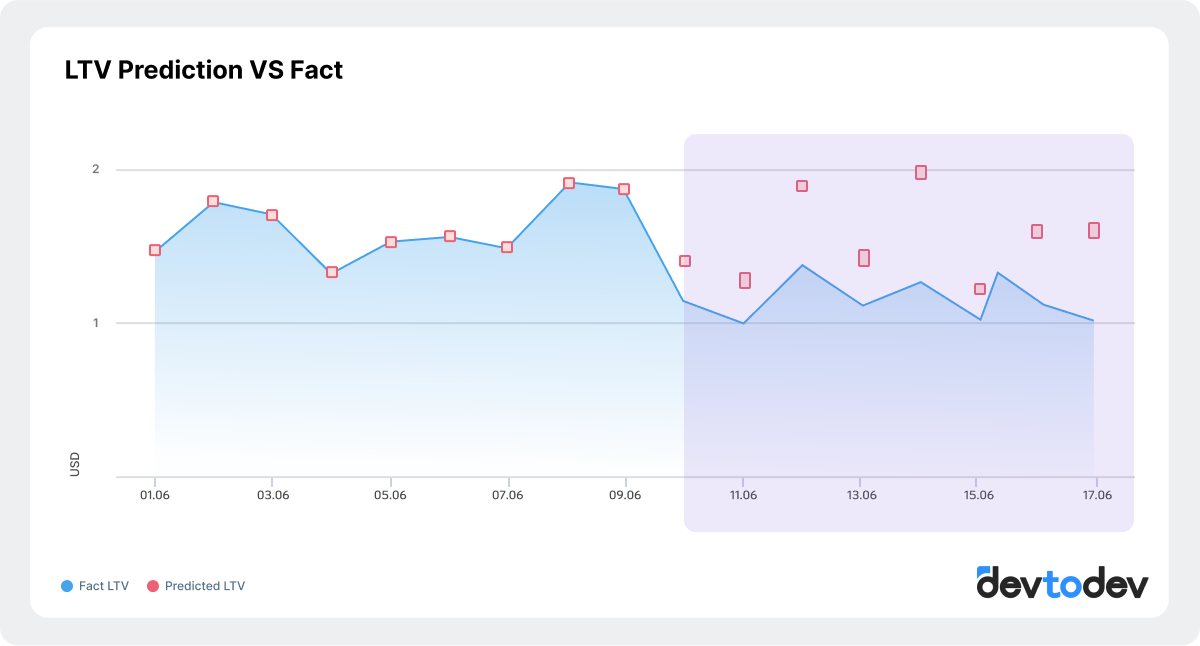
In devtodev, you can observe both actual and forecast values for key product metrics. On the screenshot, you can see that the LTV value has decreased by 14% - this is a reason for a deeper analysis.
Accounting for Seasonal Fluctuations
Seasonal fluctuations are changes in user behavior associated with certain times of the year, holidays, or events; they can significantly affect product performance.
For example, the summer months often see a drop in user activity since many people are on vacation and spend less time on mobile apps. To spot these trends, you can use statistical analysis methods like moving averages or seasonal decompositions, which allow smoothing data and highlighting seasonal components.
More about seasonality - Seasonality Of The Project: Do Not Be Afraid Of Summer Recession
Using these methods helps to more accurately determine the causes of metric changes and make informed decisions about further product development.
Identifying the Causes of Metric Decline
We can use several data analysis methods to figure out why metrics are dropping. Each of these methods helps to reveal different aspects of the problem and offers approaches to solving it.
User Segmentation
By dividing users into groups based on various characteristics like geography, age, or behavior, we can see which group’s activity has dropped. This helps determine which external or internal factors may have influenced specific user groups. Suppose a decline in activity was noticed in one of the regions due to the emergence of a new competitor. Analyzing feedback and behavior of users from this region can confirm that many users are switching to the new app, causing the metric decline.
More about segmentation - Mobile App User Segmentation: Goals And Tips
Cohort Analysis
Cohort analysis allows studying the behavior of users who registered at different times. This helps us understand how changes in the product or marketing strategies affect user retention.
For instance, after introducing a new feature in February, the cohort of users who registered afterward showed low retention. This may indicate that the new feature was not perceived well by users, and it requires improvement or additional user training.
More about cohort analysis - App Cohort Analysis
Funnel Analysis
Analyzing the user journey from the first interaction point to the final action (e.g., purchase) helps identify where users drop off. This helps accurately determine bottlenecks in the interaction process with the product.
Suppose we are interested in the number of registrations. We identified the steps users go through for a successful registration: filling out registration form fields, entering a phone number, receiving an SMS, and entering the confirmation code. Our analysis showed that the average conversion rate for filling out the registration form fields is 70%. However, the conversion rate for the next step ‘receiving the SMS and entering the code’ is only 30%. Most users who start the registration process do not complete it due to issues with receiving the confirmation code. Reviewing the SMS sending process, refactoring, or adding alternative verification methods could significantly improve the conversion rate and the number of new users.
These analysis methods help to understand the reasons for metric decline more deeply and offer specific ways to improve the product and user experience.
Creating Hypotheses and Identifying Growth Points
Creating hypotheses is a key step in getting product growth back on track. Hypotheses can be formulated based on identified problems and assumed causes. There are different frameworks to help evaluate the priority and impact of these hypotheses:
-
ICE: Evaluation of hypotheses by Impact, Confidence, and Ease. This method helps quickly rank hypotheses by significance and feasibility. Example: a hypothesis that simplifying the registration process will increase conversion can be assessed as highly probable and easy to implement.
-
RICE: An extended version of ICE, including another parameter – Reach. This allows considering how many users will be affected by the proposed changes. Example: a hypothesis about adding a new feature may have a high reach if it is important for all application users.
-
PIE: Evaluation of hypotheses by Potential, Importance, and Ease. Suitable for quickly ranking multiple ideas. Example: a hypothesis about launching a new marketing campaign may have high potential and importance but be difficult to implement.
-
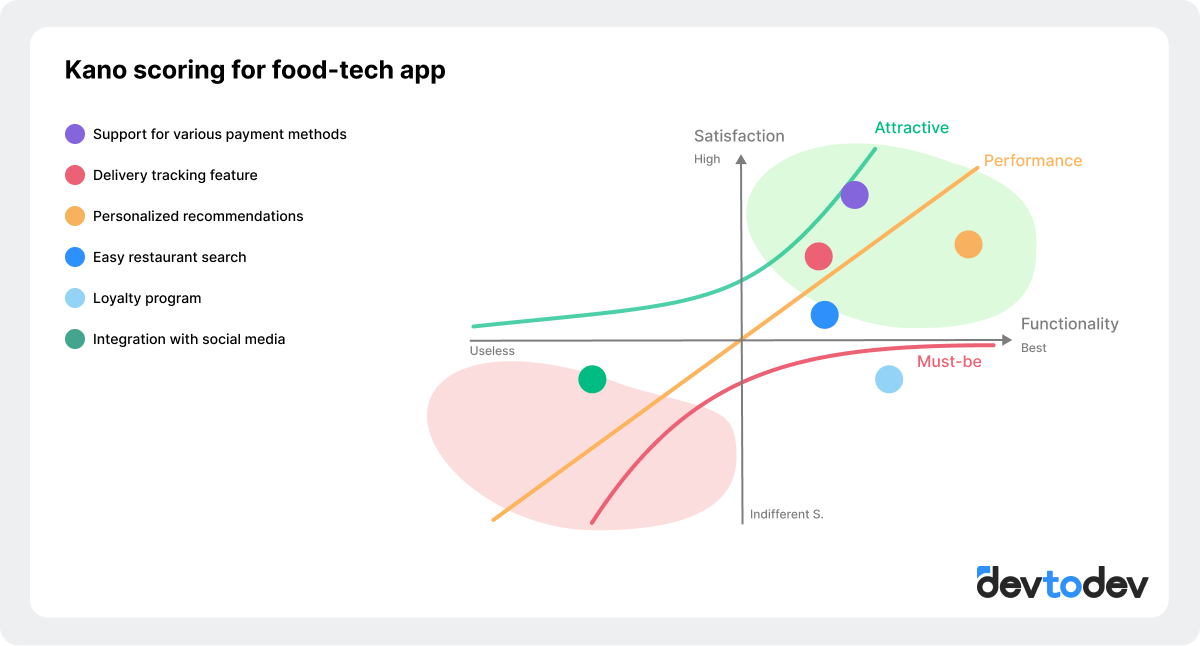
Kano: A model used to evaluate the impact of different features on user satisfaction. It helps understand which features are basic expectations and which are additional, increasing loyalty. Example: basic features should be implemented first, and additional ones can be added to increase user satisfaction.
Testing Methods and Hypothesis Verification
Hypothesis testing can include the following methods:
- Deep dive analysis: Detailed study of data and detailed reports to identify causes and confirm hypotheses. This method requires time and analytical skills but provides detailed insights. Example: deep analysis of user behavior data may reveal that activity decline is associated with changes in the application interface.
- A/B testing: Dividing users into two groups, one of which receives the new change and the other does not. This allows comparing user behavior and assessing the impact of the change. It is important to follow A/B testing rules, such as choosing a sufficient sample size and considering possible external factors.
More about A/B testing - A/B Testing in LiveOps.
- Customer development: Conducting interviews with users and testing prototypes. This method helps understand how users perceive changes and what problems they experience. Example: interviews with users who stopped using the application may reveal specific reasons for their dissatisfaction.
-
Quantitative user surveys: Collecting data through surveys to identify the opinions of a large number of users about the proposed changes. This helps get a quantitative assessment of hypotheses. Example: a user survey about which features they consider most important and what they lack in the current app version.
If you want to delve deeper into the methods of statistical analysis for tests, check this article: Statistics - Sampling, Variables, Design.
Part 3: Implementing Successful Changes and Monitoring
Analyzing Experiment Results
After testing a hypothesis, it's important to interpret the results correctly to avoid wrong conclusions. The quality of test results can be influenced by the conditions under which the test was conducted. Make sure to consider several factors to ensure the test outcomes are objective and that the effect seen during testing matches what happens after the release to all users.
To accurately assess potential growth after release, consider:
-
User segmentation: Segment analysis helps understand how different groups react to changes (e.g., newcomers vs. experienced users, or users from different countries).
-
Test group size: The test group should be large enough for the results to be representative and not distorted by extreme values.
-
Context and external factors: Results can be temporary and depend on current conditions (e.g., holidays, marketing campaigns).
-
Test duration: Conducting the test for a sufficient time helps smooth out short-term fluctuations and accounts for behavioral variations at different times of day or week.
Narrowly conducted tests often lead to incorrect product growth forecasts. For example, you might expect a 5% revenue impact because the test group showed a 5% metric increase, but this assumption can be misleading. The uplift observed during testing might not equal the final increase post-release.
Proper analysis and interpretation of results help avoid overestimating effects and more accurately predict the impact of changes on the entire product, improving decision quality and minimizing risks when implementing innovations.
Continuous Optimization and Monitoring
Continuous monitoring of metrics and setting up an alert system help respond promptly to any changes in user activity. Quickly identifying metric drops is crucial as it is much harder to regain users who had a negative experience. The faster you can detect a problem and take action, the less negative impact it will have on the product.
In applications at the growth stage with active feature expansion, the quality of testing may decrease, and unforeseen usage scenarios may arise. For example, you may not have considered that users in your app could use the promo code system for fraud, leading to an increase in promo code activation errors. A quick response from the developers helped fix the functionality gaps, block fraudulent users, retain regular users, and maintain their loyalty, avoiding a wave of negativity.
If you are developing a mobile application, it is important to test new features through A/B testing and launch them after successful trials using an A/B platform or other feature toggle management tools. This approach allows you to quickly disable or change the configuration of a feature during its implementation, without waiting for store reviews and version rollouts.
Integrating User Feedback Into Analytics
Integrating user feedback into analytics helps get a complete picture of how changes affect user experience. This includes collecting reviews, analyzing social media and forums, and monitoring ratings and reviews in the App Store and Google Play. Analyzing user reviews after updating the application can show which changes users liked and which caused a negative reaction.
Monitoring discussions on social media and specialized forums helps identify trends and general user sentiments.
Conclusion
To sum up, analyzing and generating hypotheses for product growth involves multiple stages and requires a good understanding of the product and analytical methods. It's usually a team effort because navigating all these stages alone can be tough. devtodev offers solutions to make teamwork more effective: you can create flexible reports, quickly add new data, comment on dashboards, and add notes to data for quick problem-solving. The built-in tools for analyzing A/B tests help in concluding hypothesis checks. Plus, our integrated alerting system and the option to regularly send reports to messengers will help you quickly identify future problems. If you need help setting this up, check out our documentation or drop us an email at info@devtodev.com.


: The Basics")
: The Basics")


 in Mobile Games")
 in Mobile Games")


")
")


")
")


")
")


 Tactics for Mobile Games")
 Tactics for Mobile Games")


