
Devtodev is helping you keep in touch with what’s happening in the game market. Every month we publish an overview of reports on the most popular games worldwide, top-grossing games, successful releases, favorite video game types, trends, etc. This overview was prepared by Dmitriy Byshonkov, the author of the GameDev Reports by the devtodev Telegram channel. You can also read the June and July reports.
Contents
- Sensor Tower: Mobile Gaming Market in 2024 & beyond
- Newzoo: Top-20 PC/Console Games of June 2024 by Revenue and MAU
- Newzoo: PC/console games performance in Q2'24
- GameDiscoverCo: In which countries do owners of successful games on Steam live
- Niko Partners: The Gaming Markets of South Korea and Japan Grew to $30.1 Billion in 2023
- AppMagic: Top Mobile Games by Revenue and Downloads in July 2024
- Circana: The US Gaming Market in June 2024
- Games & Numbers (July 24 - August 6)
- Sensor Tower: Mobile Market in Q2 2024
- Mistplay: The Influence of social factors on the mobile gaming audience
- Amir Satvat: The situation with layoffs in the Gaming market is improving
- Singular: Mobile Market Trends in Q2'24
- Newzoo: Gaming Market in 2024 and beyond
- GSD & GfK: The UK PC/Console Market Declined Slightly Again in July
- Famitsu: Physical sales of console games in Japan in July 2024
- SocialPeta & Tenjin: Mobile Marketing in H1'24
- GSD & GfK: Sales of PC/Console Games in Europe suddenly rose in July 2024
- Games & Numbers (August 7 - August 23)
- Circana: The US Gaming Market grew by 10% in July 2024
- Stream Hatchet: Gaming Streaming Market in Q2'24
- GameDiscoverCo: Top-Grossing Games on Steam in H1'24
- GameRefinery: Key Mobile Game Updates for July 2024
- Omdia: Gaming Accessories market reached $10.1B in 2024
- AppsFlyer: The Mobile Gaming Market in 2024
Sensor Tower: Mobile Gaming Market in 2024 & beyond
All revenue figures are gross, including platform commissions.
Overall State of the Mobile Gaming Market
- In 2023, IAP revenue from mobile games decreased to $76.7 billion (-2% YoY). The market has been declining since 2021, but it is still 22% higher than pre-pandemic 2019.
- Sensor Tower expects growth in 2024, with revenues reaching $78 billion (+1.6% YoY). By 2028, mobile game revenues are expected to exceed $100 billion, with a compound annual growth rate of 6.8%.
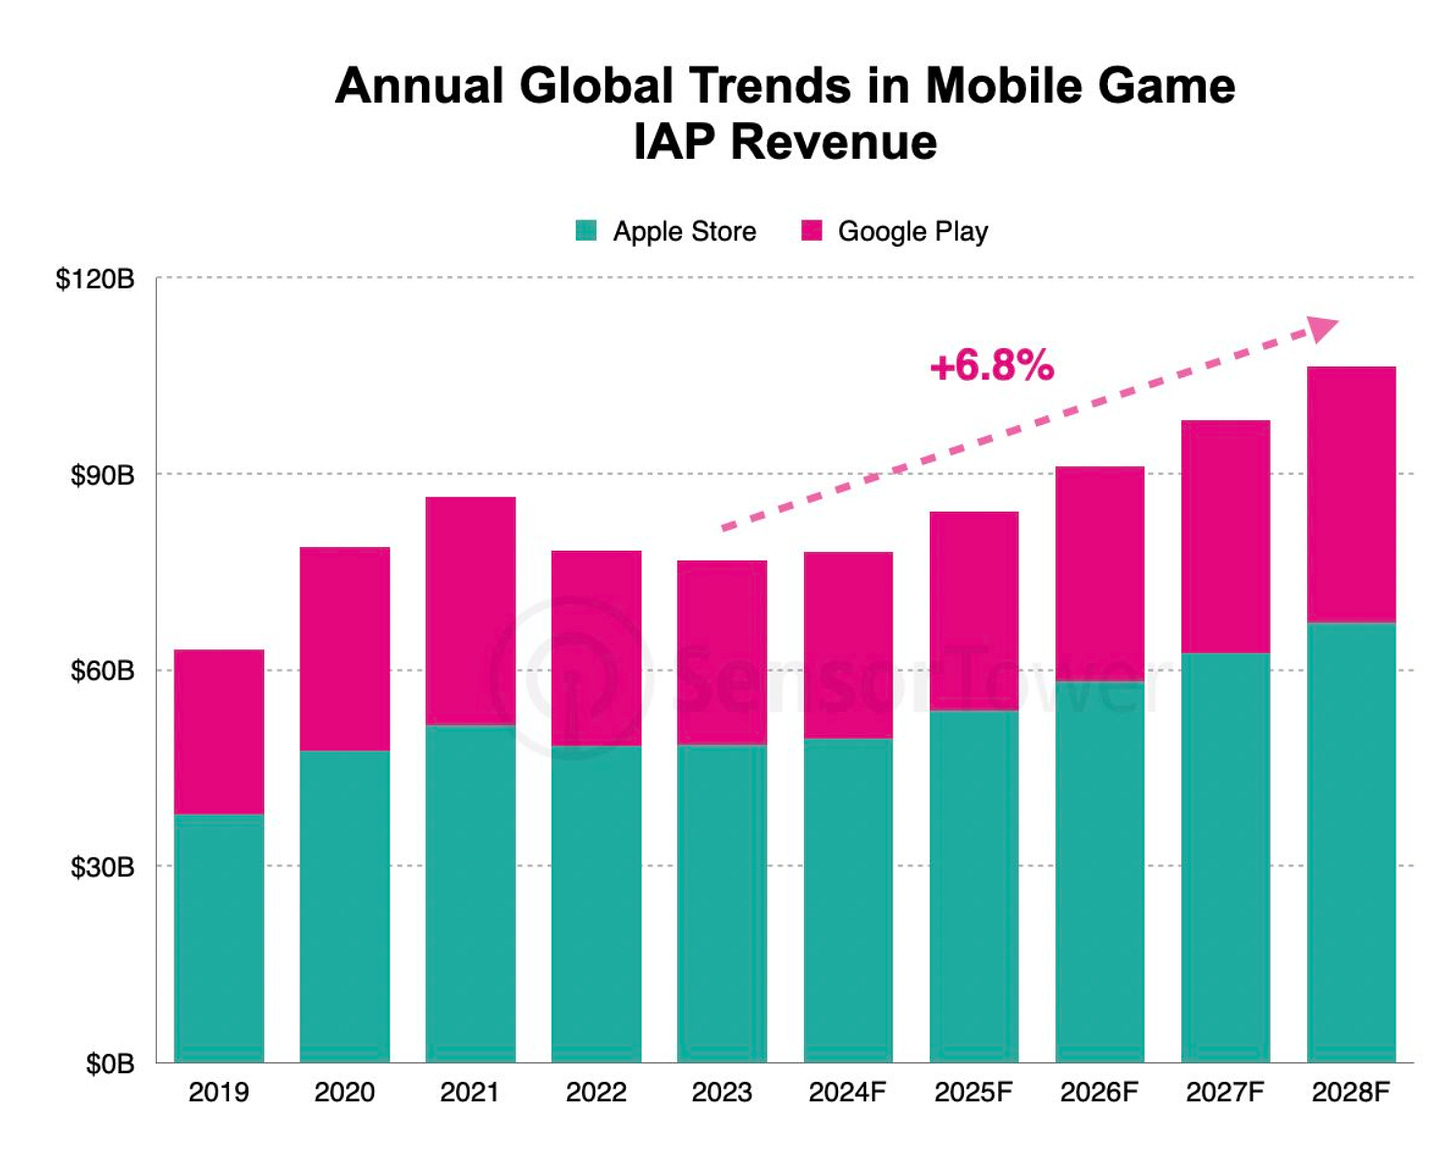
- The USA remains the largest market by IAP revenue, with Americans spending $22.2 billion on in-game purchases in 2023, which is plateaued compared to 2022 but 38% higher than in 2019. By 2028, IAP revenue in the USA is expected to reach $33.5 billion.
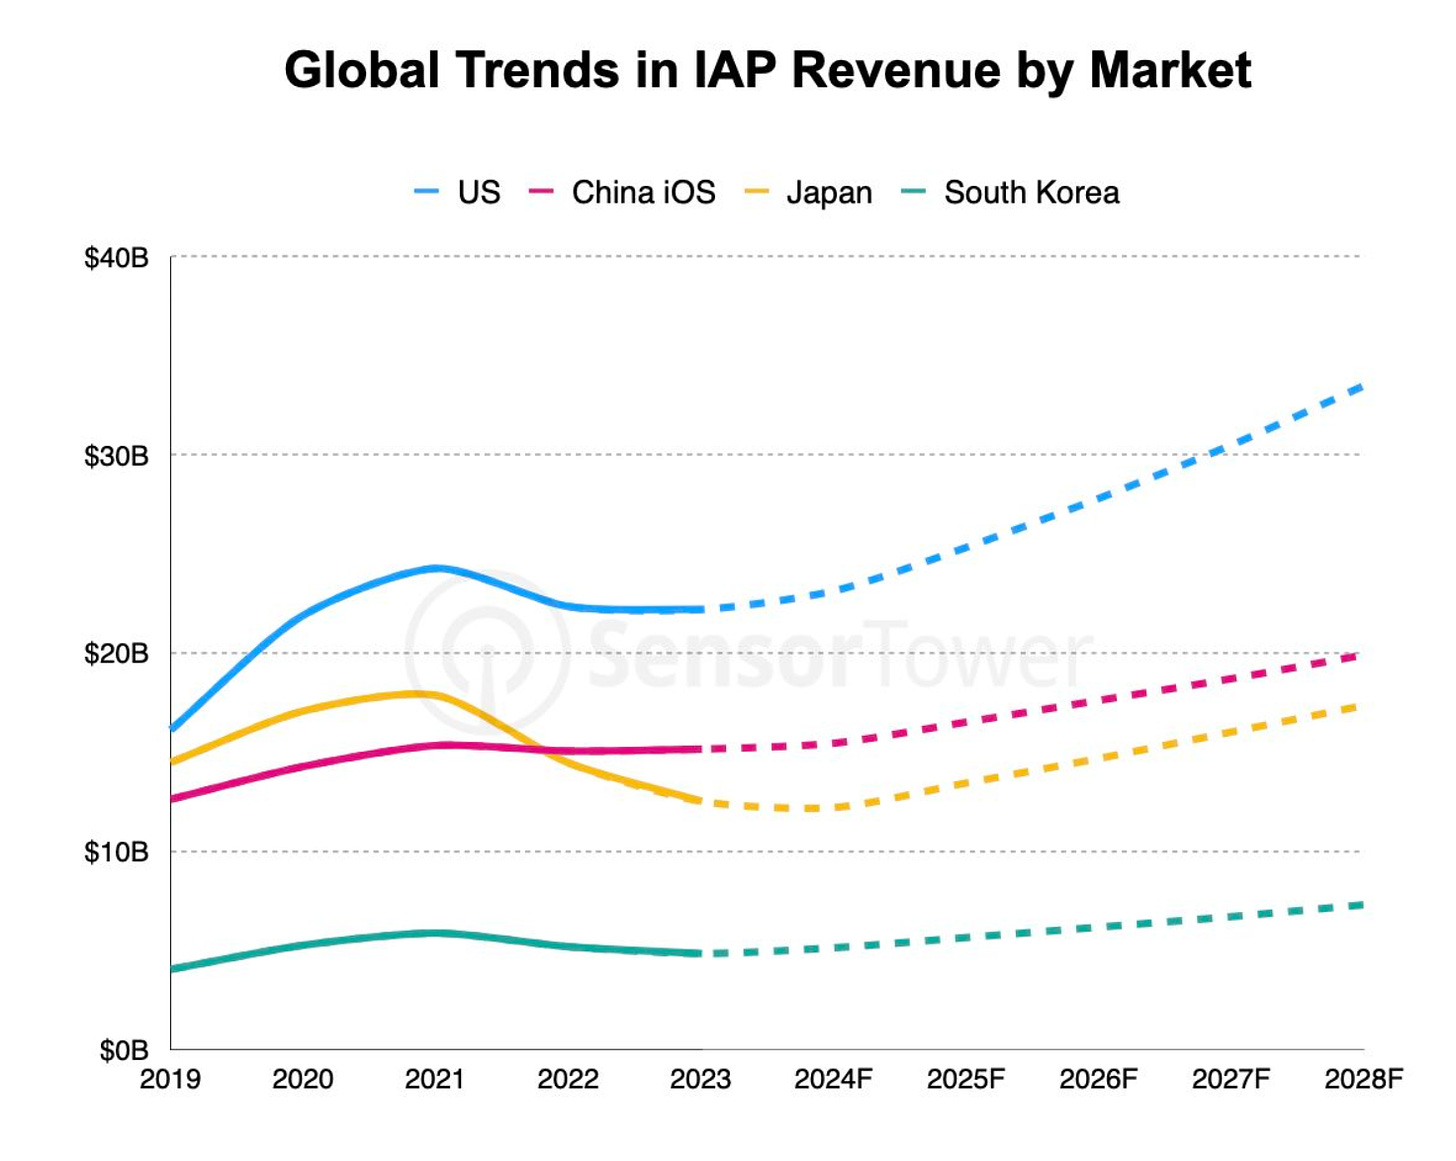
- In 2022 and 2023, IAP revenue from iOS games in China amounted to $15.1 billion.
❗️Sensor Tower does not account for revenue from Android stores in China. In reality, the Chinese market is likely larger than the American one.
- In 2023, IAP revenue in Japan fell to $12.5 billion (-13% YoY); in South Korea, it dropped by 7% to $4.8 billion.
❗️Sensor Tower also does not consider payments outside of platforms.
- Sensor Tower forecasts that all key mobile markets will grow over the next five years.
- Honor of Kings retained the top spot in revenue over MONOPOLY GO! in 2023. The game has earned over $15.5 billion in its lifetime, with over 99% of that amount coming from China. The fastest-growing projects are MONOPOLY GO!, Honkai: Star Rail, and Royal Match.
Genres
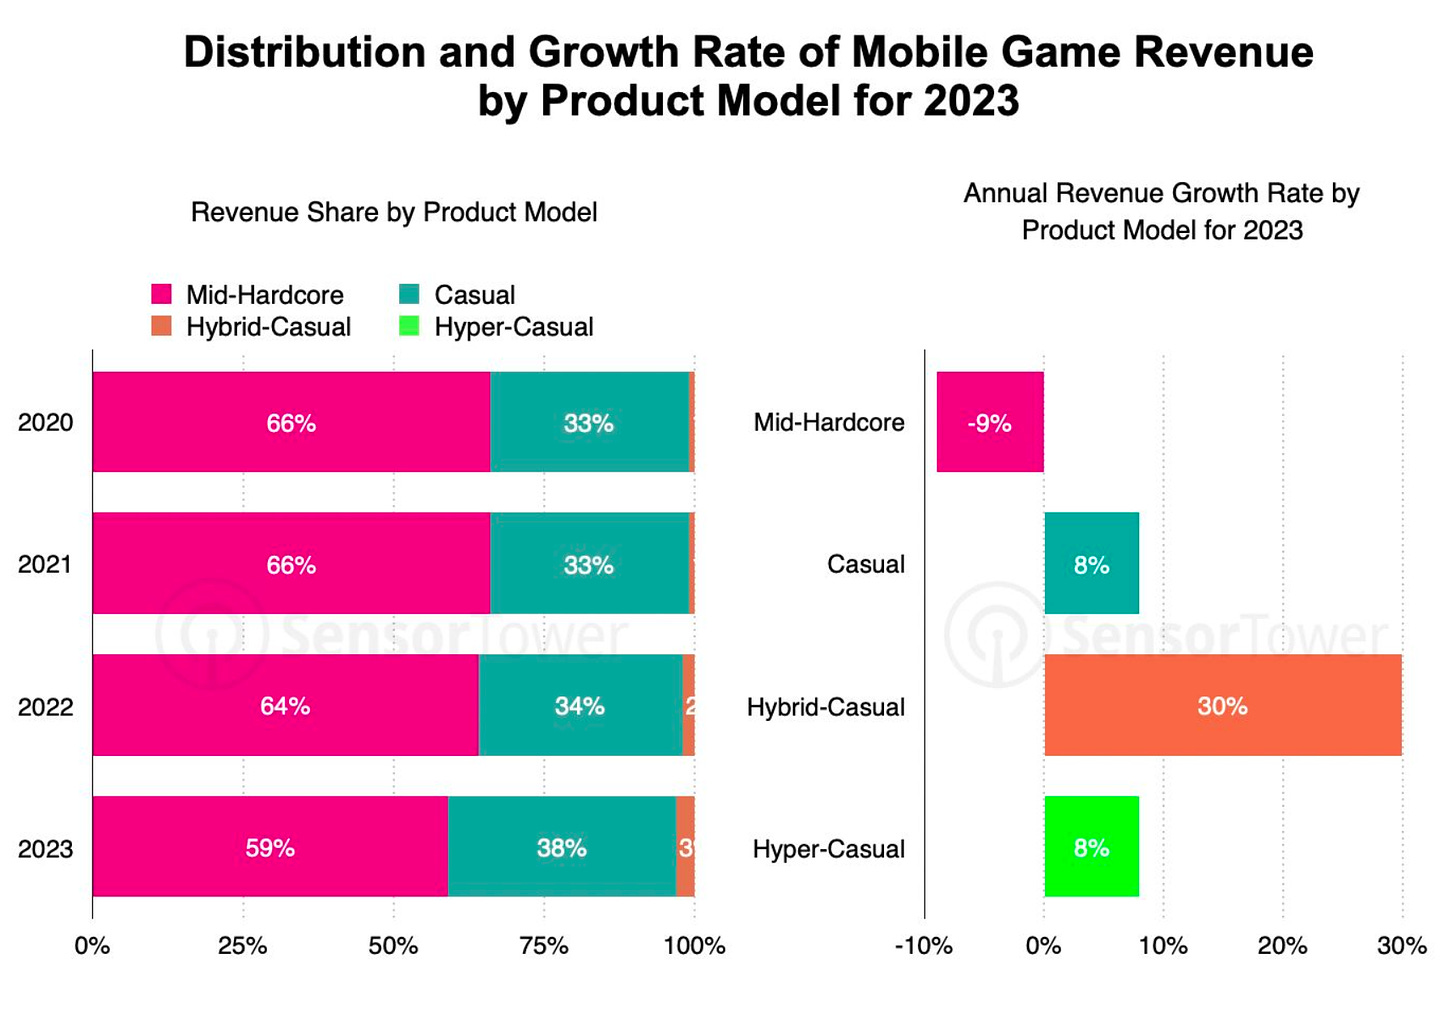
- Revenue from casual games grew by 8% in 2023, reaching $28.6 billion. This accounts for 38% of the total market volume.
- Hybrid-casual games grew by 30% in 2023, reaching $2.1 billion.
- The share of mid-core game revenue has been declining over the years. In 2020, they accounted for 66% of the market, but by 2023, this had fallen to 59%. Revenue decreased by 9% in 2023, while all other categories grew. Hyper-casual projects grew by 8%.
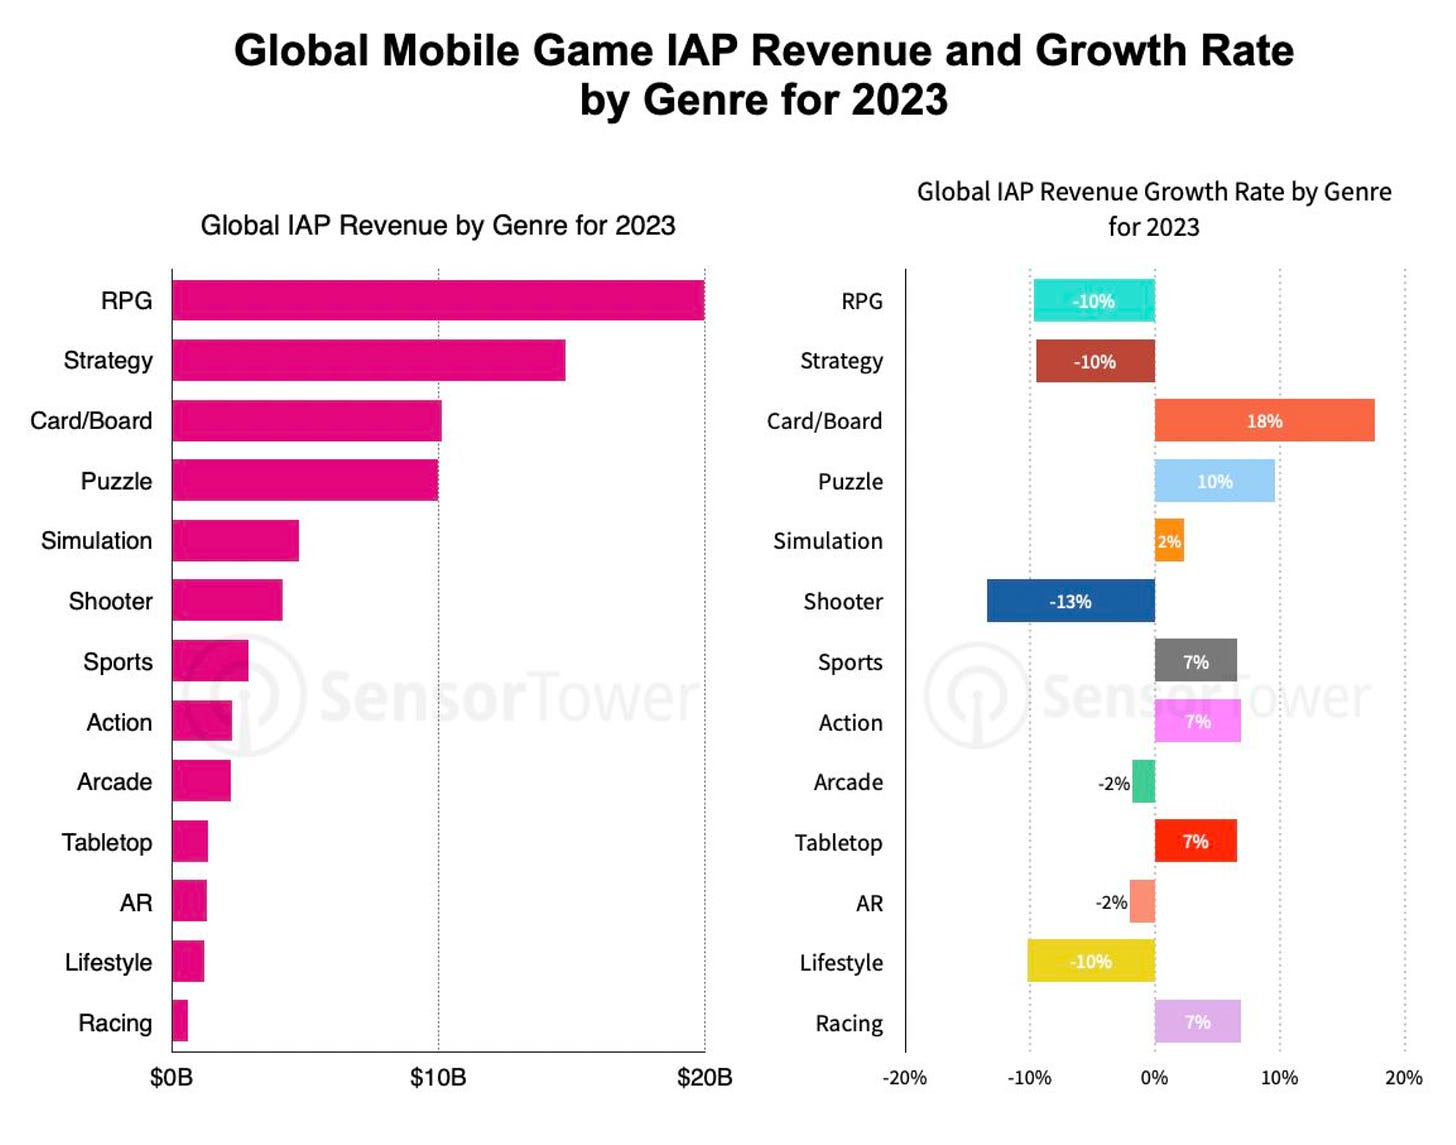
- The strongest growth was seen in card/board games, which grew by 18% (thanks to the success of MONOPOLY GO!); puzzle games showed significant growth (+10% YoY), largely due to the success of Royal Match.
- Revenue from action games, sports games, racing games, and tabletop games grew by 7%.
- The biggest declines were seen in shooters (-13% YoY); lifestyle projects (-11% YoY); RPGs (-10% YoY); and strategy games (-10% YoY).
Mobile Gaming Trends
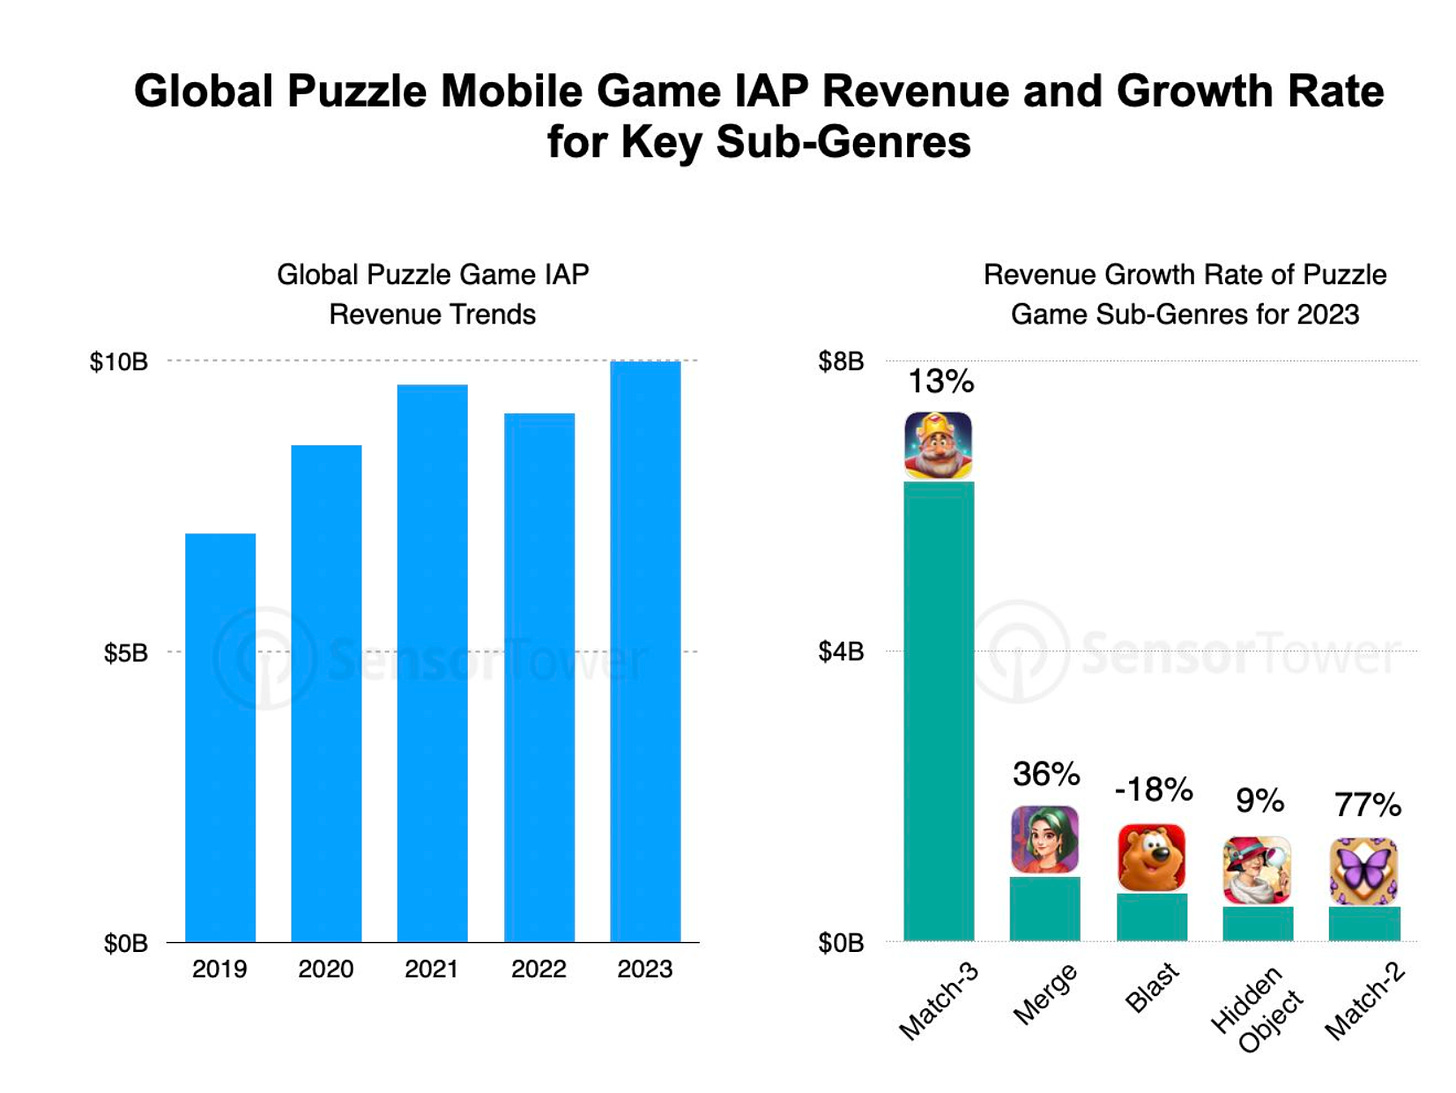
- In 2023, puzzles earned more than $10 billion from IAP purchases for the first time. The strongest growth was in Match-2 projects (+77% YoY); merge games (+36% YoY); Match-3 (+13% YoY); and hidden object games (+9% YoY). Only the blast games segment fell (-18% YoY).
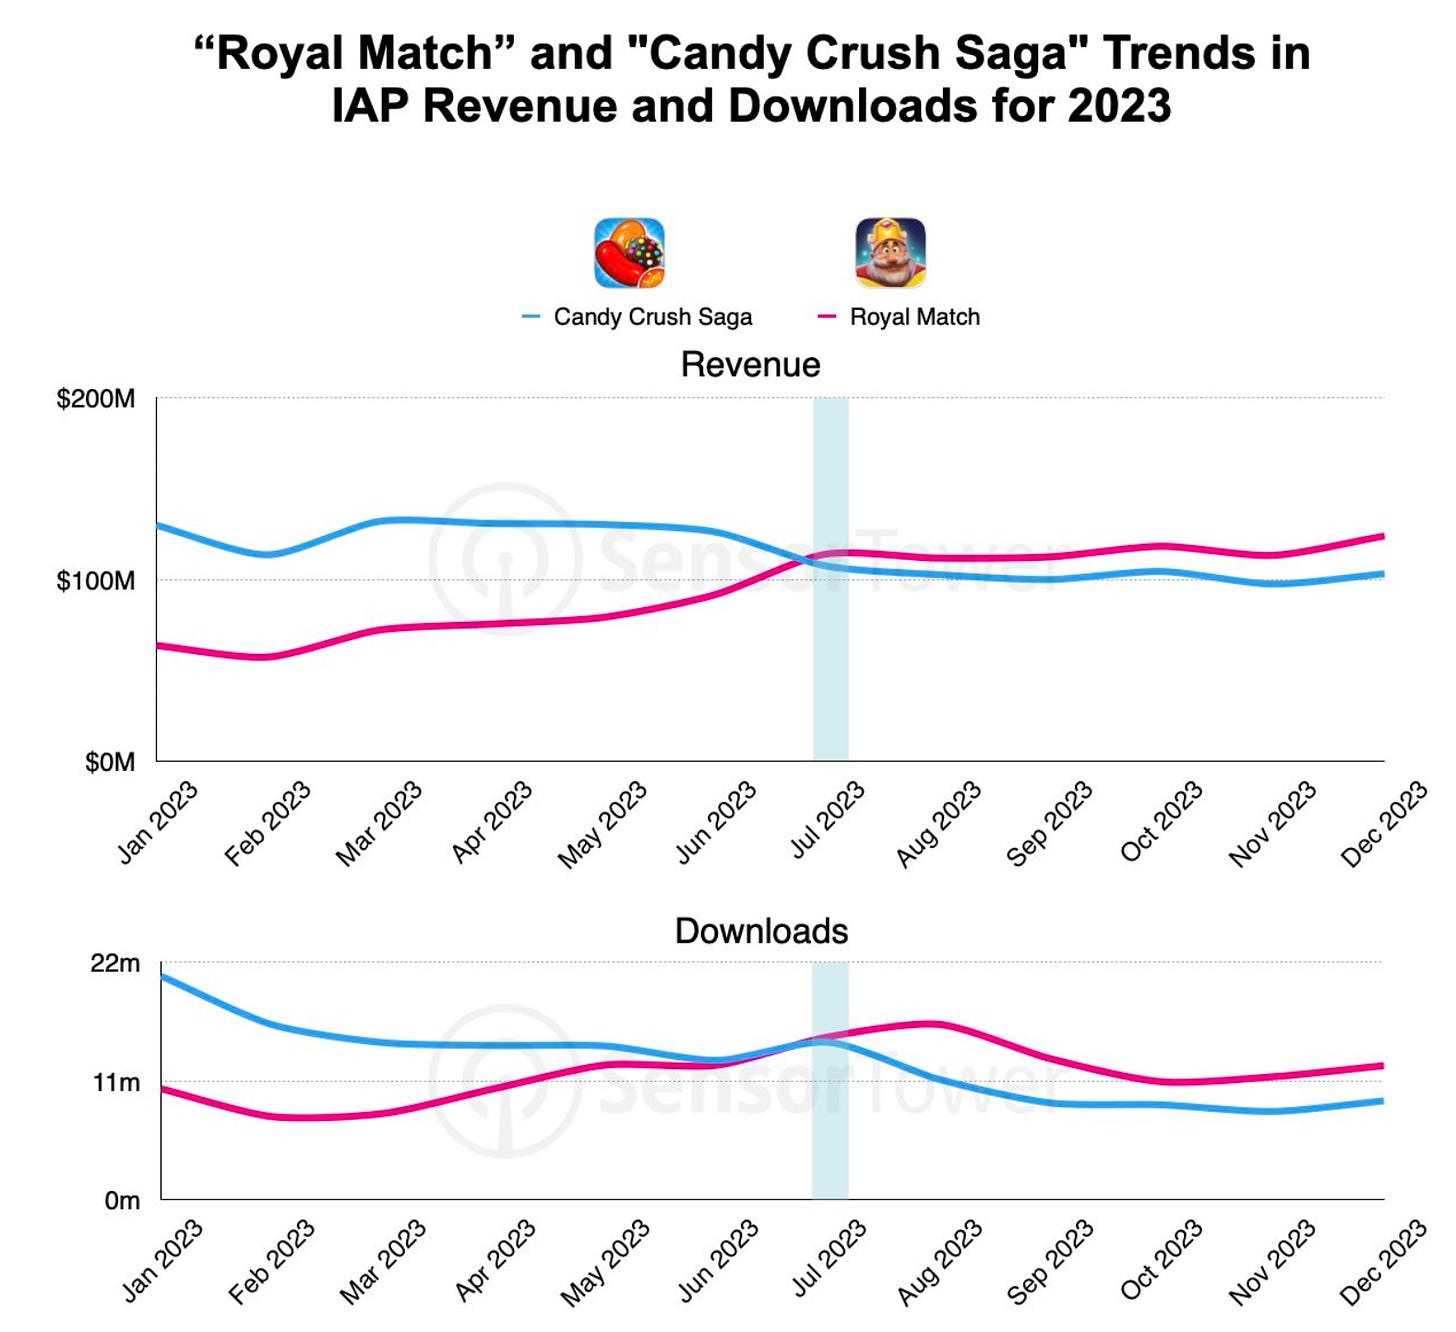
- Royal Match surpassed Candy Crush Saga in revenue for the first time in 2023. Since June-July 2023, the game has also been leading in downloads.
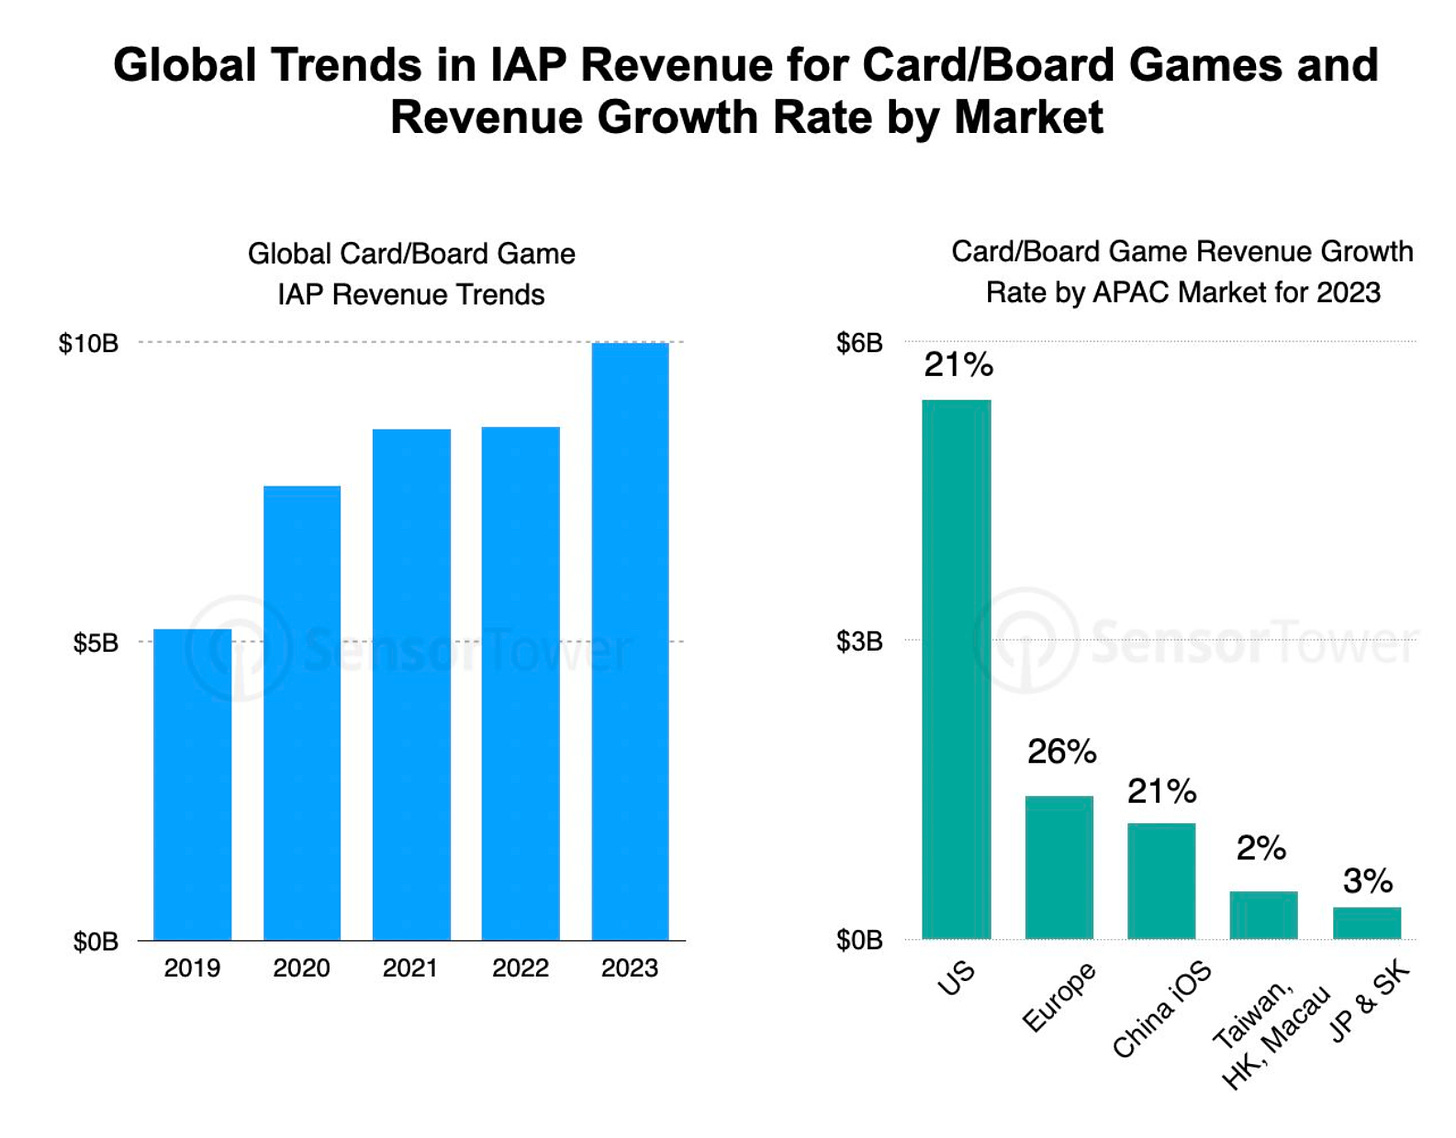
- MONOPOLY GO! boosted the board games segment, with the project's success allowing the genre to grow by 18% in 2023. In the USA, the genre grew by 21% YoY. The USA's share of the board games segment is 54%.
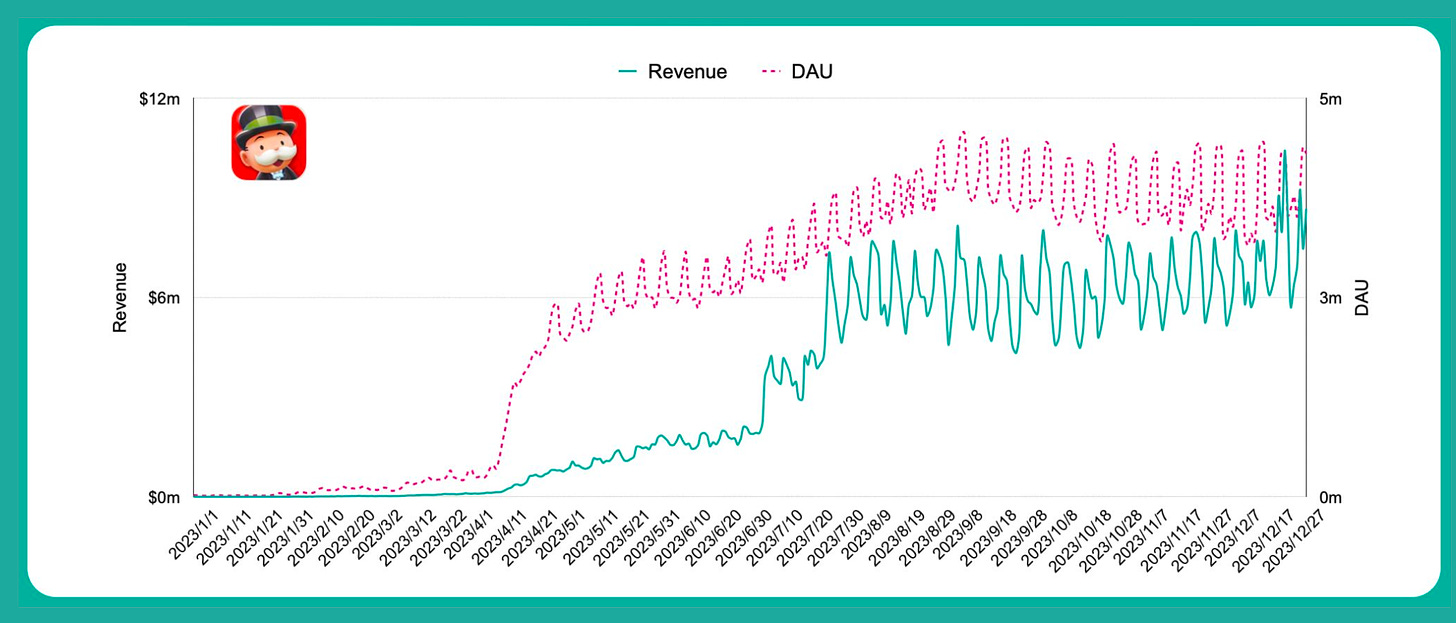
- According to Sensor Tower, MONOPOLY GO! earned more than $1.2 billion from in-game purchases in 2023, with the project's MAU exceeding 17 million people.
❗️Hasbro recently reported that the game surpassed the $3 billion mark.
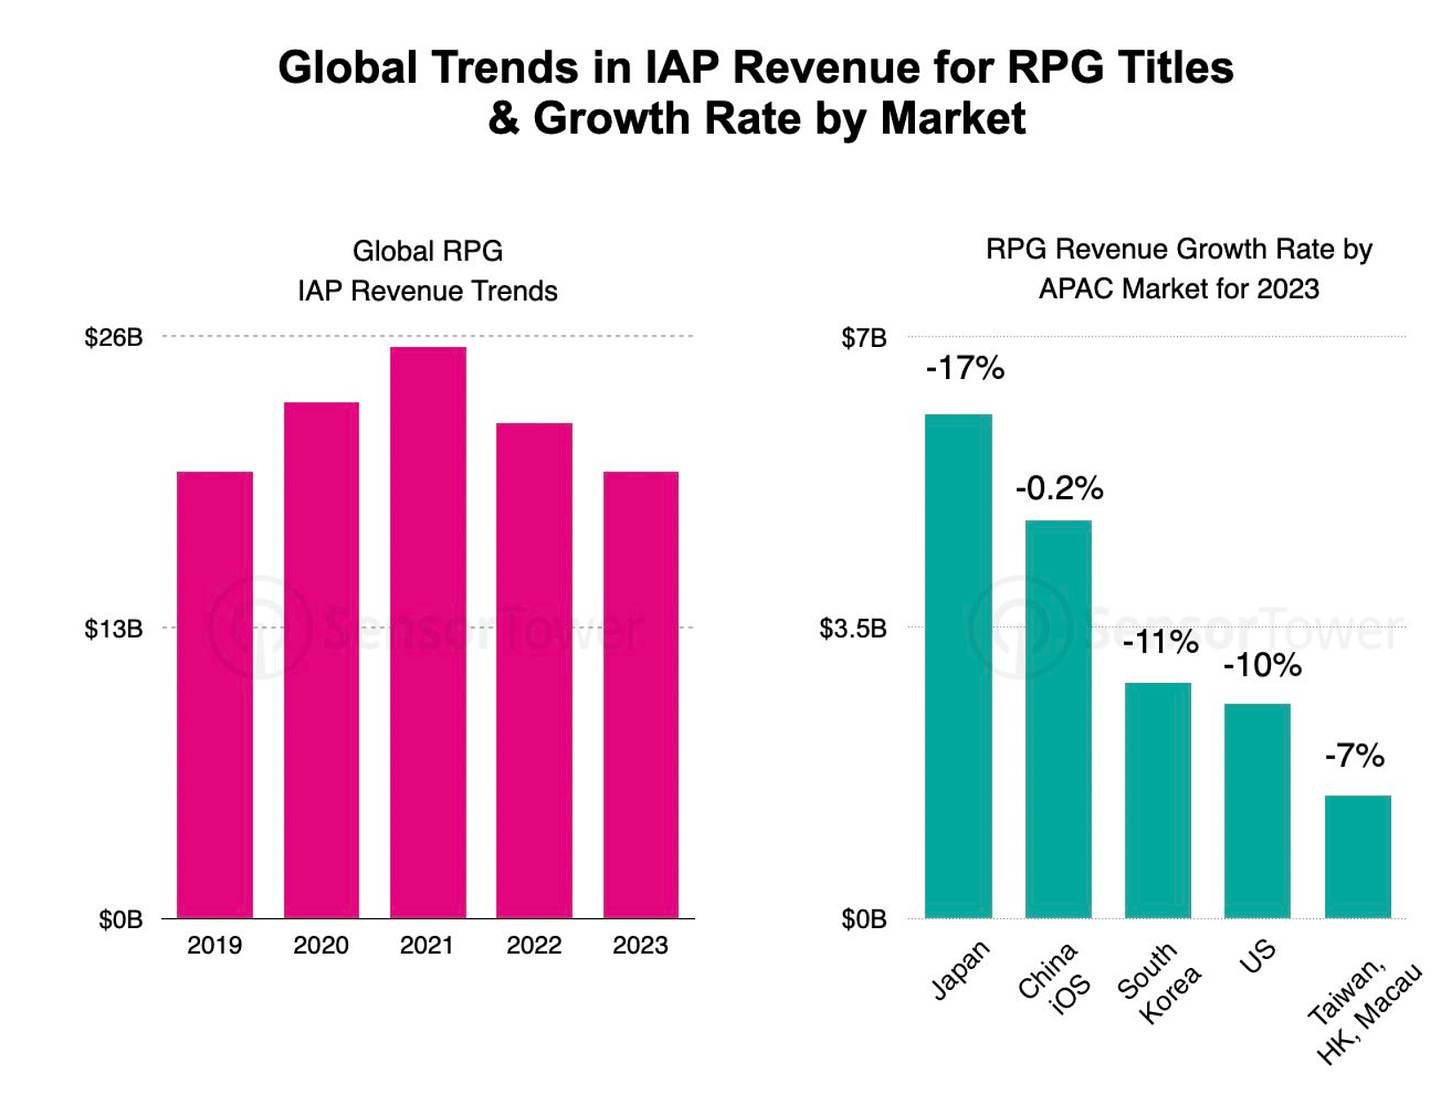
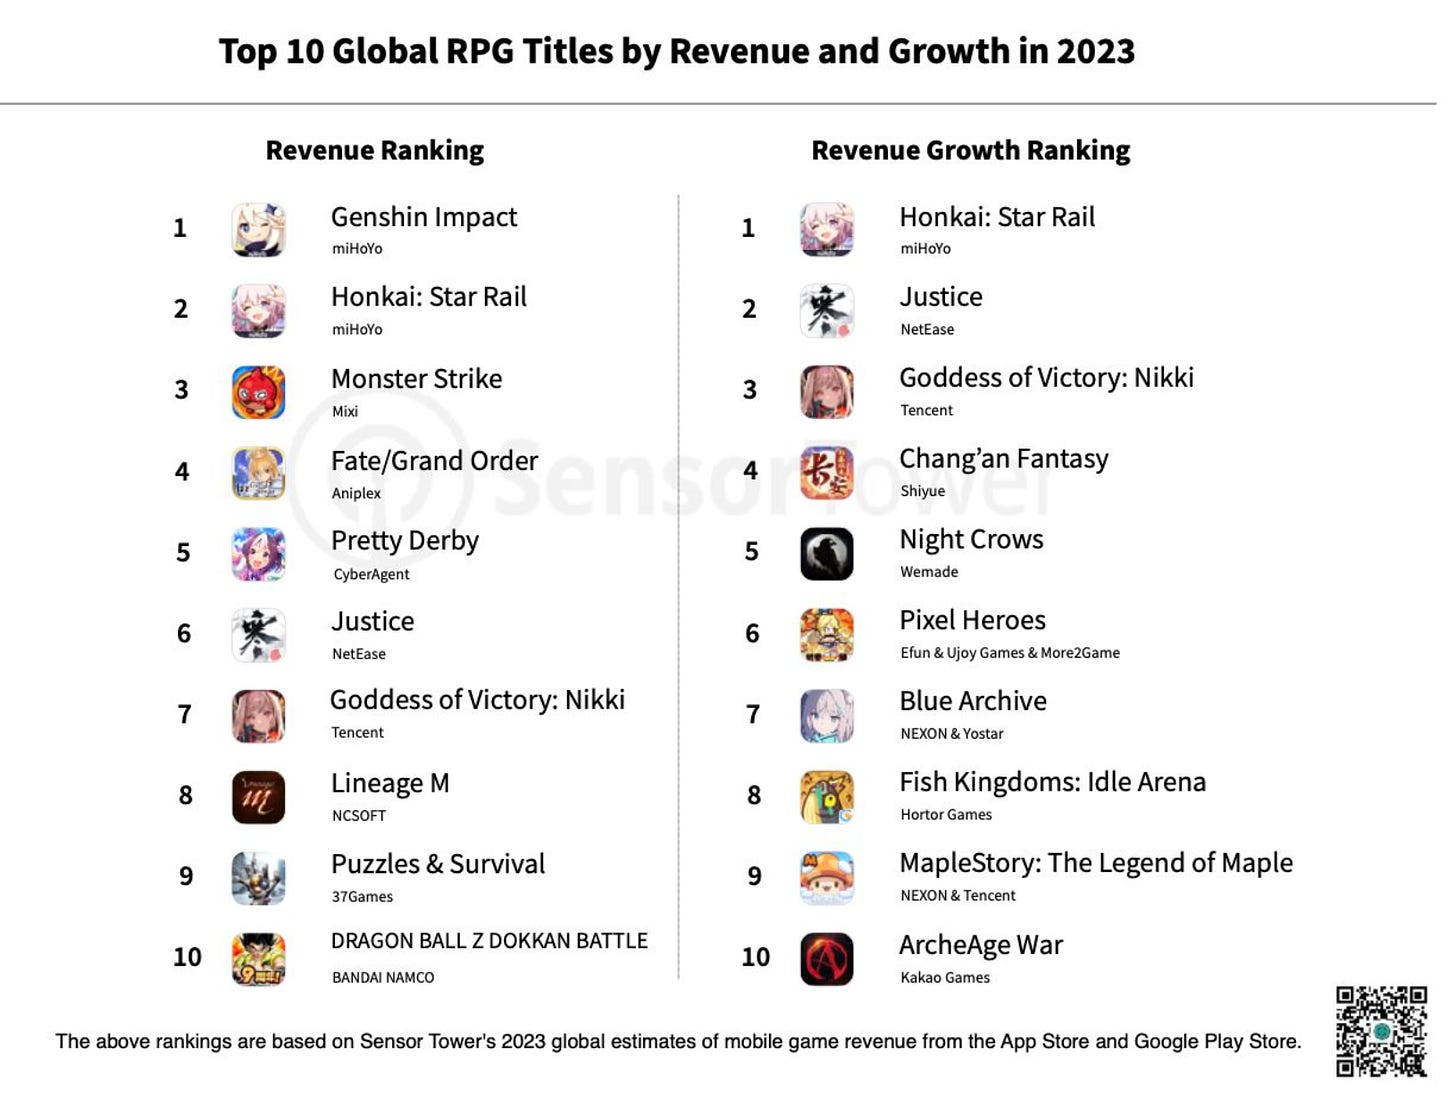
- RPG revenue continues to decline for the second consecutive year. The 10% drop worldwide is largely due to a 17% revenue decrease in Japan (the main market for the genre). However, declines were also seen in South Korea (-11% YoY), the USA (-7% YoY), Taiwan, Hong Kong, and Macau (-7%). In China, the iOS genre remained flat, with a decline of only 0.2% in 2023.

- Despite the decline in the RPG genre, many strong projects were released in 2023 - Honkai: Star Rail; Justice Online; Goddess of Victory: Nikke; Chang’an Fantasy; Night Crows; Pixel Heroes. These projects were among the top revenue growth leaders in 2023.
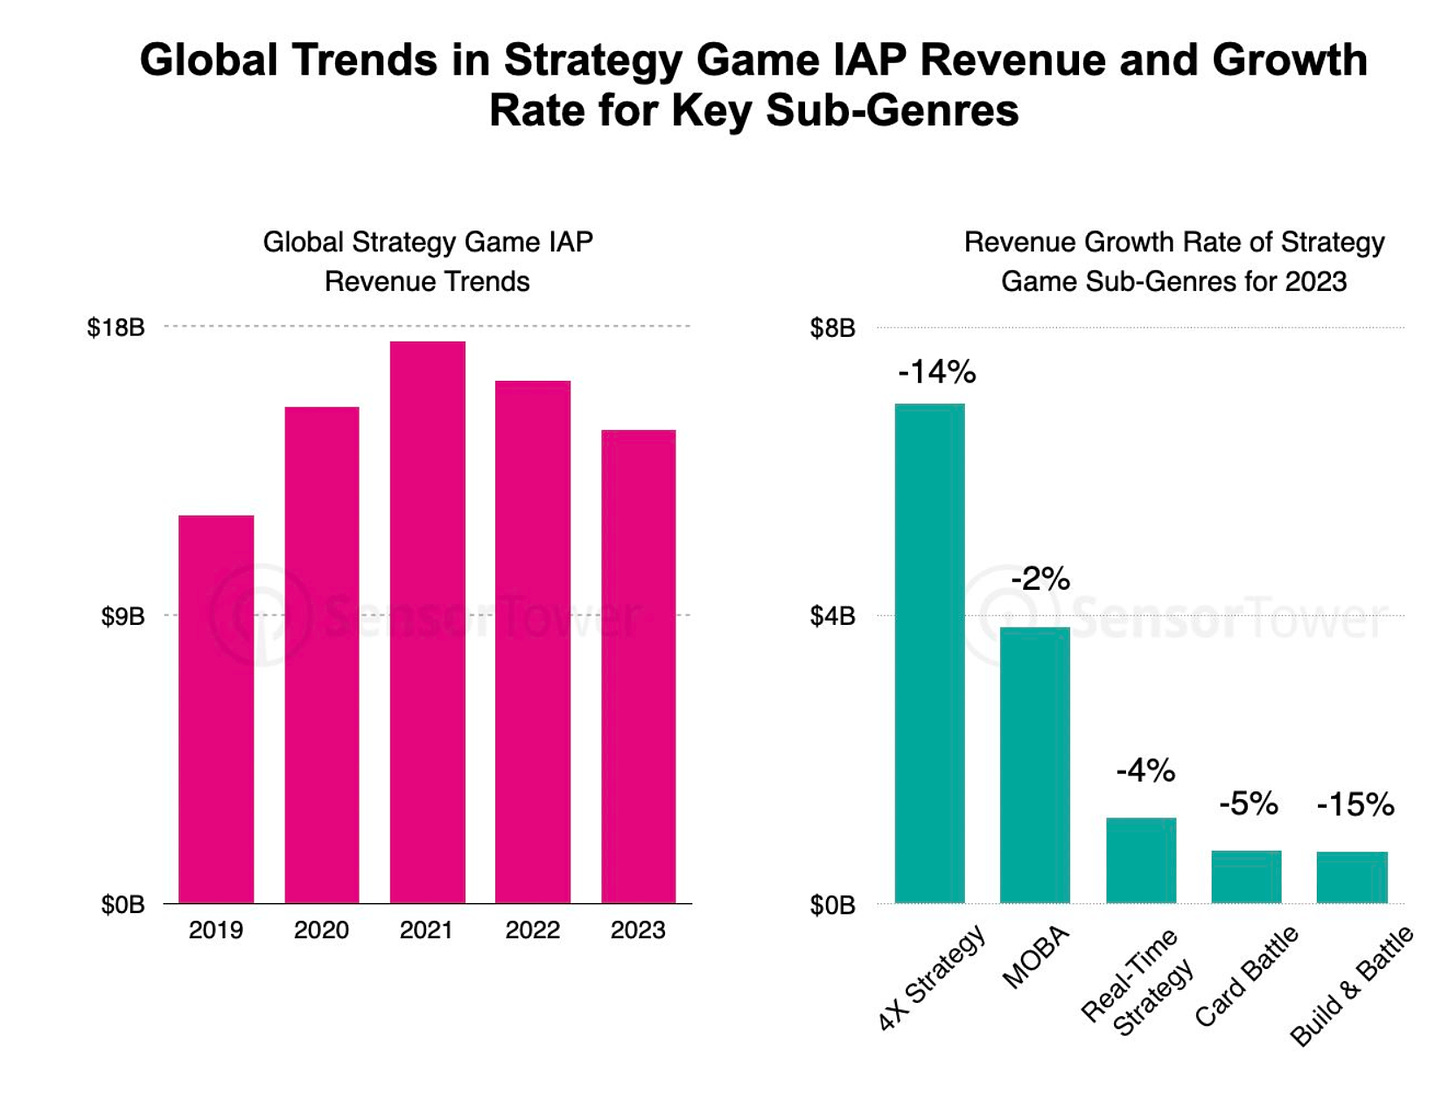
- A similar trend is seen in strategy games. The genre fell by 10% in 2023, to $14.8 billion. However, its revenue is still 22% higher than in 2019. 4X strategy games account for 47% of the genre's total revenue ($7 billion in 2023, but a 14% decline compared to 2022). MOBA games fell by 2%; real-time strategies by 4%; card battlers by 5%; and build & battle games by 15%.
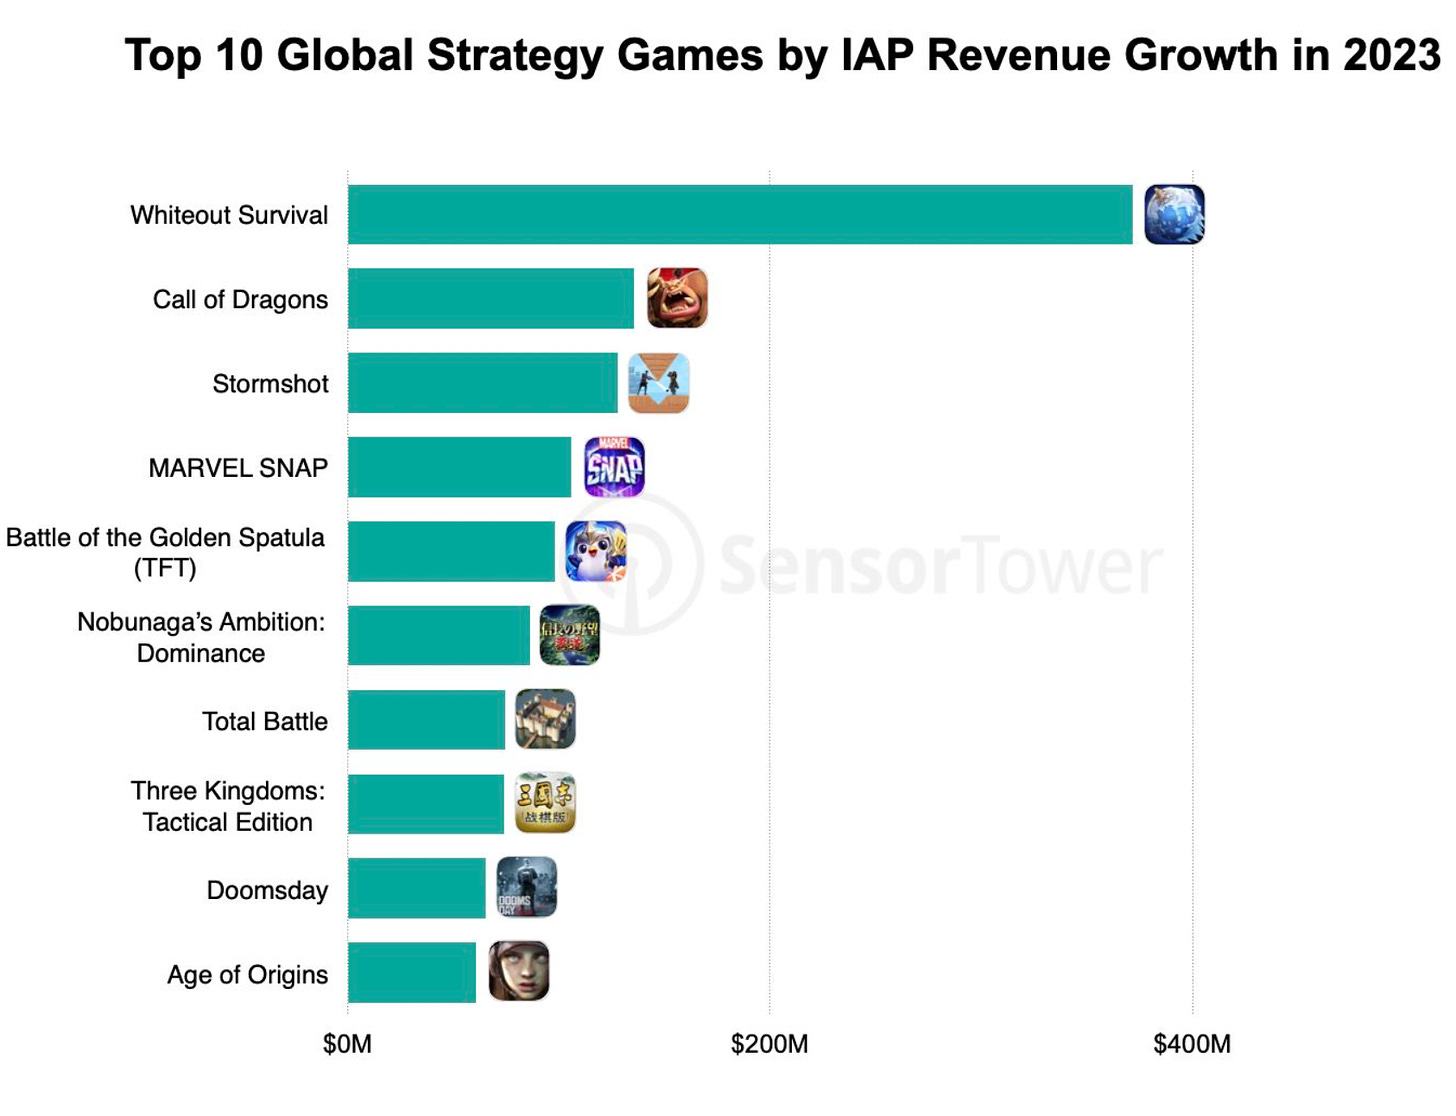
- Whiteout Survival stands out among competitors. The game earned $370 million from IAP in 2023, making it the fastest-growing game in the genre.
Markets in Japan and South Korea
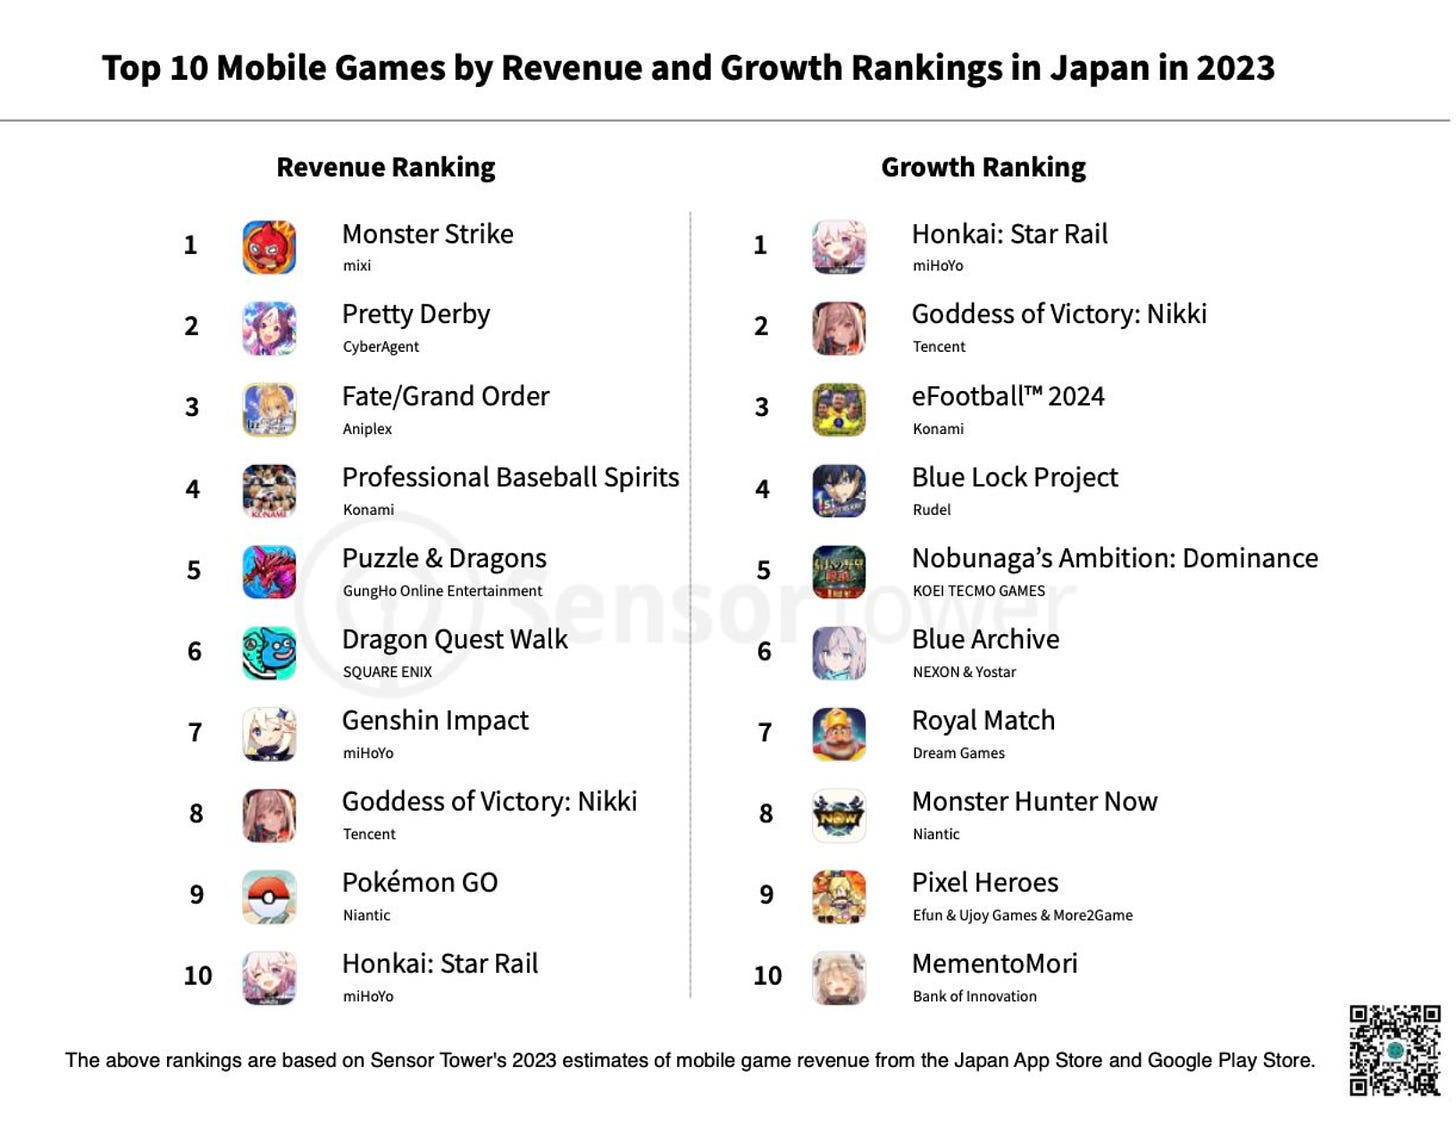
- Monster Strike, Pretty Derby, and Fate/Grand Order are the top-earning games in the Japanese market. However, Honkai: Star Rail is the fastest-growing game in the country by revenue. Japan accounts for 21% of the game's total revenue, making it the largest overseas market for the game. Goddess of Victory: Nikke is in second place, with a revenue growth of 182% in 2023.
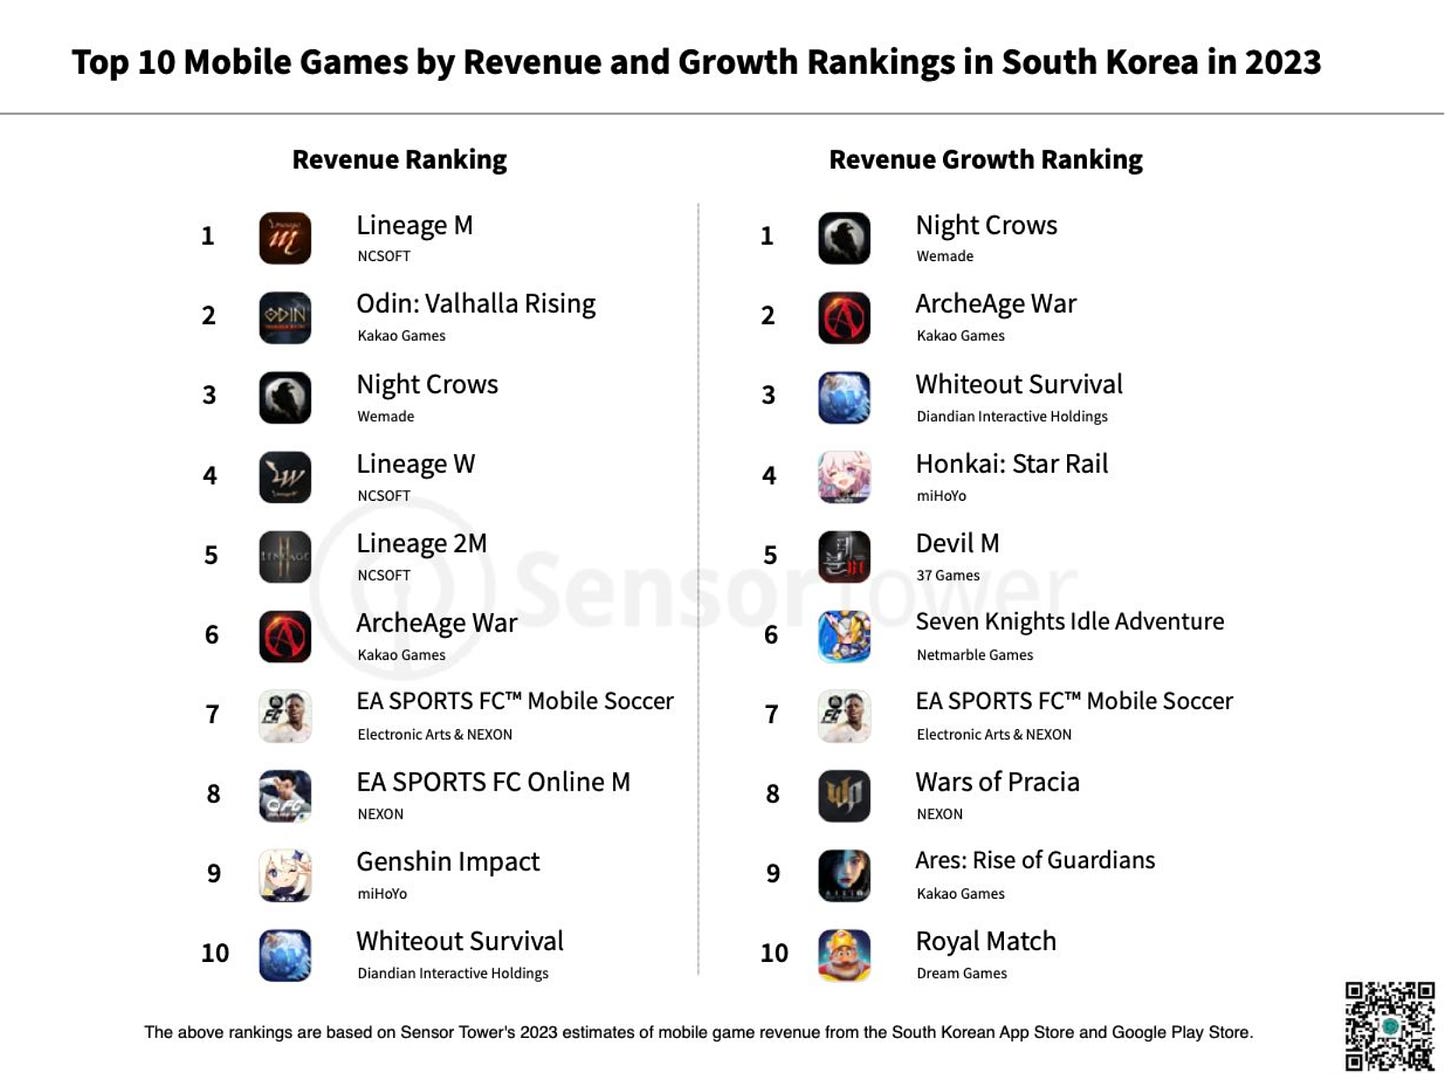
- In South Korea, the top revenue earners are Lineage M; Odin: Valhalla Rising, and Night Crows. In 2023, MMORPGs in the country earned $1.9 billion, accounting for 40% of the total market. Night Crows was the fastest-growing project by revenue, earning $180 million.
Newzoo: Top-20 PC/Console Games of June 2024 by Revenue and MAU
Newzoo takes data from the USA, UK, Spain, Italy, Germany, and France.
Revenue - All Platforms
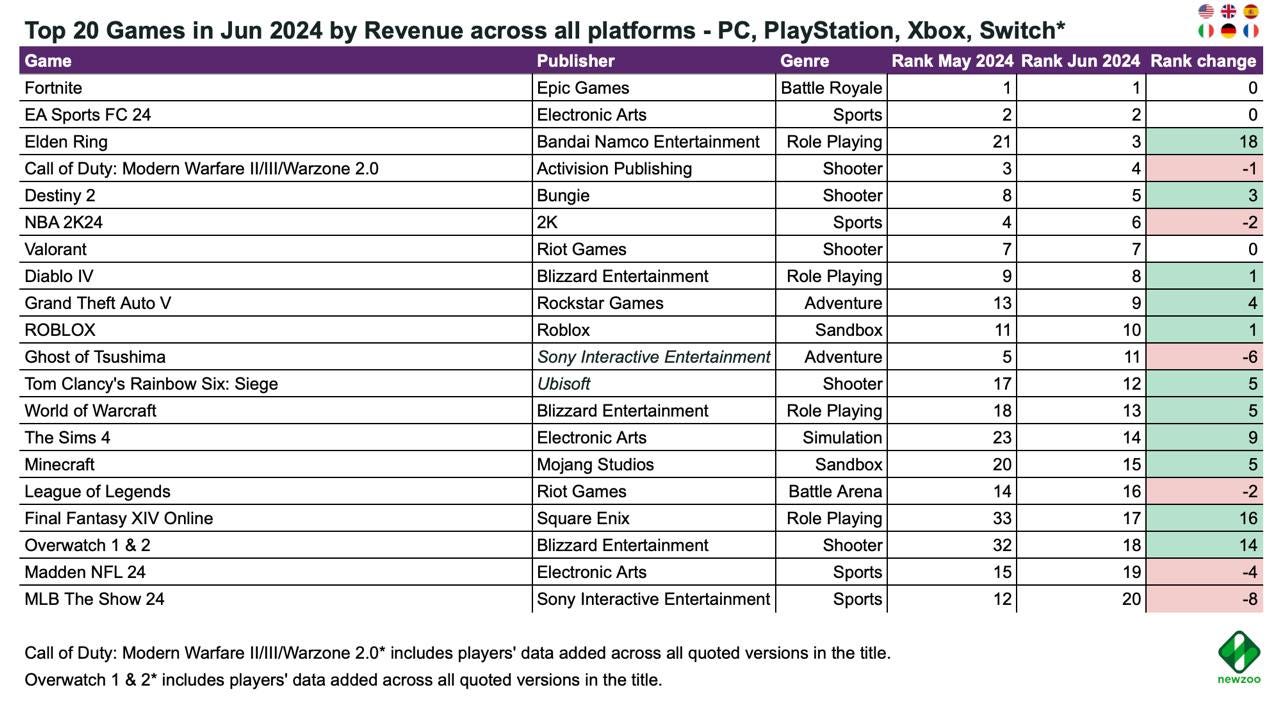
- Elden Ring showed the biggest growth among all projects in the top 20 due to the release of the Shadow of the Erdtree expansion. The game ranked 3rd in revenue in June.
- The first two places are held by Fortnite and EA Sports FC 24.
- Helldivers II dropped out of the top 20. The revenue of Final Fantasy XVI Online and Overwatch increased significantly.
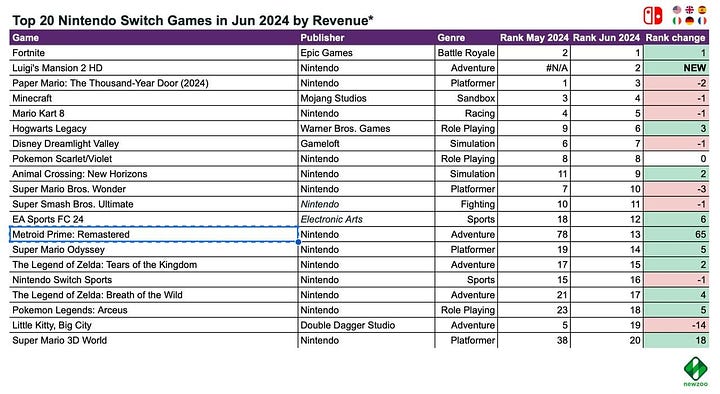
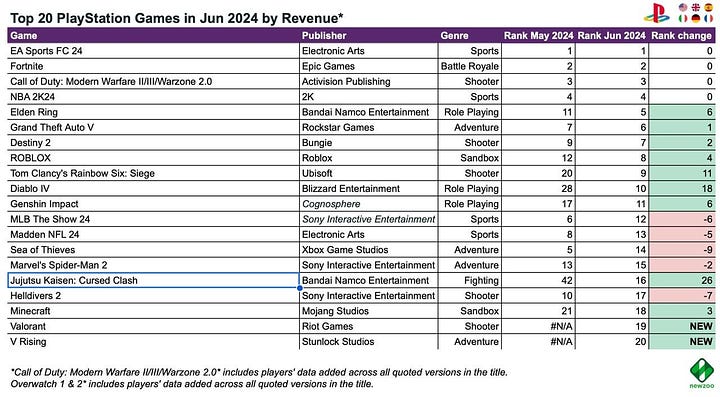
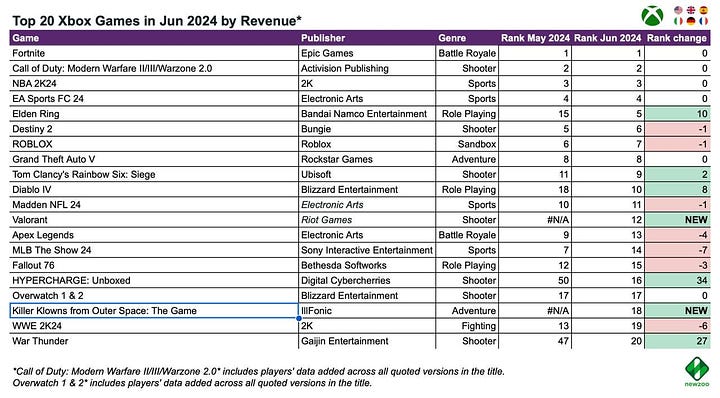
Revenue - Individual Platform
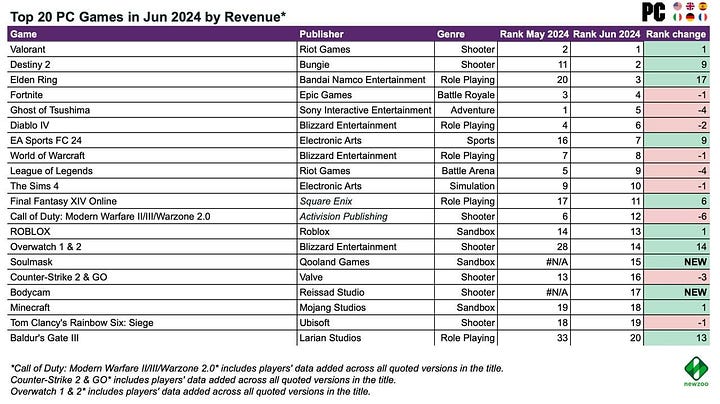
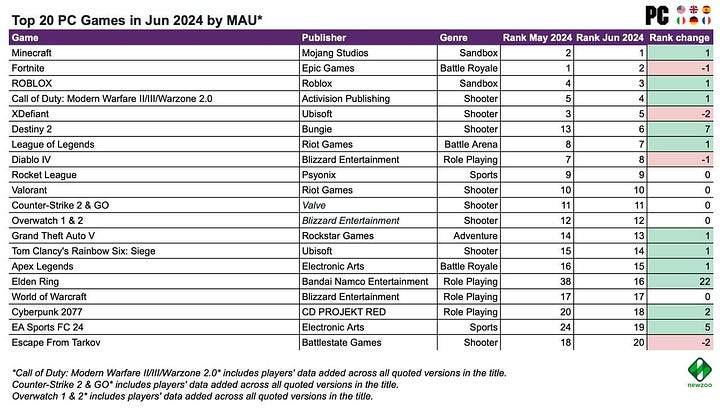
- On PC, the highest-earning game was Valorant. Soulmask (15th place) and Bodycam (17th place) entered the top 20 for the first time. Baldur's Gate III returned to the top-20.
- On PlayStation, the fighting game Jujutsu Kaisen: Cursed Clash jumped into the top 20 by revenue in June. Valorant and V Rising entered for the first time. Helldivers II dropped to 17th position (previously 10th last month).
- On Xbox, Valorant and Killer Klowns from Outer Space: The Game (18th position) entered the top 20 by revenue for the first time. HYPERCHARGE: Unboxed and War Thunder showed strong revenue growth.
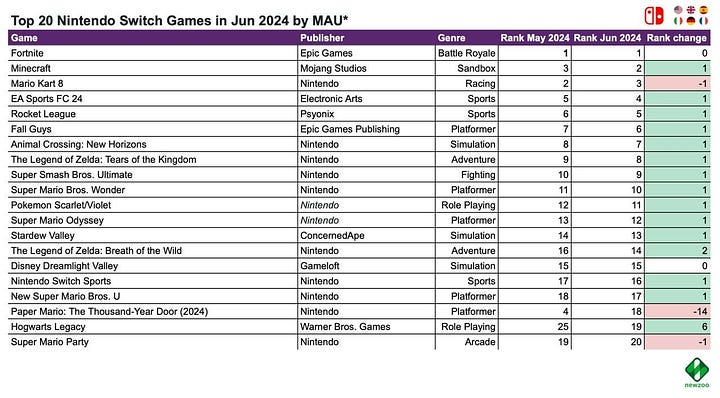
- On Nintendo Switch, everything is relatively stable. Fortnite rose to the first position; Luigi's Mansion 2 HD took second place. Metroid Prime: Remastered had an excellent month, jumping to 13th place on the chart.
MAU - All Platforms
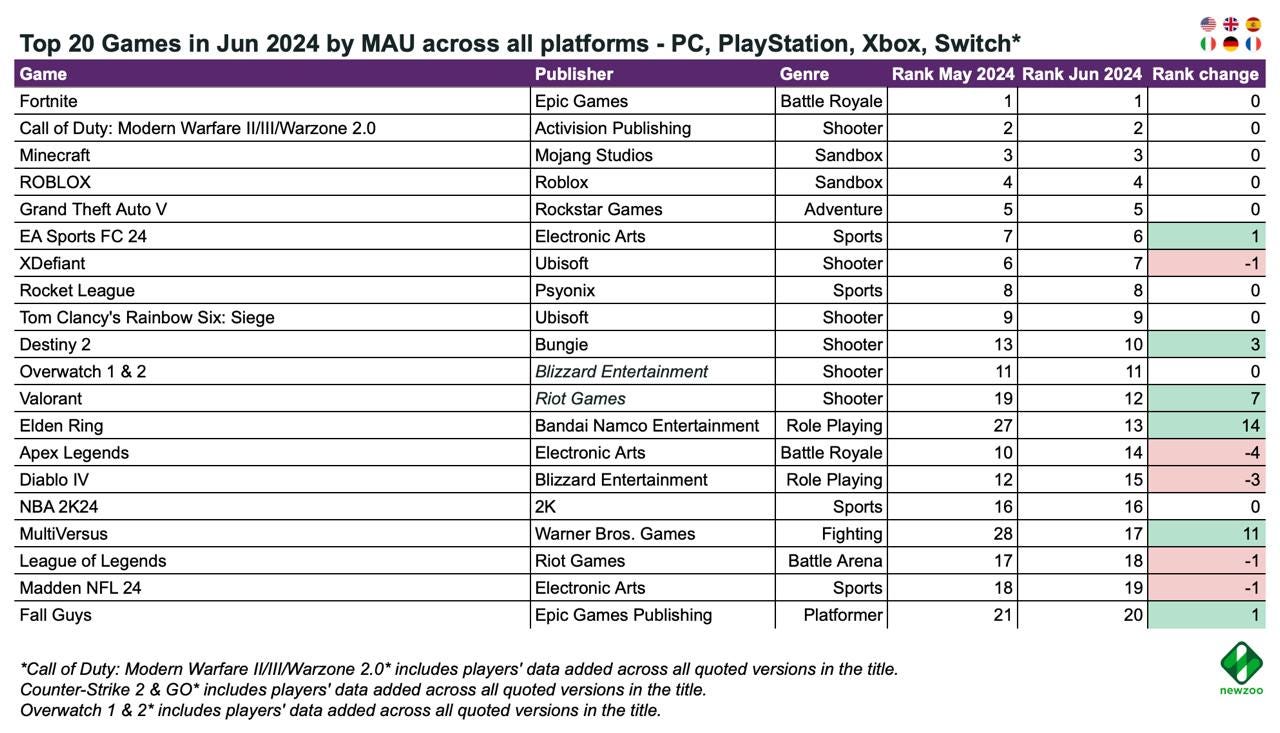
- The situation with MAU is stable. Elden Ring and MultiVersus re-entered the top 20. Otherwise, there are no surprises.
- Fortnite, Minecraft, Call of Duty, EA Sports FC 24, Grand Theft Auto V, Roblox, and Rocket League are the games showing the highest MAU on all platforms where they are present.
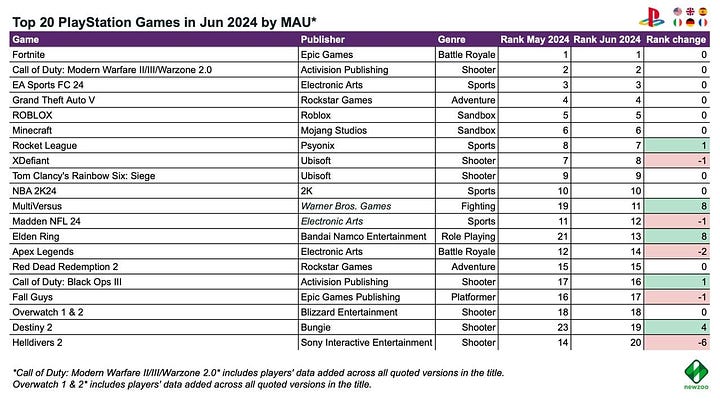
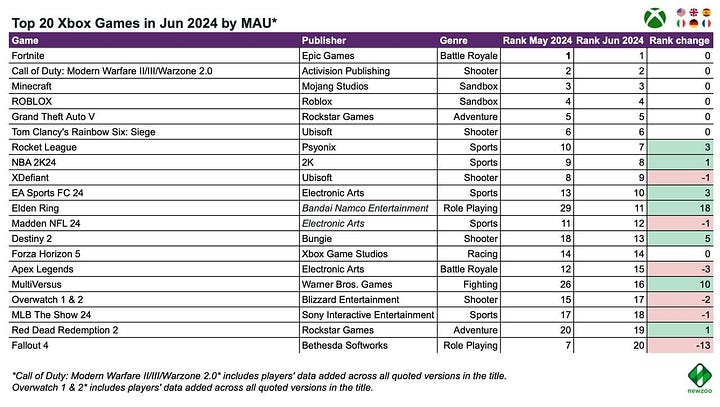
- XDefiant is worth keeping an eye on. The game maintained a top-10 position by MAU on all platforms in June. This is a significant achievement in the modern market, despite the game not appearing in the revenue charts.
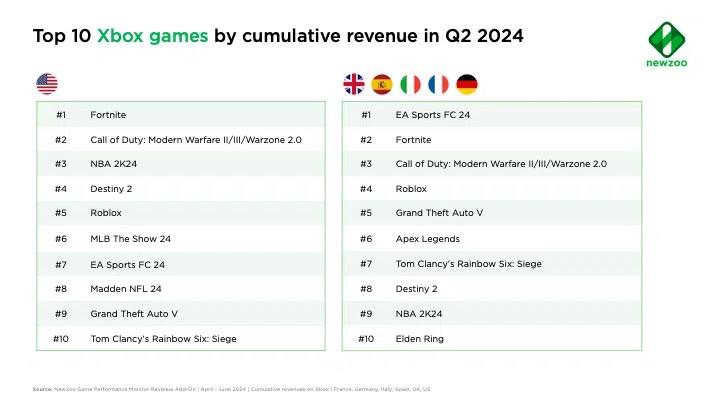
Newzoo: PC/console games performance in Q2'24
Newzoo takes into account data from the USA, UK, Spain, Italy, Germany, and France.
- Fortnite, EA Sports FC 24, and Call of Duty (MW2/MW3/Warzone) were the leaders in revenue for the second quarter across the six tracked markets. Elden Ring finished the quarter in 8th place, and Ghost of Tsushima in 10th. Together, these two projects accounted for 4.2% of all gaming revenue for the quarter.
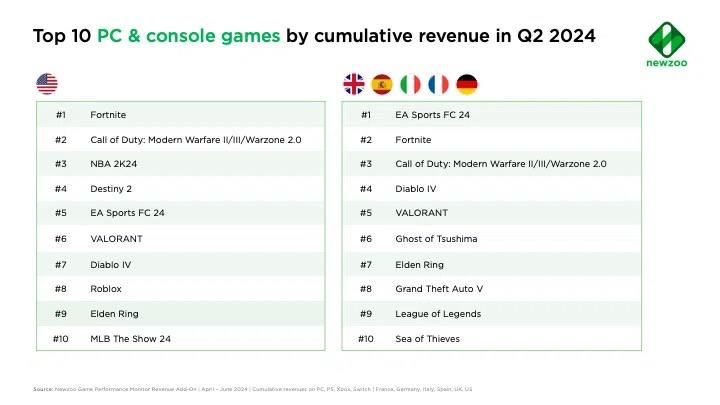
- Fortnite - 10% of all gaming revenue in Q2’24; EA Sports FC 24 - 7.4%. However, if we look only at the European market, EA Sports FC 24's share rises to almost 25%.
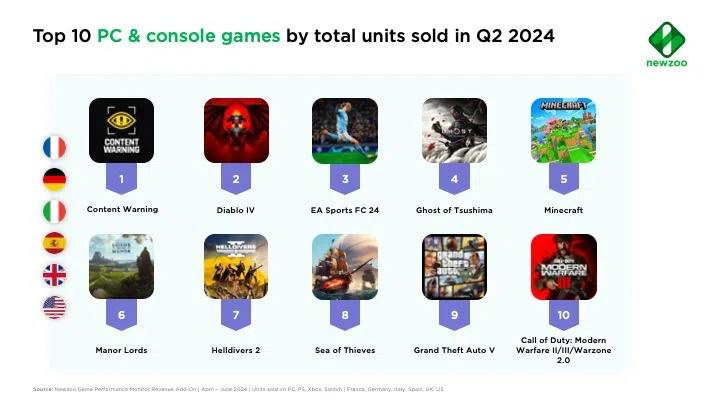
- Content Warning, Diablo IV, and EA Sports FC 24 were the leaders in the second quarter by the number of copies sold. However, it's not entirely clear if free copies of Content Warning were included. In any case, the game sold over 1.5 million copies across the six markets.
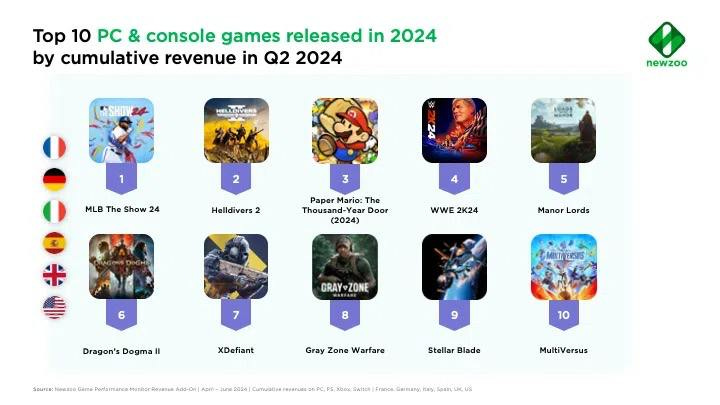
- Among games released in 2024, the leaders in cumulative revenue in Q2’24 were MLB: The Show 24, Helldivers II, and Paper Mario: The Thousand-Year Door. Also on the list are XDefiant (7th place) and MultiVersus.
Game revenue ranking by platform
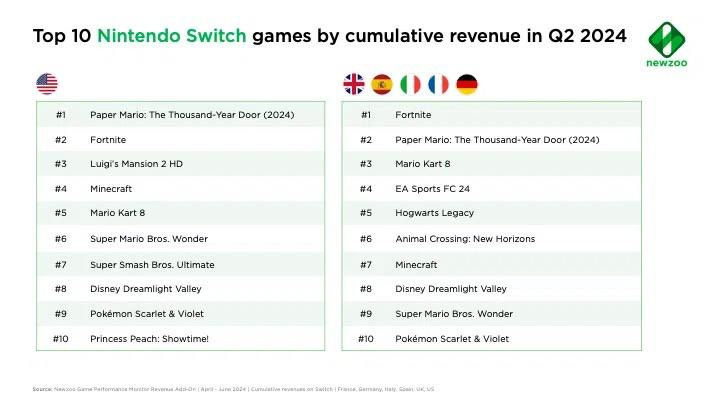
- Nintendo Switch - Fortnite accounted for 15.6% of all game revenue on the Switch in the USA in the second quarter. Paper Mario: The Thousand-Year Door also performed well.
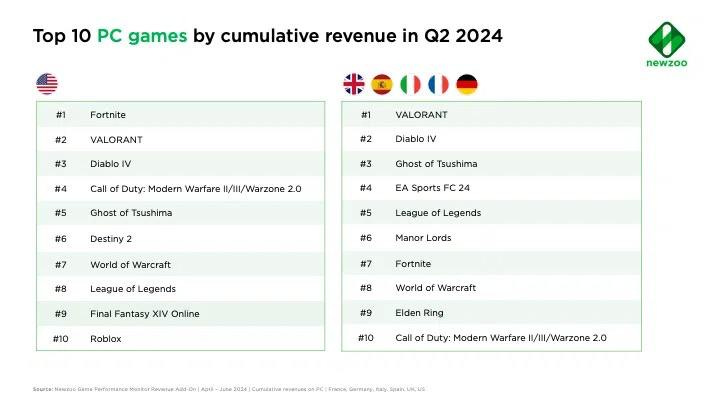
- PC - Valorant leads in revenue in Europe (7.2% of all revenue in Q2’24); Fortnite leads in the USA. Ghost of Tsushima accounted for 6% of all PC sales in Europe and 4% in the USA by the end of the second quarter.
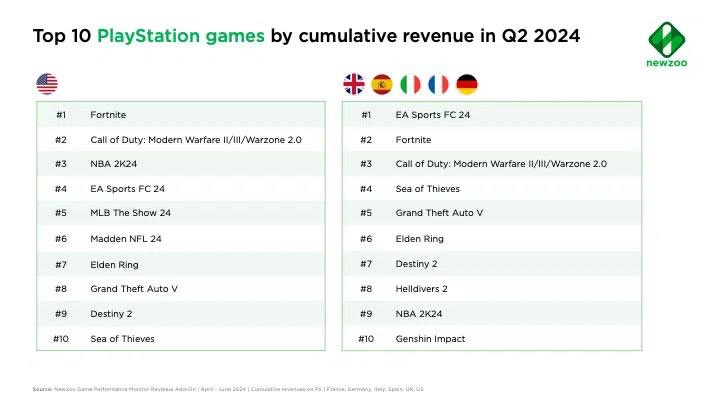
- PlayStation - In the USA, Fortnite, Call of Duty series games, and NBA 2K24 lead. In Europe, EA Sports FC 24 is at the top. Sports games on PS accounted for 21% of all gaming revenue in the USA. In Europe, football and basketball games accounted for 36.8% of all revenue.
- Xbox - The situation is similar to what we see on PlayStation. Sports games account for 19.9% of revenue in the US market and 43% in the European market.
GameDiscoverCo: In which countries do owners of successful games on Steam live
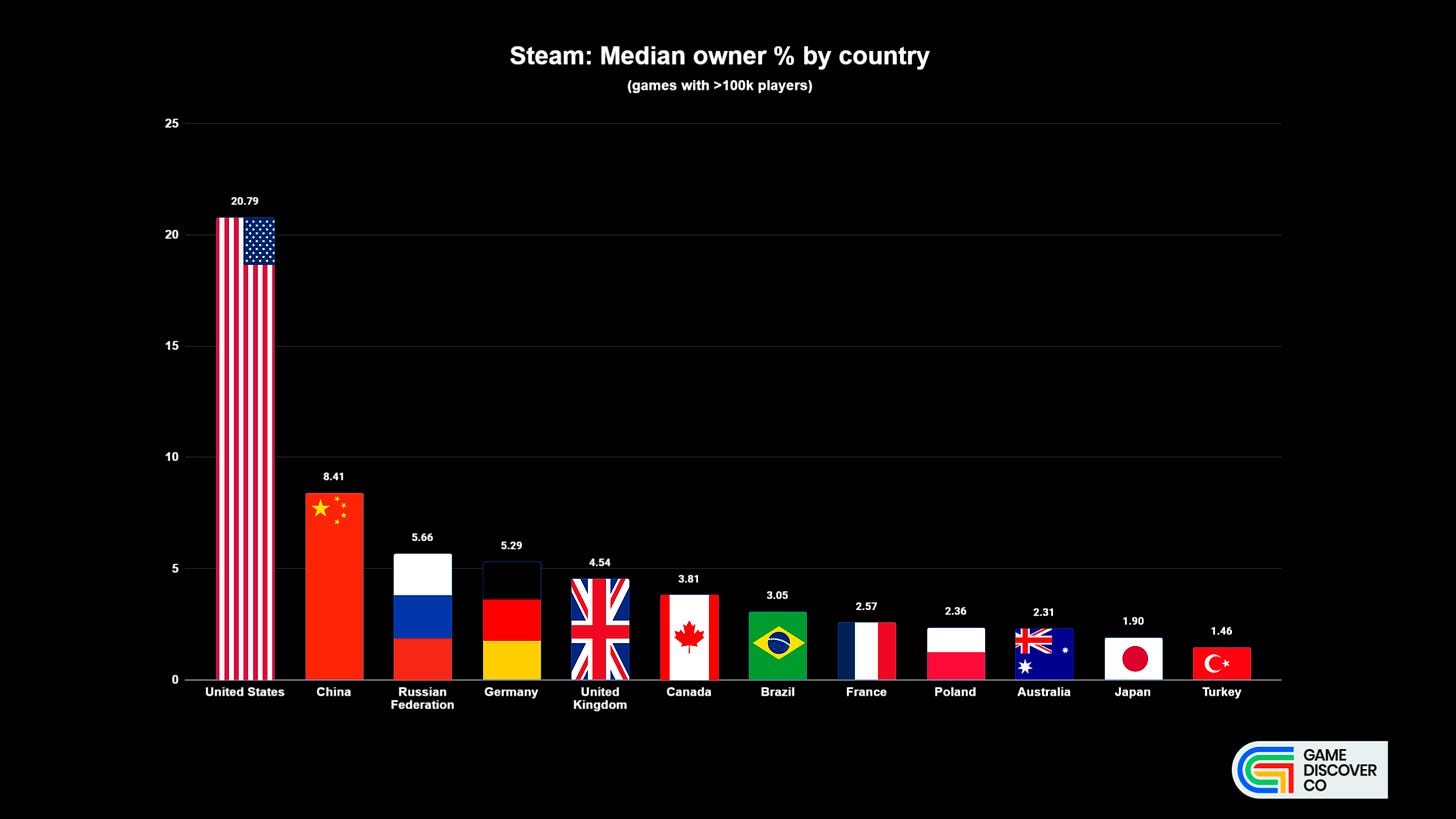
Successful games are considered projects with more than 100 thousand players.
- 20.79% of players in "hit" projects are from the USA, 8.41% from China, and 5.66% from Russia. This is the median figure over time
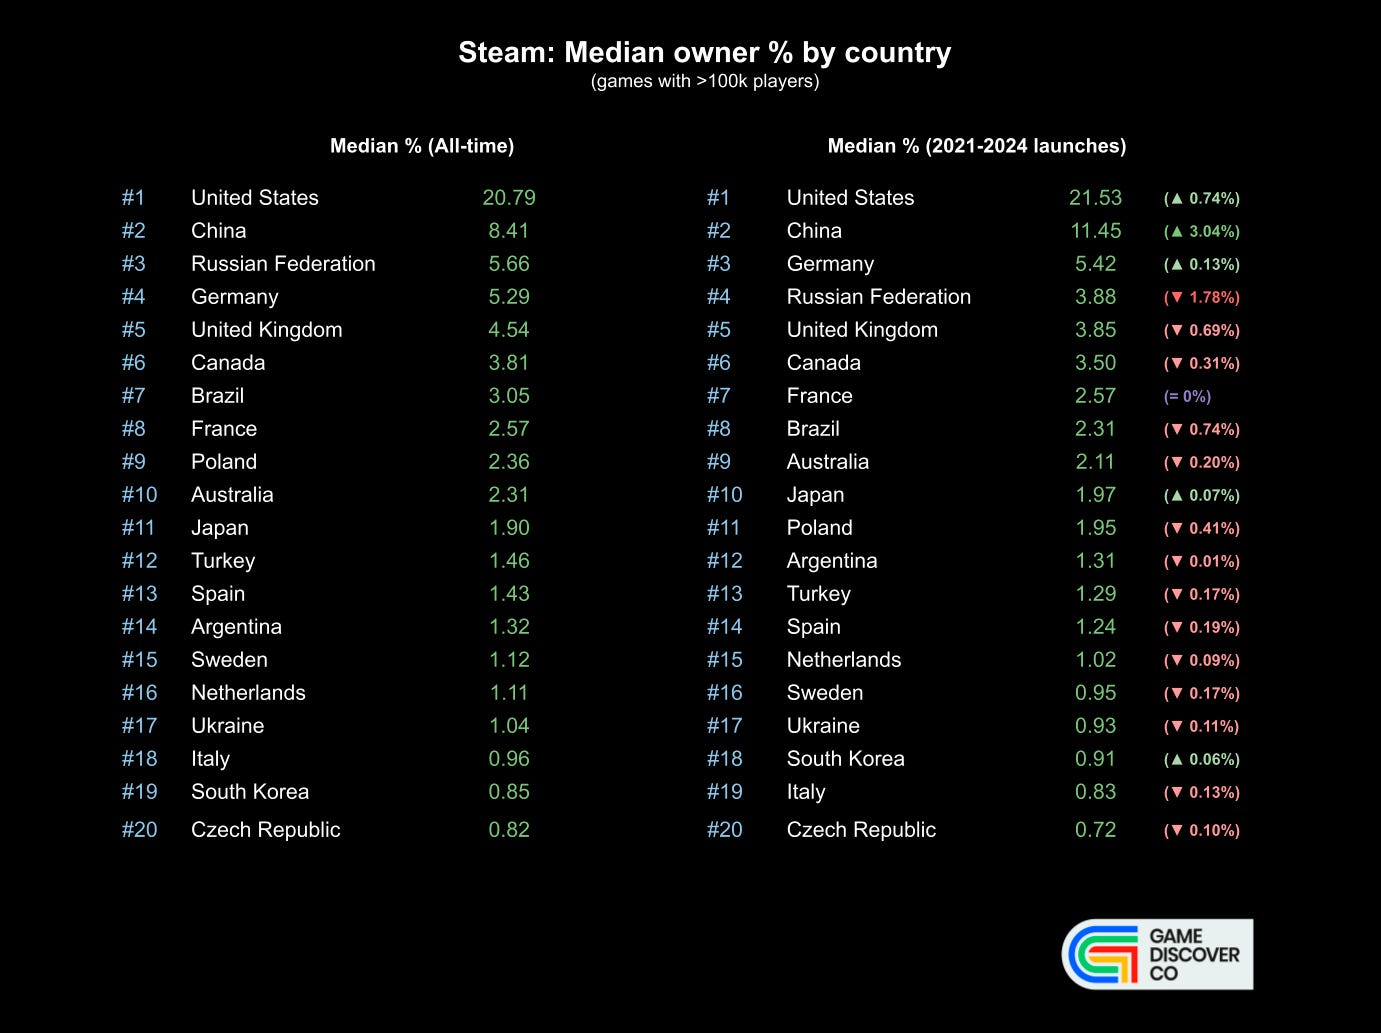
- However, if we only consider launches from 2024, we can see that the share of the USA has grown (to 21.53%); China has grown significantly (to 11.45%), and Germany has risen to third place (5.42%). Russia shows a significant decline (to 3.88%); the share of the UK decreases (by 0.69%) and Canada (by 0.31%).
❗️GameDiscoverCo notes that the figures for China may be underestimated due to market specifics.
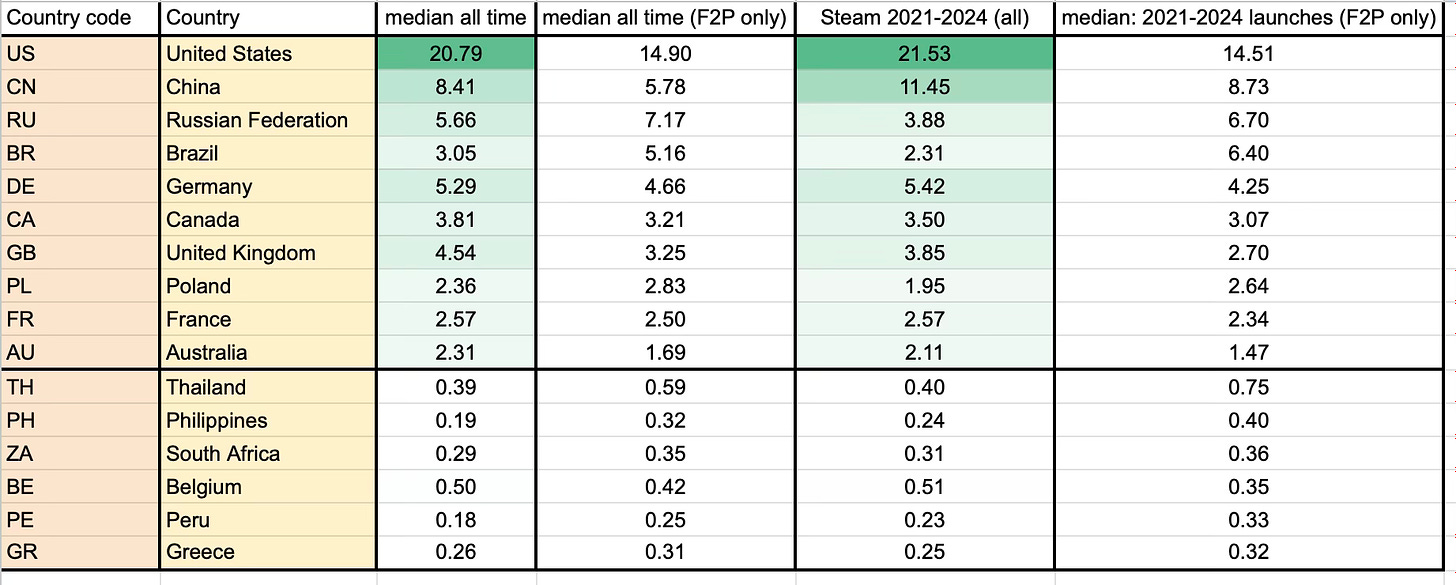
- However, if we are talking about F2P games, the situation changes dramatically. The median percentage of players in the USA for F2P projects is 14.9%; for Russia - 7.17%; for China - 5.78%; for Brazil - 5.16%. Overall, the share of players in free-to-play games is higher in developing countries.
You can have a deep dive using this spreadsheet, carefully prepared by the author (thanks, Simon!).
Niko Partners: The Gaming Markets of South Korea and Japan Grew to $30.1 Billion in 2023
Japan and South Korea in Niko Partners' taxonomy are classified as East Asia.
Market Condition
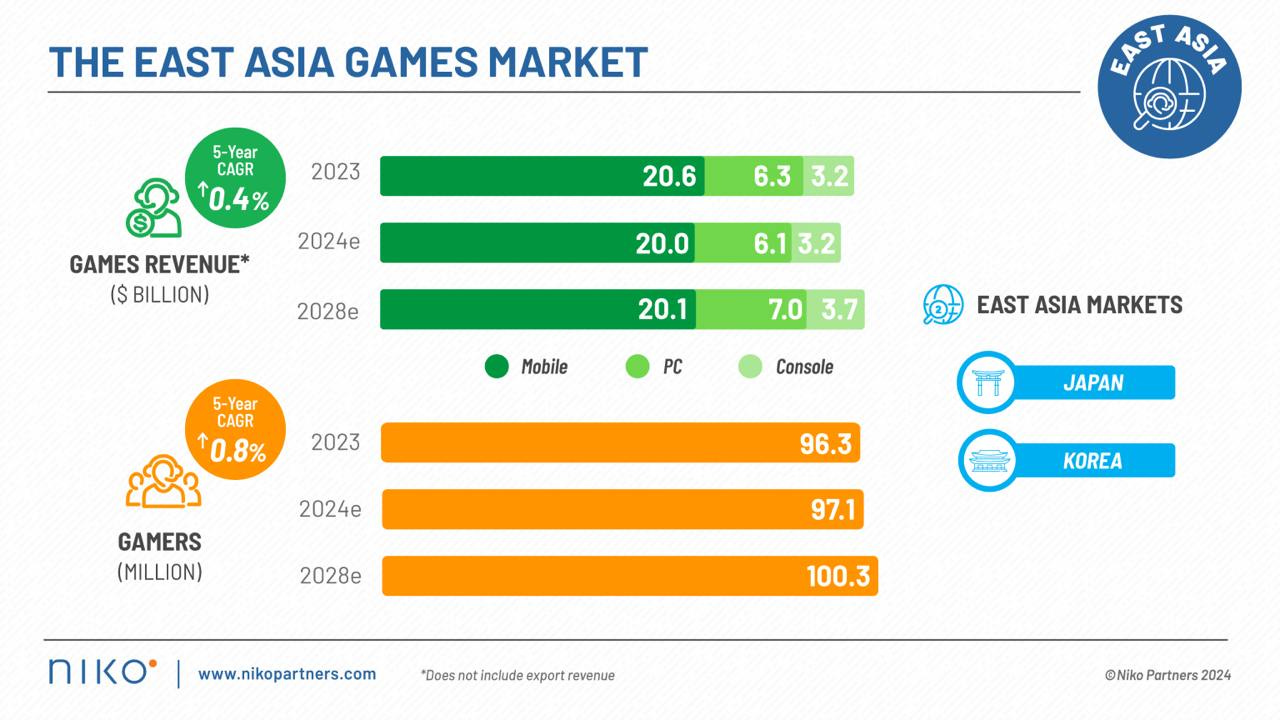
- Growth compared to last year was 1%. However, Niko Partners expects a decline in 2024 by 2.9% to $29.2 billion.
- The future outlook is conservative. It is expected that by 2028 the market volume will be $30.8 billion. The average annual growth rate will be only 0.4%. The markets have reached their maturity.
❗️Niko Partners notes that Japan is experiencing a correction after the rapid growth of the industry during the pandemic. Moreover, the weak yen exchange rate affects market forecasts in dollars.
- Mobile remains the largest segment, accounting for 68.4% of the region's total revenue. However, over the years, this share will decrease. Consoles and PC will show growth.
- In 2023, there were 96.3 million players in Japan and South Korea (+1.7% YoY). In 2024, the number will grow by another 0.8% to 97.1 million. By 2028, the number of gamers will reach 100.3 million (average annual growth rate - 0.8%).
- Japan and South Korea show astronomical ARPU figures - $312.71 in 2023. This figure is expected to decrease to $307.04 by 2028.
User Preferences
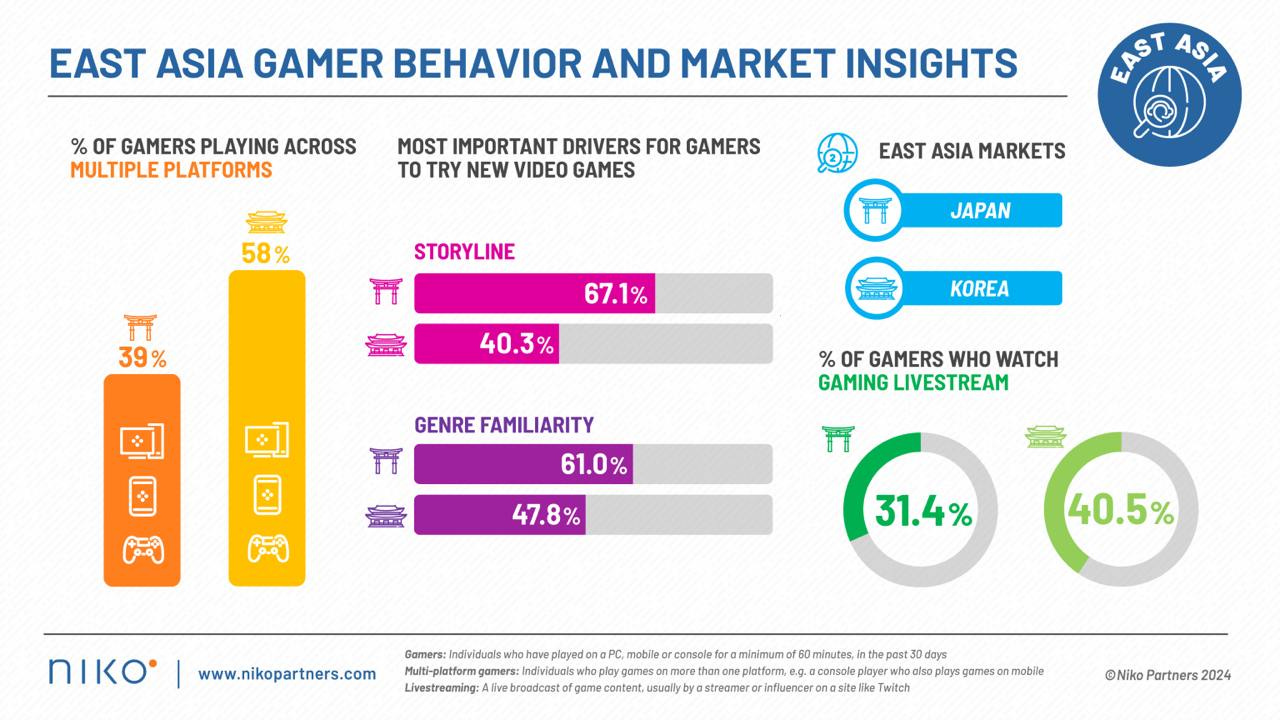
- 39% of Japanese and 58% of Koreans play on two or more platforms. Niko Partners notes a significant increase in the number of mobile gamers in Japan who have switched to consoles; their number has increased by 30%. In South Korea, PC users have started playing on other platforms more often.
- Despite the stagnation of the Japanese market, Niko Partners expects an average annual growth of 8.8% in the PC segment and 2.5% in the console segment in the country over the next 5 years. In South Korea, the annual growth of the console market will be 3.4% over the next 5 years.
- Japanese (60%+) and Koreans (40%+) want games in familiar genres and with a good storyline.
- 31.4% of Japanese gamers and 40.5% of South Korean gamers watch streams.
- YouTube is the main channel for consuming gaming content, used by more than 90% of the audience in Japan and South Korea. However, it is important to consider local platforms - SOOP (AfreecaTV) in South Korea and NicoNico in Japan. They cover more than 20% of the gaming audience and are focused on gaming content.
AppMagic: Top Mobile Games by Revenue and Downloads in July 2024

AppMagic provides revenue data net of store commissions and taxes.
Revenue
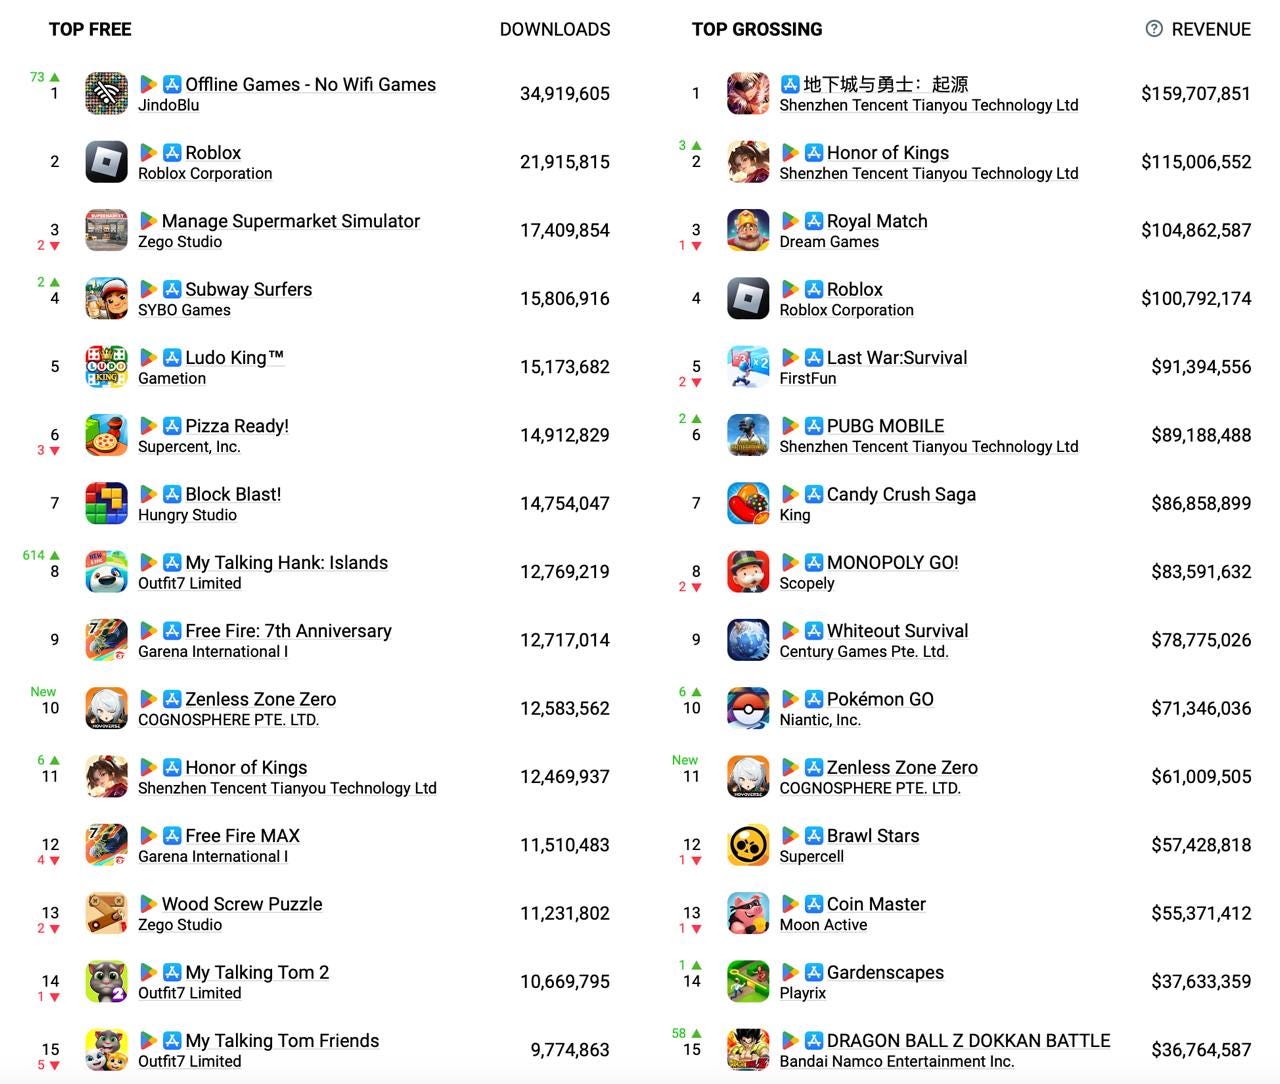
- Dungeon Fighter Online appears to be the new leader for some time. The game earned $159.7 million in July - slightly less than the previous month, but still significantly ahead of the second-place Honor of Kings ($115 million). In both cases, this revenue comes from iOS China (96% of Honor of Kings' revenue comes from the country).
- Pokemon GO! surged into the top 10, doubling its earnings from the previous month and earning $71.3 million.
- Zenless Zone Zero narrowly missed the top 10, earning $61 million in July. Incidentally, this is miHoYo's highest-earning game of the month.
Downloads
- The leader in downloads for July was Offline Games - No WiFi Games with 34.9 million installs. This is a collection of simple games that, as the name suggests, do not require the internet.
- My Talking Hank: Islands shot into the top 10, with downloads increasing almost tenfold. According to platform data, the game was initially released in 2017; however, according to the developers, it entered soft launch on November 9, 2023, on Android, with a full release on July 4, 2024. This explains the surge in downloads.
- Zenless Zone Zero made it into the top 10 in terms of downloads. The game was downloaded 12.5 million times in July.
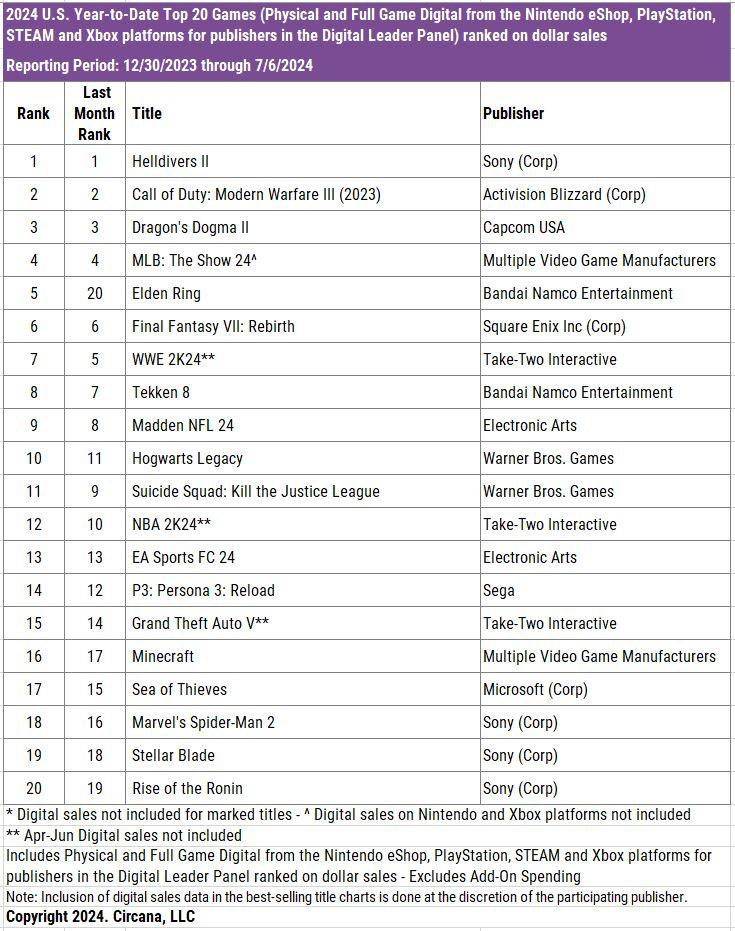
Circana: The US Gaming Market in June 2024
- The total revenue of the gaming market in June 2024 was $4.569 billion. This is 5% less than the previous year.

- The revenue for the first half of 2024 was $27.320 billion, 1% more than the same period in 2023. From April to June 2024, the market has been below 2023 results.
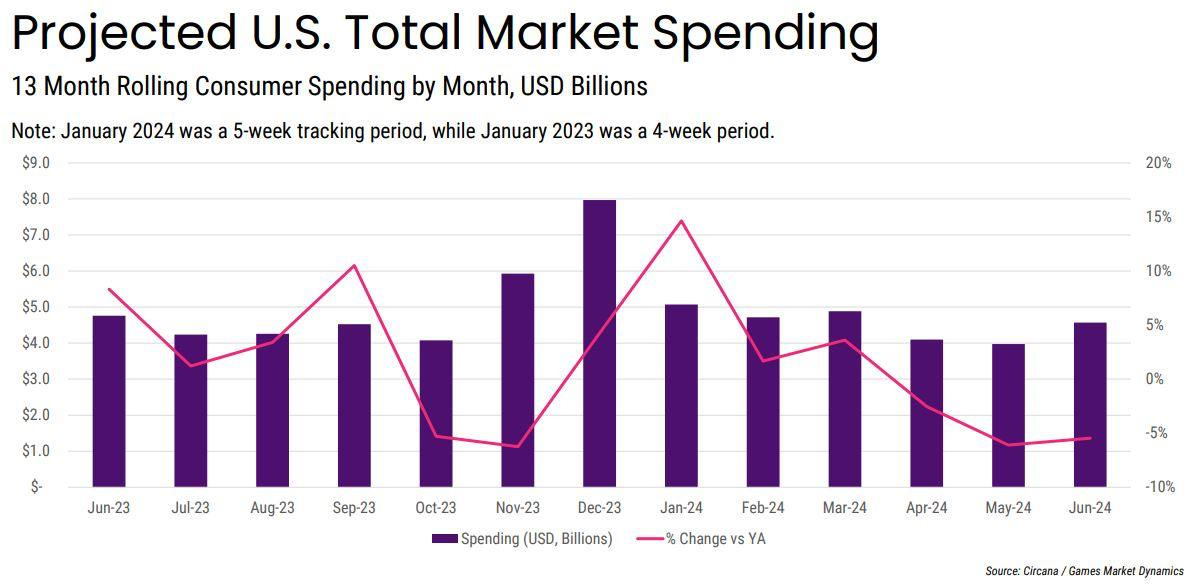
- Revenue from game sales in June was $4.079 billion, 2% less year-over-year. Hardware sales plummeted by 37% to $287 million. Sales of gaming accessories decreased by 7% to $204 million.
- The American mobile market grew by 12% in June; subscription sales on PC and consoles grew by 4%. However, the growth of these segments could not offset the 26% drop in console game sales.
- Nintendo Switch sales fell the most, by 48%. PlayStation 5 sales were down 28% in June, and Xbox Series S|X sales decreased by 18%. Nevertheless, PS5 became the leader in both the number of systems sold and revenue.
- The PlayStation Portal became the most successful accessory in terms of revenue in the first half of 2024.
Best-selling Games
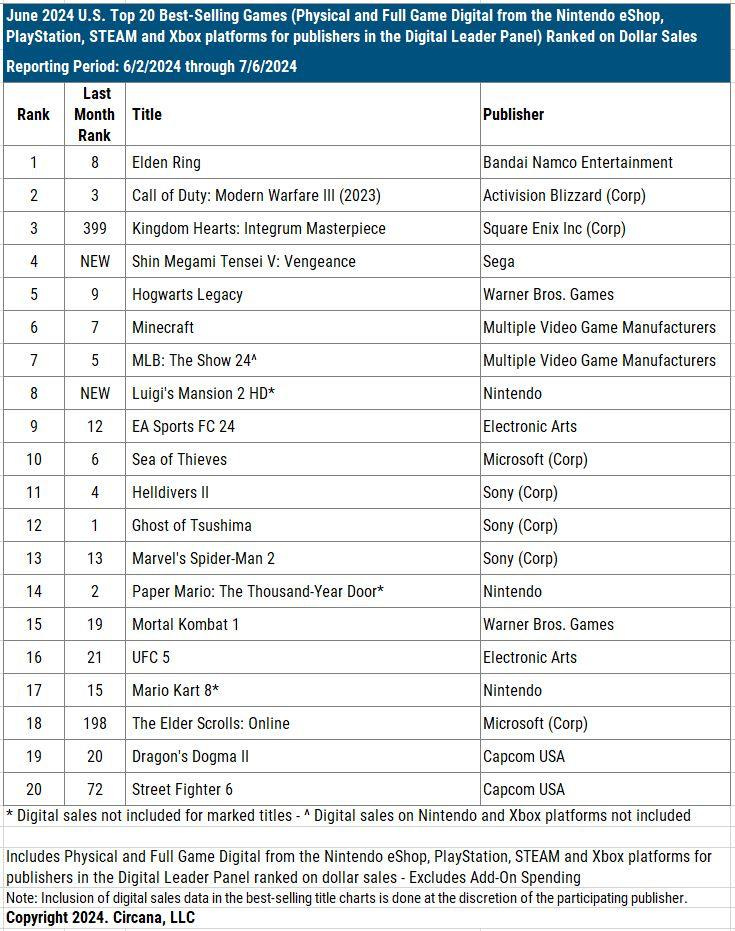
- Elden Ring, following the release of the Shadow of the Erdtree DLC, topped the June chart. There are many interesting titles in the rankings, with Kingdom Hearts: Integrum Masterpiece taking 3rd place. Shin Megami Tensei V: Vengeance took 4th place. The Elder Scrolls: Online returned to the charts in 18th position.
- For the first half of 2024, the top sellers remained the same - Helldivers II, Call of Duty: Modern Warfare III, and Dragon’s Dogma II. Elden Ring has risen significantly and is currently in 5th place.
- The leaders of the mobile market in June were MONOPOLY GO!, Royal Match, Roblox, Candy Crush Saga, and Last War: Survival. Roblox's revenue in June increased by 15% compared to May, and downloads rose by 22%.
PC/Console Charts
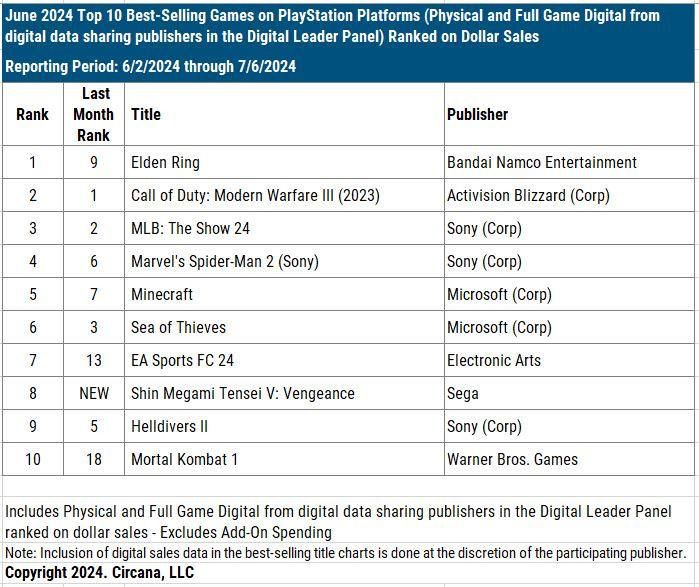
- Elden Ring became the top-selling game on PlayStation in June. EA Sports FC 24 also entered the top 10 in the US. There is a new entry - Shin Megami Tensei V: Vengeance.
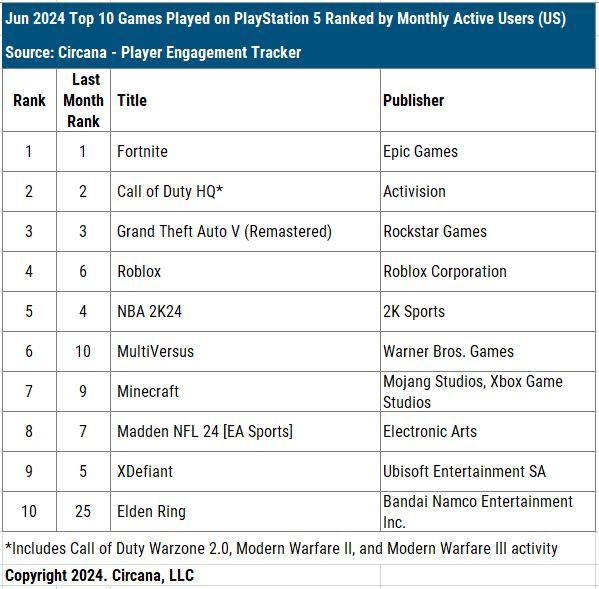
- There are no major changes in MAU on PlayStation; the leaders remain the same - Fortnite, Call of Duty, GTA V. Notably, Helldivers II dropped out of the top 10.
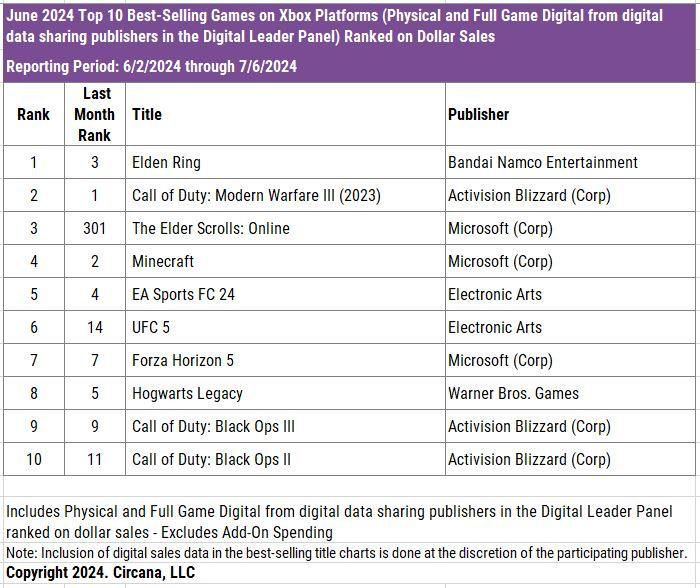
- The Elder Scrolls: Online entered the top 10 sales on Xbox. UFC 5 also showed significant growth.
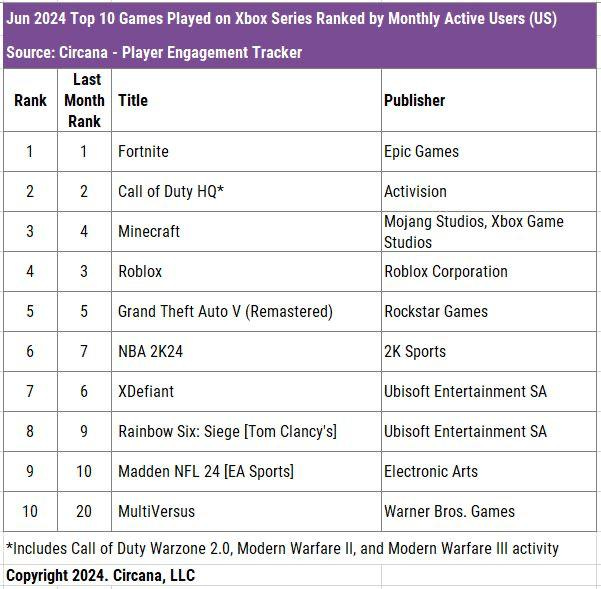
- For Xbox MAU, the rankings are almost identical to May. The only change is the entry of MultiVersus into the top 10.
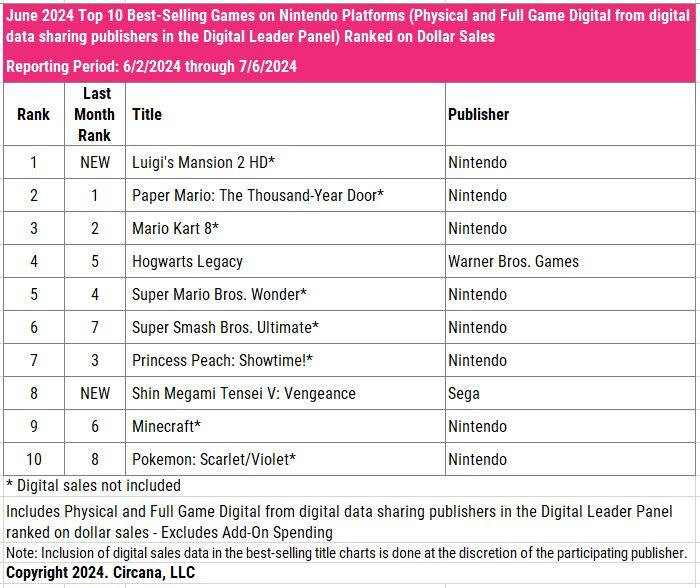
- In June, there were two new entries in the top 10 sales for Nintendo Switch - Luigi’s Mansion 2 HD and Shin Megami Tensei V: Vengeance. Note that digital versions of all Nintendo games are not included in the sales.
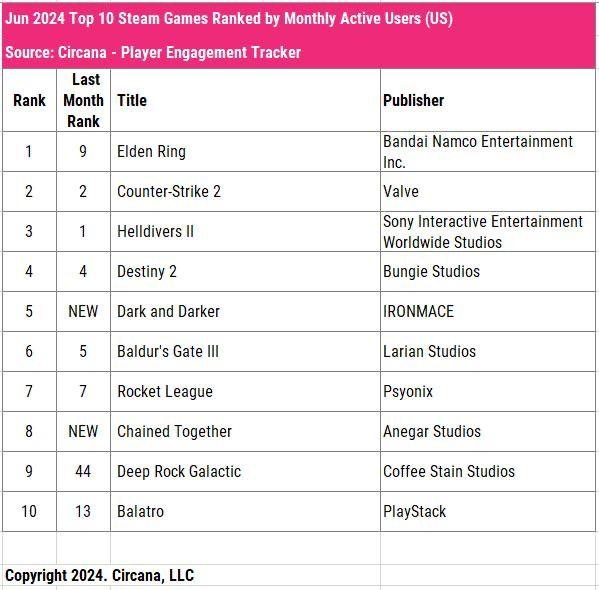
- The top MAU leaders on Steam were Elden Ring, Counter-Strike 2, and Helldivers II. There are several new entries - Dark and Darker (5th place) and Chained Together (8th place). Deep Rock Galactic and Balatro also made it into the top 10.
Games & Numbers (July 24 - August 6)

PC/Console Games
- The cumulative sales of Pokemon Scarlet and Violet have reached 25 million copies. The game was released in November 2022 and has become the third game in the Pokemon series to achieve this milestone.
- EA has released a new hit - EA Sports College Football 25. Over 5 million people bought the game at launch, with another 500,000 joining through the EA Play Trial. Of these 5 million, 2 million purchased the $100 version to get early access to the project.
- Sales of Armored Core VI have reached 3 million copies. The game achieved this mark in less than a year.
- Manor Lords earned $60 million in 3 months of early access. The publisher is very pleased with the result.
- The Fallout series has influenced how much time users spend playing the series' games. The number of hours in Game Pass for the Fallout line increased 5 times in the second quarter of 2024 compared to the first, according to Satya Nadella.
- More than 500,000 people have played Flintlock: The Siege of Dawn by Kepler Studio.
- The free Silent Hill: The Short Message has been downloaded over 3 million times.
Mobile Games
- Revenue from MONOPOLY GO! has surpassed the $3 billion mark, as reported by Hasbro in its report. The game achieved this in 473 days, faster than any other in the history of the mobile market.
- Games in the Talking Tom series have been downloaded over 23 billion times. The projects’ MAU is at 470 million. The company has more than 20 projects in its portfolio, with 70% of the audience accounted for by the Tamagotchi-like games - My Talking Tom and My Talking Angela.
- Hero Wars: Alliance has earned more than $1.5 billion since its launch in 2017. During this time, the game has been downloaded over 150 million times. In the fall of 2023, GDEV reported revenue of $1.2 billion.
- According to Sensor Tower, Whiteout Survival has reached $1 billion in revenue. Among games released in 2023, it trails only MONOPOLY GO! and Honkai: Star Rail in revenue growth. 35% of the revenue comes from the US, followed by South Korea, Japan, and Taiwan. Interestingly, Saudi Arabia is second in downloads.
- GachaRevenue reports that Zenless Zone Zero earned $99.8 million on mobile devices in its first month. The portal relied on Sensor Tower data and calculated revenue from Chinese Android stores by multiplying the Chinese iOS revenue by 1.75. The methodology is understandable, but I cannot vouch for its accuracy.
- Sensor Tower reports that Solo Leveling: Arise earned over $100 million in the three months after its release. South Korea accounts for 33% of the revenue, while the US accounts for 19%.
- Game of Thrones: Legends by Zynga earned its first million dollars in revenue. The game took 11 days to achieve this, and its current daily revenue is $100,000. The data is based on AppMagic figures.
- The daily audience of ROBLOX reached 79.5 million people in the second quarter of 2024, a 21% increase from the previous year.
- Blood Strike by NetEase has received over 50 million installations in less than a year. The game was released in soft launch on October 28, 2023.
- Seekers Notes by MYTONA has been downloaded 43 million times in its 9 years of operation. AppMagic notes that in the second quarter of 2024, the game earned $8.7 million in IAP (figure after store fees and taxes).
Sensor Tower: Mobile Market in Q2 2024

Revenue - IAP, Gross (before commissions and taxes)
Overall State of the Mobile Market
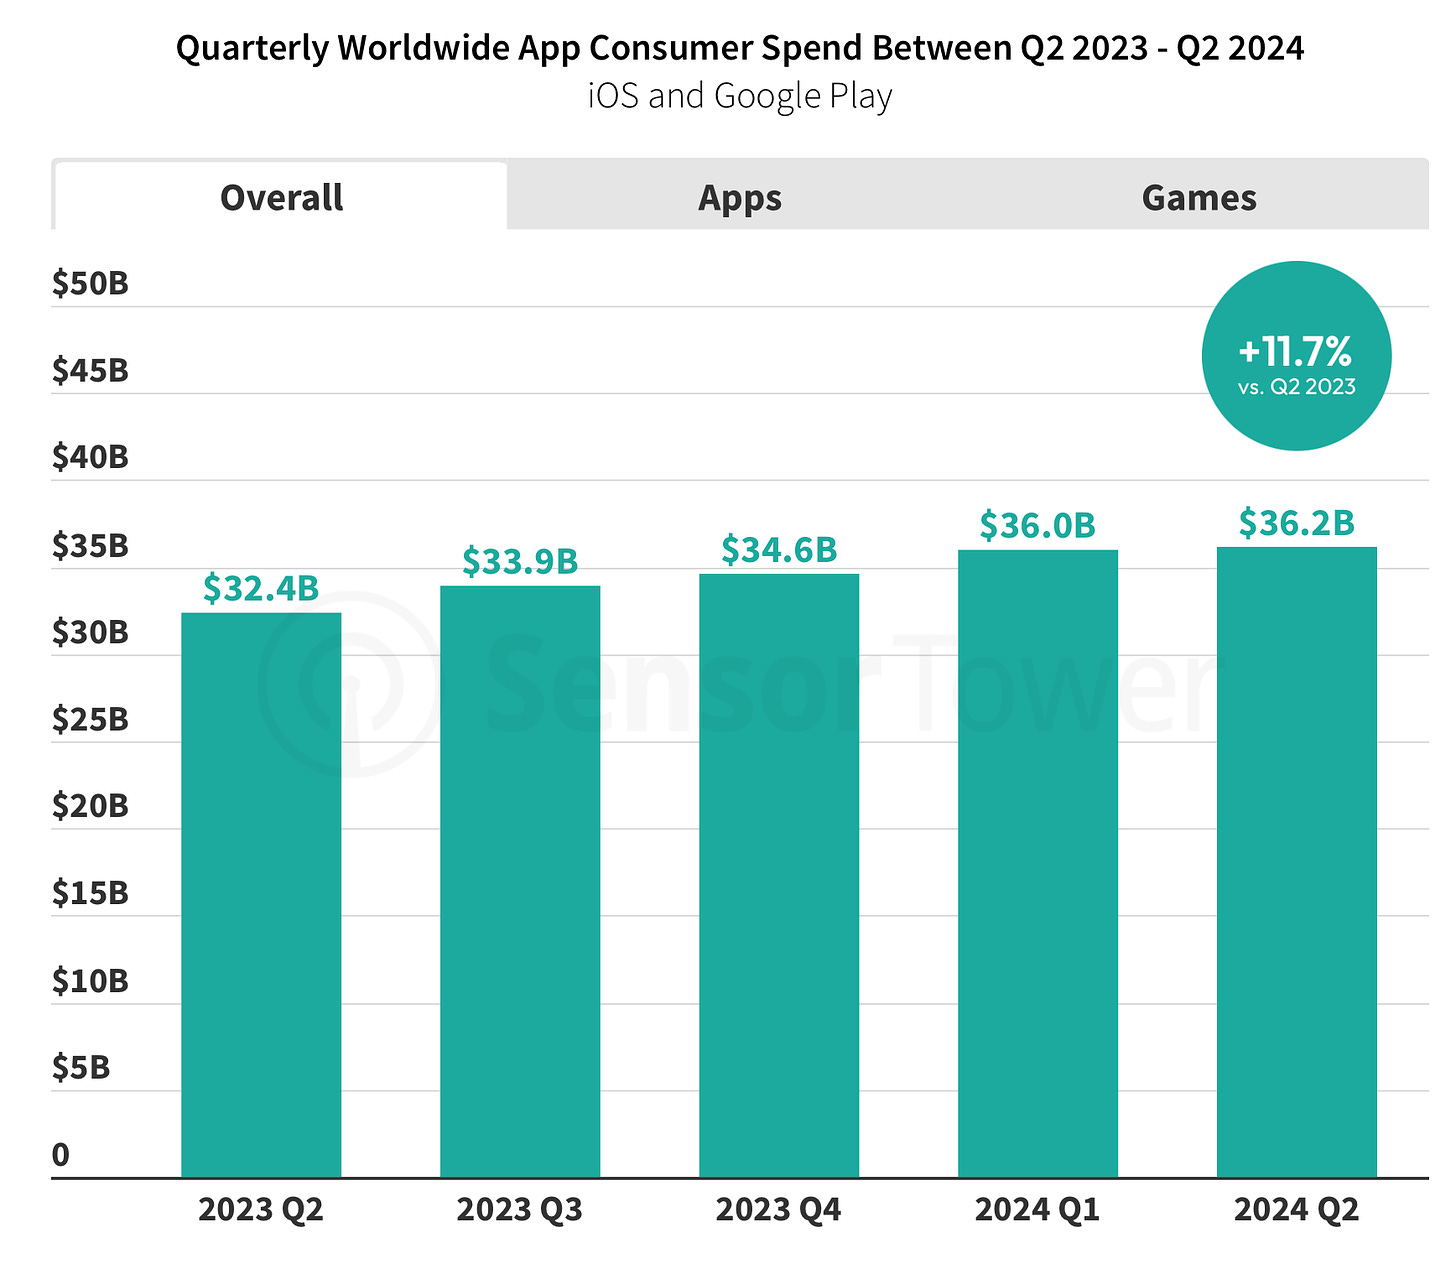
- The total IAP revenue of the mobile market amounted to $36.2 billion in Q2 2024. Growth compared to Q2'23 is 11.7%. Non-gaming apps grew by 21.8% year-on-year to $16.5 billion, while gaming apps grew by 4% year-on-year to $19.7 billion.
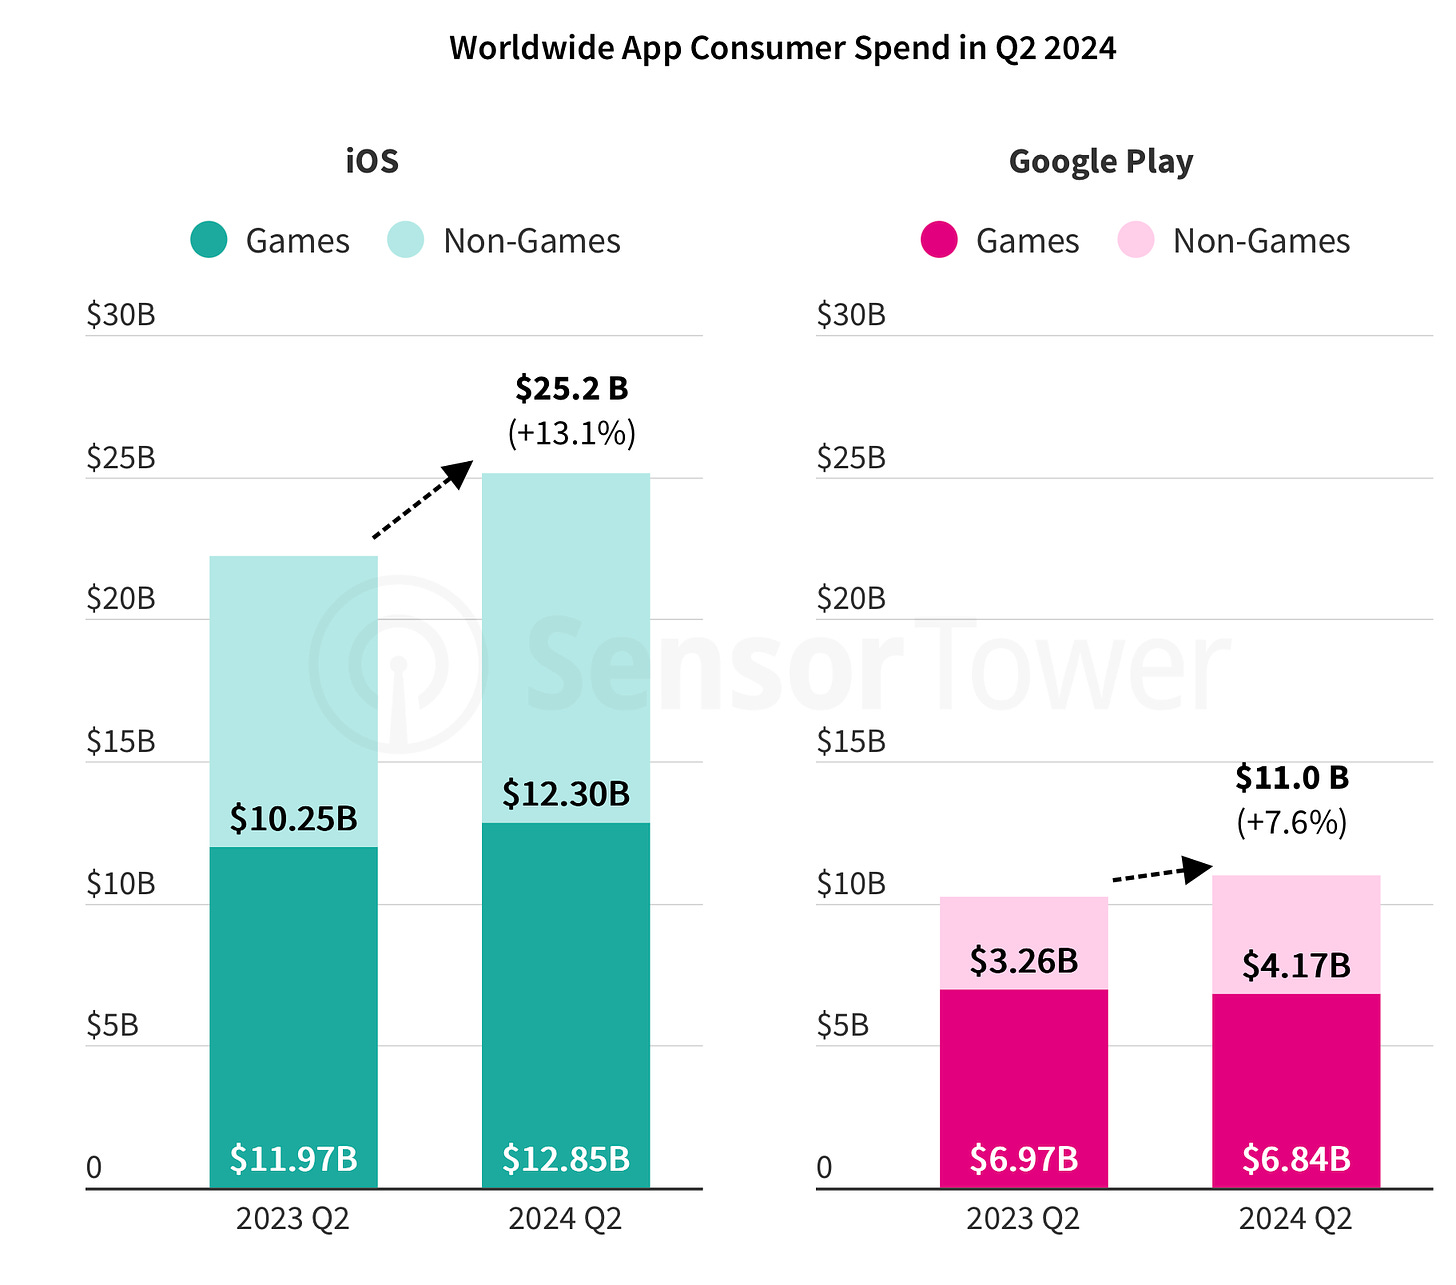
- Non-gaming revenue grew on both iOS and Android. However, gaming revenue grew only on iOS, from $11.97 billion in Q2'23 to $12.85 billion in Q2'24. On Android, gaming revenue fell from $6.97 billion to $6.84 billion over the same period.
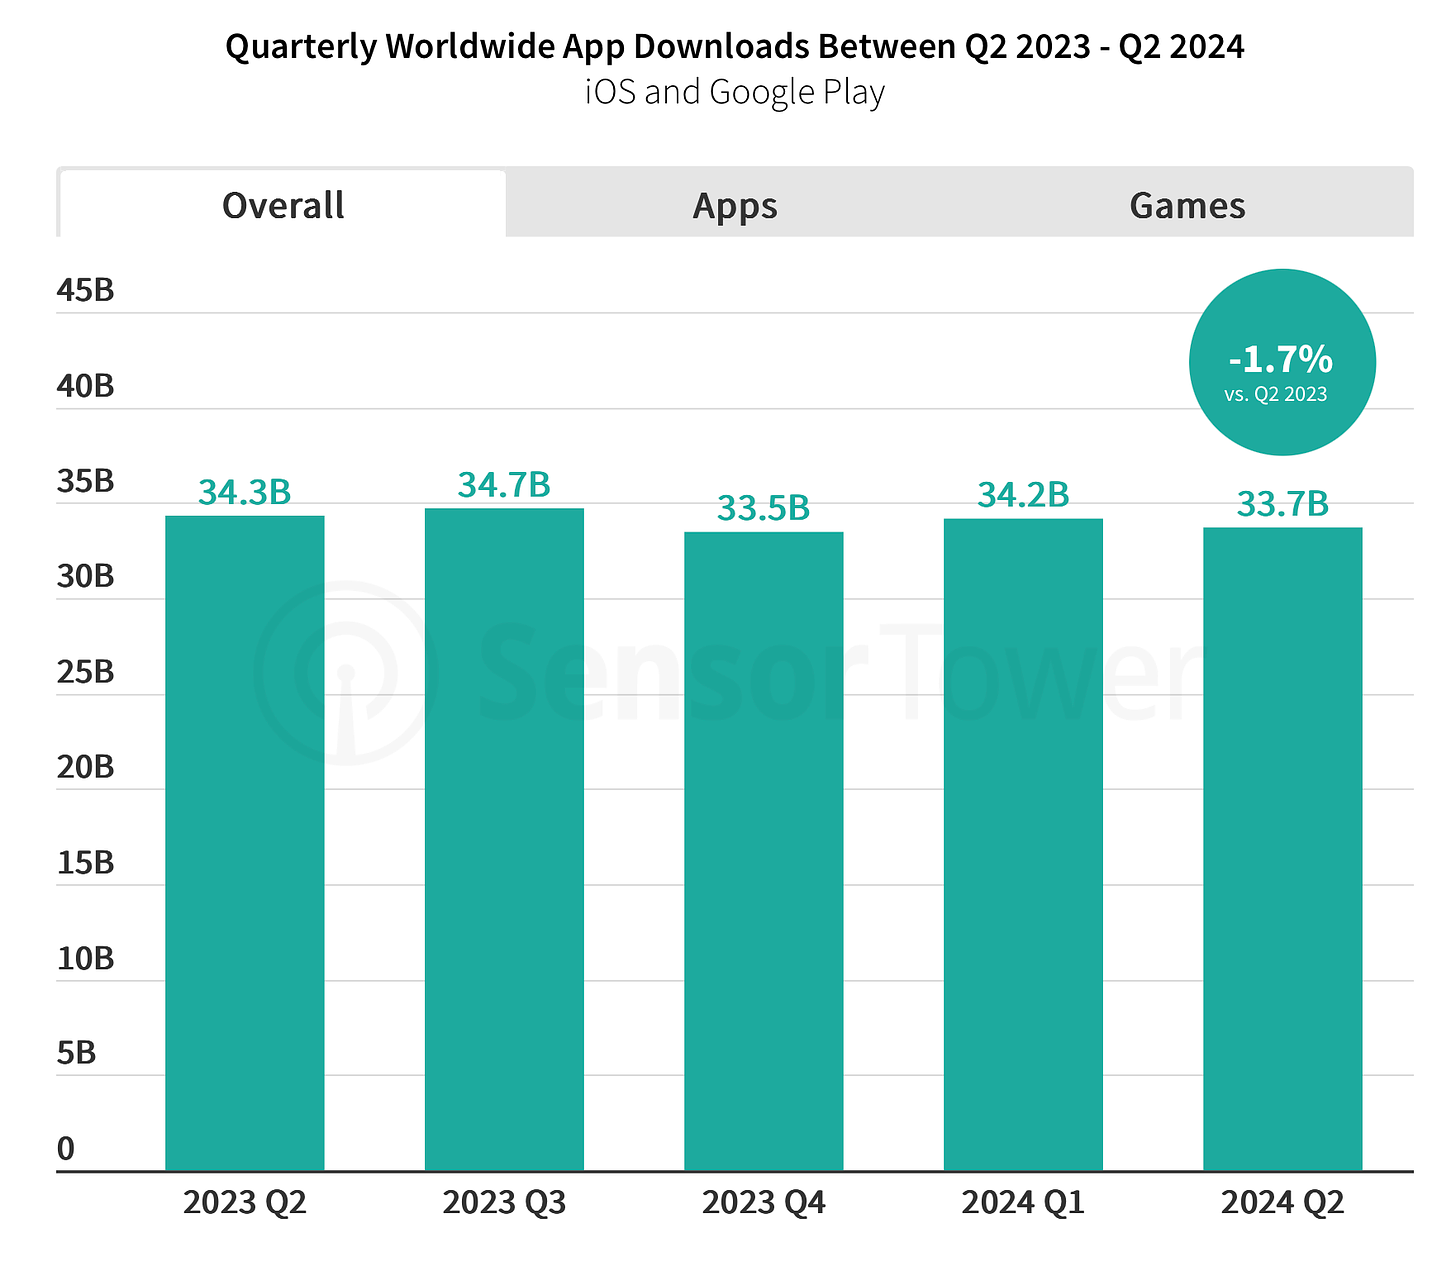
- Downloads in Q2 across all apps fell by 1.7% YoY to 37.7 billion. Non-gaming app downloads increased by 0.9% (to 21.1 billion), while game downloads fell by 6.4% YoY to 12.6 billion. For instance, downloads in the US reached their lowest level since 2018, indicating that the market has matured according to Sensor Tower.
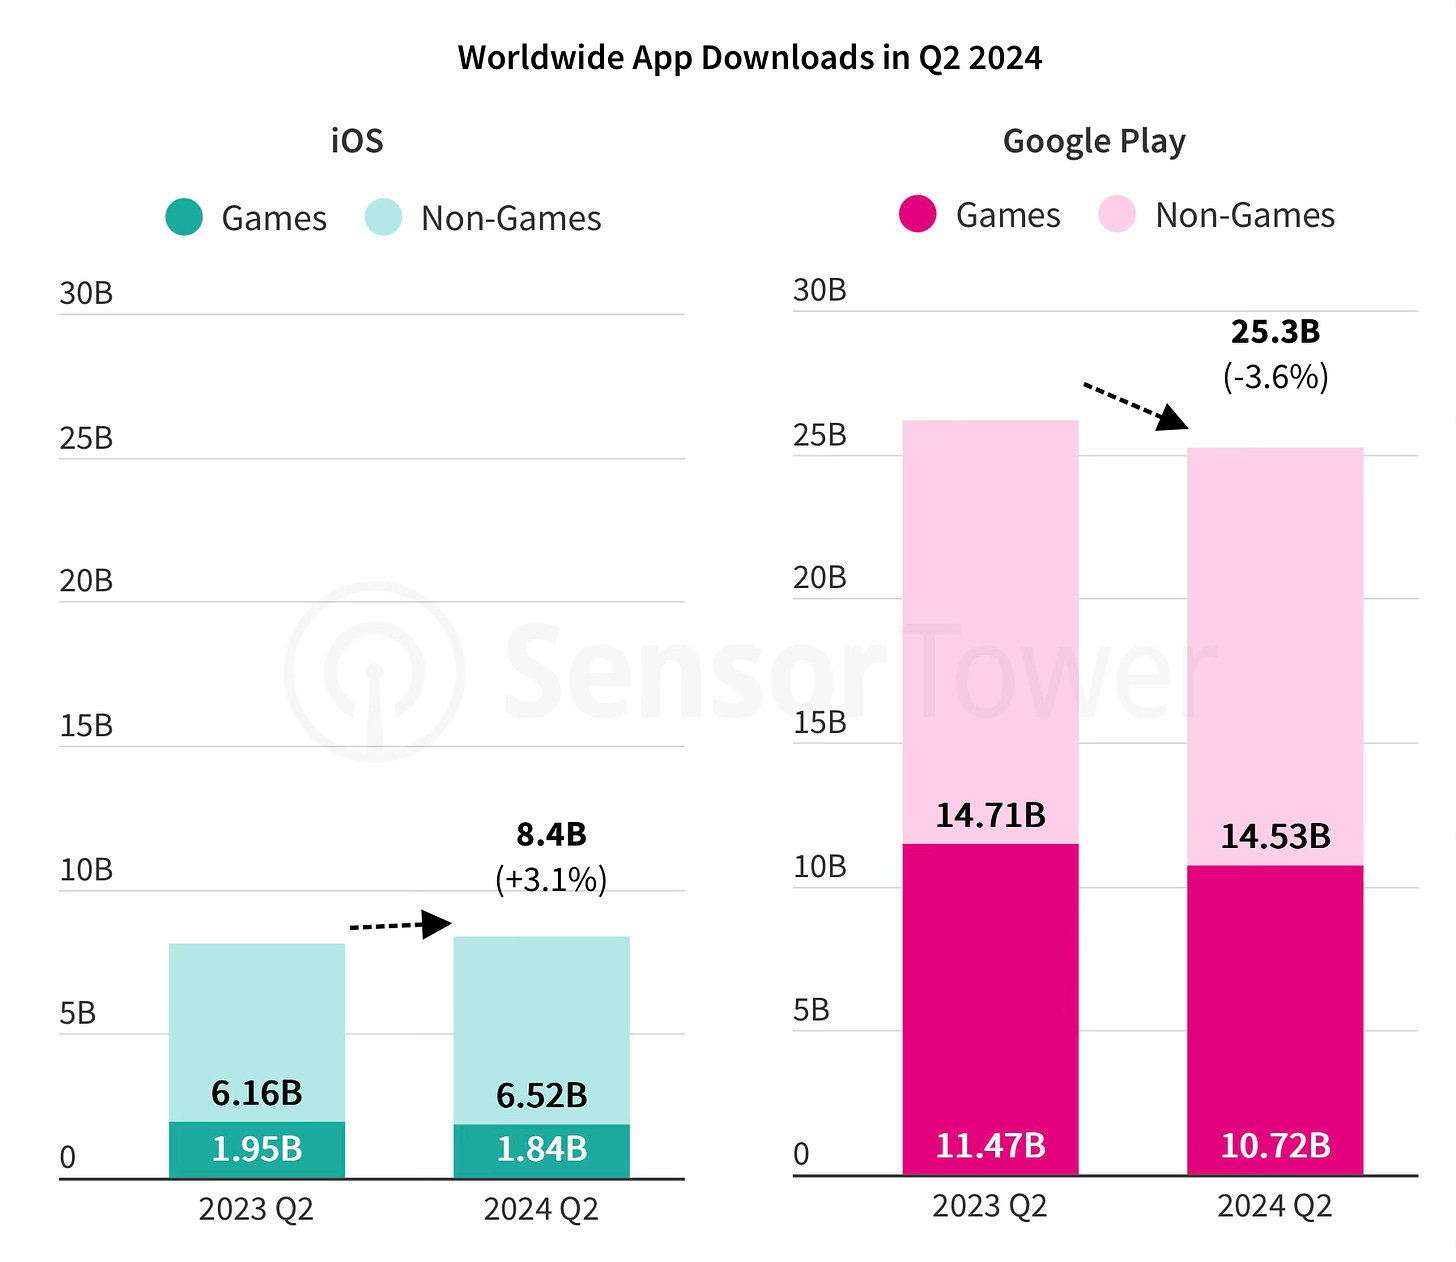
- iOS downloads dropped from 1.95 billion in Q2 2023 to 1.84 billion in Q2 2024. On Android, downloads decreased from 11.47 billion to 10.72 billion over the same periods.
Gaming Market State
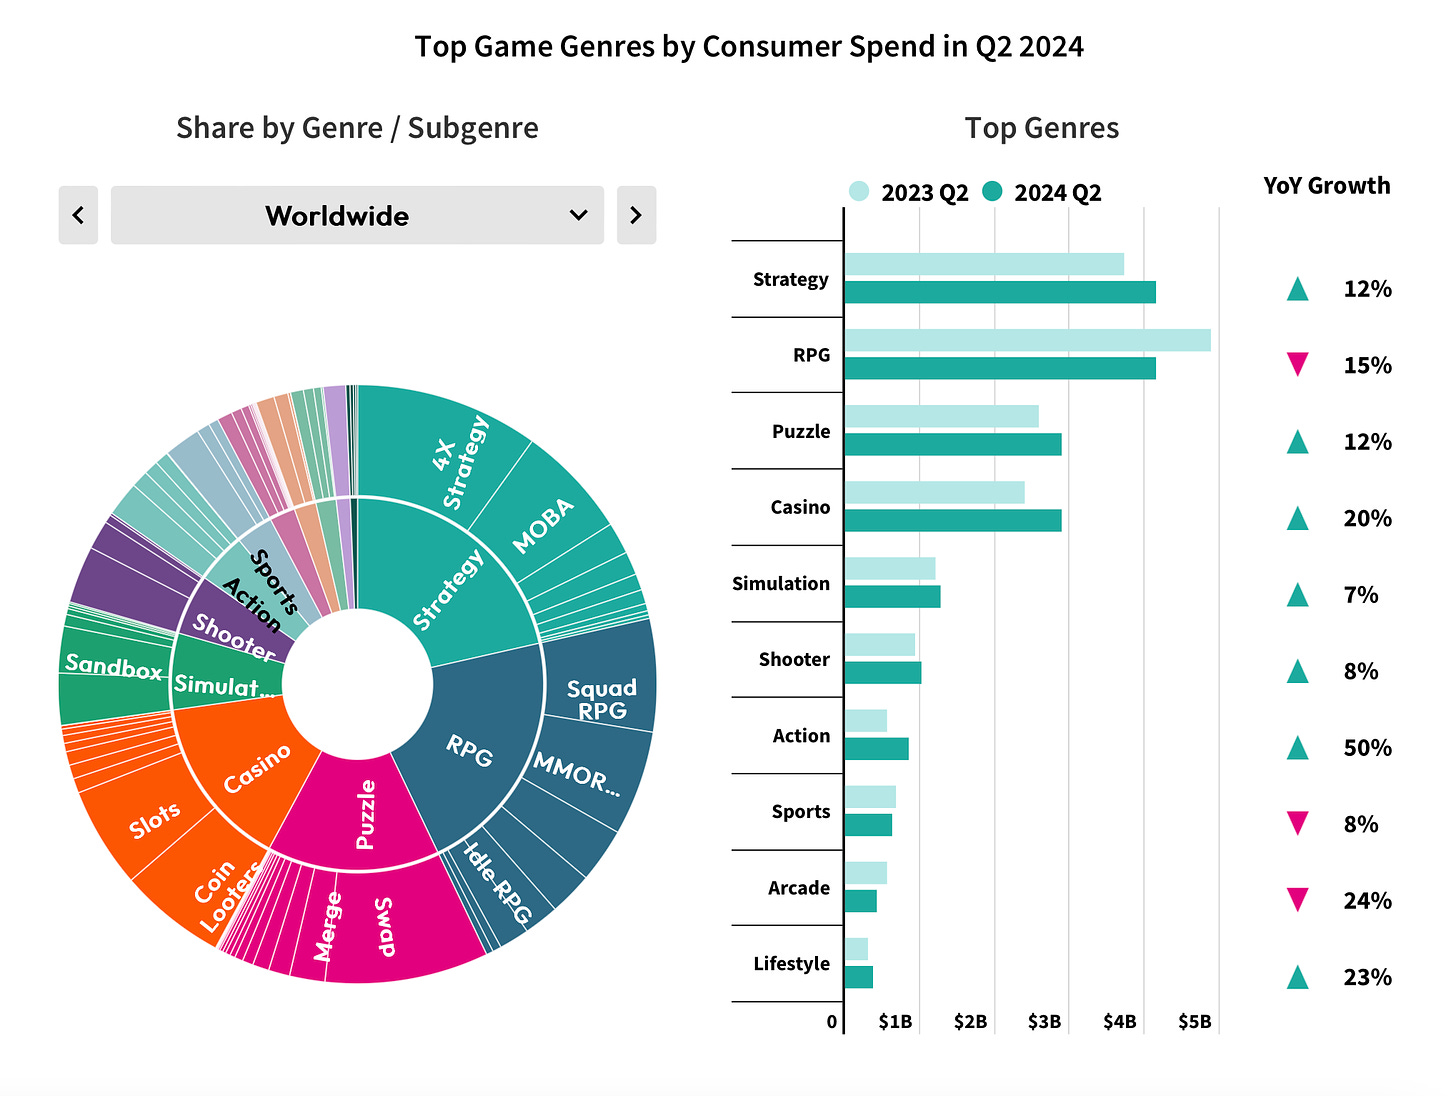
- For the first time since 2017, RPG is not the highest-grossing genre. It was overtaken by strategy games (up 12% YoY in Q2'24), while RPGs saw a 15% drop in revenue. Arcades (-24% YoY) and sports games (-8% YoY) also saw declines.
- Revenue growth in Q2'24 compared to Q2'23 was seen in action games (+50%), lifestyle projects (+23%), casino games (+20%), and puzzles (+12%).
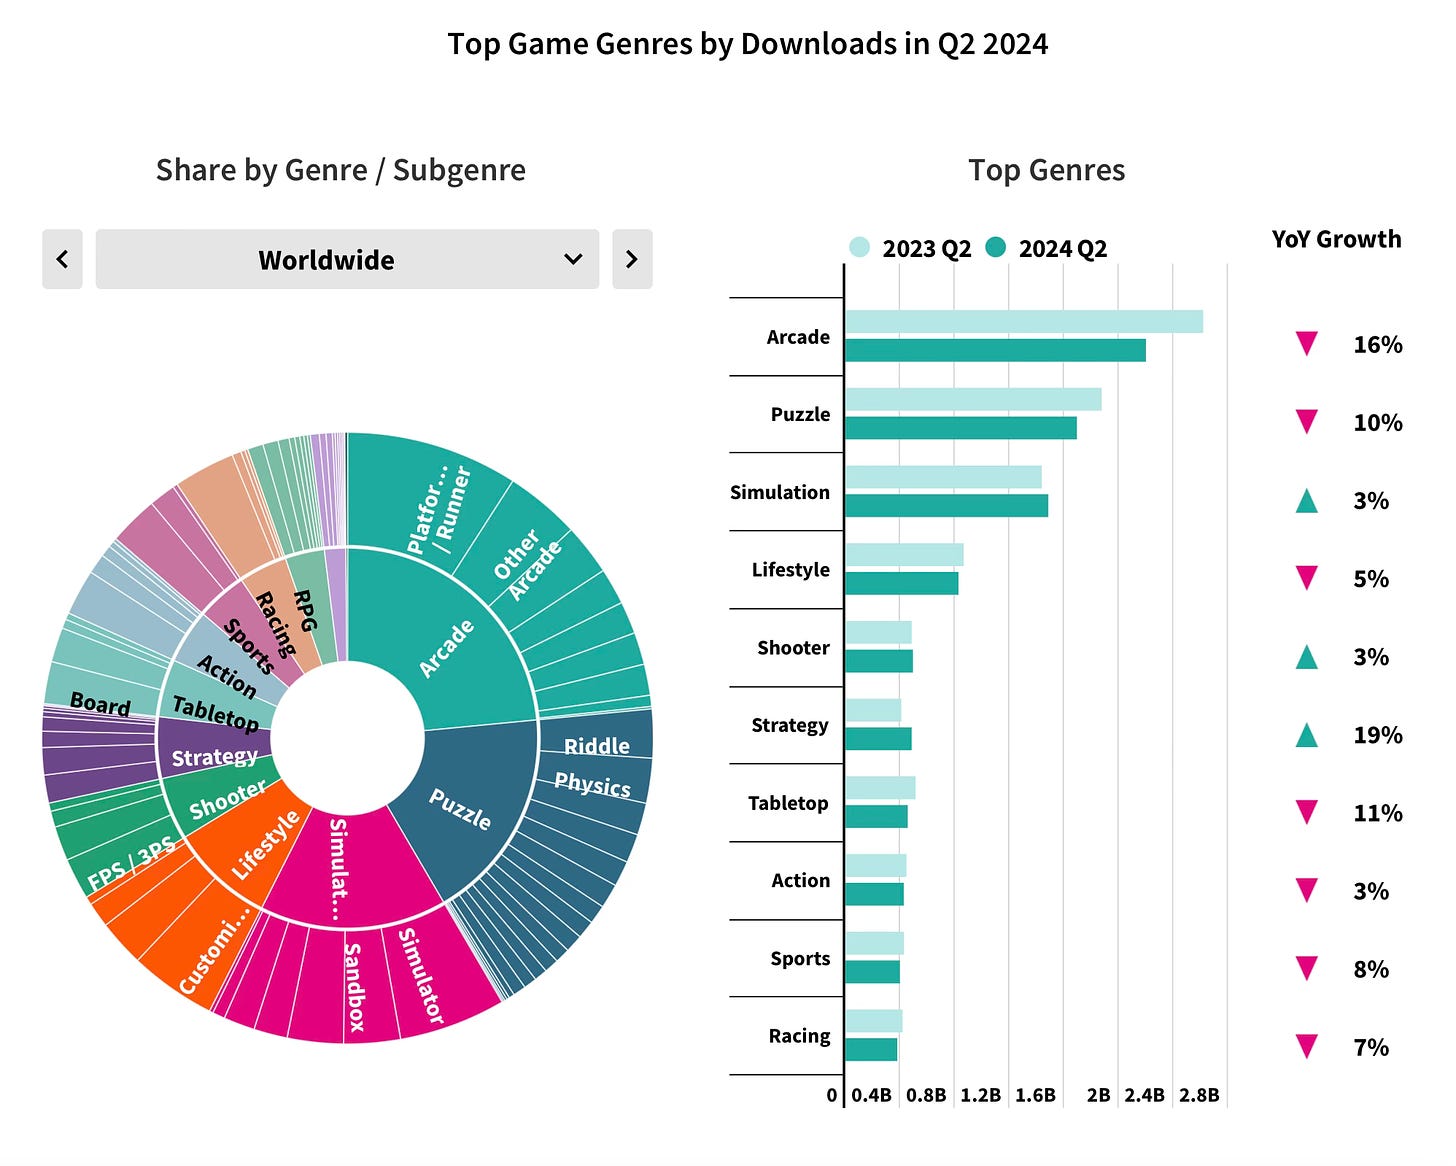
- However, the download situation is less positive. Only strategy (+19% YoY), shooter (+3% YoY), and simulation games (+3% YoY) saw growth in downloads in Q2'24.
Most Successful Games
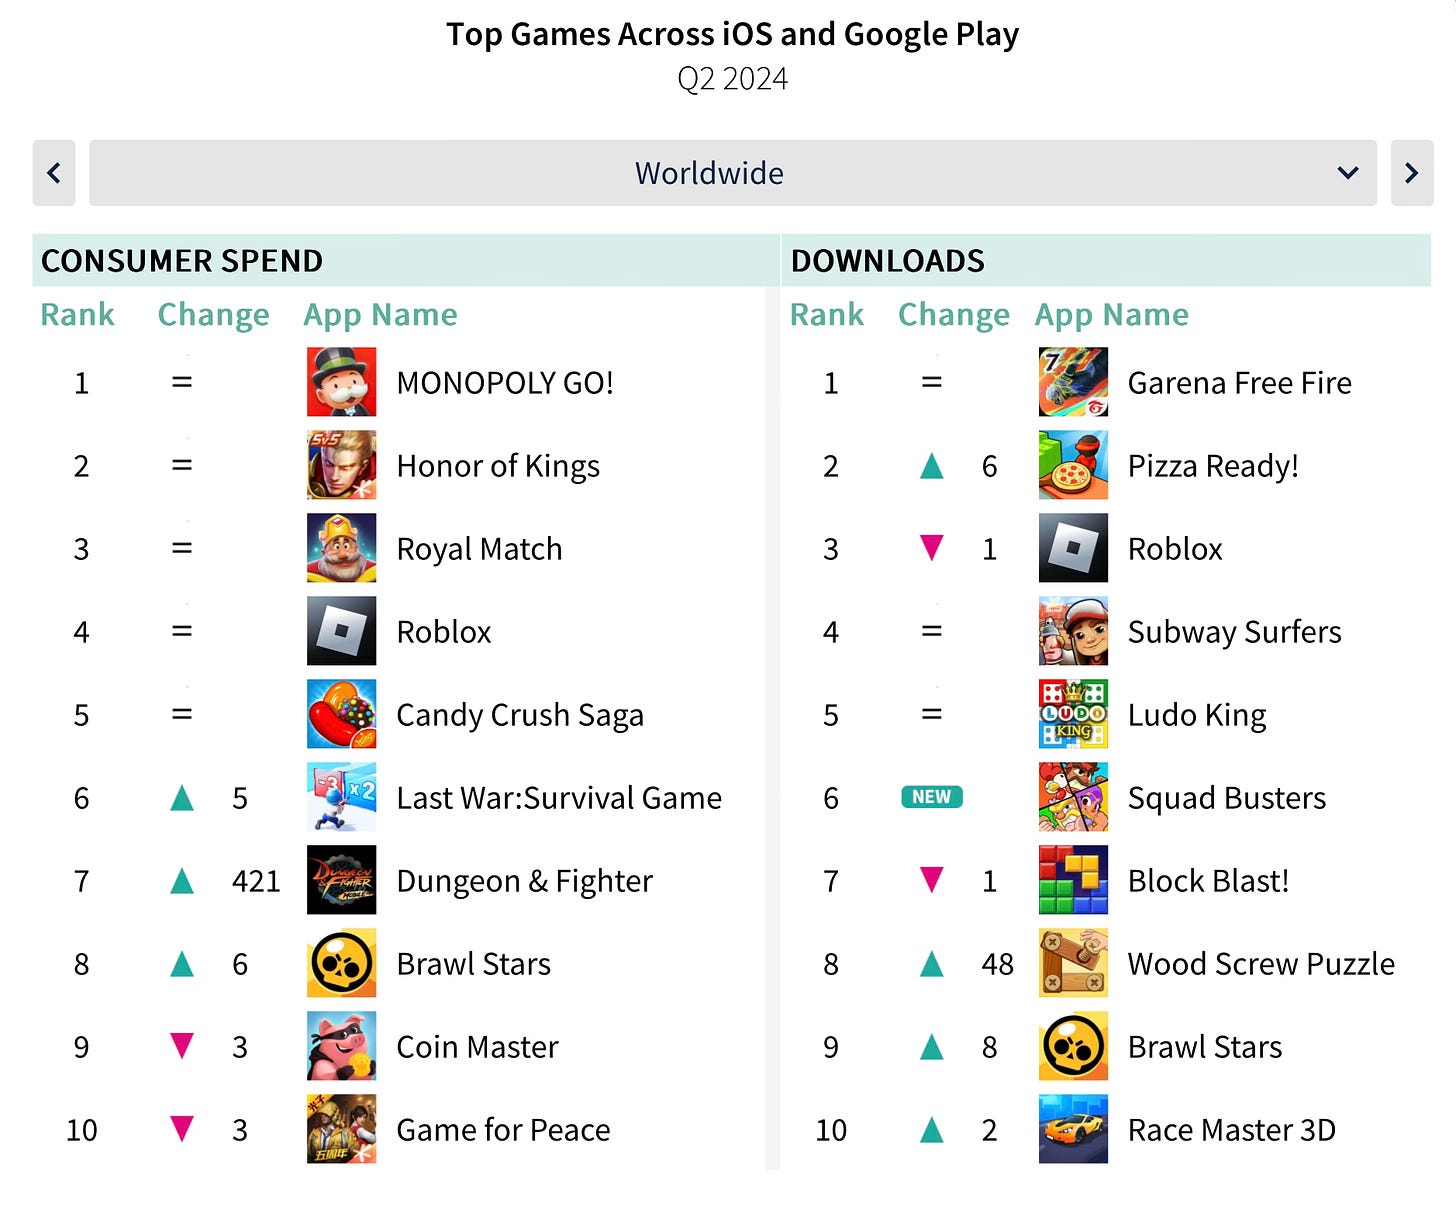
- The leaders in Q2'24 by revenue were MONOPOLY GO!, Honor of Kings, Royal Match, Roblox, and Candy Crush Saga. Dungeon & Fighter, which was released in May, also made it into the top 10.
- The leaders by downloads were Garena Free Fire, Pizza Ready!, Roblox, Subway Surfers, and Ludo King. Squad Busters also entered the ranking at 6th place.
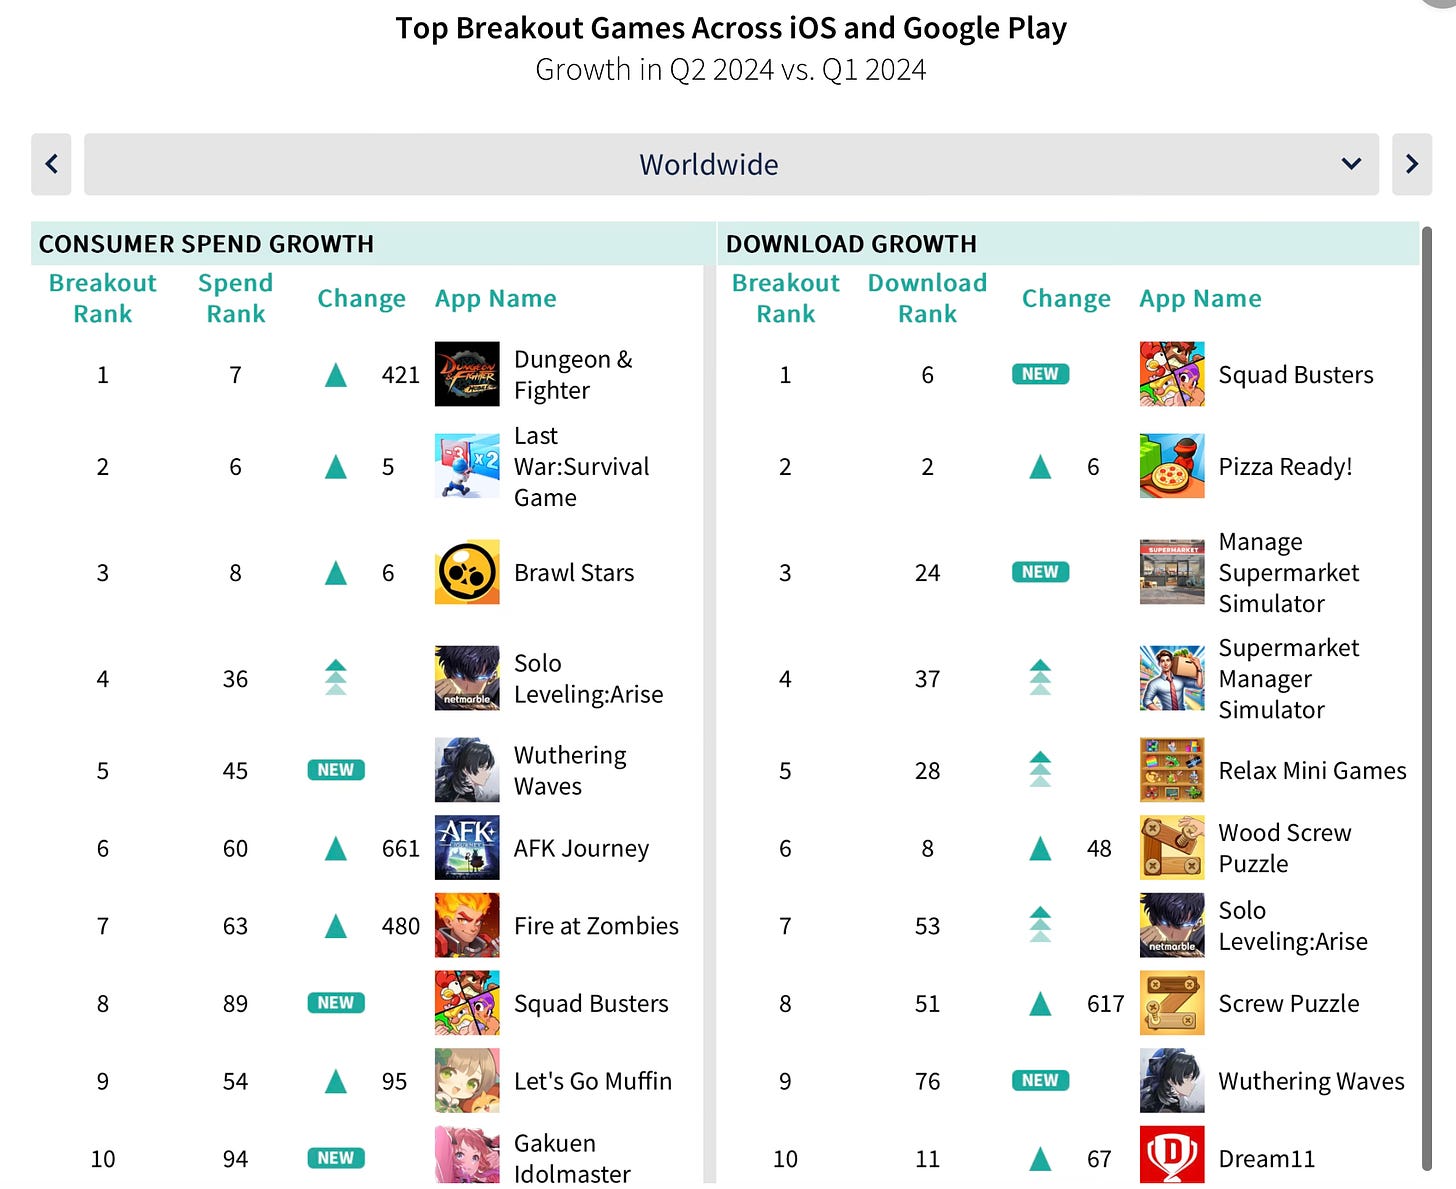
- The leaders in revenue growth for the quarter were Dungeon & Fighter, Last War: Survival Game, Brawl Stars, Solo Leveling: Arise, and Wuthering Waves. In terms of downloads, the leaders were Squad Busters, Pizza Ready!, Manage Supermarket Simulator, Supermarket Manager Simulator, and Relax Mini Games.
Advertising Market Overview
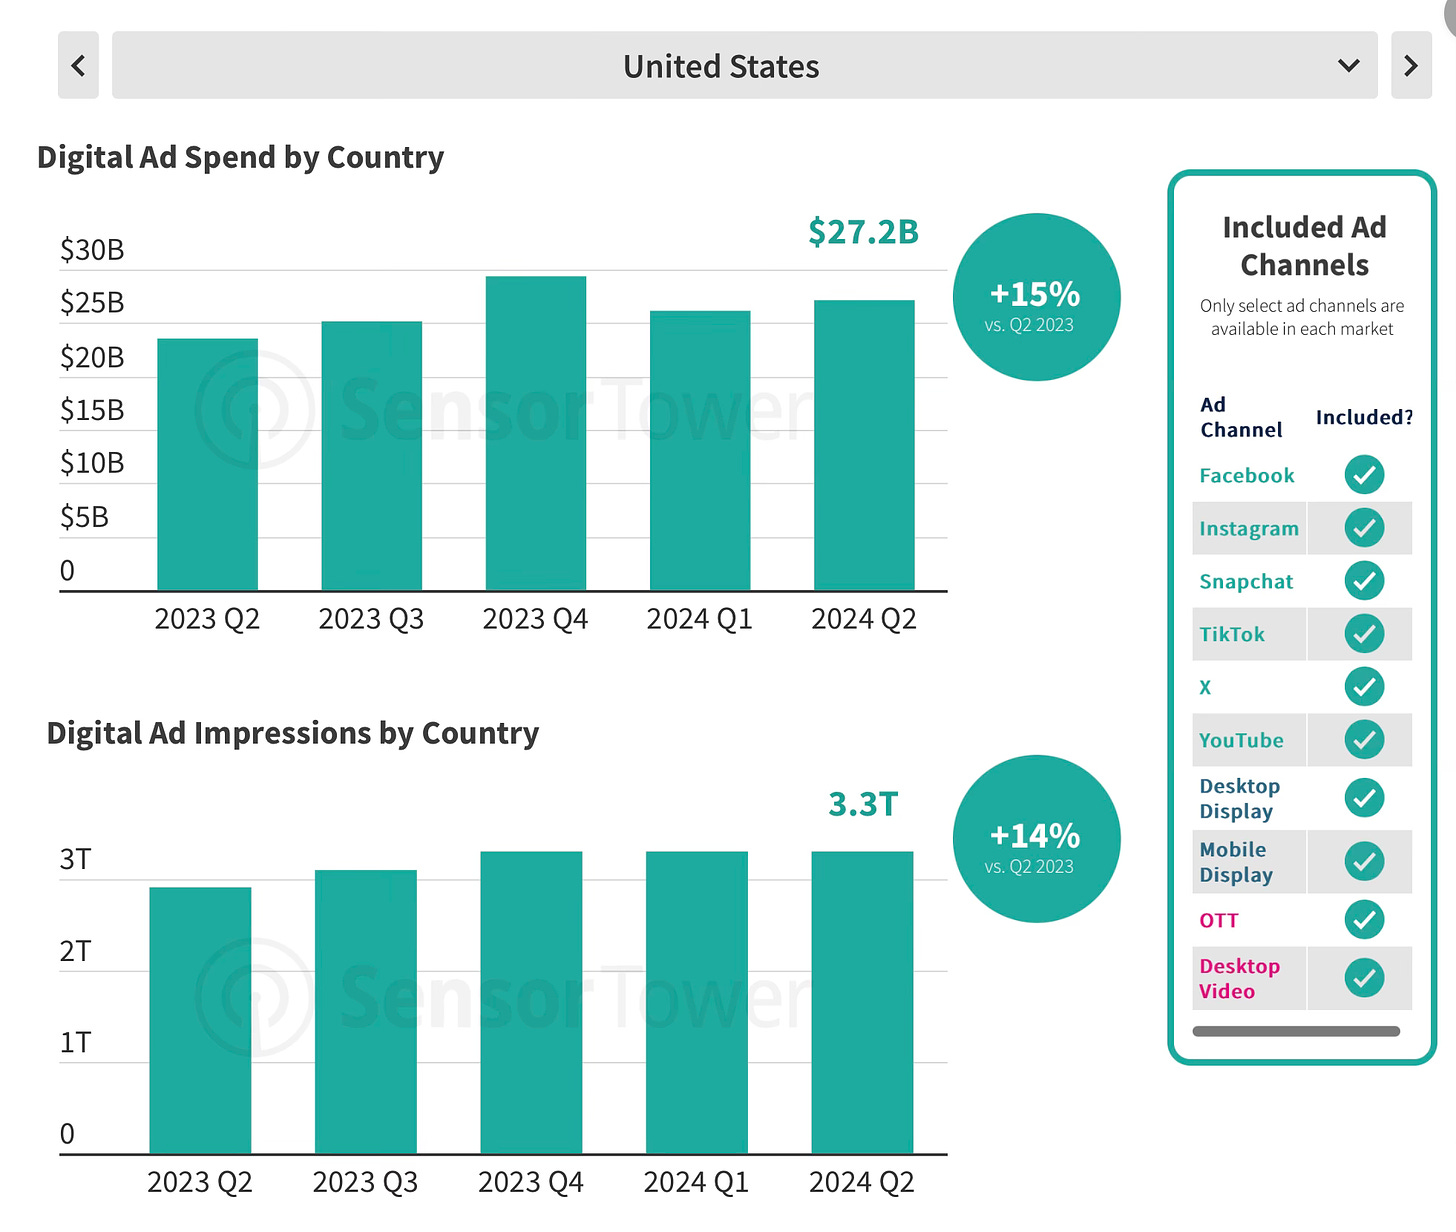
- Digital advertising spending grew by 10-25% in North America, Europe, and Latin America in Q2 2024.
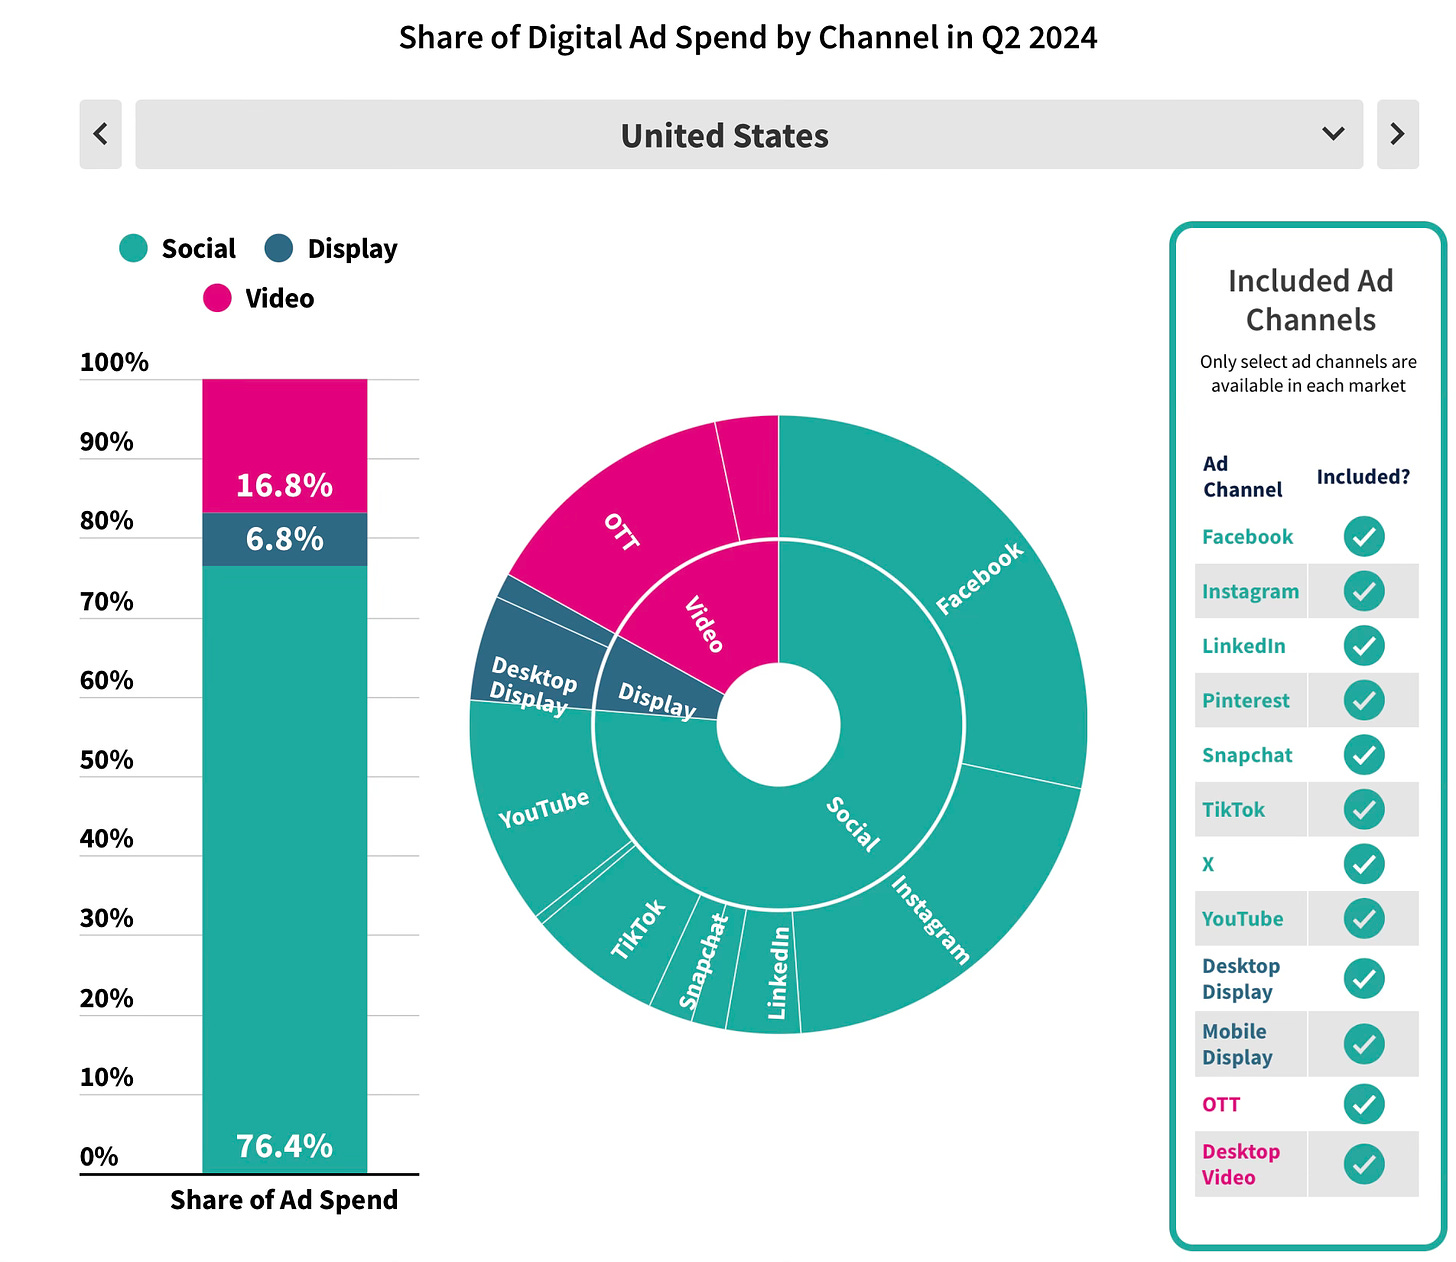
- Social networks account for 3/4 of marketing spending in the US, Latin America, and Europe.
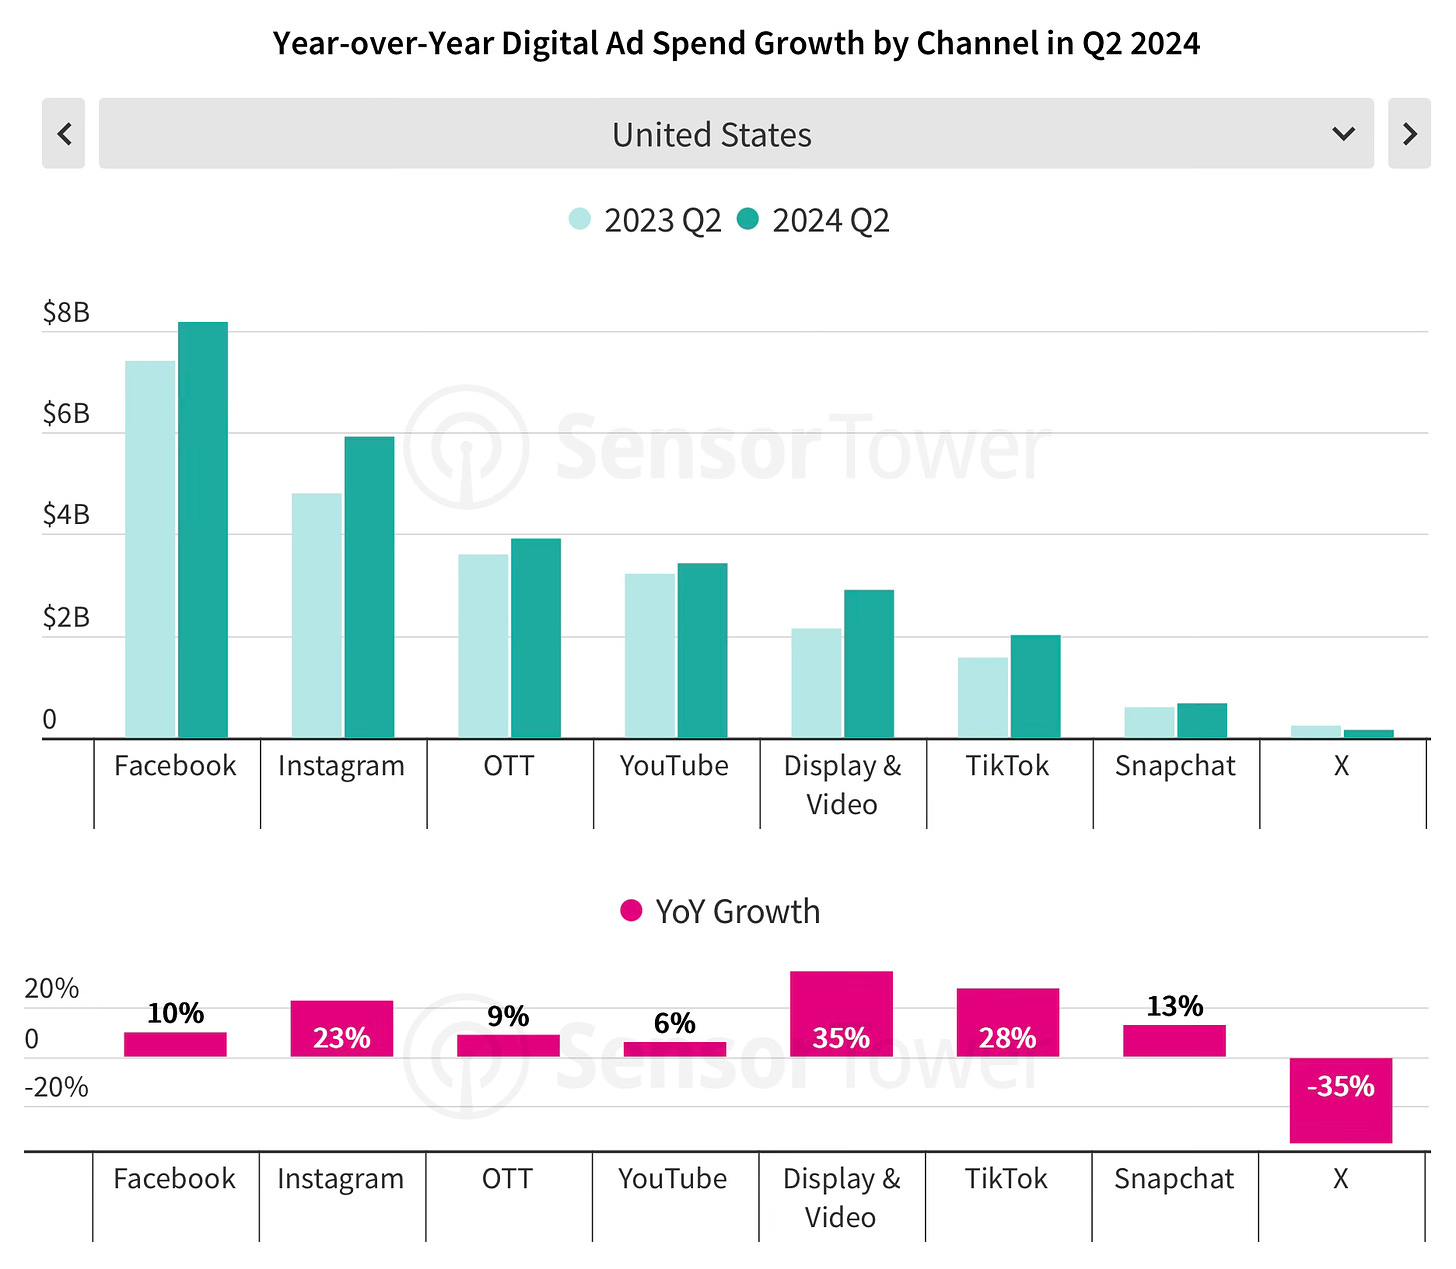
- Meta's products dominate the advertising market in the US. However, TikTok showed an impressive 28% growth when comparing Q2'24 with Q2'23. The video advertising segment, especially OTT, grew significantly, up 35% over the same period.
- The only platform that saw a decrease in ad volume in Q2'24 was X (Twitter), which fell by 35% YoY.
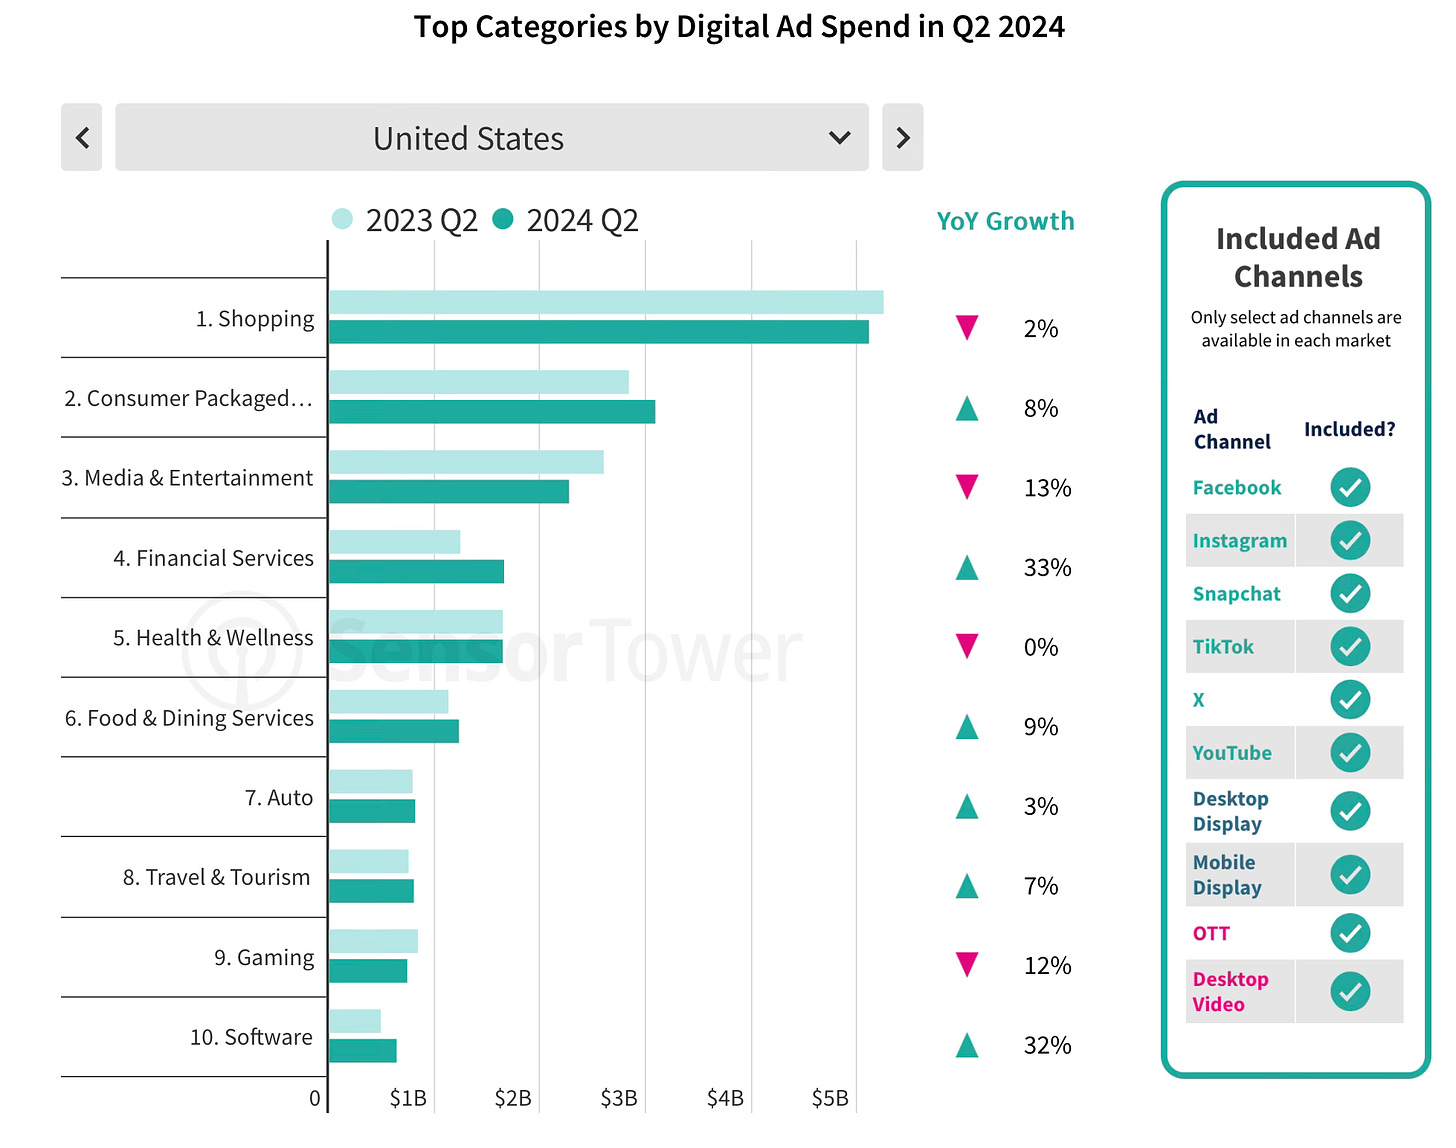
- The growth in spending is driven by non-gaming apps. Spending on gaming apps is falling in North America, Latin America, and Europe.
- Noteworthy is the case of Squad Busters. Supercell's large-scale advertising campaign allowed Tencent to become the leader in advertising growth in Q2'24. More than 70% of the advertising spending for the Squad Busters campaign was on YouTube. Supercell also actively invested in advertising for Brawl Stars.
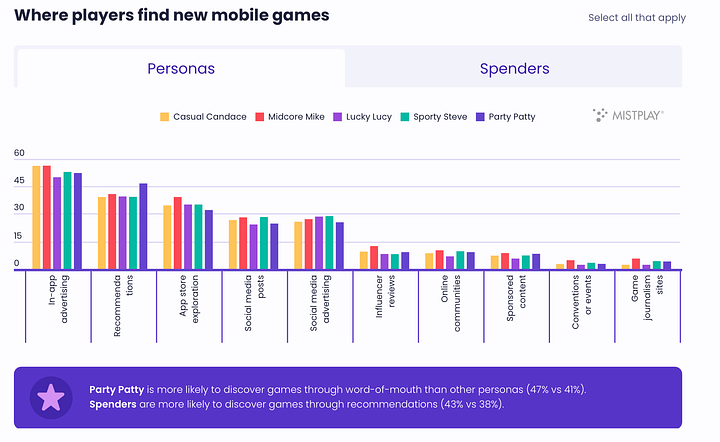
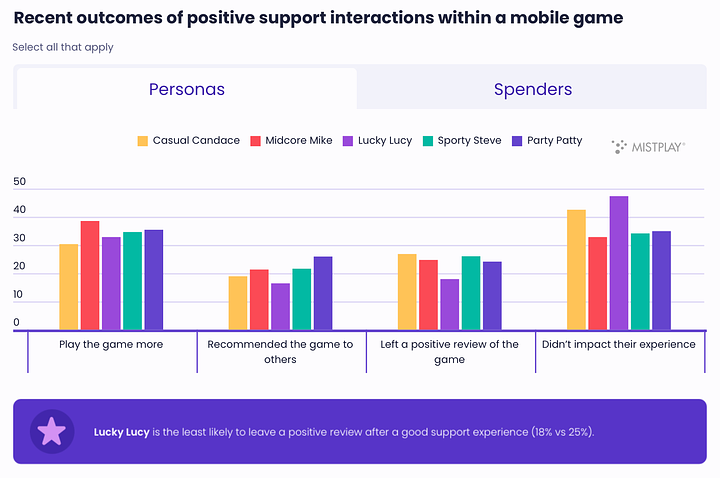
Mistplay: The Influence of social factors on the mobile gaming audience

The data is based on a survey of 2,300 mobile gamers over the age of 18 in North America. The entire sample consists of the Mistplay audience, and the survey was conducted in June 2024.
How people discover games
- In-game ads (54%), recommendations from friends (41%), and searching in the App Store (36%) are the most popular ways to discover new games. 27% of people learn about games through social media.
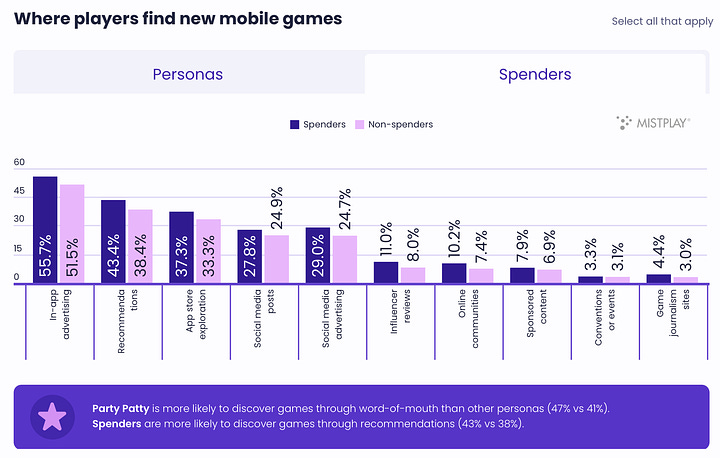
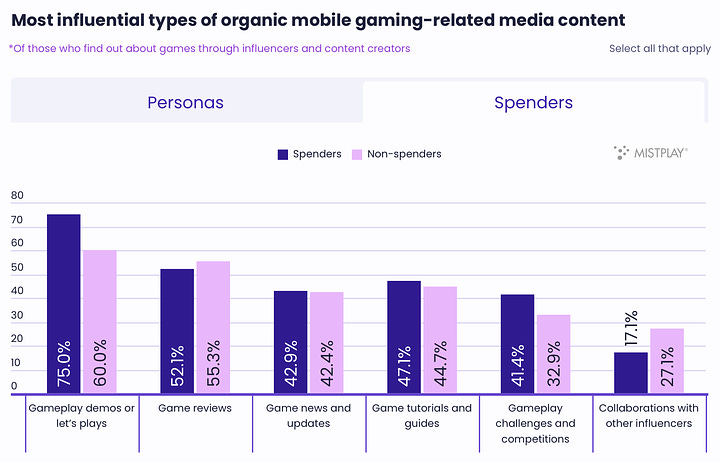
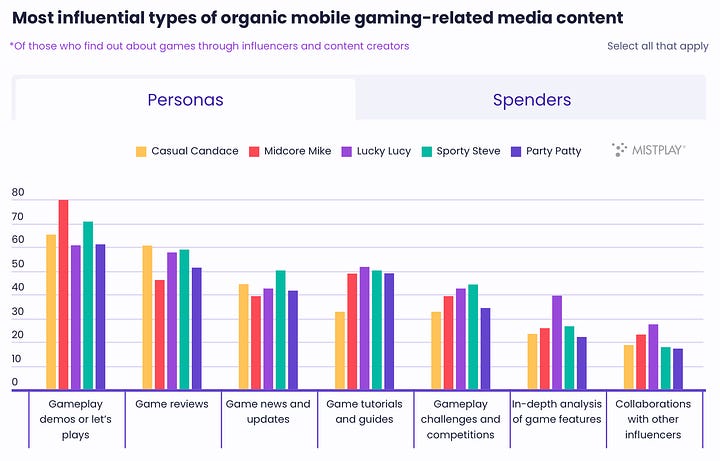
- Gameplay videos, reviews, news, and game updates are the most popular types of gaming content among those who discover new games through influencers and social media.
What Influences a people’s decision before Installation
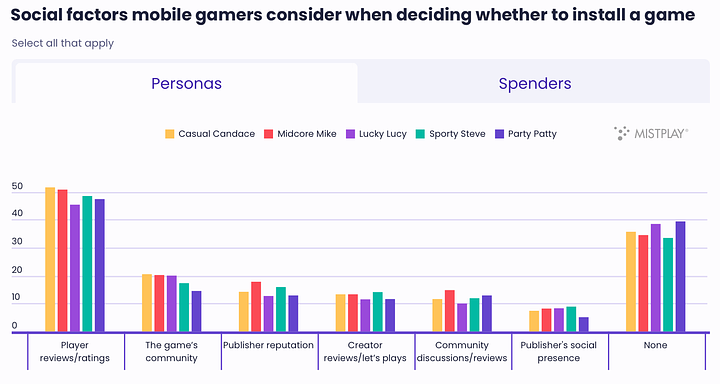
- Half the users (exactly 50%) pay attention to ratings and reviews before installation. 24% of them consider these factors very important. 16% don’t care.
- 19% of users consider the community around a project before downloading. 36% don’t care about this at all.
- Before downloading, the top three most important aspects for users are visuals, descriptions, and ratings.
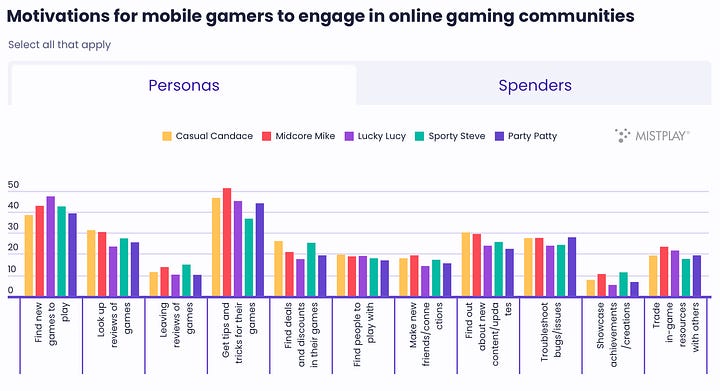
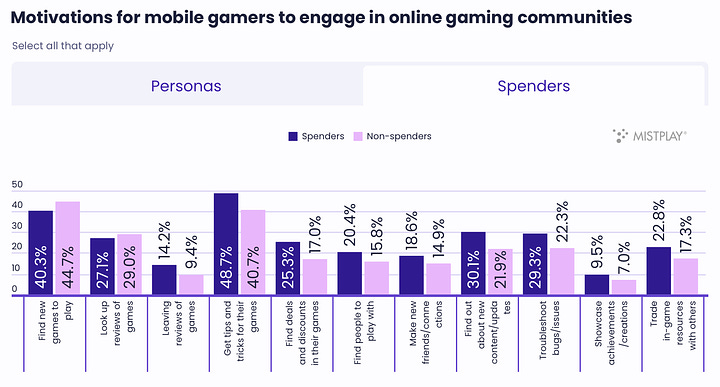
Community and Engagement
- 23% of users actively participate in gaming communities. 44% take part passively; 33% do not participate at all.
- The most popular platforms are Facebook (69%); YouTube (33%); Discord (28%); Instagram (21%).
- 53% of users use gaming communities to find information about the game. 22% follow related content creators. 18% interact with other gamers.
- In communities, people search for tips (45%), new games (42%), read reviews (28%), try to solve problems (26%), and get news about the latest updates (26%).
- People expect developers to share interesting tips and secrets in communities (55%); run giveaways (47%); share discounts (37%), and provide updates (32%). Only 6% are interested in UGC (user-generated content).
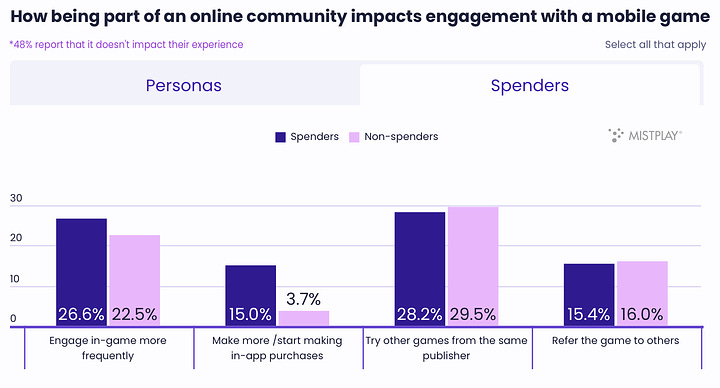
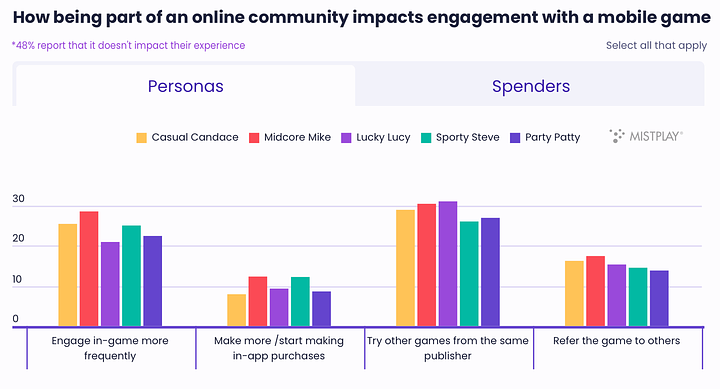
- 29% of users noted that they are likelier to try a game from the same publisher. 25% said they play a game more often if they are part of a community. And 15% of paying users mentioned that they spend more on in-app purchases (IAP) if they are part of a community.
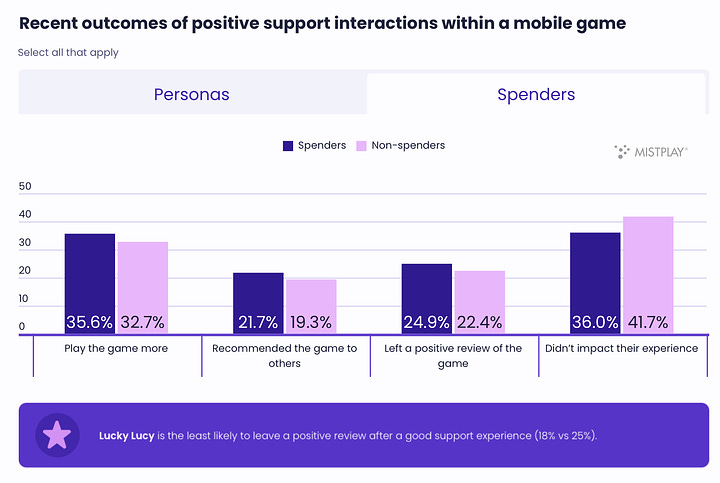
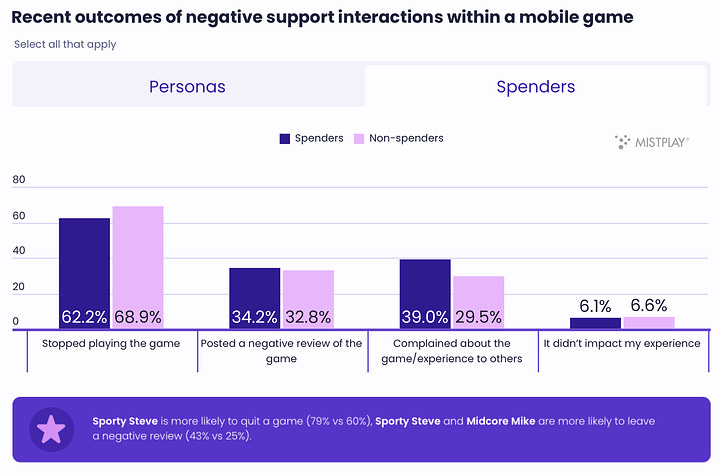
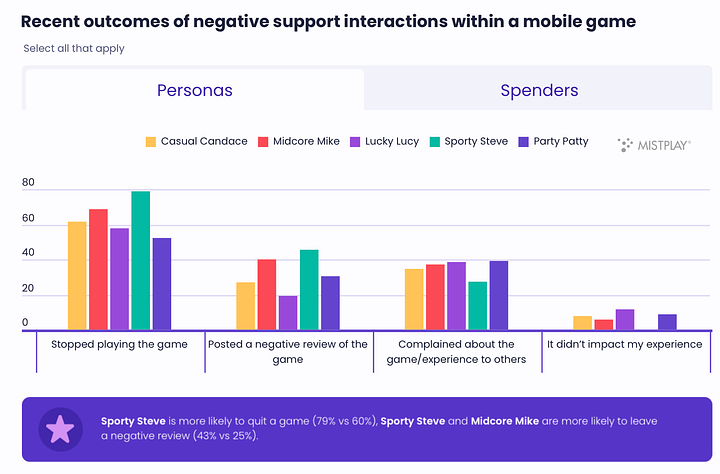
Reviews and Support
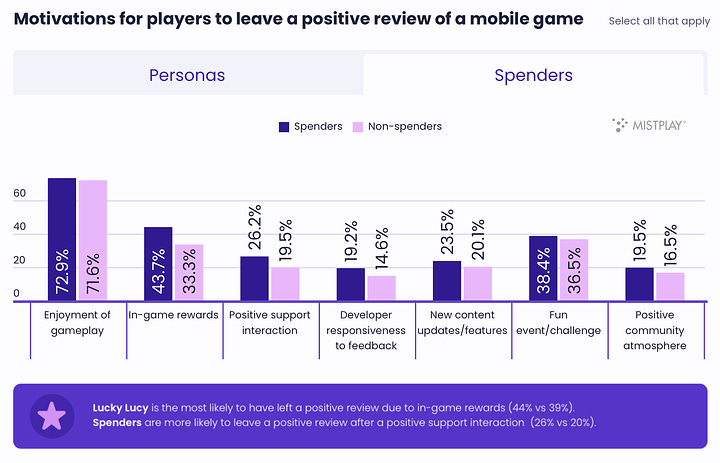
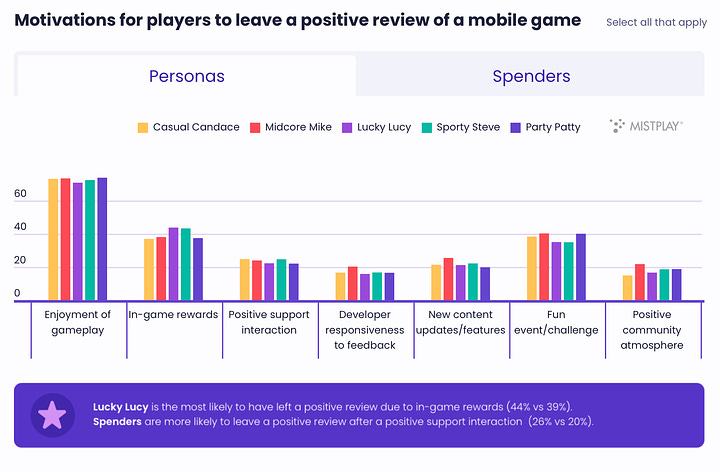
- A good experience with customer support leads to people spending more time in the game (36%) and leaving positive reviews (25%). On the other hand, a negative experience drives users away from the game (62%), makes them complain to friends (39%), and leave negative reviews (34%).
❗️This example clearly shows that people are more likely to share negative experiences.
- 50% of mobile gamers who left a bad review did so due to technical issues. 47% - due to an abundance of ads or IAP. 36% because the game content didn’t meet their expectations.
Amir Satvat: The situation with layoffs in the Gaming market is improving

In his LinkedIn account, Amir reported forecasts for layoffs in 2024 have been lowered. In July, there were significantly fewer layoffs than expected.
- The total number of layoffs in 2024 so far is 11,455. It is expected that another 2,687 people will lose their jobs by the end of the year. While this is a large number, the previous forecast was almost twice as high—4,463 people. In total, it is expected that 14,142 people will be forced to seek new employment in 2024.
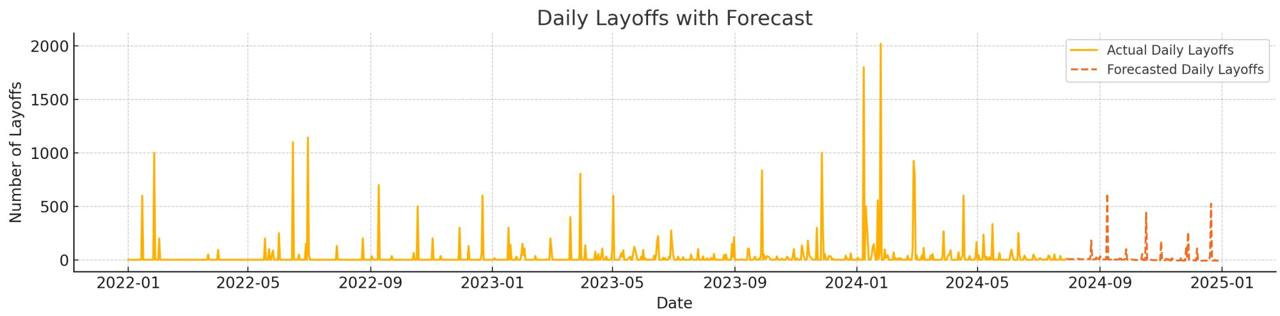
- In 2023, 10,137 people lost their jobs in the gaming industry. In 2022, the number was 8,098.
❗️Amir Satvat has been helping people find jobs for several years. His website offers all the necessary resources dedicated to finding new employment opportunities.
Singular: Mobile Market Trends in Q2'24

ATT Opt-in Rates
- The number of users in the mobile market in Q2'24 who consented to the use of their personal data dropped to 13.85%. In the previous quarter, this figure was 18.9%.
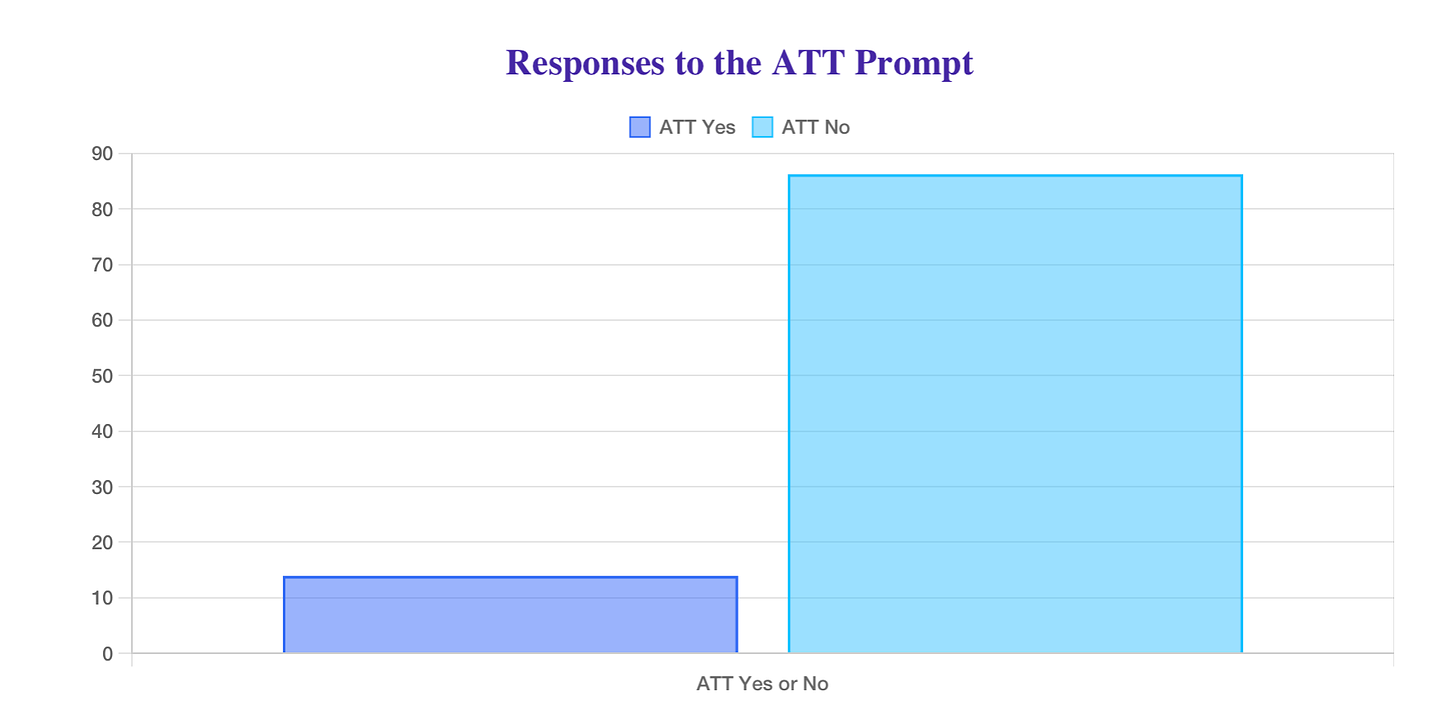
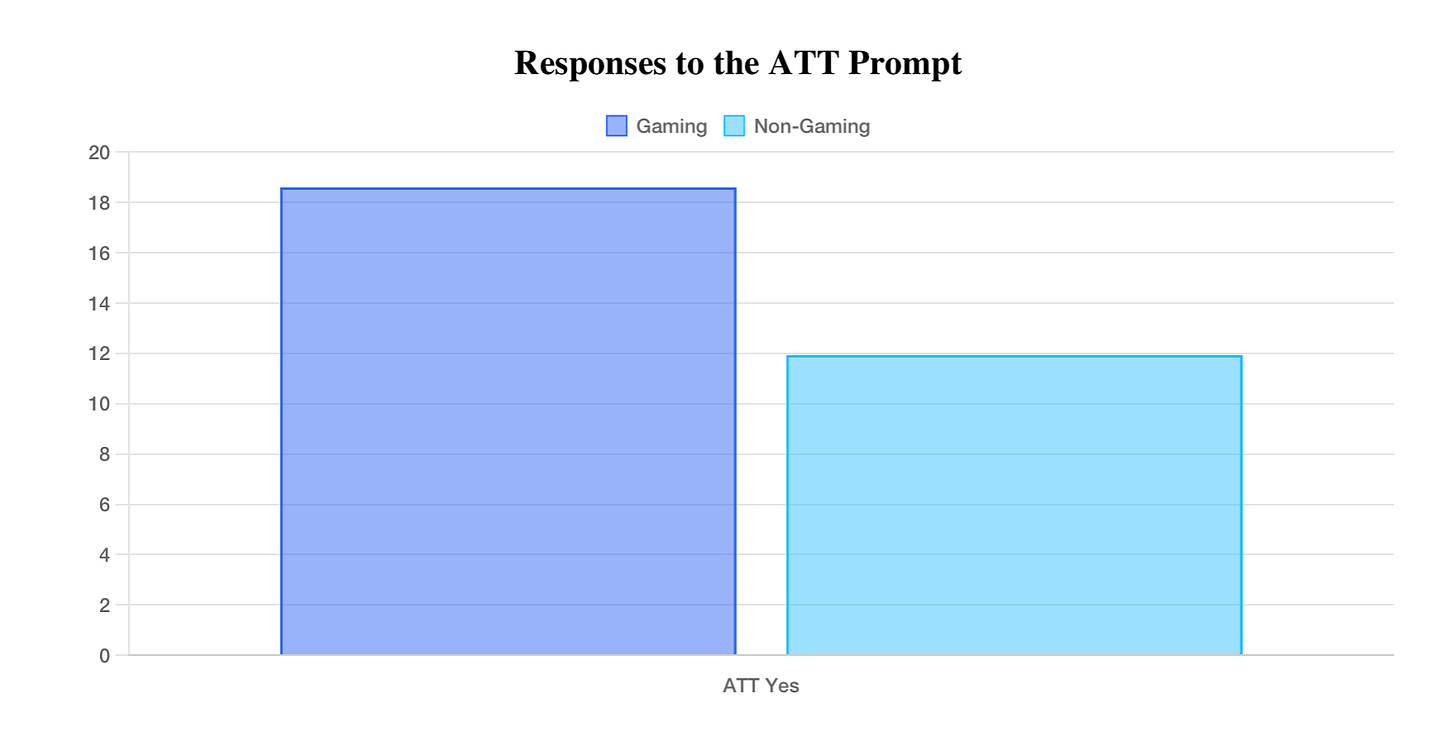
- The situation is better in games, where 18.58% of players agree to share their user data.
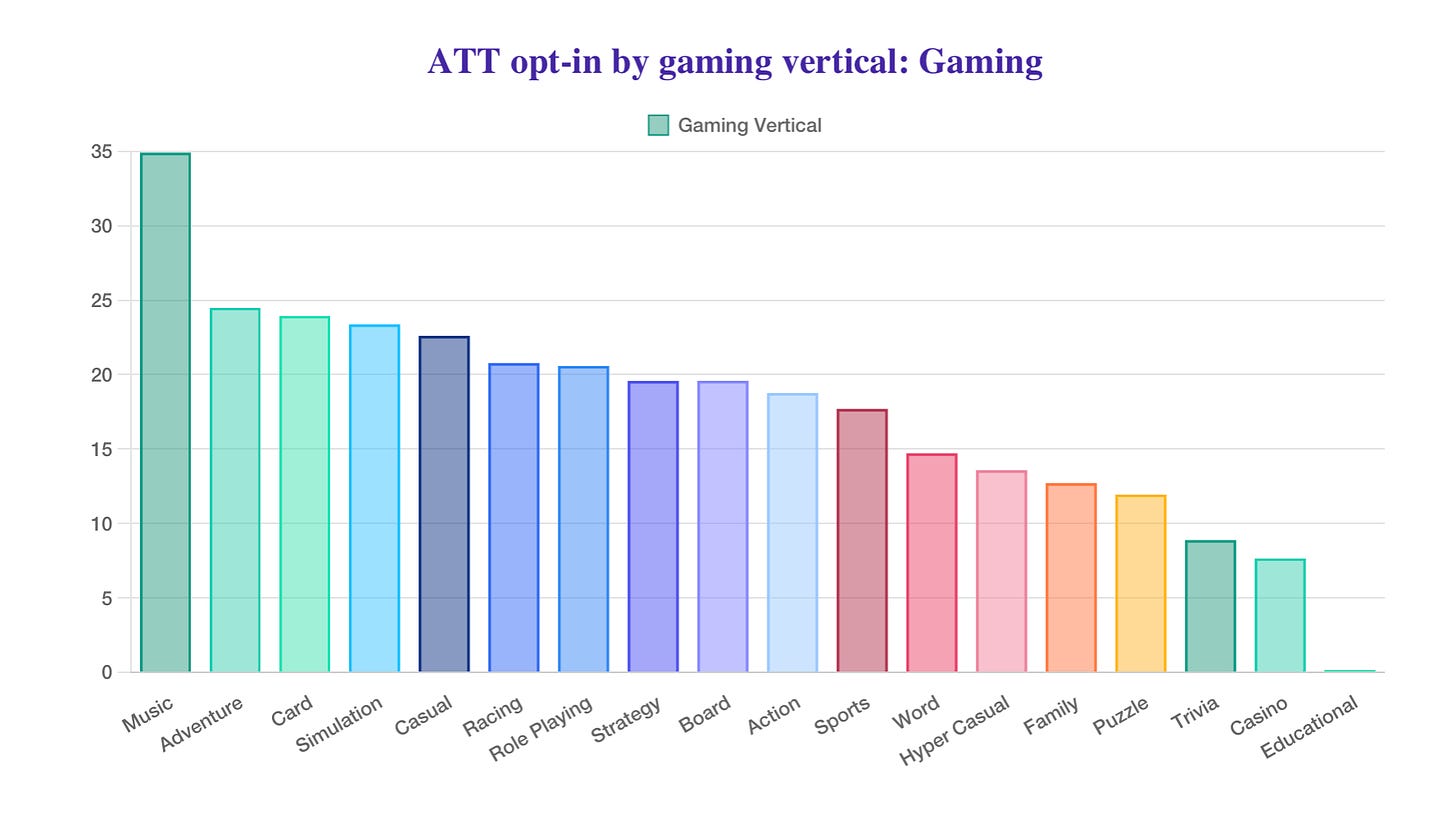
- The best ATT opt-in rates are seen in music games (34.88%), adventure games (24.47%), and card games (23.92%). The lowest rates are in casino games (7.63%), trivia games (8.85%), and puzzles (11.92%).
CPI Benchmarks
Games on iOS:
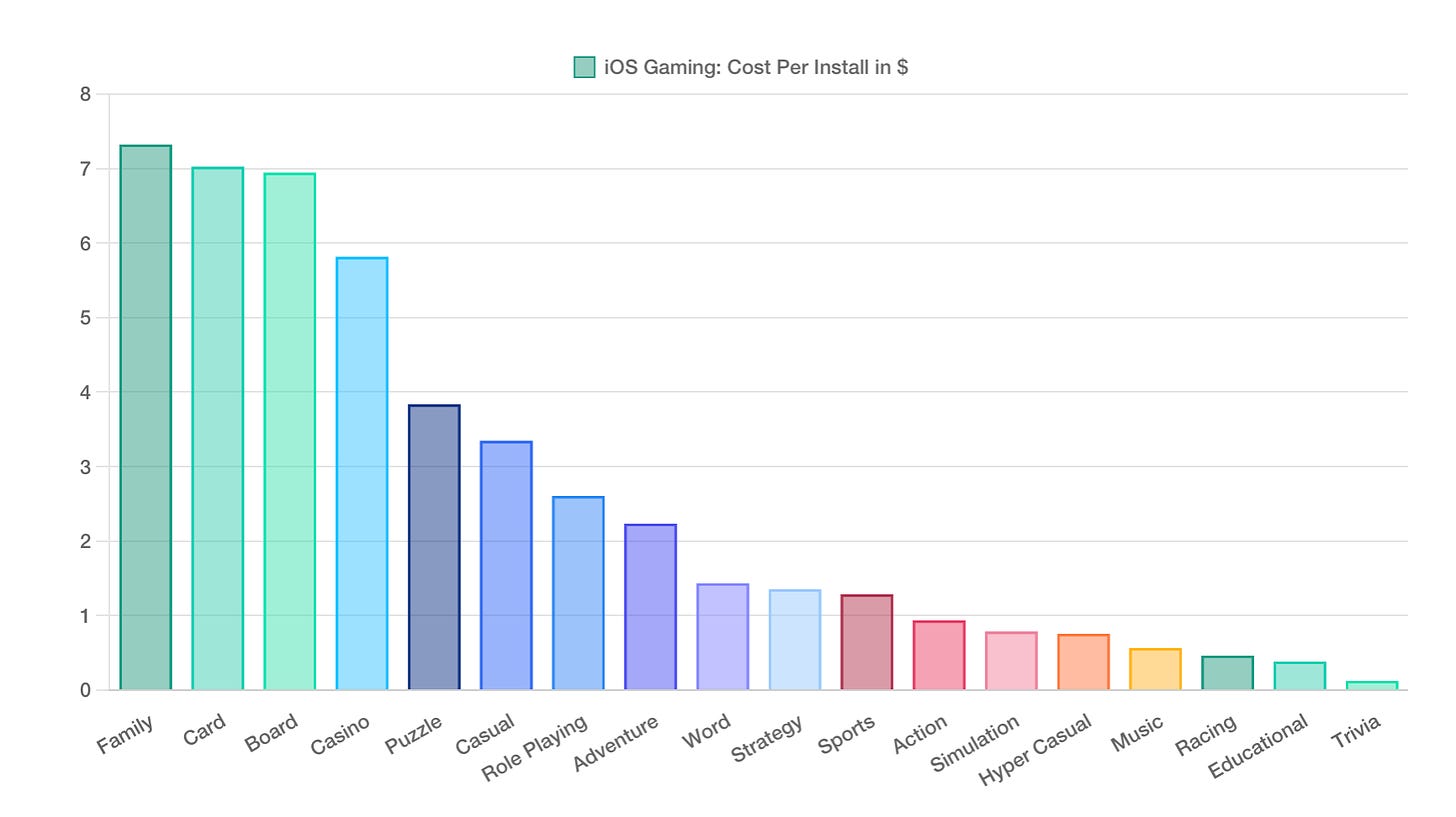
- CPI (Cost Per Install) - $2.9 (an increase of $0.16 QoQ)
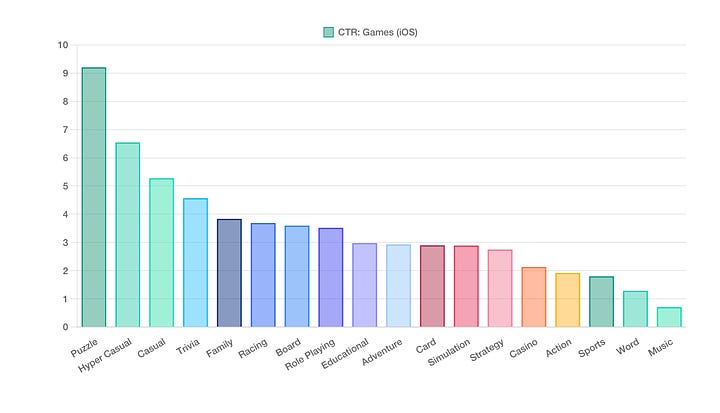
- CTR (Click-Through Rate) - 4.27% (an increase of 0.19 percentage points QoQ)
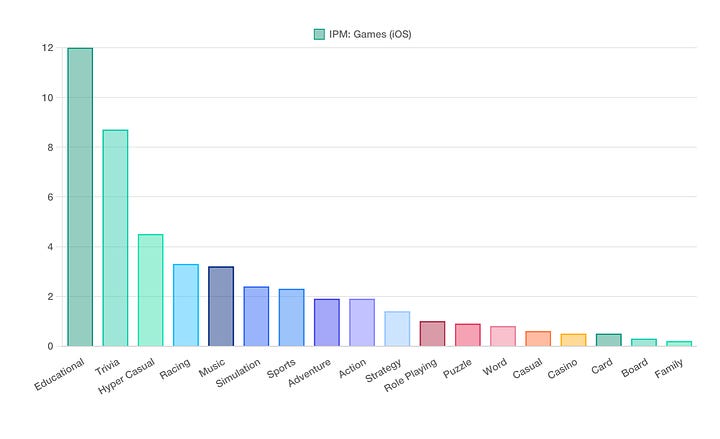
- IPM (Installs Per Mile) - 0.78 (a decrease of 0.02 QoQ)
❗️IPM - Installs Per Mile, the number of installs per 1,000 impressions. The higher this metric, the better.
- The most expensive CPI on iOS is seen in family games ($7.32), card games ($7.02), and board games ($6.94).
- The cheapest CPI is in trivia games ($0.12), educational games ($0.38), and racing games ($0.46).
Games on Android:
- CPI - $0.67 (a decrease of $0.07 QoQ)
- CTR - 2.43% (an increase of 0.64 percentage points QoQ)
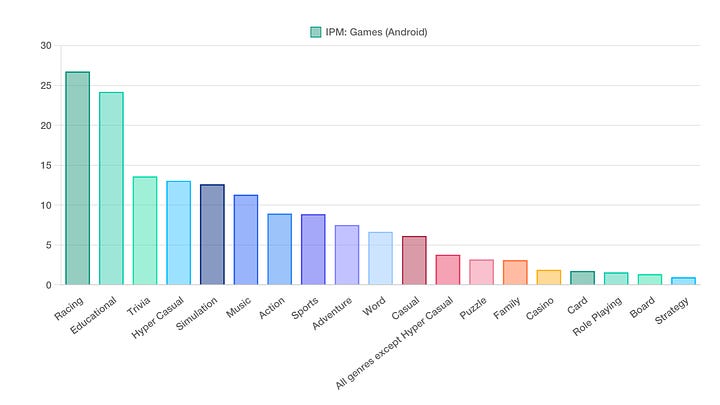
- IPM - 4.58 (an increase of 0.29 QoQ)
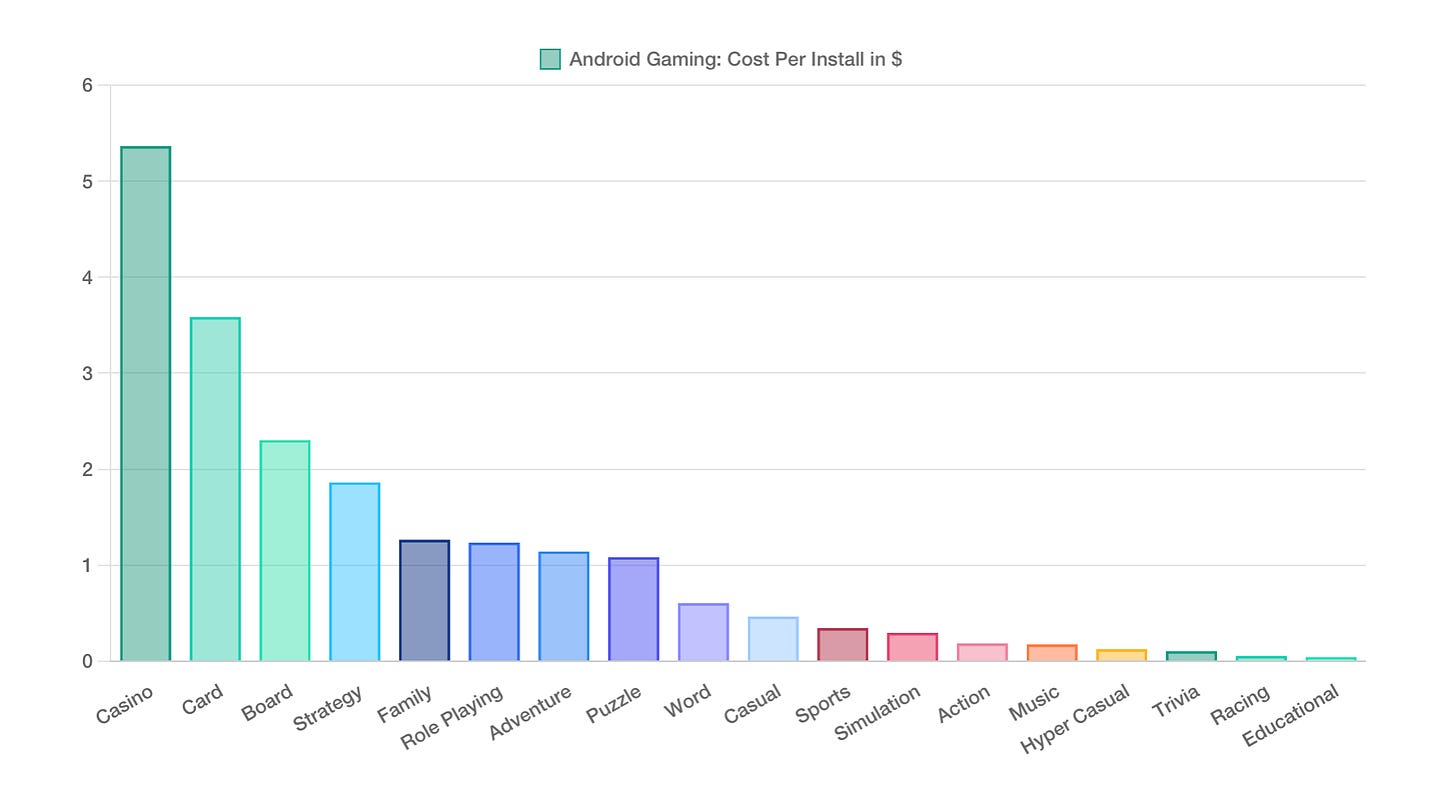
- The most expensive CPI on Android is in casino games ($5.36), card games ($3.58), and board games ($2.3).
- The lowest CPI is in racing games ($0.05), trivia games ($0.1), and hyper-casual projects ($0.12).
Downloads - Genre Trends
iOS
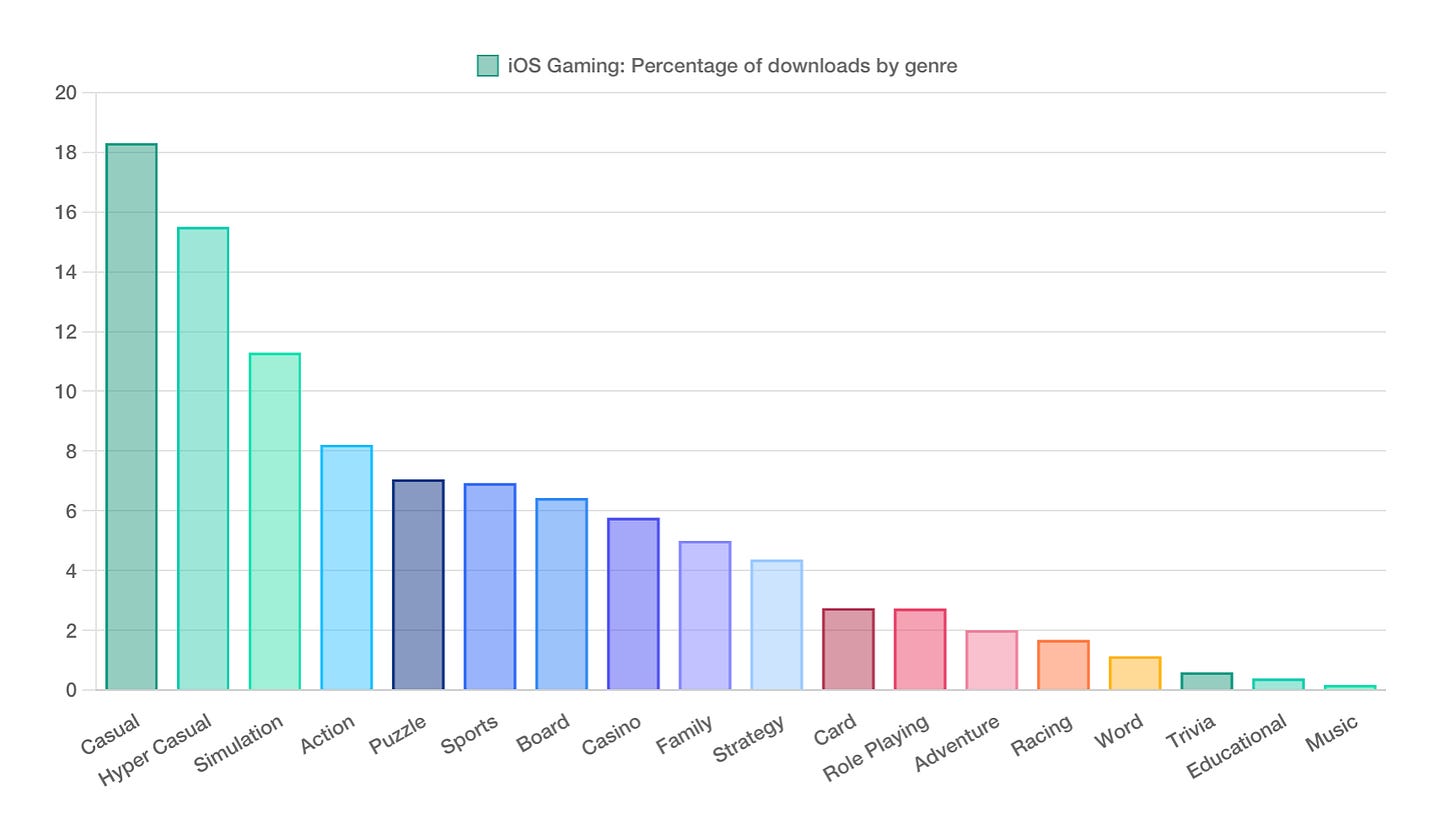
- Casual games on iOS accounted for 18% of all downloads in Q2'24 (up from 13% last quarter).
- Casual games lead in the share of installs (18.3%), followed by hyper-casual projects (15.49%) and the simulation genre (11.28%).
Android
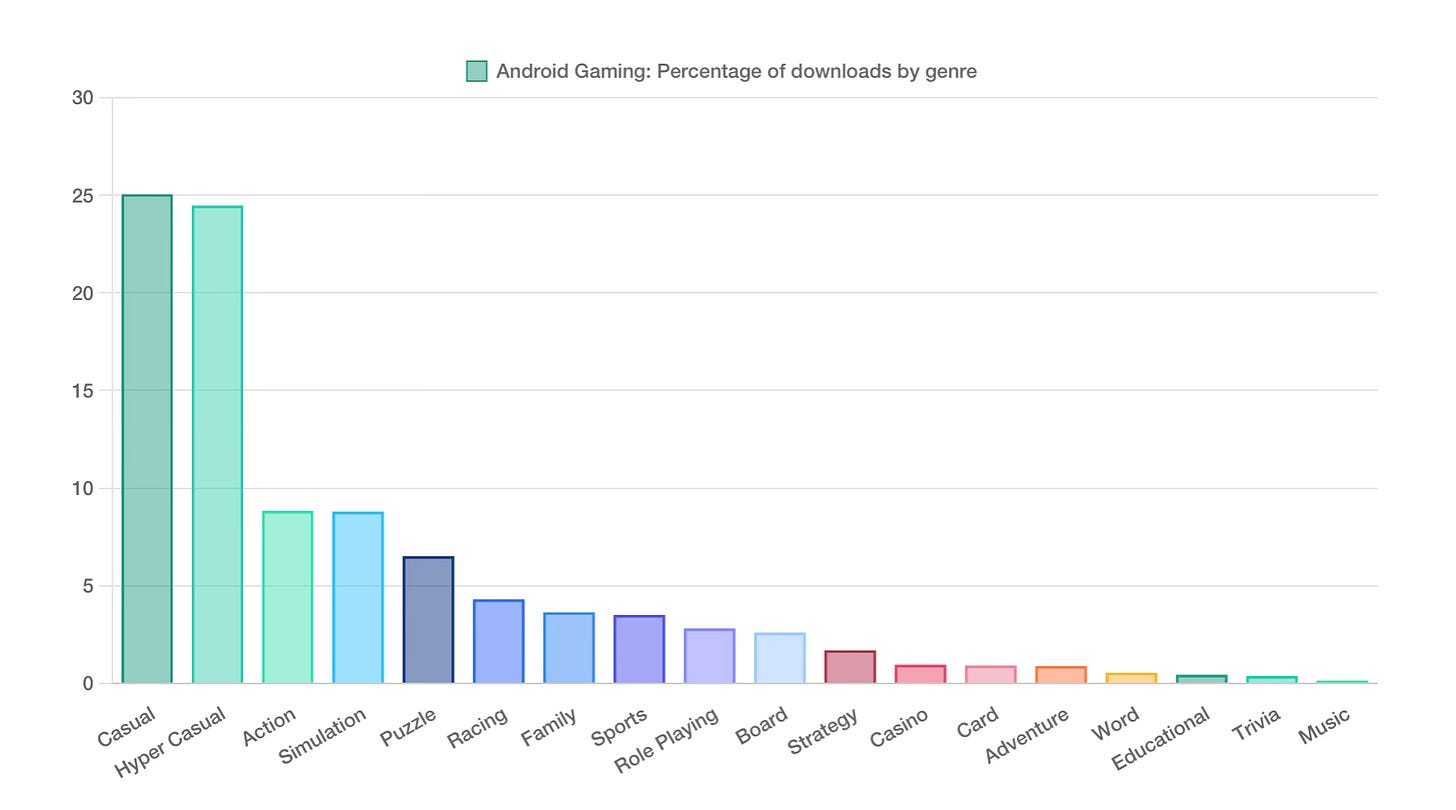
- Casual games ranked first in downloads in Q2'24 (25.04%); second place went to hyper-casual projects (24.45%); third place to action games (8.81%).
- Singular notes that the share of hyper-casual games in downloads has decreased. In Q4'23, they accounted for 36% of all installs, in Q1'24 - 21%, and in Q2'24 - 24%. Meanwhile, casual games are growing in downloads.
Key Marketing Metrics for Games
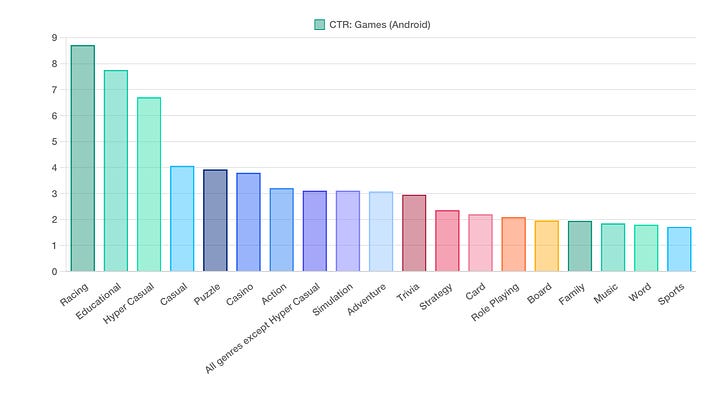
- In Q2'24, CTR in games increased, while it decreased in non-gaming apps. The leaders in CTR on Android are racing games (8.71%), educational games (7.75%), and hyper-casual projects (6.7%). On iOS - puzzles (9.2%), hyper-casual games (6.54%), and casual projects (5.27%).
- IPM in games on Android is highest in racing games (26.71), educational games (24.17), and trivia games (13.56). On iOS, it's highest in educational games (12), trivia projects (8.7), and hyper-casual projects (4.5).
Advertising Spend
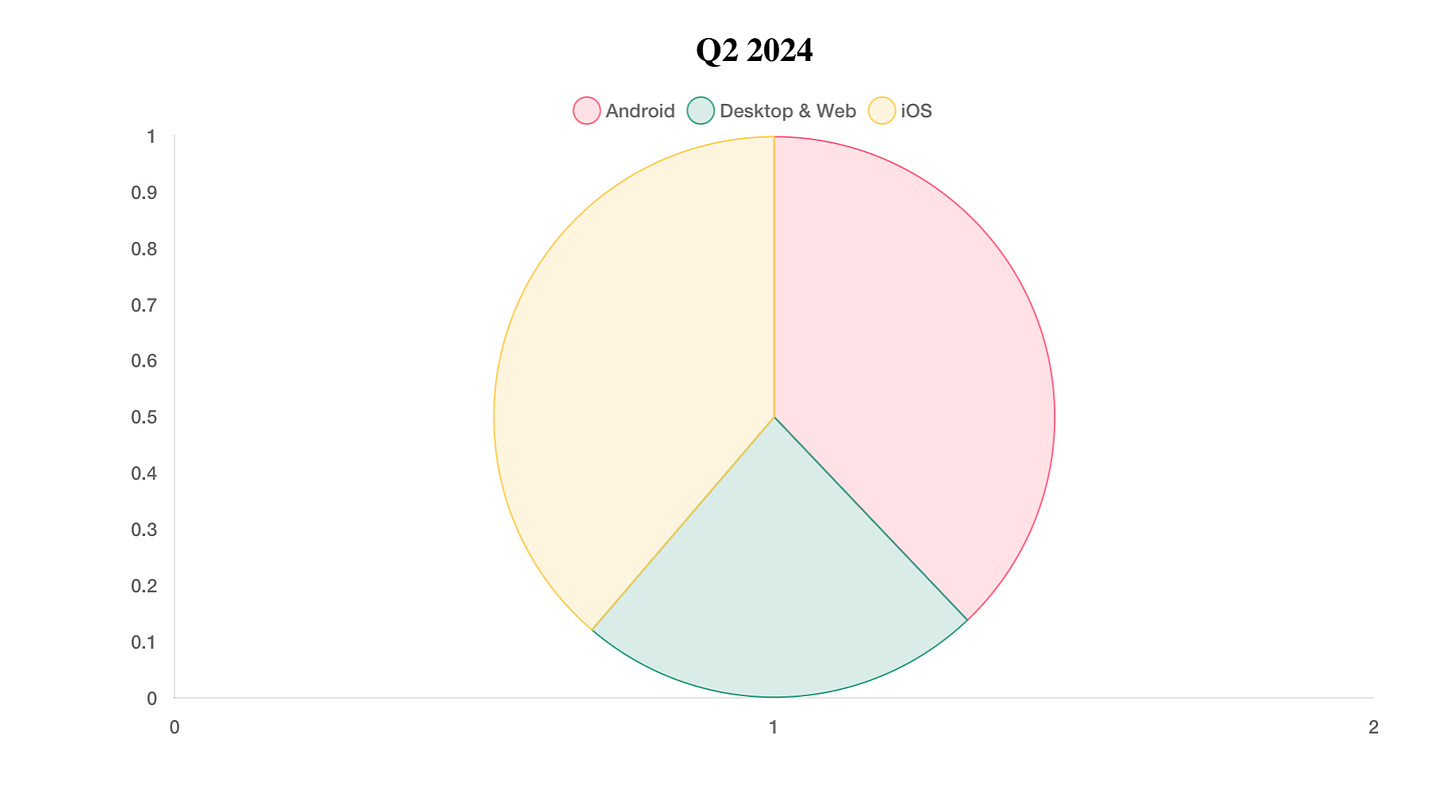
- In Q2'24, iOS accounted for 38.74% of all ad spend (down from 39.97% in Q1'24); Android accounted for 37.91% (up from 36.36% in Q1'24); and Web accounted for 23.36% (a slight decrease from 23.43% in Q1'24).
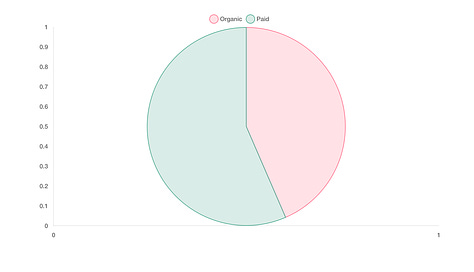
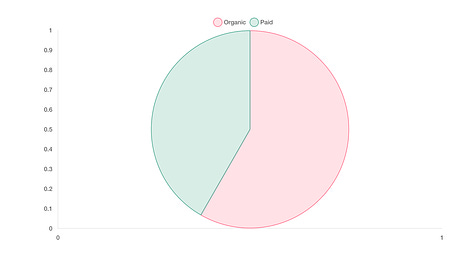
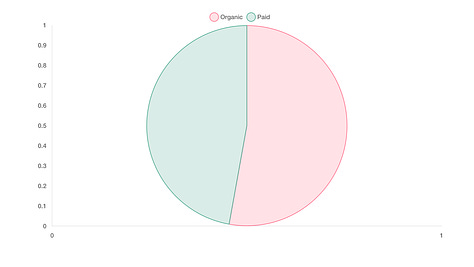
- According to Singular, 52.84% of traffic in Q2'24 was organic; 47.16% was paid. On Android, there is more organic traffic (58.3%); on iOS, there is less (43.5%).
Newzoo: Gaming Market in 2024 and beyond
Revenue
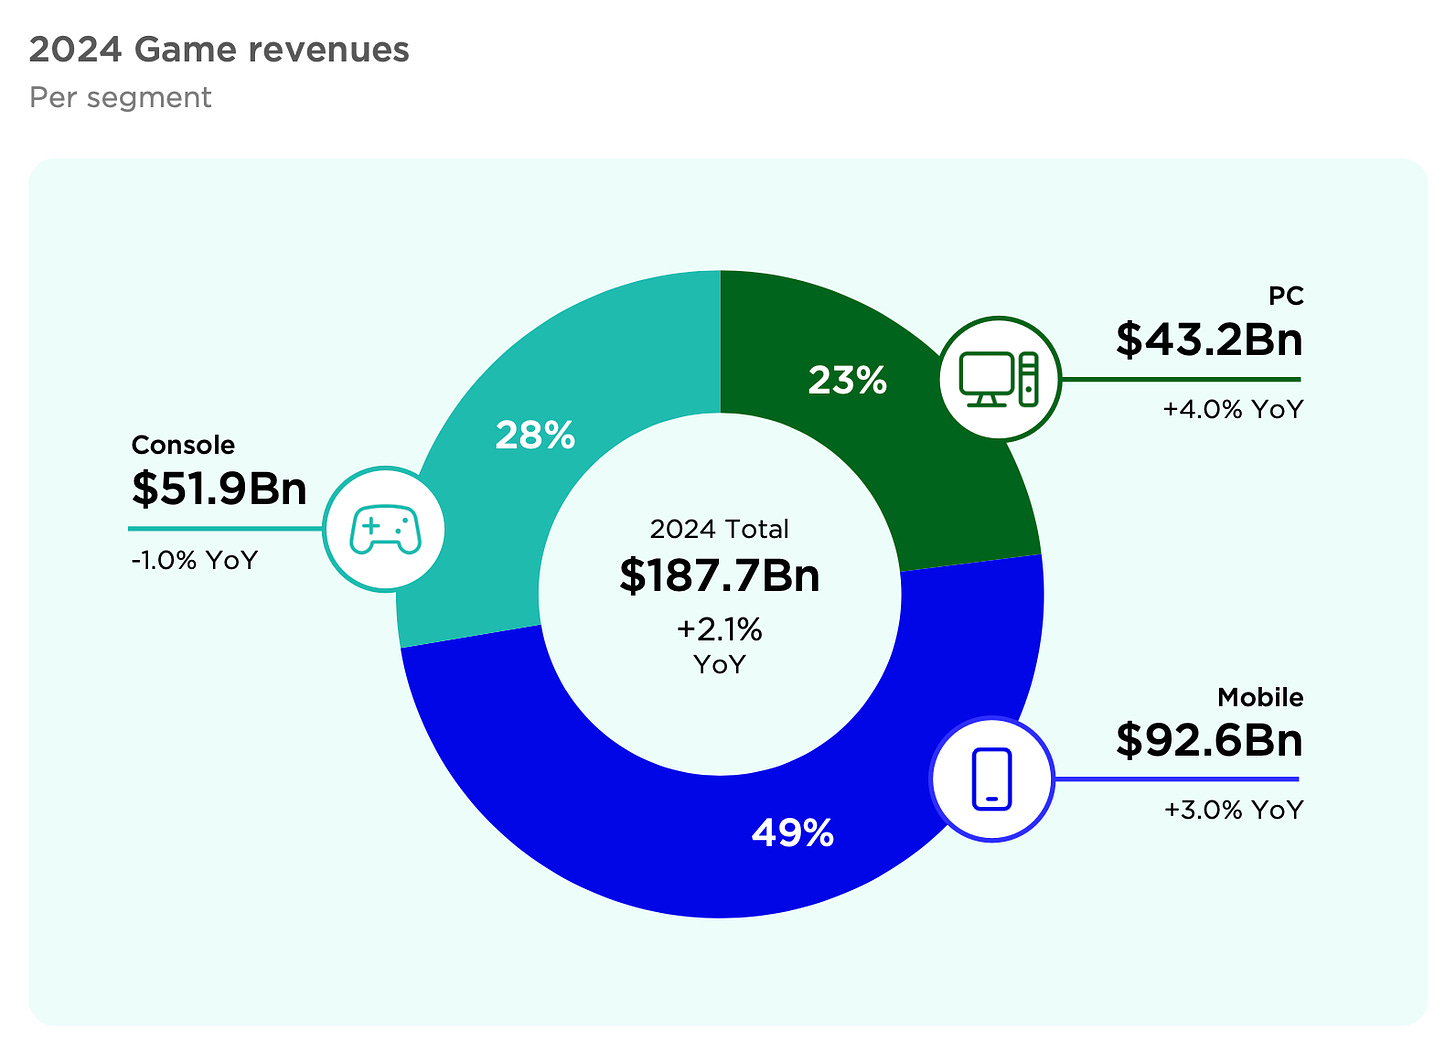
- Newzoo estimates that the gaming industry's total revenue for 2024 will reach $187.7И, growing by 2.1% YoY. The PC segment will grow by 4% YoY to $43.2B (23% of the market); the mobile segment will see a growth of 3% YoY to $92.6B (49% of the market); while the console segment will decrease by 1% YoY to $51.9B (28% of the market).
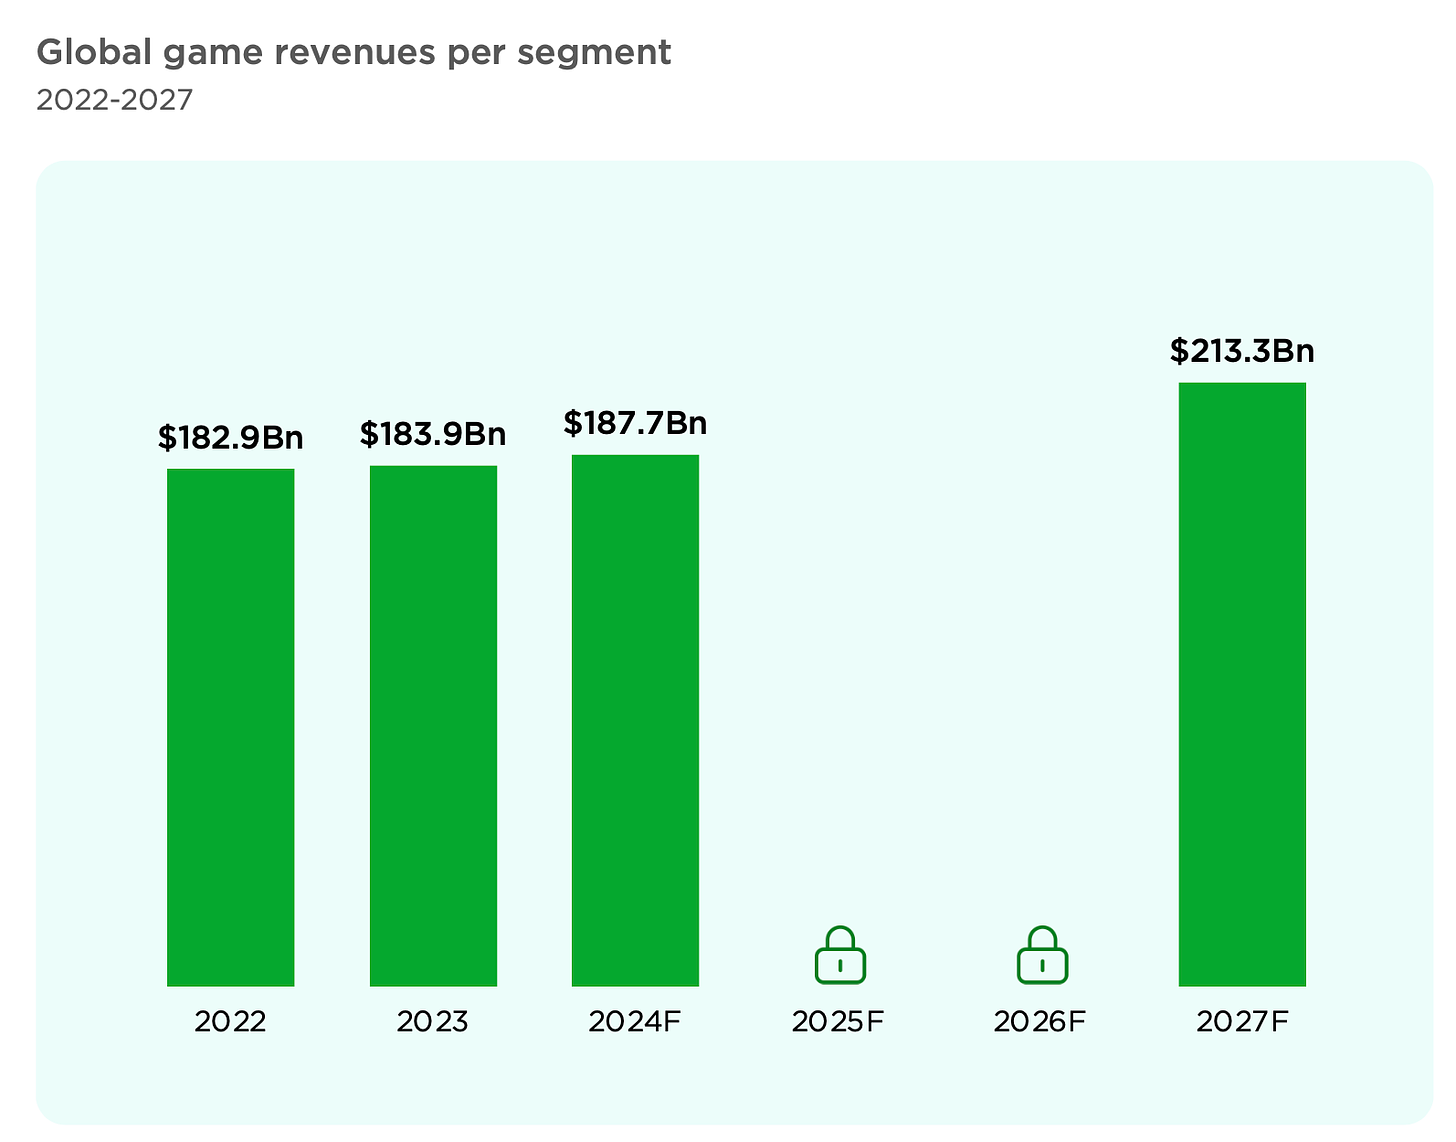
- Newzoo forecasts that by 2027, the gaming market will reach a revenue of $213.3B. The average annual growth rate from 2022 to 2027 will be 3.1%. It is expected that the PC market will grow steadily, and the console market, after a decline this year, will return to dynamic growth.
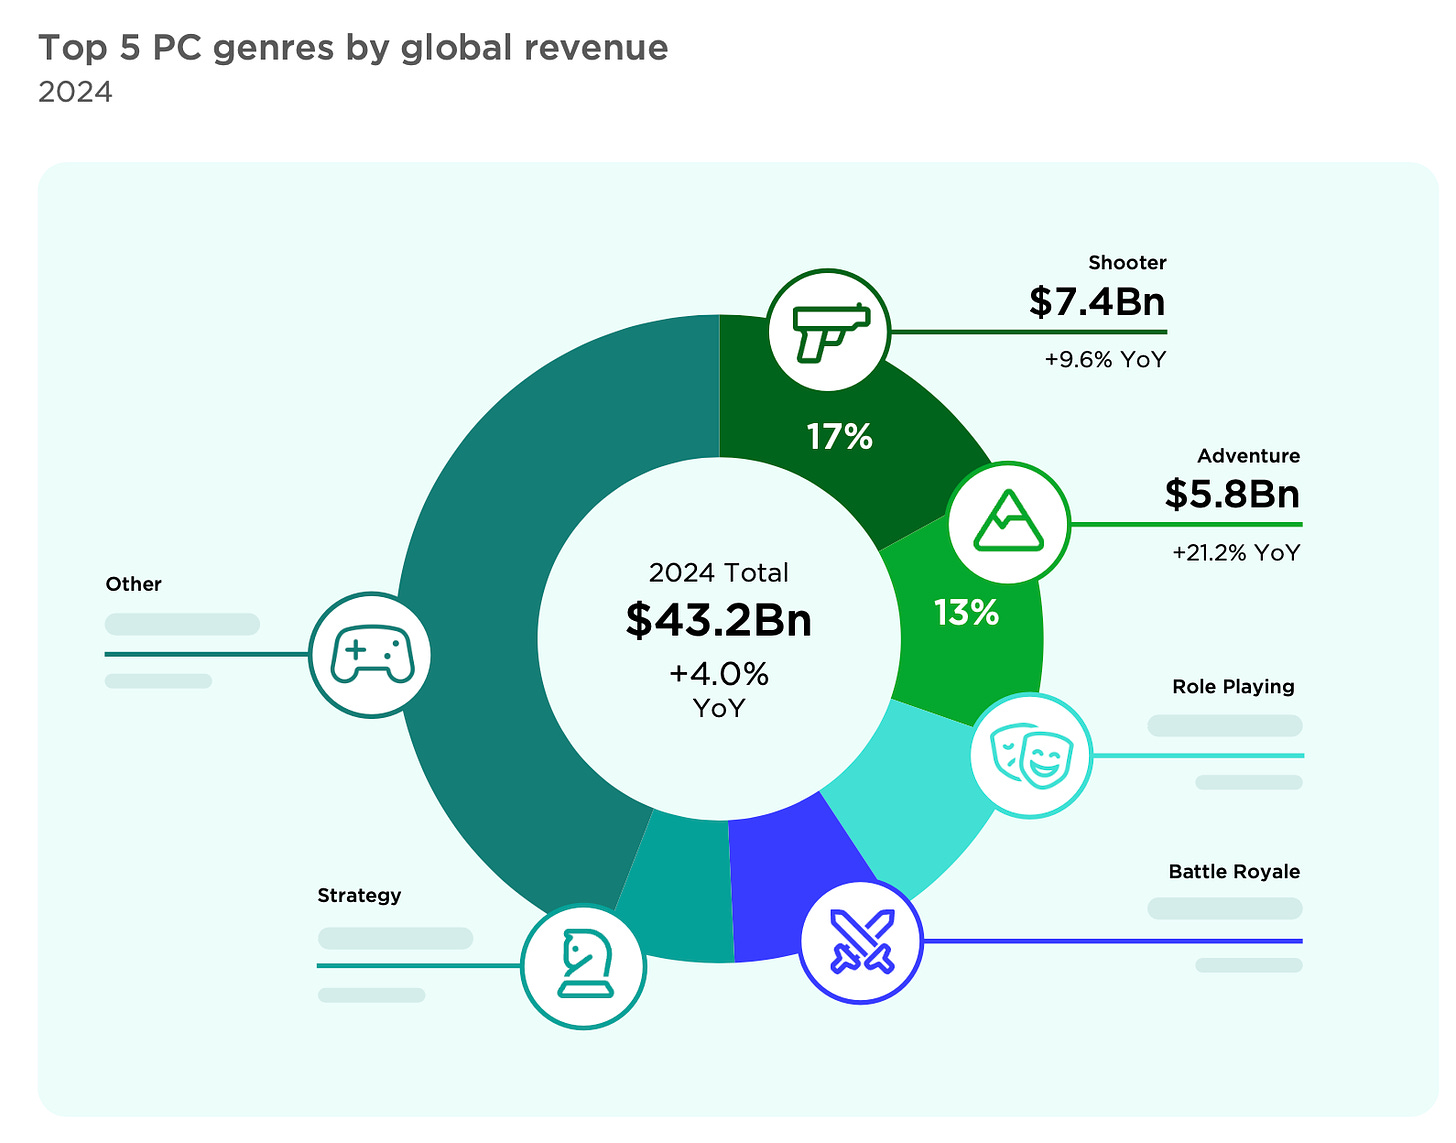
- Shooters are the largest genre in terms of revenue on PC - its volume in 2024 will be $7.4B (17% of the total segment revenue; +9.6% YoY). However, Newzoo does not include Battle Royale in this category. The second place goes to adventure games (13% of the total segment revenue; $5.8B in revenue; +21.2% YoY).
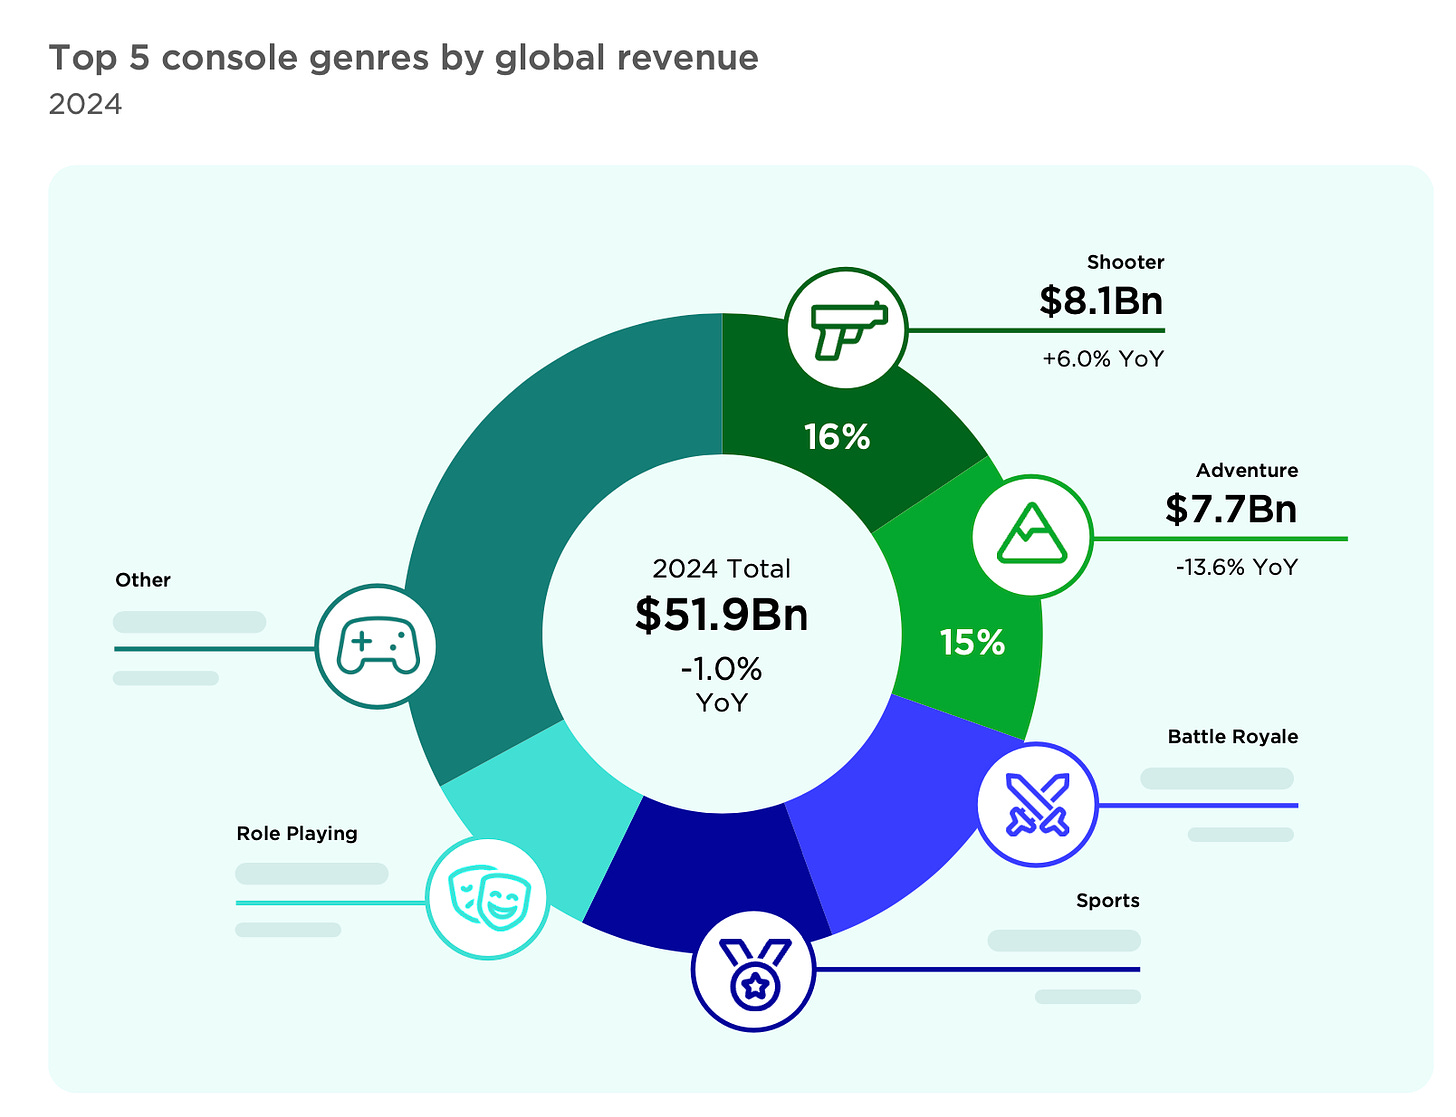
- The situation is similar on consoles. Shooters account for 16% of total revenue ($8.1B; +6% YoY). Adventure games account for 15% of total revenue ($7.7B; -13.6% YoY).
Gaming Audience
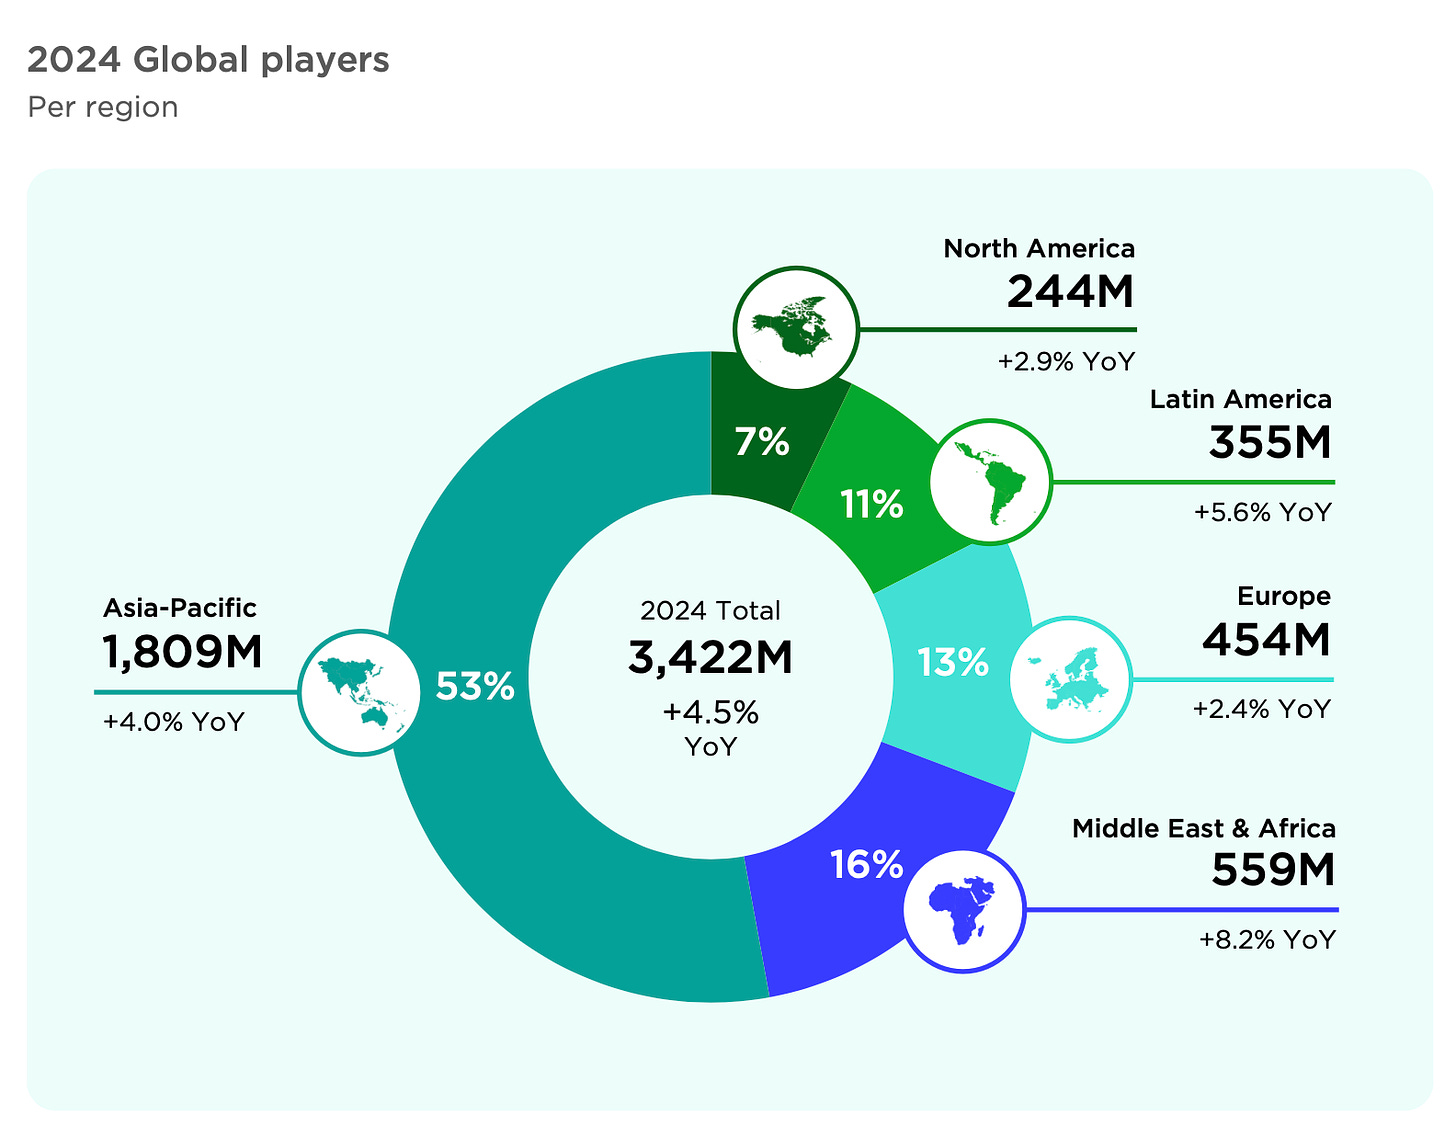
- The number of players in 2024 will reach 3.422B (+4.5% YoY). The highest growth is in the PC segment (+3.9% YoY - up to 900M players); followed by mobile (+3.5% YoY - up to 2.85B); the console segment has the lowest growth (+2.3% YoY). The increase in the number of players is largely due to developing markets.
- 53% of players in 2024 will be in the Asia-Pacific region (1.809B; +4% YoY). Next are the MENA region (559M; +8.2% YoY); Europe (454M; +2.4% YoY); Latin America (355M; +5.6% YoY); North America (244M; +2.9% YoY).
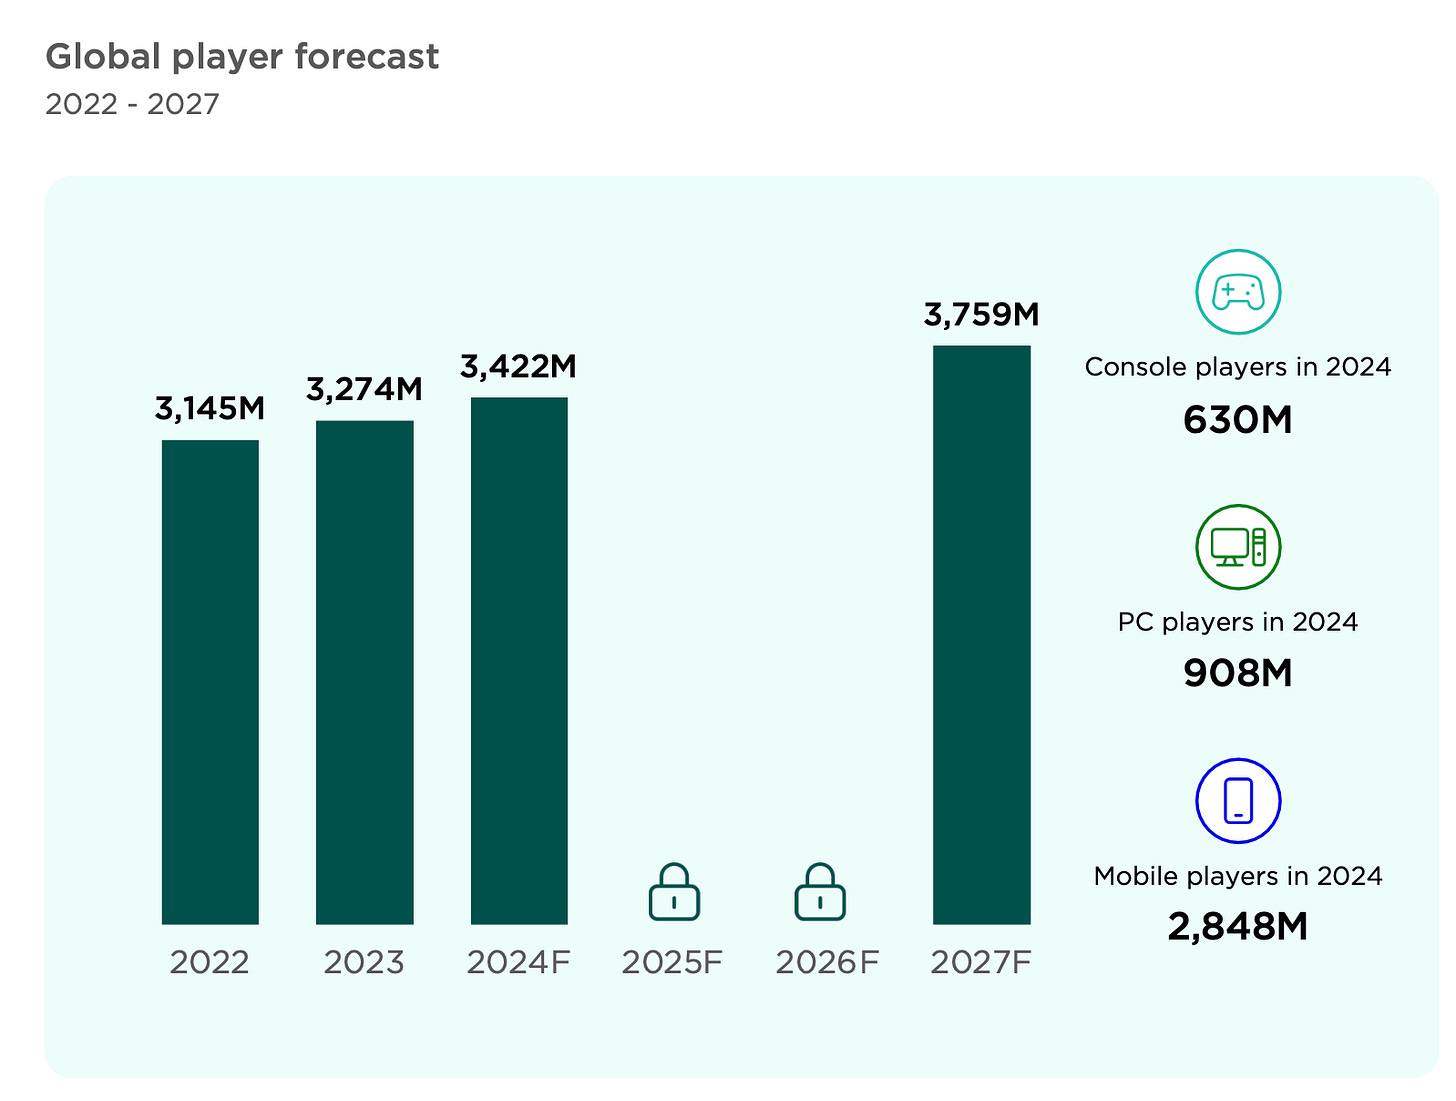
- Newzoo forecasts that by 2027, the number of players worldwide will grow to 3.759 billion.
Trends
- Cross-platform play. Releasing games on different platforms benefits PCs the most. Both PlayStation and Xbox consider PCs a "neutral" platform where they can release their games.
- Developers are reducing the scale of their projects to lower development costs and meet the needs of the modern market.
- The mobile ecosystem is starting to open up. The European DMA lays the foundation for diverse stores and payment methods on iOS and Android. However, real results will be seen in a few years.
- The importance of community management is growing.
- The future of F2P games on PC and consoles is uncertain. New games are struggling to capture an audience, while older projects are growing.
- Almost all popular AAA games in recent years are based on established gaming IPs or major franchises. Success in the PC and console market is coming to indie developers and AA-level projects. These projects require fewer resources, and creators can experiment more as they are not under the pressure of large budgets.
- Gen-AI continues to penetrate development more deeply. However, there are still few real use cases, and it is evident that the technology needs time to develop.
- The preferences of young players are changing. For generations Alpha and Z, UGC (User-Generated Content) is becoming increasingly important.
GSD & GfK: The UK PC/Console Market Declined Slightly Again in July

Game Sales
- 2.35 million games for PC and consoles were sold in the UK in July, which is 2.9% less than in July last year.
- The top 6 games in the top 10 were all released before 2024.
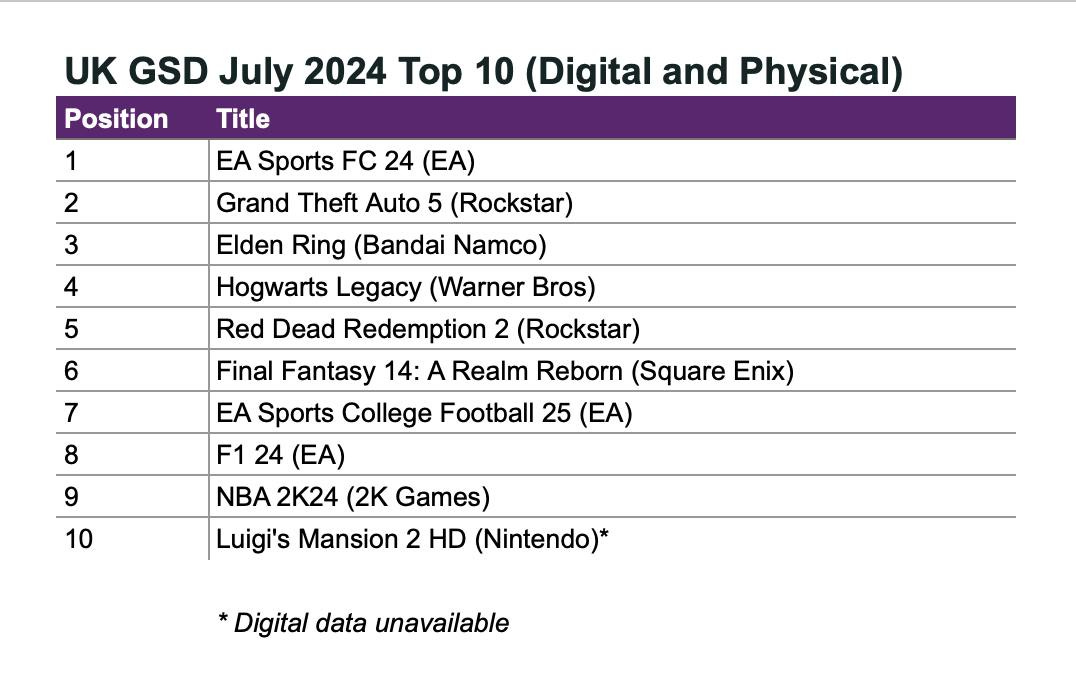
- EA Sports College Football 25 debuted in 7th place. The situation is interesting because American football is mostly popular in the US. The game's sales in the UK during the first two weeks were double those of Madden NFL 24 for the same period.
- EA Sports FC 24 was the top seller in July, with sales 46% higher than FIFA 23 in July last year, influenced by the UEFA EURO 2024 tournament.
- Sales of Final Fantasy 14: A Realm Reborn surged significantly with the release of the Dawntrail expansion.
Hardware Sales
- 77,000 consoles were sold in the UK in July, which is 30% less than in July 2023 and 22% less than in June 2024.
- PlayStation 5 sales dropped by 31% MoM, but it still maintained the top spot in sales. Nintendo Switch sales grew by 9% compared to the previous month, while Xbox Series S|X saw a 19% decline compared to June figures.
- PlayStation 5 has surpassed 4 million units sold in the UK, trailing the PS4 by 31 weeks.
- 540,000 accessories were sold in July 2024, which is 4% less than last year and 17% less than the previous month.
- PlayStation Portal is the top-earning accessory in the UK market.
Famitsu: Physical sales of console games in Japan in July 2024

Famitsu only tracks physical copy sales.
Game Sales
- Powerful Pro Baseball 2024-2025 by Konami was the top-selling game in Japan in July. The game sold 260,000 physical copies within the first two weeks after launch. The previous game in the series (eBaseball Powerful Pro Baseball 2022) sold 202,000 copies in the same period.
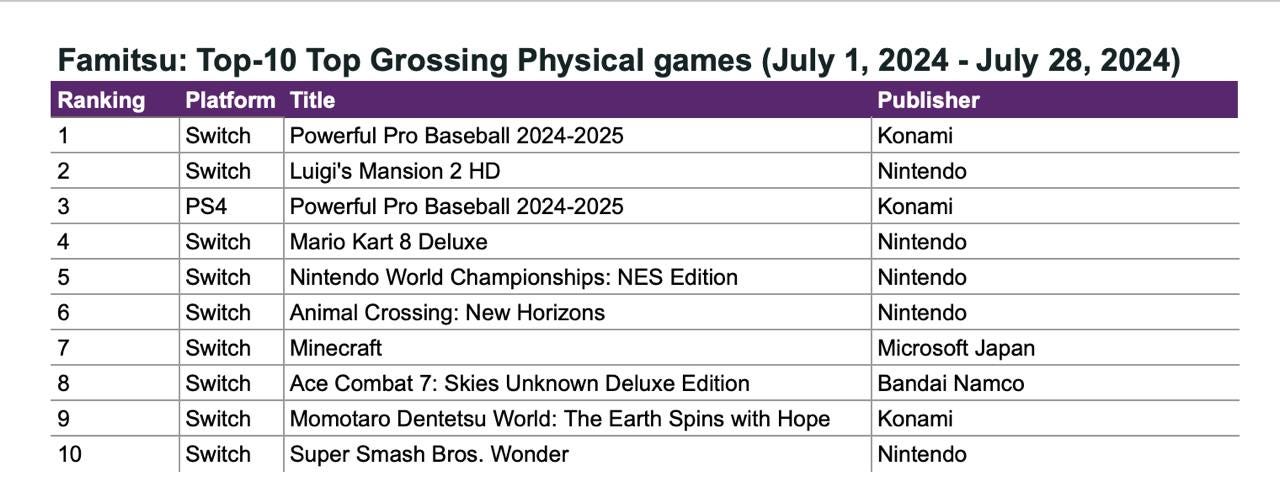
- In second place was Luigi's Mansion 2 HD (71,000 copies); in fourth place was Mario Kart 8 (37,000 copies); in fifth place was Nintendo World Championships: NES Edition (36,000 copies).
- Nintendo accounted for 33.5% of all physical game sales in the country in July. In money terms, this amounts to ¥2.4 billion ($16.3 million). Konami was in second place with 29% of the physical market (¥2 billion - $13.6 million).
- Nintendo Switch accounted for 84% of all physical game sales.
Hardware Sales
- The Nintendo Switch was the best-selling console on the Japanese market, with 229,300 units sold in July.
- The PlayStation 5 sold 125,000 units in July; the Xbox Series S|X sold 13,700 units.
SocialPeta & Tenjin: Mobile Marketing in H1'24

Market Trends
- In the first half of 2024, the number of advertisers in the mobile market increased by 33.7% to 56.6 thousand. The average number of creatives per advertiser decreased by 22.8% to 105.
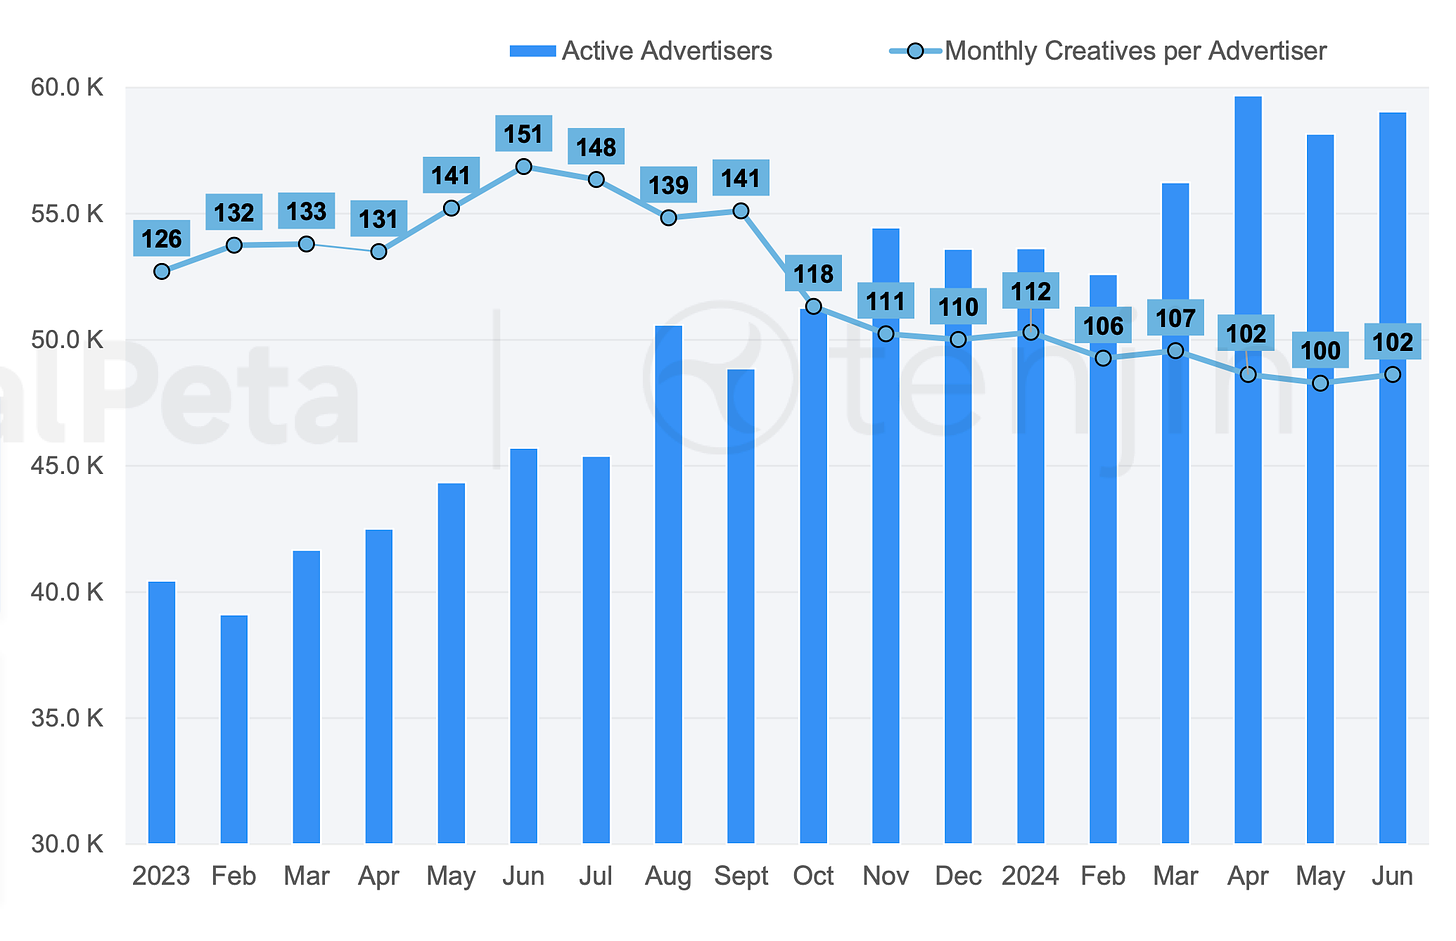
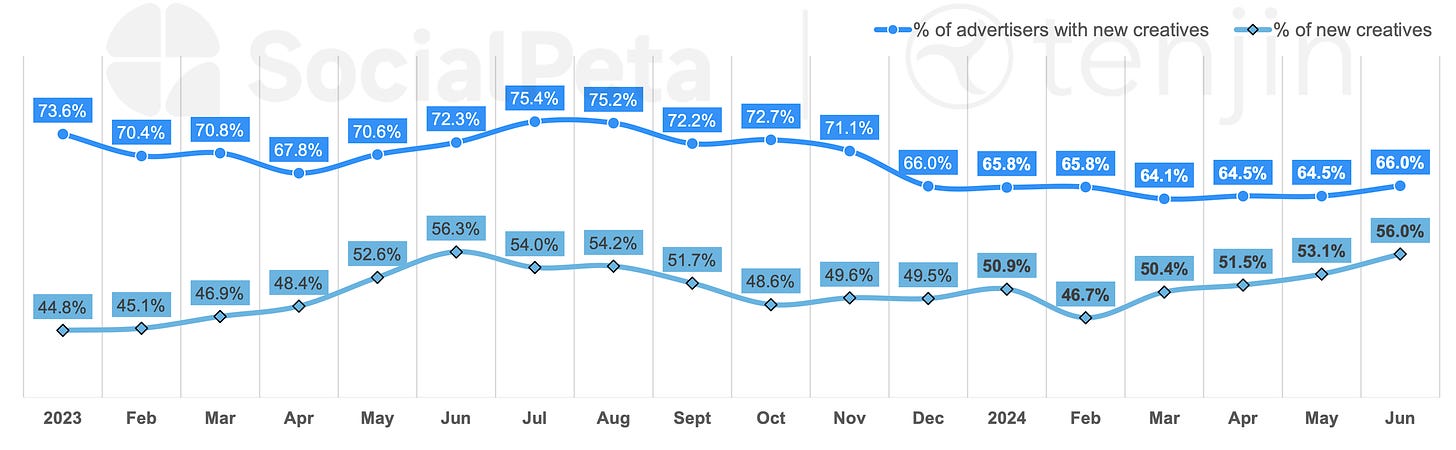
- The mobile gaming market is in decline when it comes to marketing activity. The percentage of advertisers with new creatives in the first half of 2024 dropped by 5.8% to 65.1%. However, the share of new creatives per month increased by 2.4% to 51.4%.
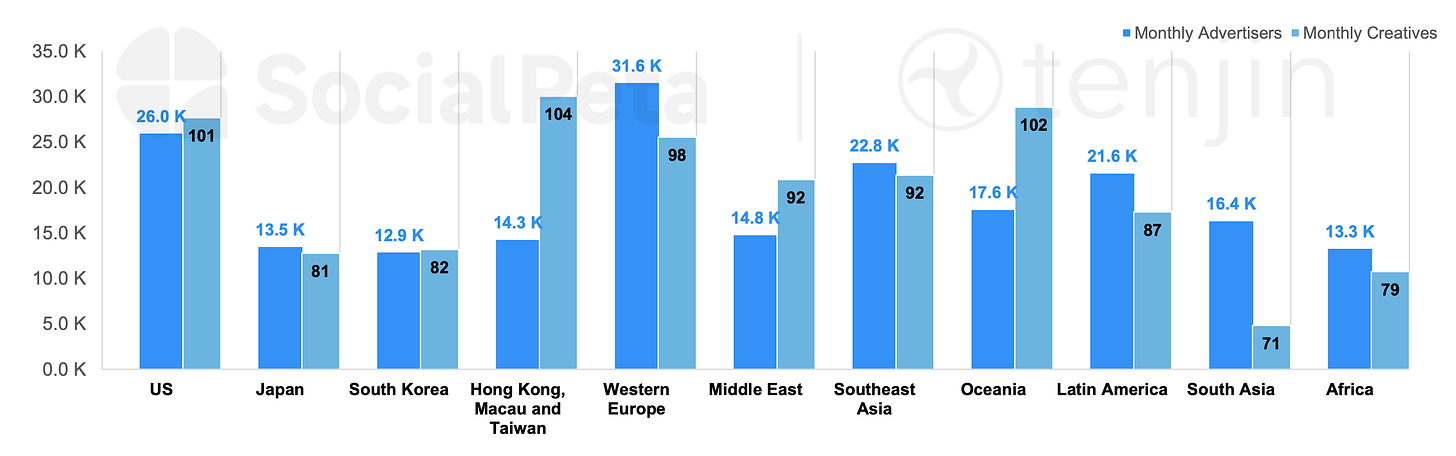
- The highest number of gaming advertisers is in Western Europe (31.6 thousand), the USA (26 thousand), and Southeast Asia (22.8 thousand). The highest number of creatives per advertiser is in the markets of Hong Kong, Macau, and Taiwan (104), Oceania (102), and the USA (101).
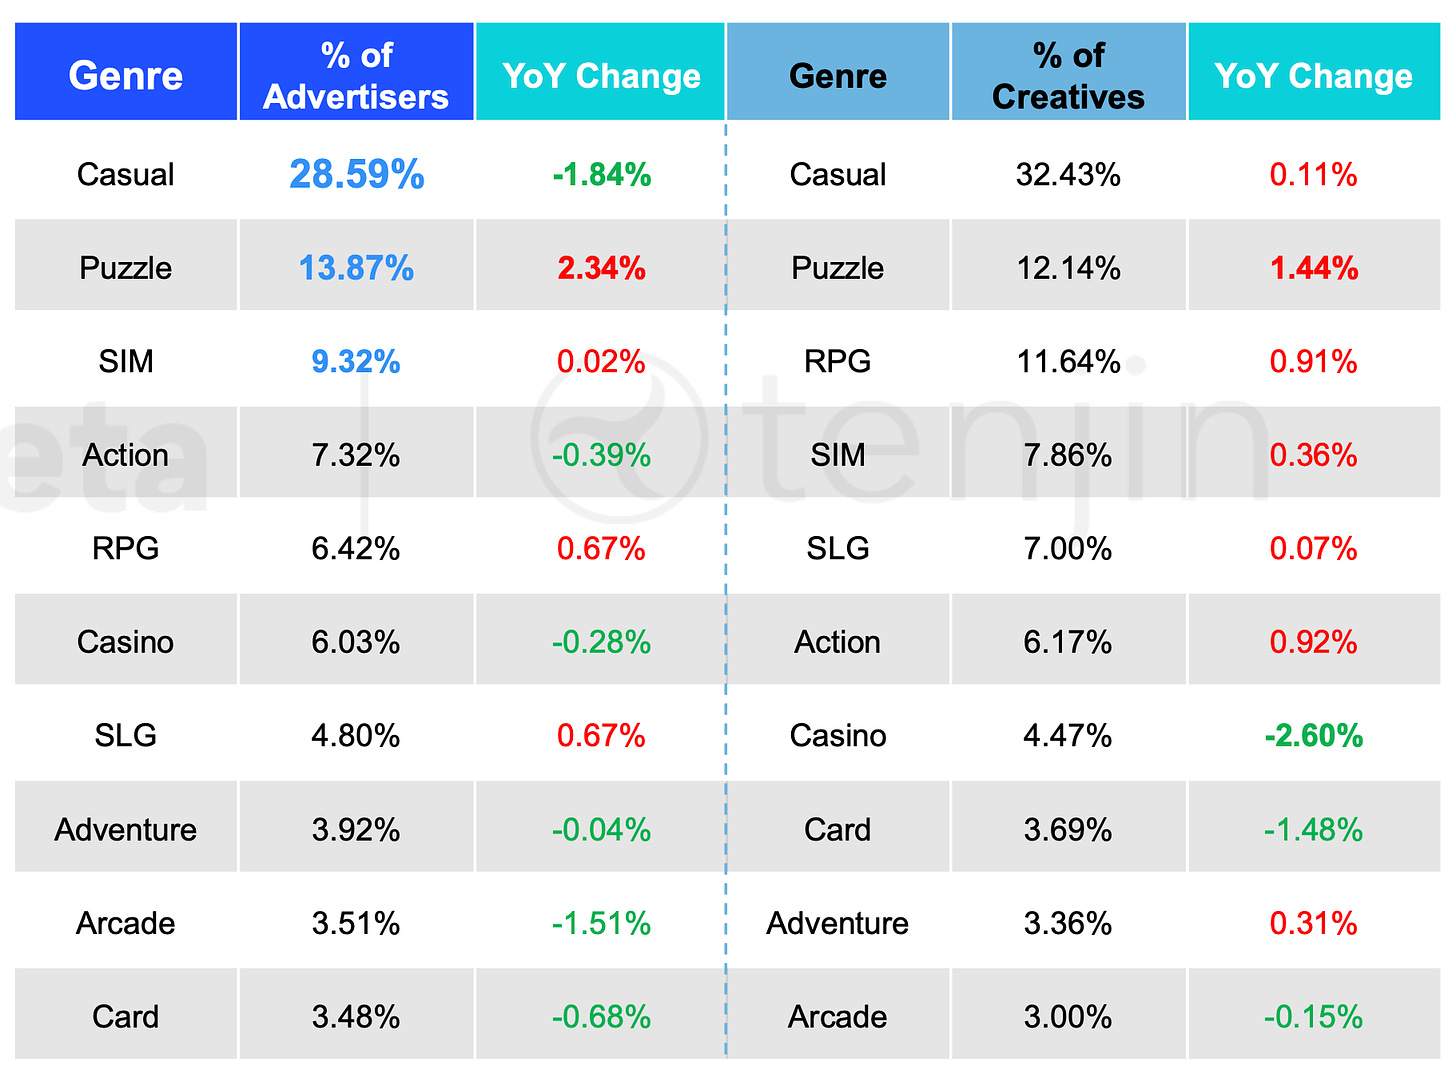
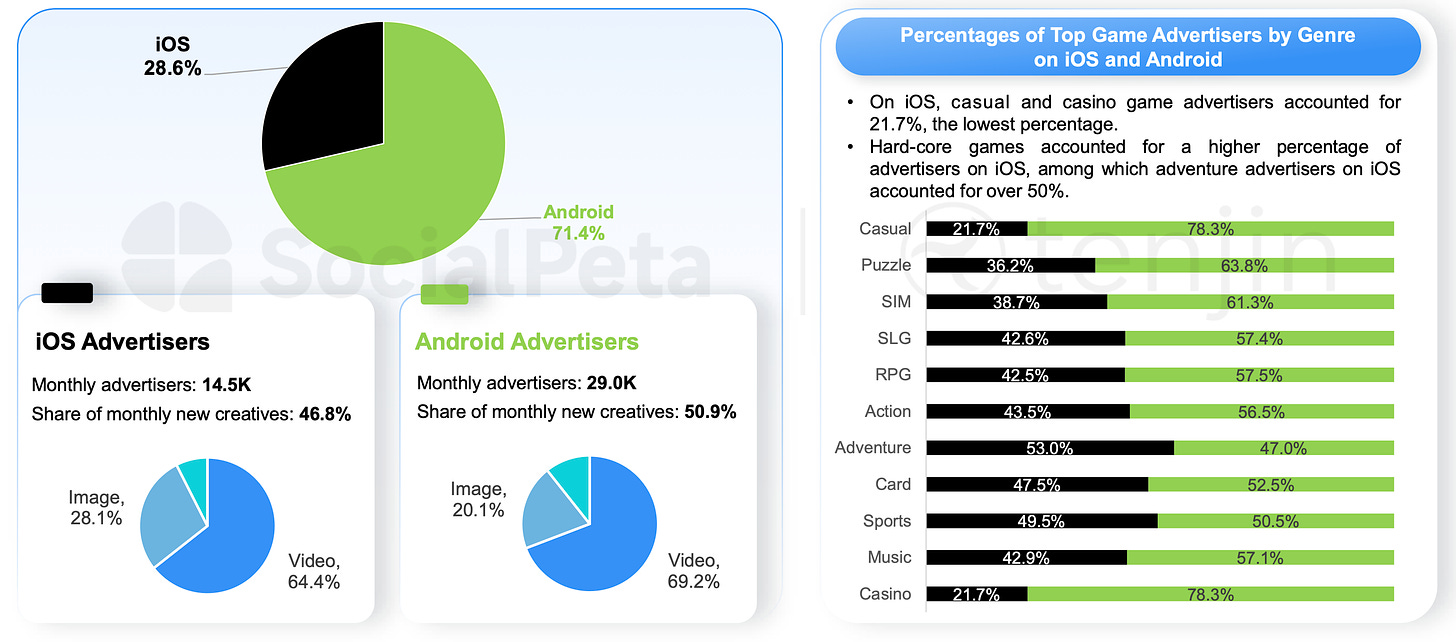
- The largest number of advertisers is in casual games (28.59% of the total), puzzles (13.87%), and simulation games (9.32%). In terms of the share of creatives, casual games lead (32.43% of the total), followed by puzzles (12.14%) and RPGs (11.64%).
- 71.4% of all advertisers are on Android; 28.6% are on iOS. However, in some genres, iOS either surpasses or is equal to Android, such as adventure games (53% of advertisers are on iOS), sports games (49.5%), and card games (47.5%).
- 77.8% of creatives in the first half of 2024 were videos. 18.8% were images. Despite the growth in the share of video, views of static ads actually increased in the first half of 2024.
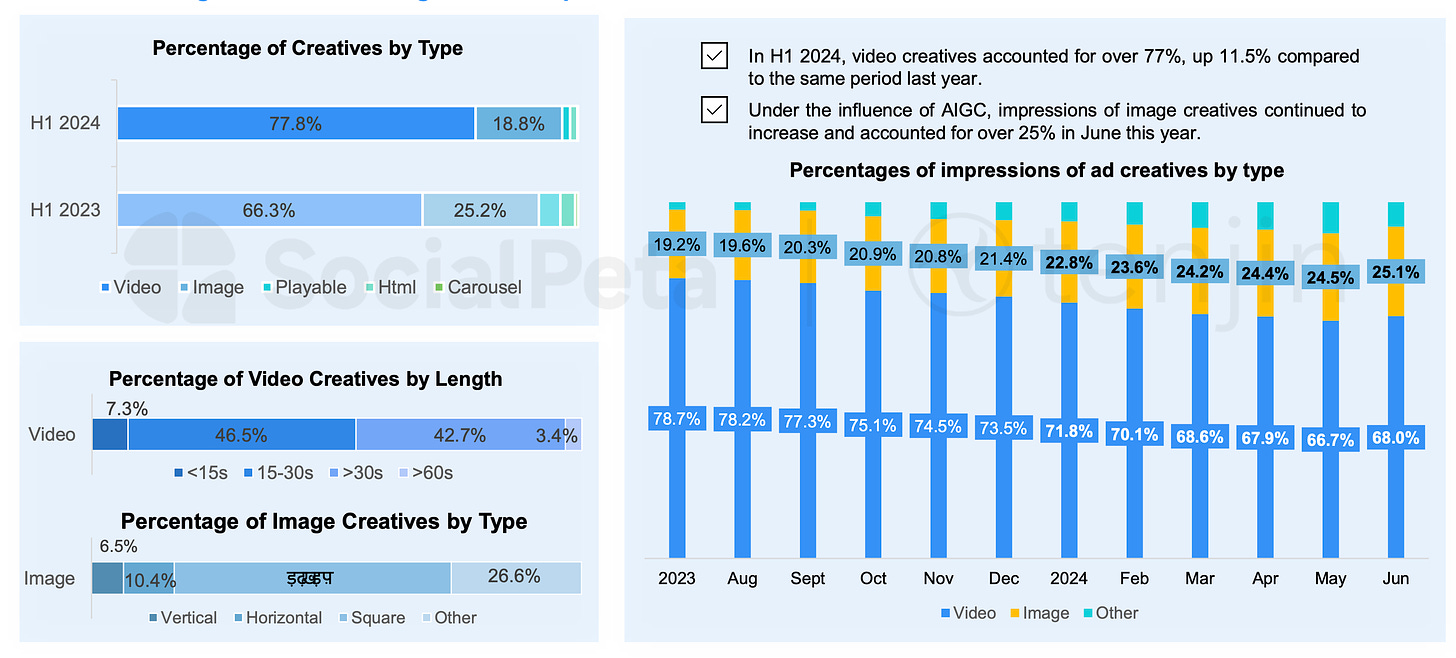
❗️SocialPeta is connecting the increased impressions of image creatives with AI-generated creatives.
Advertising Leaders
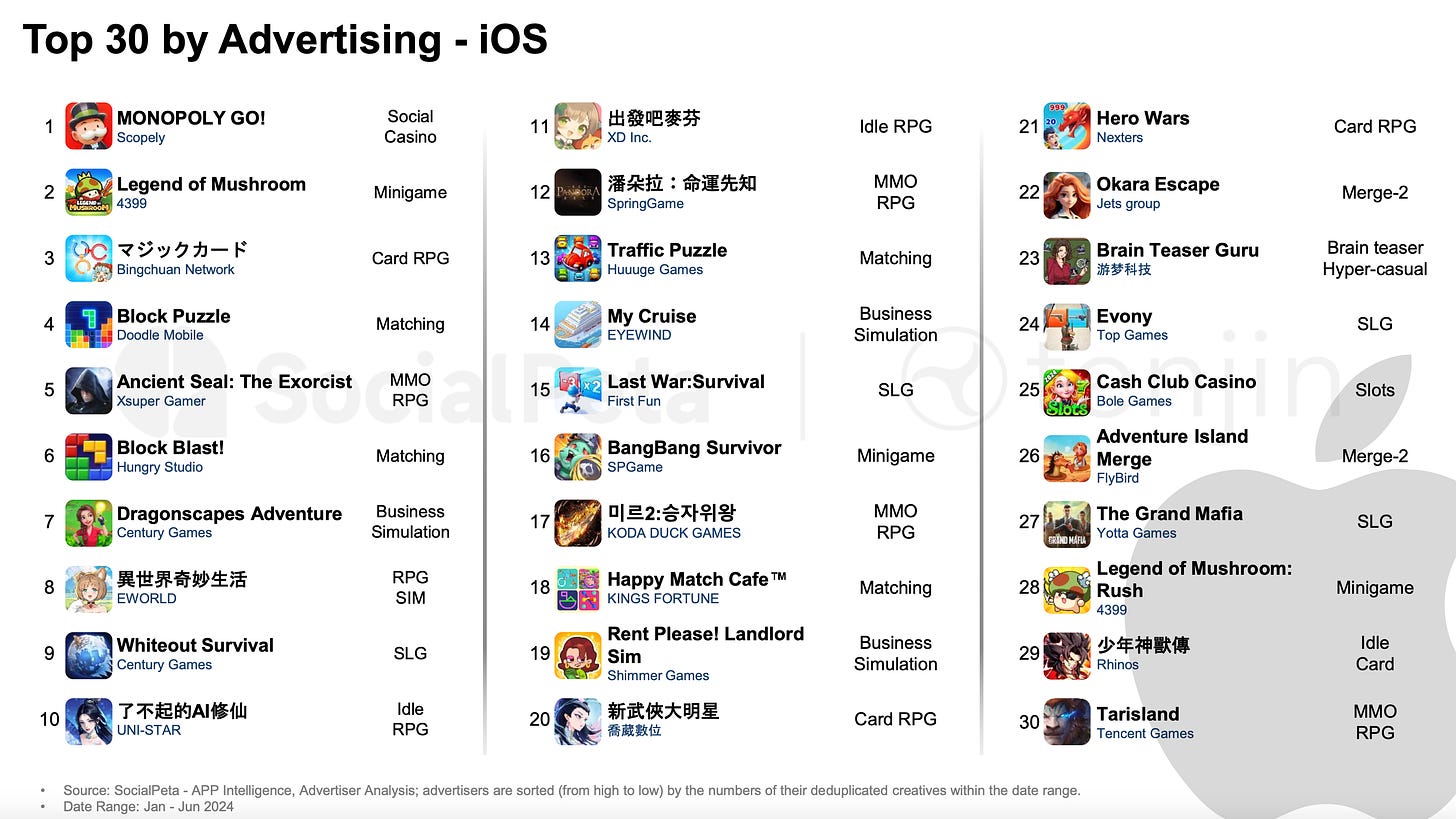
- The most creatives in H1'24 on Android came from Jewel Abyss, Tycoon Casino Vegas Slot Games, and Block Blast!. On iOS, the leaders were MONOPOLY GO!, Legend of Mushroom, and Hero Clash Battle (マジックカード).
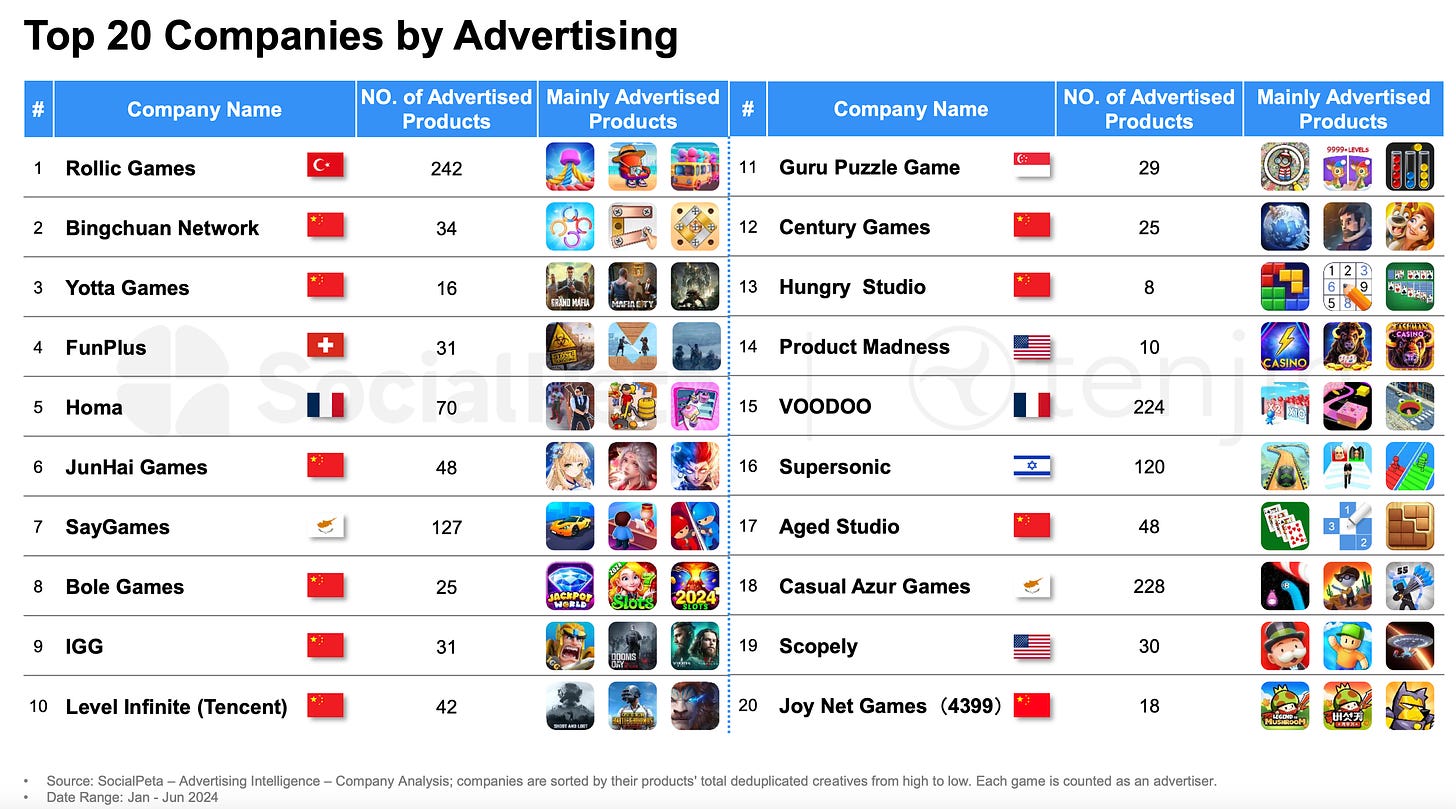
- Rollic Games, Bingchuan Network, and Yotta Games were the most effective companies in the advertising market, producing the most creatives. Among the top 20, there were 10 companies from China, 2 from the USA, 2 from France, 2 from Cyprus, and one each from Turkey, Singapore, Israel, and Switzerland.
Marketing Spend Trends
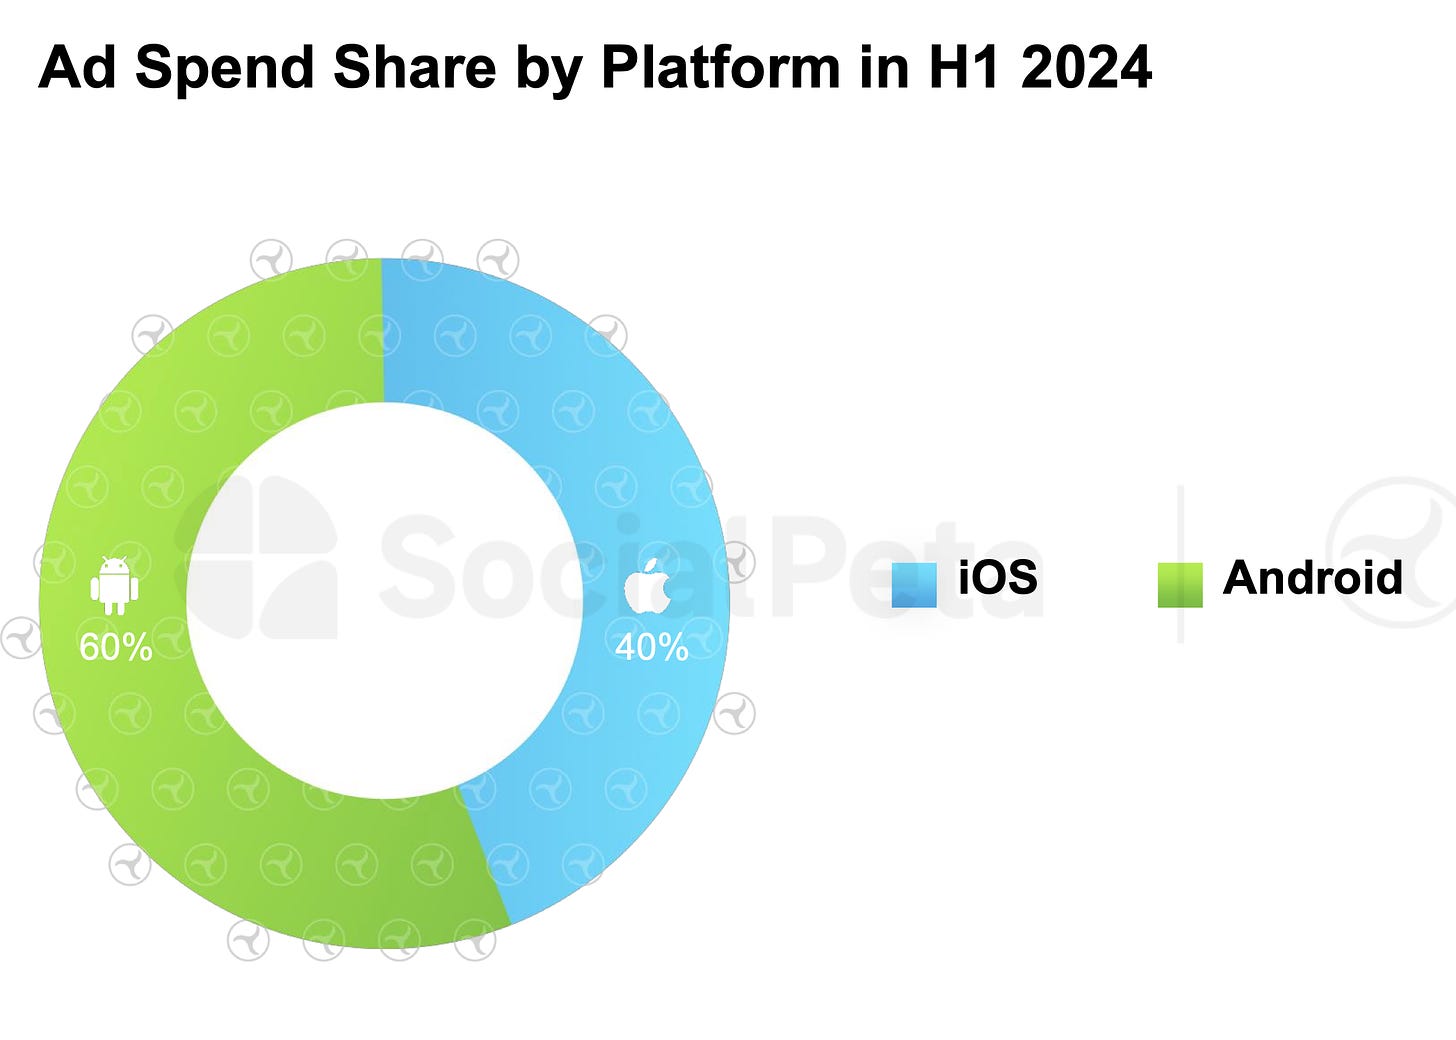
- According to Tenjin, 60% of budgets in H1'24 went to Android, and 40% to iOS.
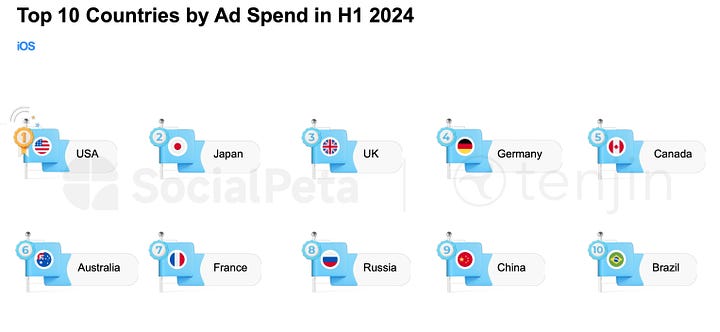
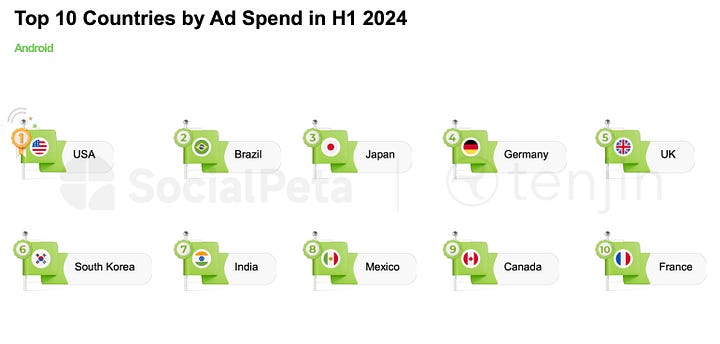
- The USA, Brazil, and Japan were the leaders in spending on Android. On iOS, the leaders were the USA, Japan, and the UK.
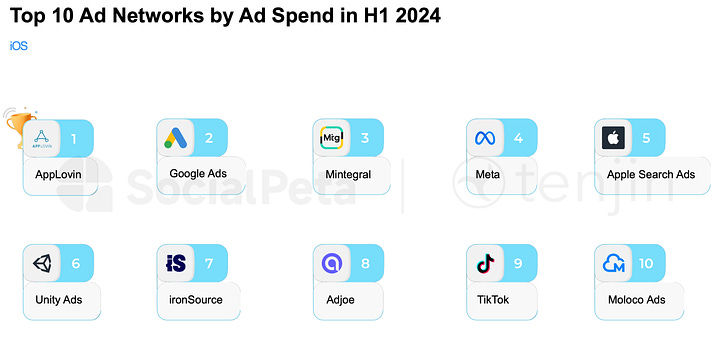
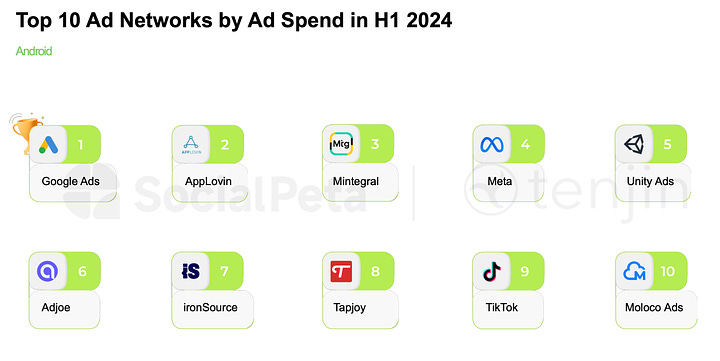
- Google Ads, AppLovin, and Mintegral were the leaders in spending on Android. On iOS, the same leaders were present, but in a slightly different order: AppLovin, Google Ads, and Mintegral.
Interesting Marketing Trends in H1'24
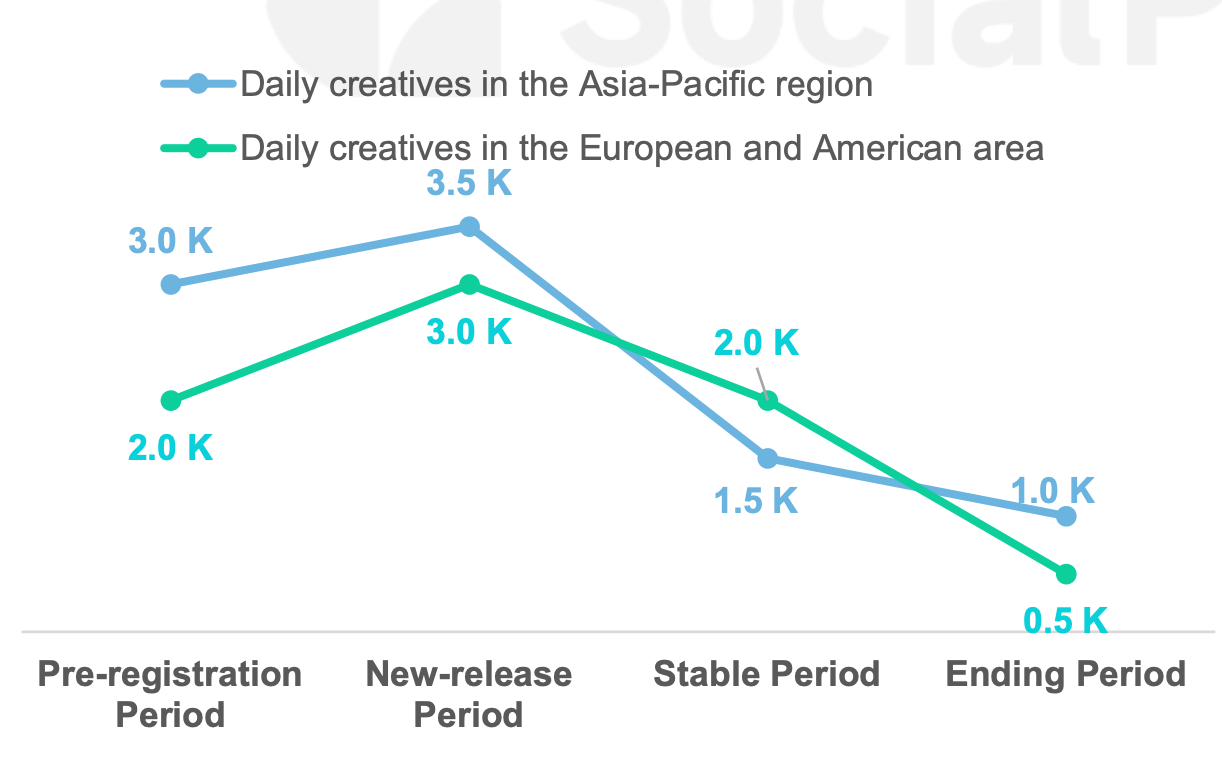
- SocialPeta and Adjust note that the approach to marketing differs between East and West. In the East, there is more investment in advertising before the project launch, while in the West, the focus shifts toward a calmer launch with subsequent support.
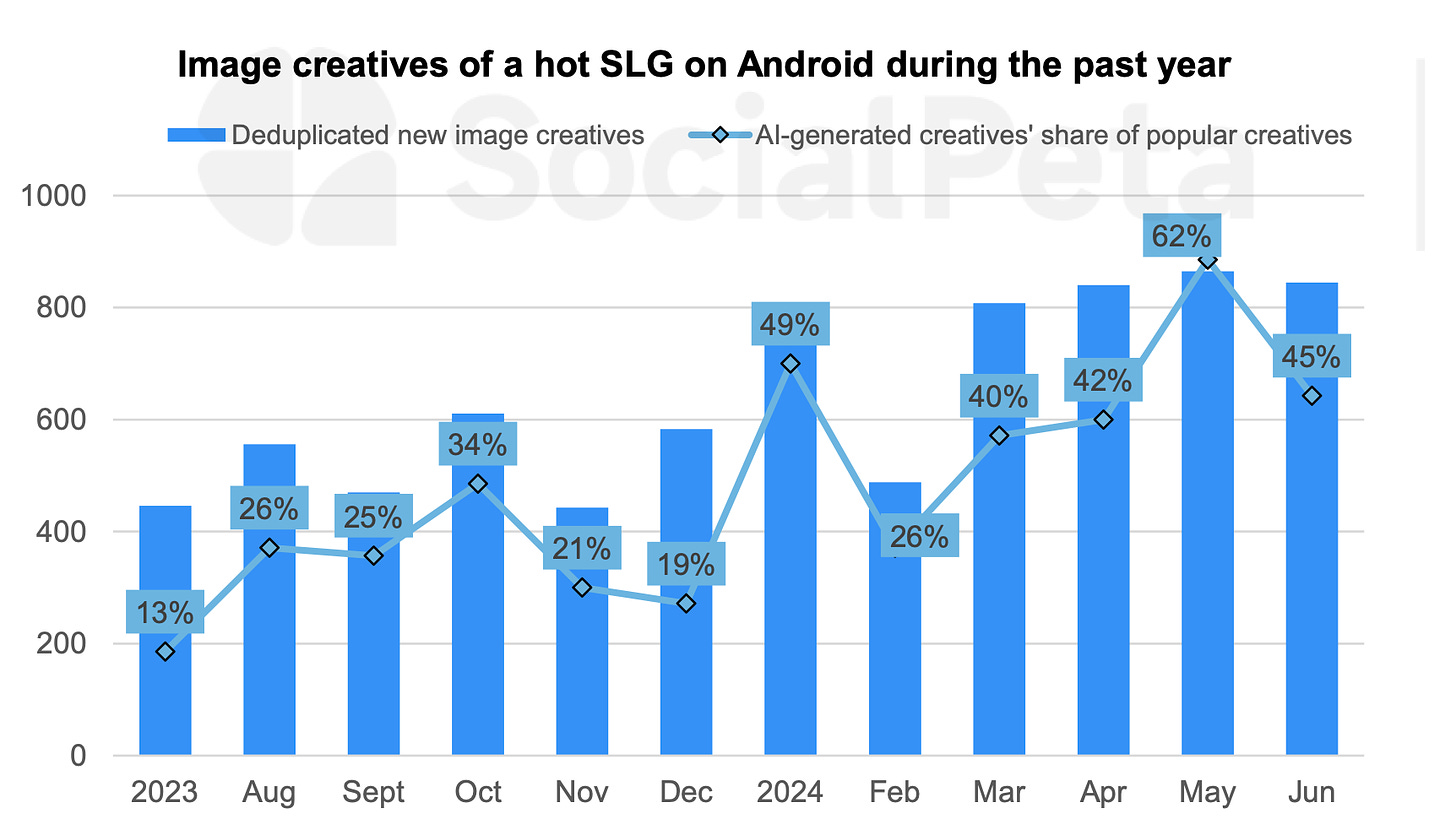
- The number of AI-generated creatives is growing significantly, especially among RPG and strategy games. In H2'23, the share of AI-generated creatives in strategy games on Android was 25%; by H1'24, this percentage had risen to 44%.
GSD & GfK: Sales of PC/Console Games in Europe suddenly rose in July 2024

Game Sales
- 2.4M games were sold in Europe in July. This is 3.4% more than last year.
- Out of all the titles in the top 10, the only game released in 2024 is Luigi's Mansion 2 HD. The leaders are EA Sports FC 24 (released in 2023), Grand Theft Auto V (released in 2013), and Elden Ring (released in 2022).
- EA Sports FC 24 sold 69% better in July than FIFA 23 did in July of last year. That's the power of branding. However, it's worth noting that last year, there was no European Championship.
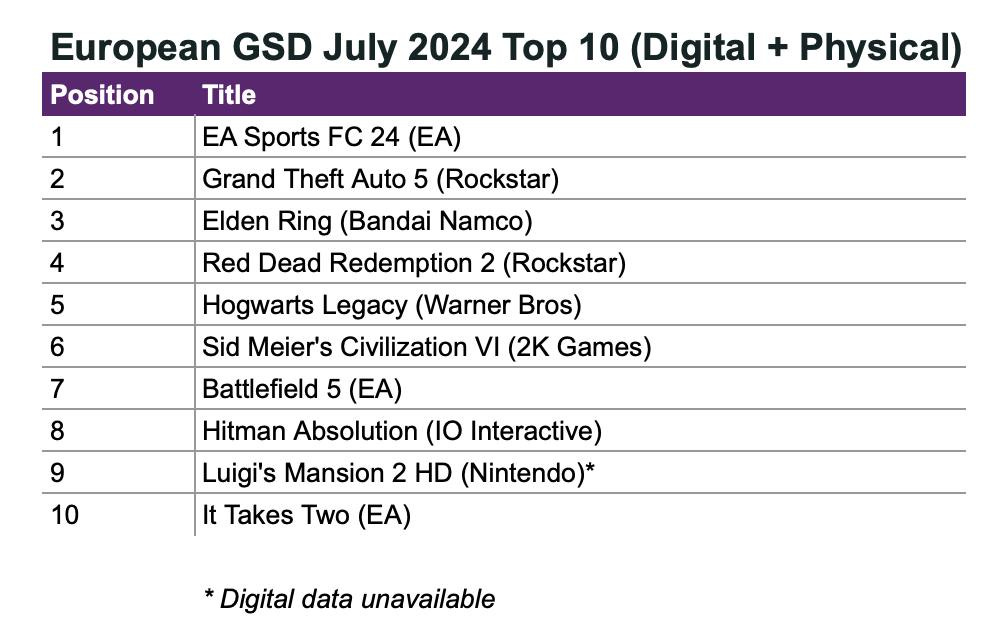
- Hitman Absolution became a free game on Amazon Prime in July, which helped it jump to the 8th spot on the sales chart.
❗️It’s a bit unclear, though, if those “free” copies are getting into overall equation. Might it be that the market is “up” because a great game has been giving away? I do not remember any such cases previously.
- EA Sports College Football 25 is the main new release of the month, debuting at the 39th spot.
Hardware and Accessories Sales
Console sales do not include the UK and German markets.
- 263,000 consoles were sold in Europe in July. This is 46% less than a year earlier.
- PlayStation 5 sales plummeted by 56% YoY. Nevertheless, it remains the best-selling console.
- The number of Nintendo Switch units sold fell by 29% YoY, while Xbox Series S|X dropped by 42% over the same period.
- 1.08M gaming accessories were sold in July. DualSense was the leader, but overall sales fell by 20% compared to last year.
Games & Numbers (August 7 - August 23)

PC/Console Games
- Black Myth: Wukong has been purchased over 10 million times. The simultaneous number of players across all platforms exceeded 3 million people. On Steam, the peak online count reached 2.41 million. All these are real figures, not calculations or approximations.
- Warner Bros. Discovery and NetherRealm Studios reported 4 million sales of Mortal Kombat 1. The game was released on September 19, 2023.
- The audience of Enshrouded exceeded 3 million people. The game was released in early access on January 24, 2024. The first million players were reached after four days; the second after the first month.
- Balatro was purchased by 2 million people. The developer promises to release a major gameplay update in 2025.
- Abiotic Factor was bought 600,000 times in 3 months. The first 250,000 sales were reached 8 days after release. The USA accounted for 38% of sales, and China for 21%.
Wishlist dynamics for Abiotic Factor before the release.
- Another Crab’s Treasure crossed the mark of 500,000 copies sold. The game took 3.5 months to achieve this.
- Cataclismo, which launched in Early Access at the end of July, has already sold 120,000 copies. The game is published by Hooded Horse.
- The free Once Human was downloaded more than 10 million times. It took just over 1 month to reach this milestone. The mobile version is set to be released at the end of September.
- Hunt: Showdown set a CCU record 5 years after its release. Players were drawn by the new update, and CCU on Steam reached 60,000 users.
- Delta Force: Hawk Ops has over a million wishlists. The game does not yet have a release date.
Mobile Games
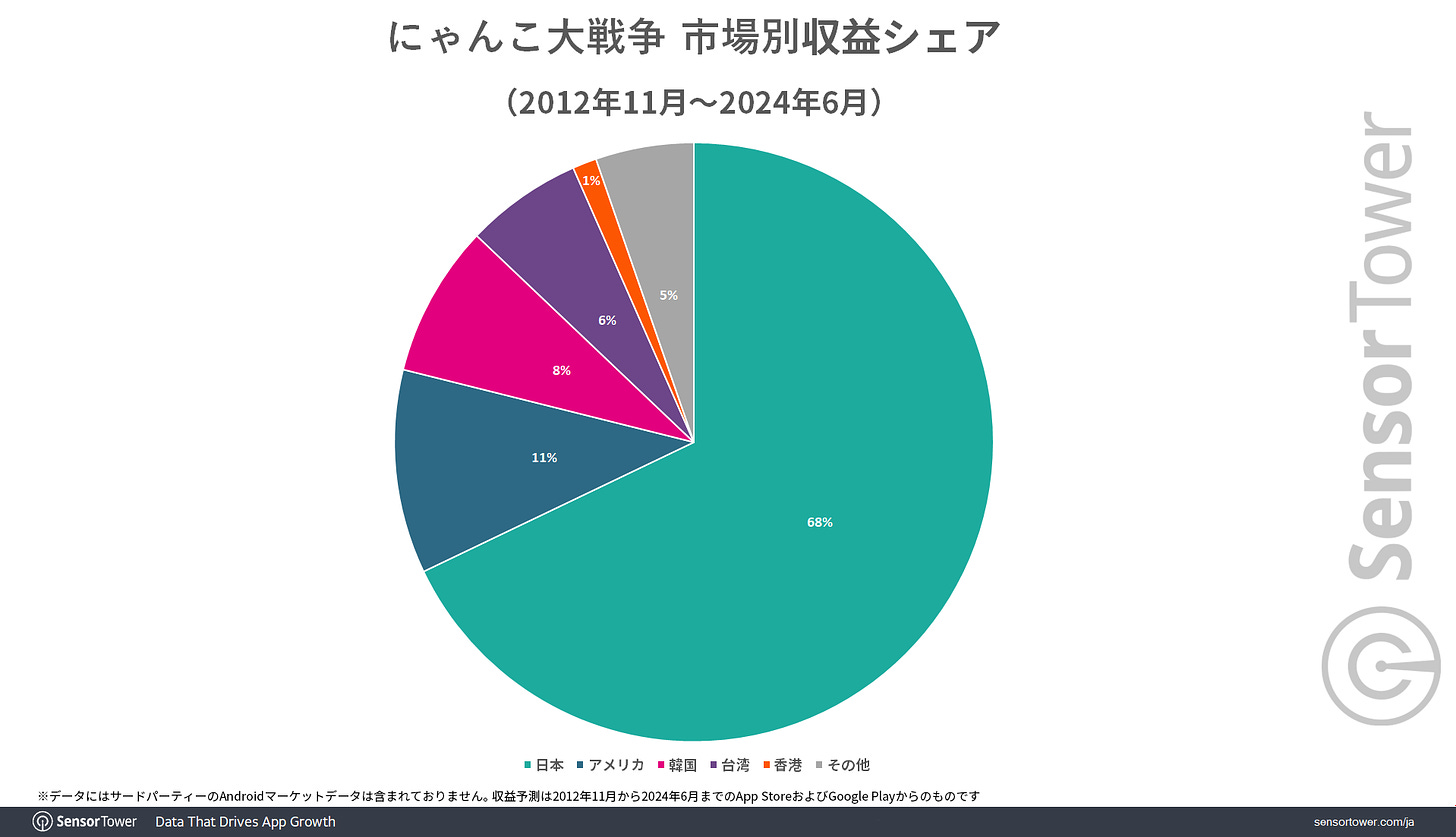
- The Battle Cats from the Japanese studio PONOS has earned more than $700 million, according to Sensor Tower. 68% of the project's revenue came from Japan, 11% from the USA, and 8% from South Korea. The game has over 78.3 million installs, and MAU has not fallen below 1 million people since June 2021.
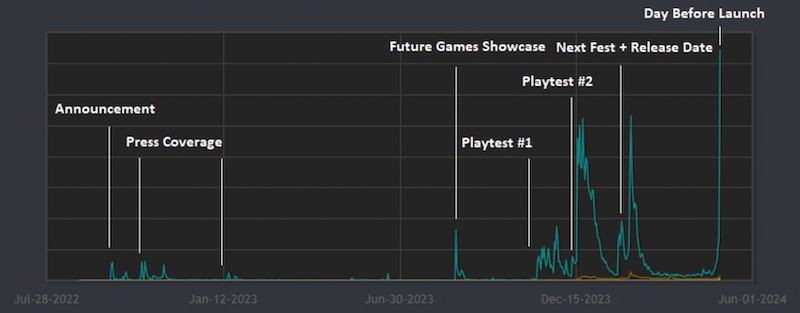
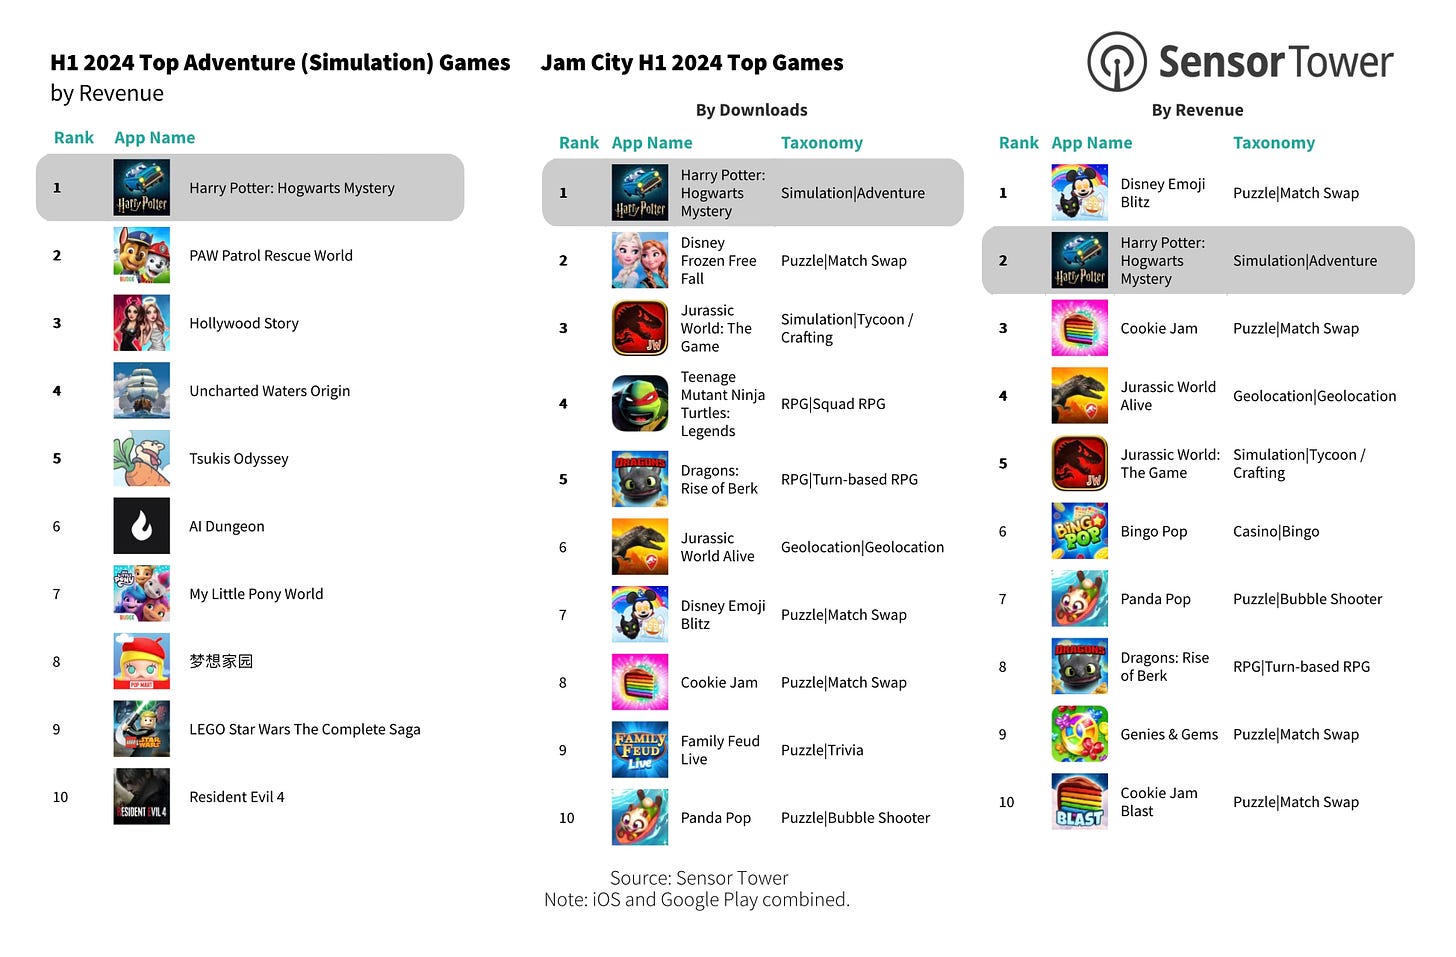
Players have spent over $500 million in Harry Potter: Hogwarts Mystery. The game has been working towards this figure since April 2018. Most of the revenue comes from the USA, Germany, the UK, and France.
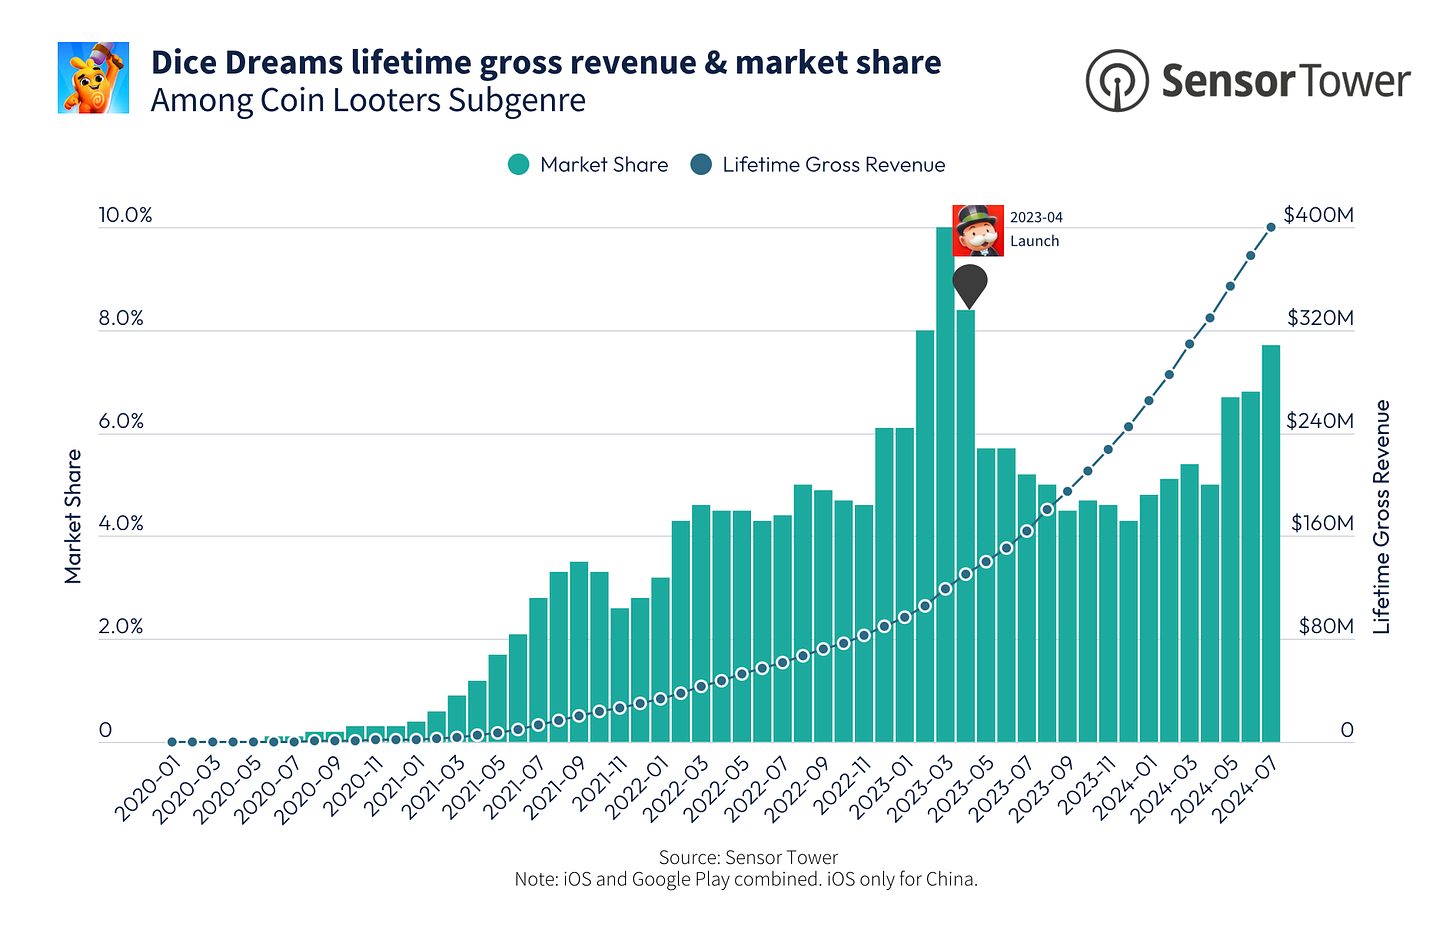
- Dice Dreams has surpassed $400 million in gross revenue, according to Sensor Tower. For three years before the release of MONOPOLY GO!, the game earned $125 million, and the remaining $275 million was earned after the release of the hit from Scopely. The main market for the project is the USA.
- AFK Journey launched in China, and in the first 5 days, users spent $5.1 million in the game, according to AppMagic. This is already 7% of the game's total revenue of $78.8 million.
- The head of Epic Games, Tim Sweeney, estimated the losses due to the removal of Fortnite from the App Store and Google Play at $1 billion. However, he believes that this is a "small price for freedom."
Circana: The US Gaming Market grew by 10% in July 2024

- The American audience spent $4.773 billion on games in July 2024, which is 10% more than in July of the previous year.
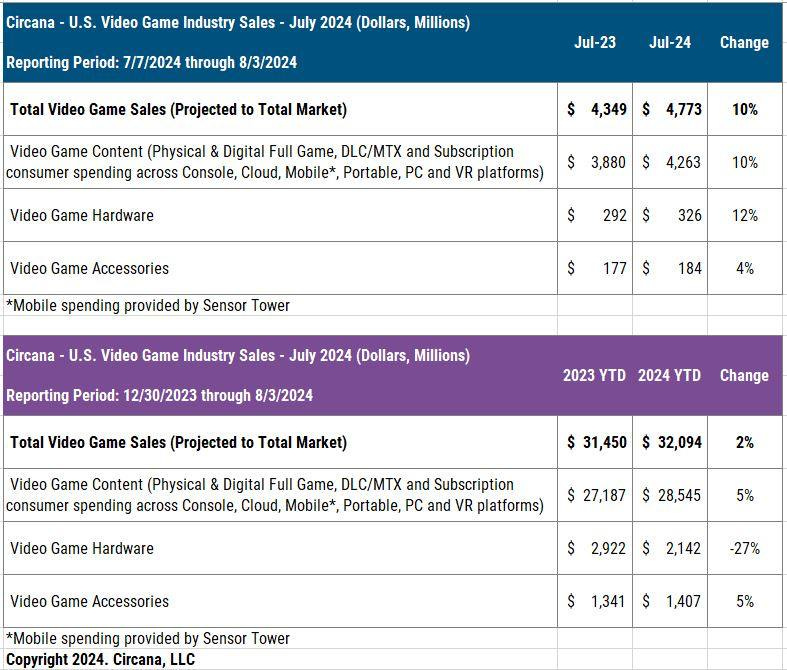
- All segments experienced growth: game sales increased by 10% (to $4.263 billion); hardware sales grew by 12% (to $326 million); accessory sales rose by 4% (to $184 million).
- PlayStation 5 sales increased by 25% year-over-year; Xbox Series S|X sales rose by 48%. However, Nintendo Switch sales decreased by 44%. A total of 771,000 consoles were sold. PS5 was the best-selling console both in units and in dollar terms. Xbox Series S|X was second.
- The best-selling accessory in the US remains the PlayStation Portal. The black DualSense leads in terms of units sold.
- Console game sales grew by 29% in July; the mobile market increased by 7.6%. However, sales on PC, in the cloud, and non-console VR declined by 6%.
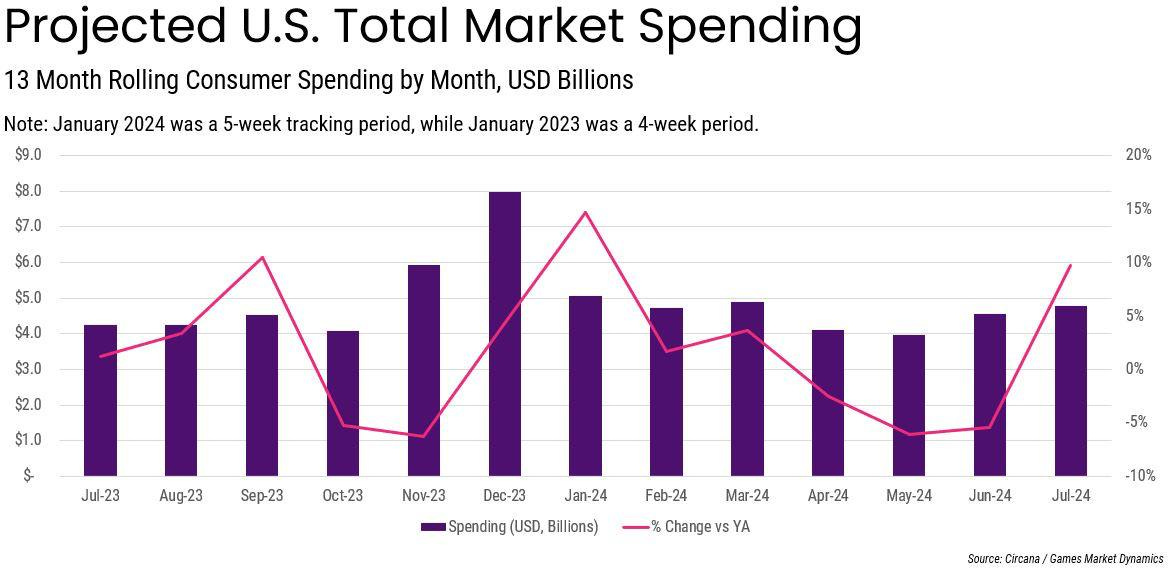
- Comparing the first seven months of 2024 with the same period in the previous year, there is a 2% growth ($32.094 billion versus $31.450 billion in 2023). The growth is due to increased game and accessory sales (up by 5%); however, hardware sales in the first seven months of 2024 were 27% lower.
❗️Despite all great news, Mat Piscatella forecasts a 2.2% decline in the US market by the end of the year.
Top-selling Premium games in the US in July
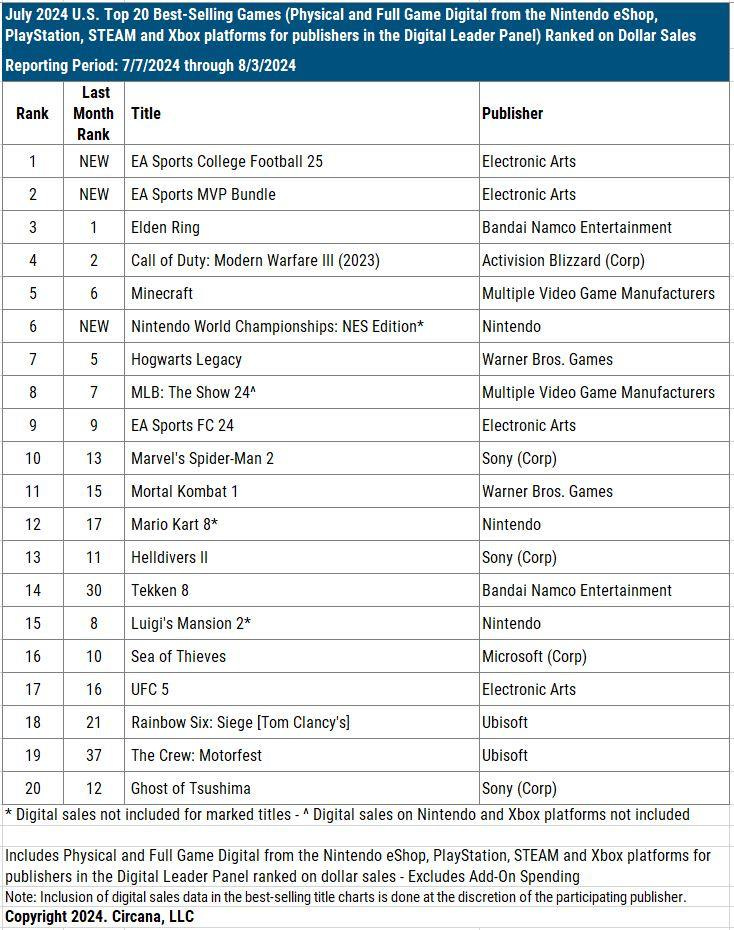
- EA Sports College Football 25 had a fantastic debut. The game became the top seller in July and also jumped to the first spot among the best-selling games in the US in 2024 in dollar terms. It surpassed Helldivers II in dollar sales in less than two weeks. EA Sports College Football 25 sold three times better in dollar terms in the first couple of weeks than the previous entry in the series, NCAA Football 07.
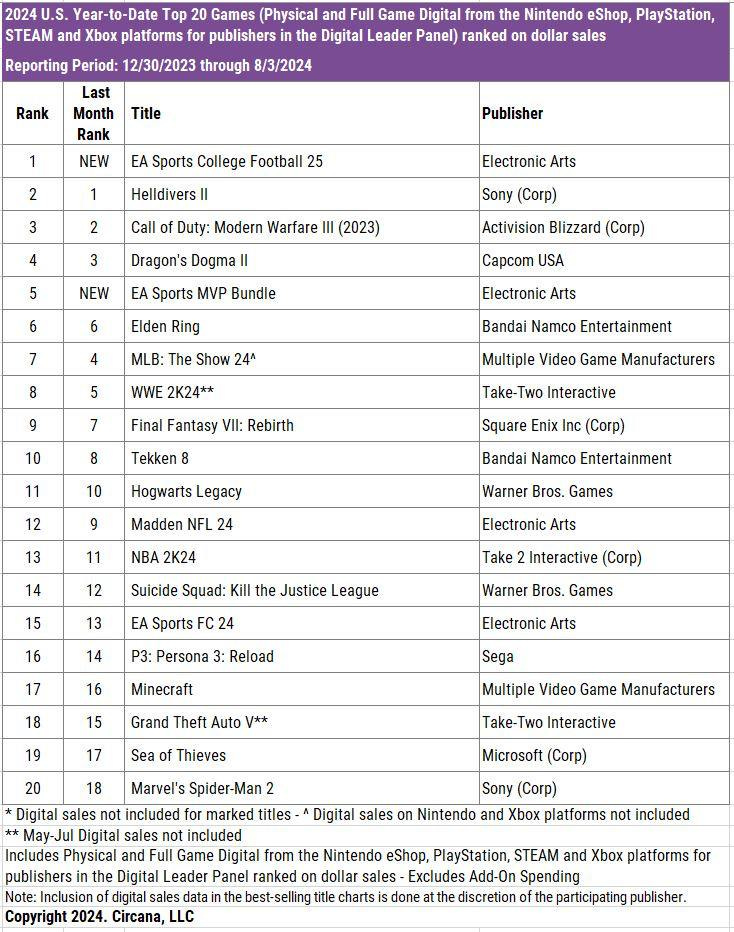
- EA Sports MVP Bundle (which includes EA Sports College Football 25 and Madden NFL 25) was the second best-selling game in July; it ranked 5th overall for 2024.
- Another new entry in the rankings was Nintendo World Championships: NES Edition. Based on physical copies alone, the game ranked 6th in July sales.
- The top-grossing mobile games in July were MONOPOLY GO!, Roblox, Royal Match, Candy Crush Saga, and Pokemon GO. Simulator games (such as Township, Roblox, Minecraft) saw a significant revenue increase in July—up by 38%. Shooter games also saw a substantial revenue rise in the US market—Garena: Free Fire, PUBG Mobile, GODDESS OF VICTORY: NIKKE grew by over 50%. Call of Duty: Mobile grew by 32% in July. All figures are compared to June.
PC/Console Charts
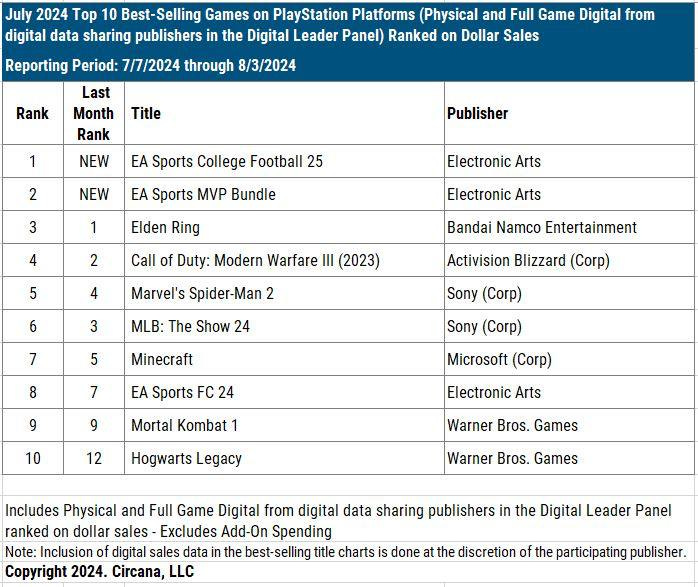
- EA Sports College Football 25 and EA Sports MVP Bundle were the top sellers on PlayStation in July. Elden Ring took third place.

- There are changes in the PlayStation MAU rankings. The First Descendant made it into the top 10 for the first time (ranked 4th); EA Sports College Football 25 also ranked 7th.
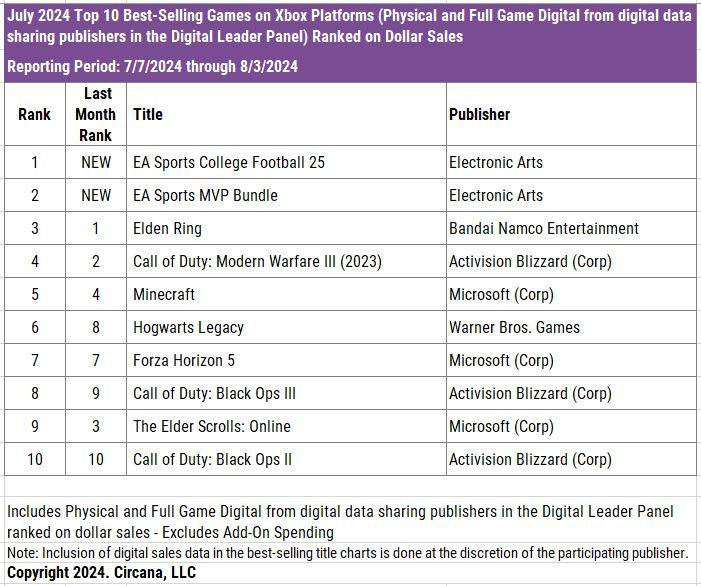
- Sales on Xbox Series S|X are almost similar to PlayStation 5.
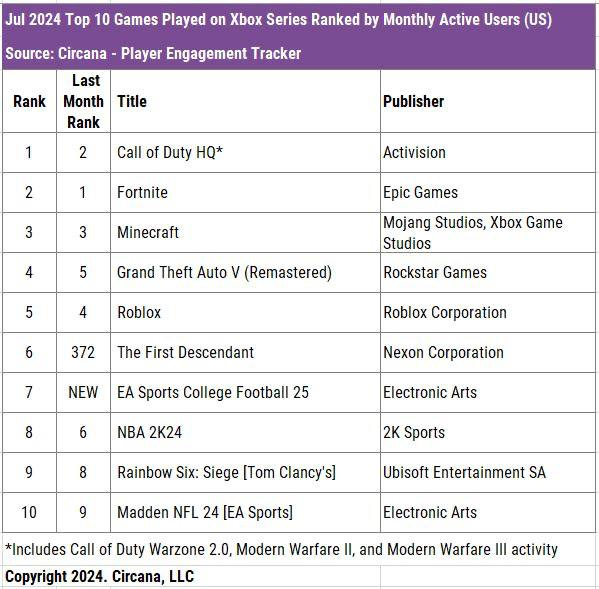
- The First Descendant ranked 6th in MAU on Xbox; EA Sports College Football 25 ranked 7th.
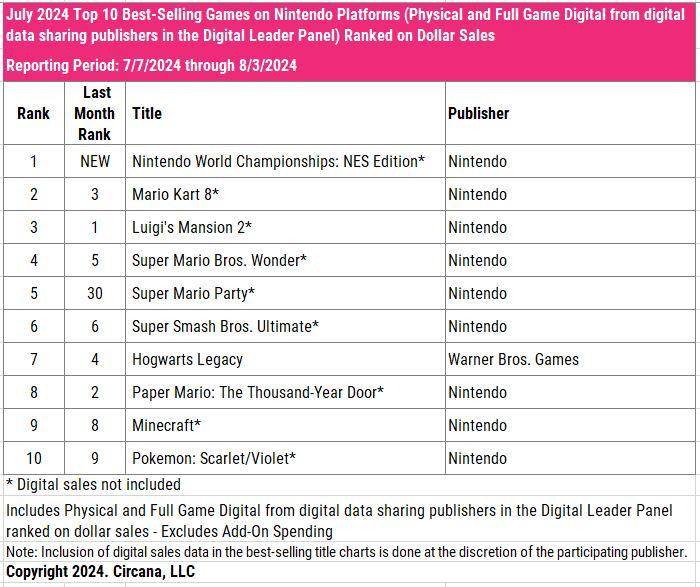
- Nintendo World Championship: NES Edition was the best-selling game on Nintendo Switch in July. Super Mario Party also returned to the top 10.
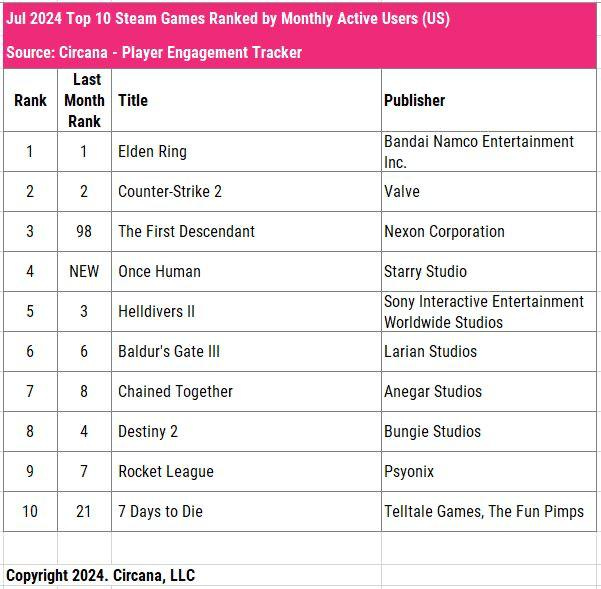
- There were changes on Steam as well. The First Descendant ranked 3rd in MAU, and Once Human ranked 4th. 7 Days to Die returned to the top 10.
Stream Hatchet: Gaming Streaming Market in Q2'24
Market Situation
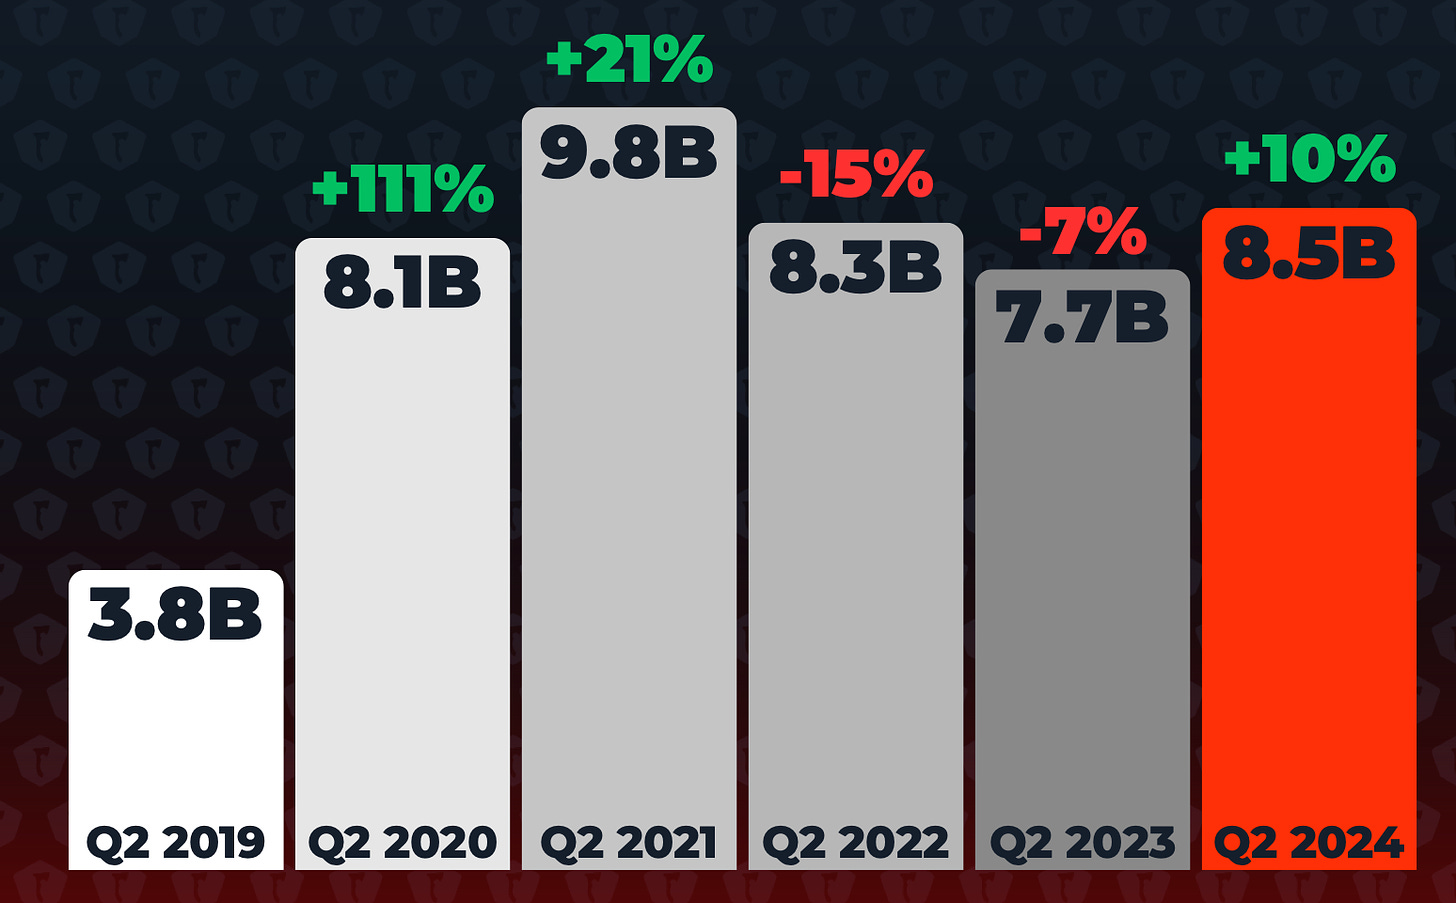
- Gaming stream views in Q2 2024 reached 8.5 billion hours, a 10% increase from the previous year. After two years of decline, the second quarter is positive again. Experts attribute this to the growth of Kick, Rumble, and CHZZK. Interestingly, the number of hours watched surpassed the pandemic year of 2020 by 4.8%.
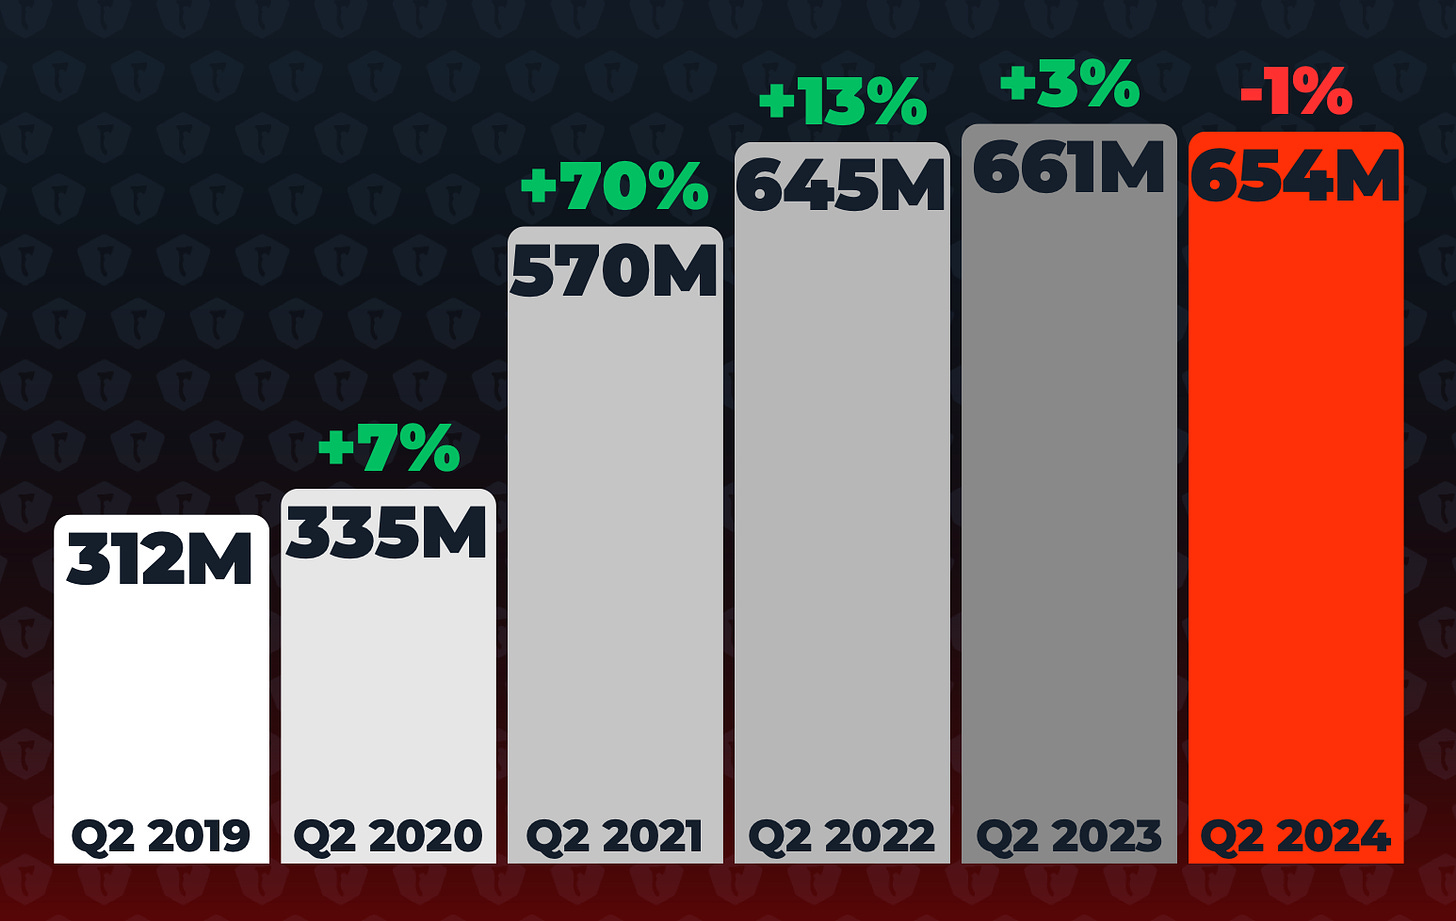
- Esports event views in Q2 2024 dropped by 1% to 654 million hours, marking the first decline since 2019. However, the Q2 2024 results are still the second highest in history. The most-watched tournament was the 2024 Mid-Season Invitational for League of Legends (70 million hours, accounting for 10.7% of the total).
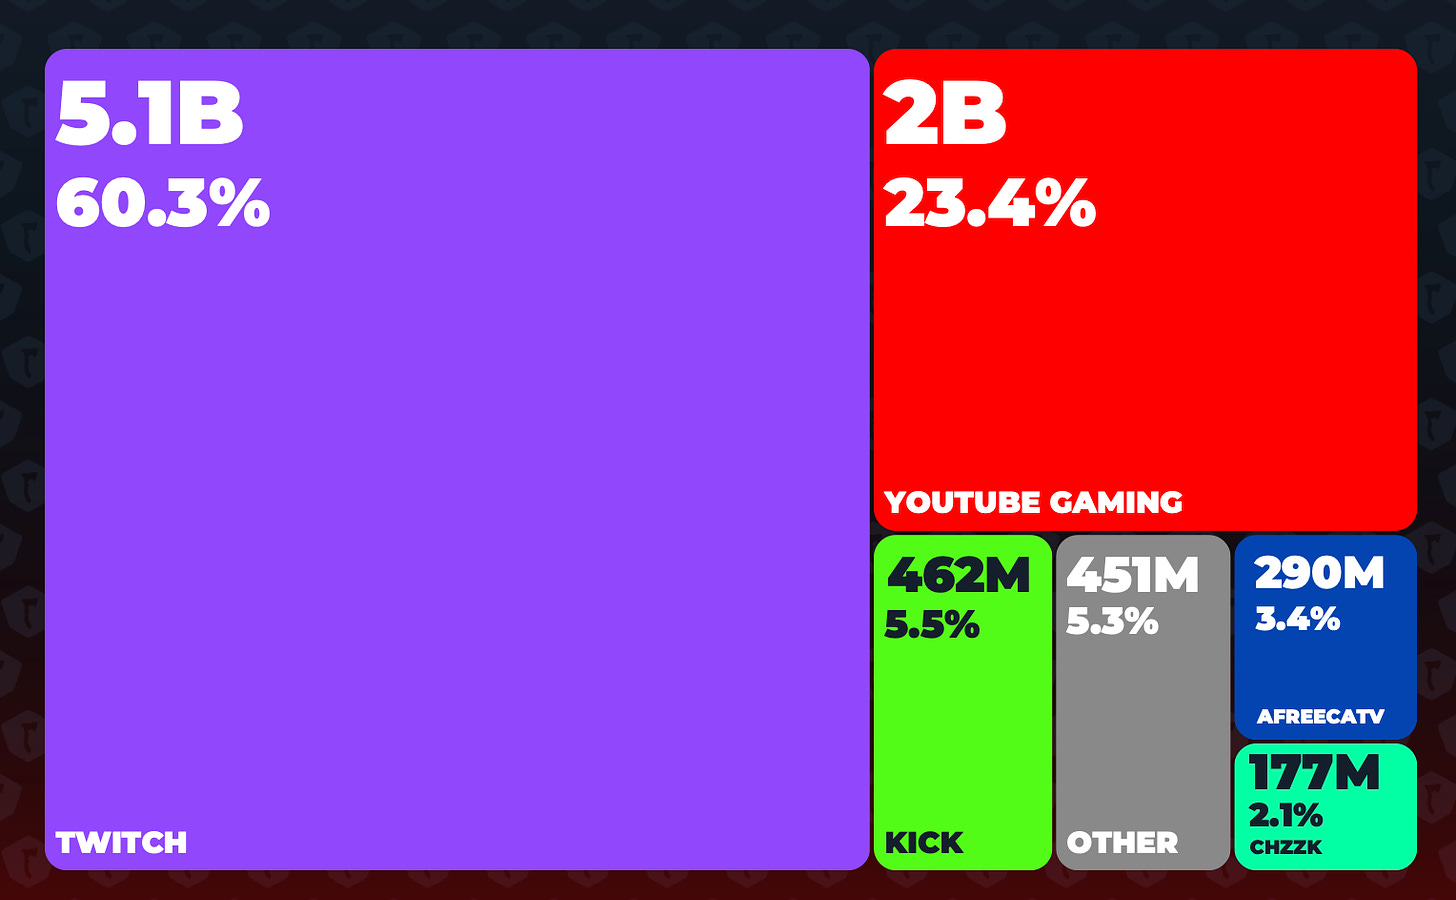
- Twitch held 60.3% of the market in Q2 2024 (down from 70% in Q2 2023); YouTube Gaming had 23.4% (up from 17% in Q2 2023); Kick held 5.5%. Facebook fell out of the top 5 in terms of audience, with AfreecaTV in 4th place (3.4%); and the new South Korean platform CHZZK in 5th place (2.1%).
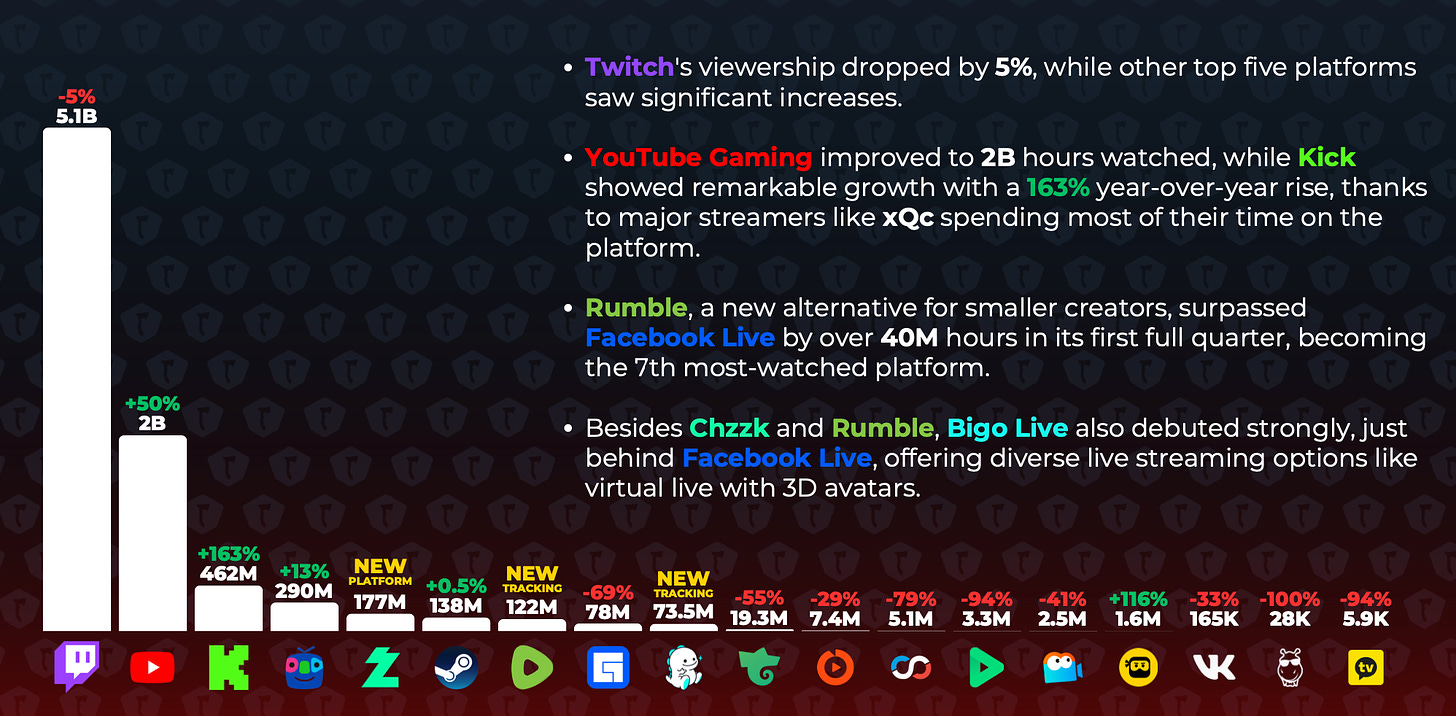
- Twitch views in Q2 2024 fell by 5% compared to Q2 2023. All other platforms in the top 5 saw growth. YouTube Gaming grew by 50% YoY; Kick by 163% YoY; AfreecaTV by 13%; no growth data is available for CHZZK as it is a new platform. Facebook Live dropped by 69% YoY, ranking 8th in popularity in Q2 2024.
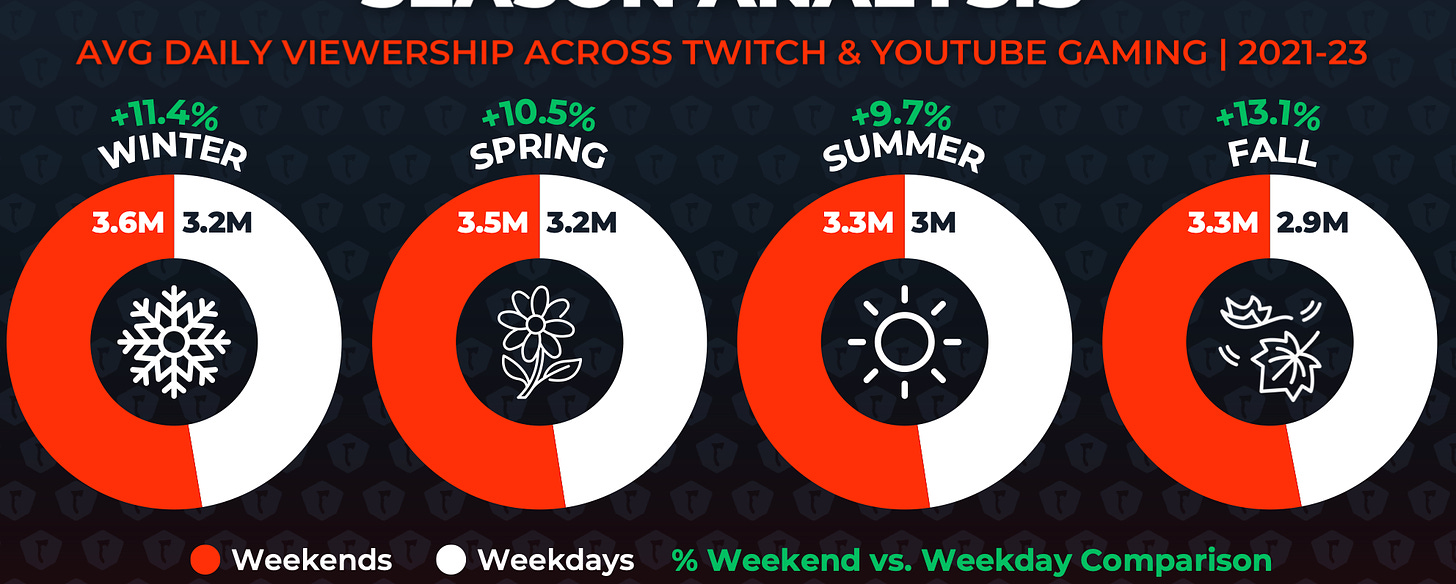
Seasonality in Twitch and YouTube Gaming
-
The biggest difference between weekday and weekend viewing hours occurs in the fall, with 13.1% more hours watched on weekends. The smallest difference is in the summer at 9.7%, likely due to many people going on vacation.
-
In summer, people watch streams less on weekdays than in winter or spring, but more than in autumn. On weekends, summer viewing is similar to autumn but still less than in spring or winter.
Most Popular Games in Q2 2024
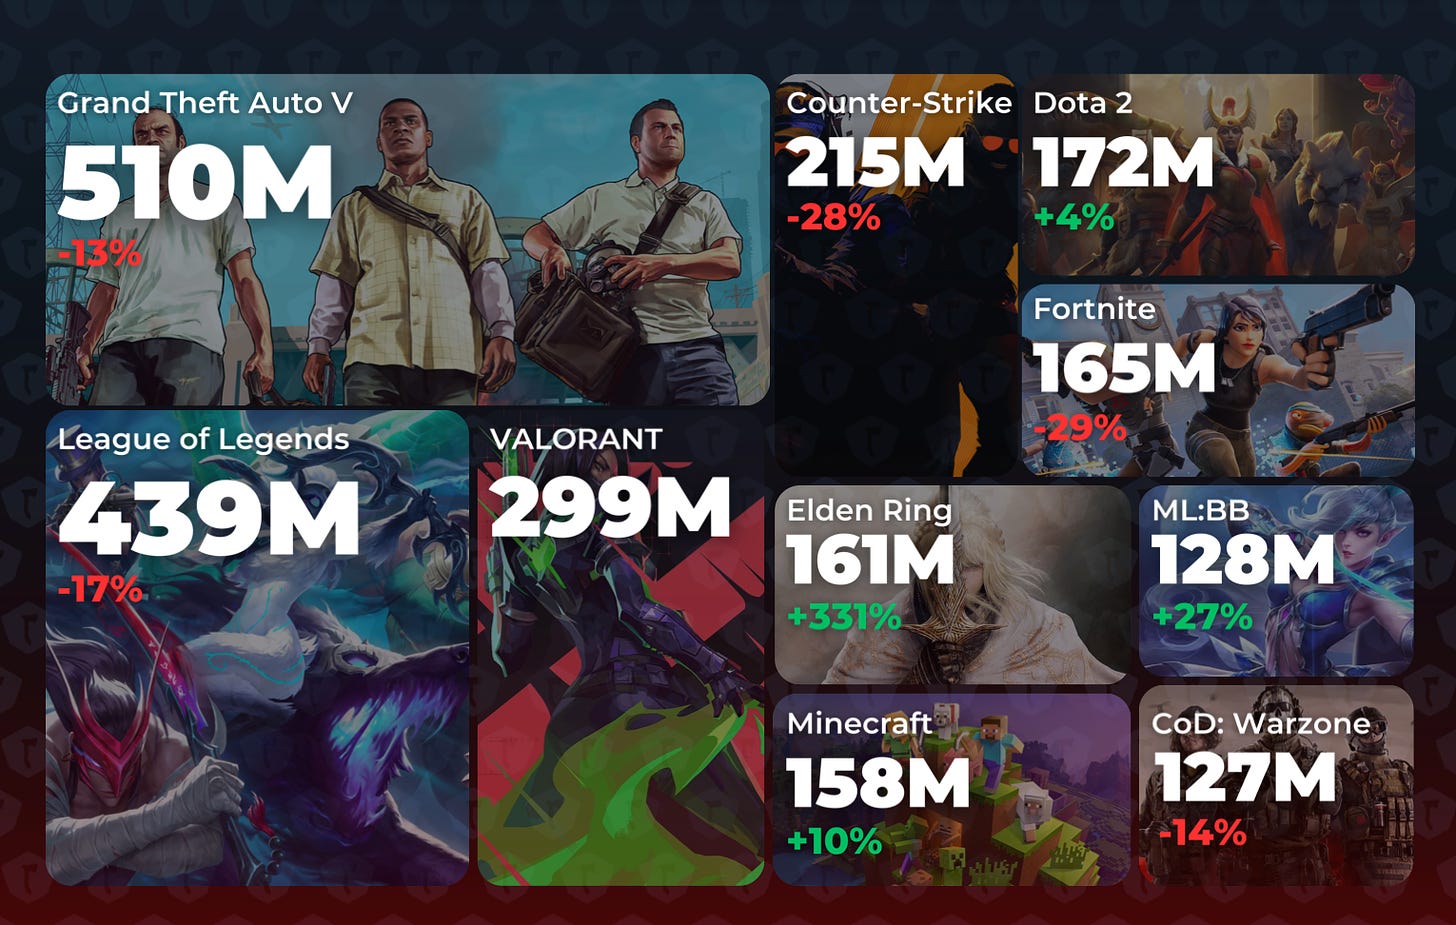
- Grand Theft Auto V (510 million hours, -13% YoY), League of Legends (439 million hours, -17% YoY), and Valorant (299 million hours) were the leaders in viewership.
- Elden Ring saw the largest growth in Q2 2024, with views up by 331% (reaching 161 million hours), driven by the release of a DLC.
- Mobile Legends: Bang Bang also saw significant growth in the top 10, influenced by esports.
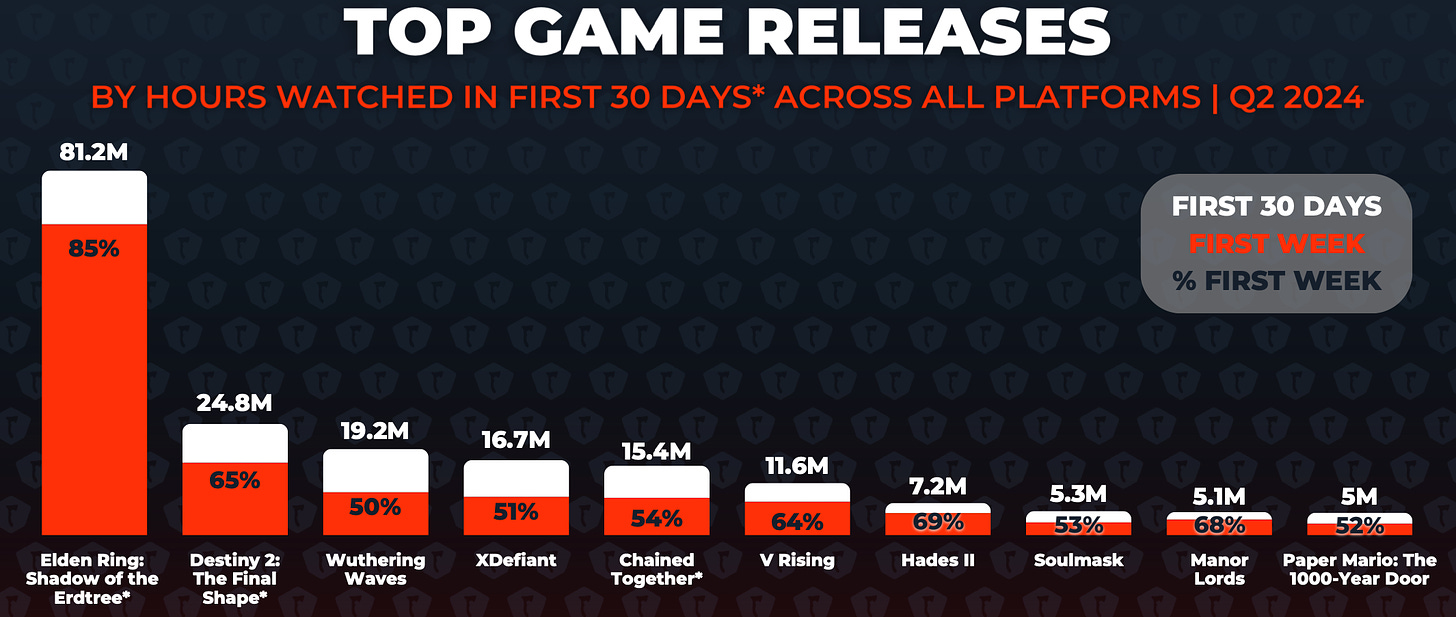
- The best launches in Q2 2024 were Elden Ring: Shadow of the Erdtree (81.2 million hours), Destiny 2: The Final Shape (24.8 million hours), and Wuthering Waves (19.2 million hours). Interestingly, expansions outperformed full games in popularity. It's also worth noting XDefiant in 4th place with 16.7 million hours.
Most Popular Genres in Q2 2024
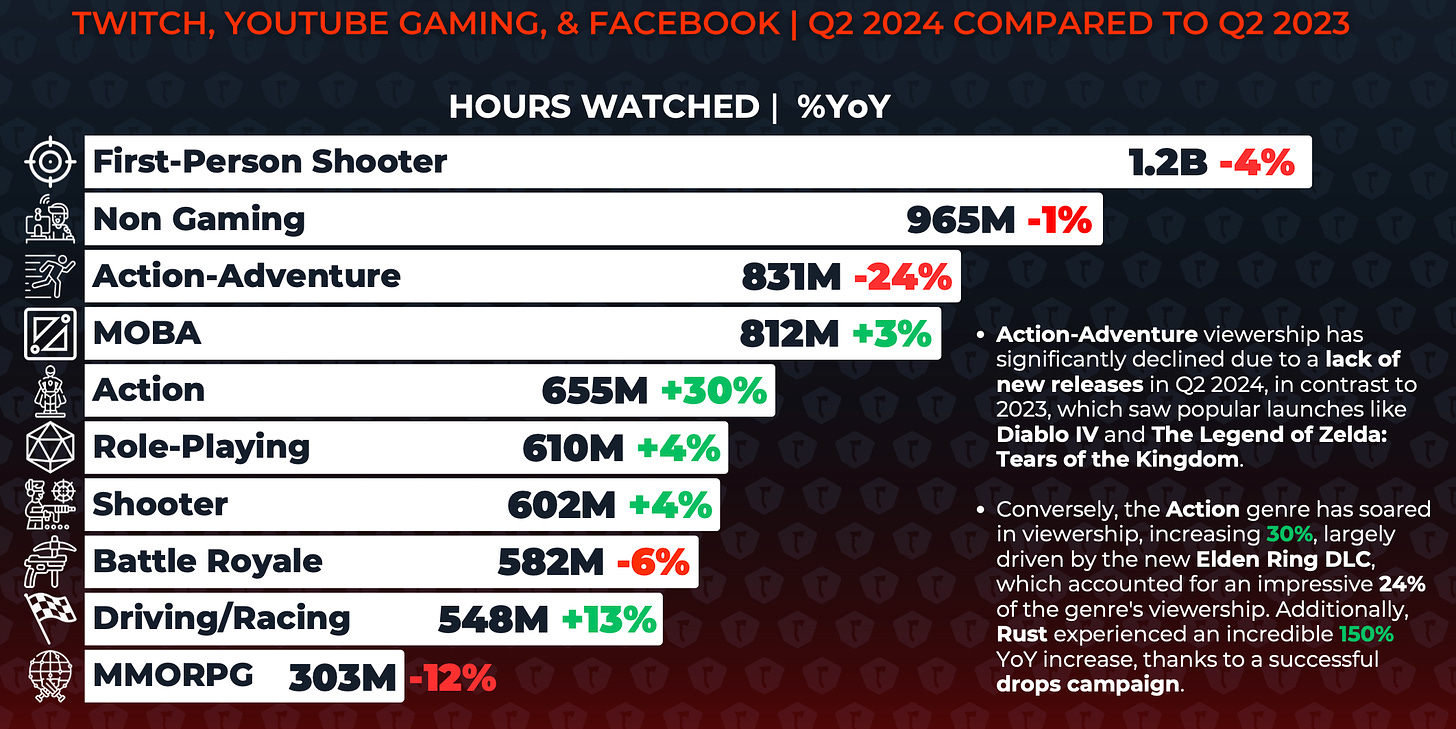
- FPS (1.2 billion hours, -4% YoY), Action-Adventure (831 million hours, -24% YoY), and MOBA (812 million hours, +3% YoY) were the most popular genres on streaming platforms. The decline in Action-Adventure is due to the lack of major new games, unlike last year when Diablo IV and The Legend of Zelda: Tears of the Kingdom were released.
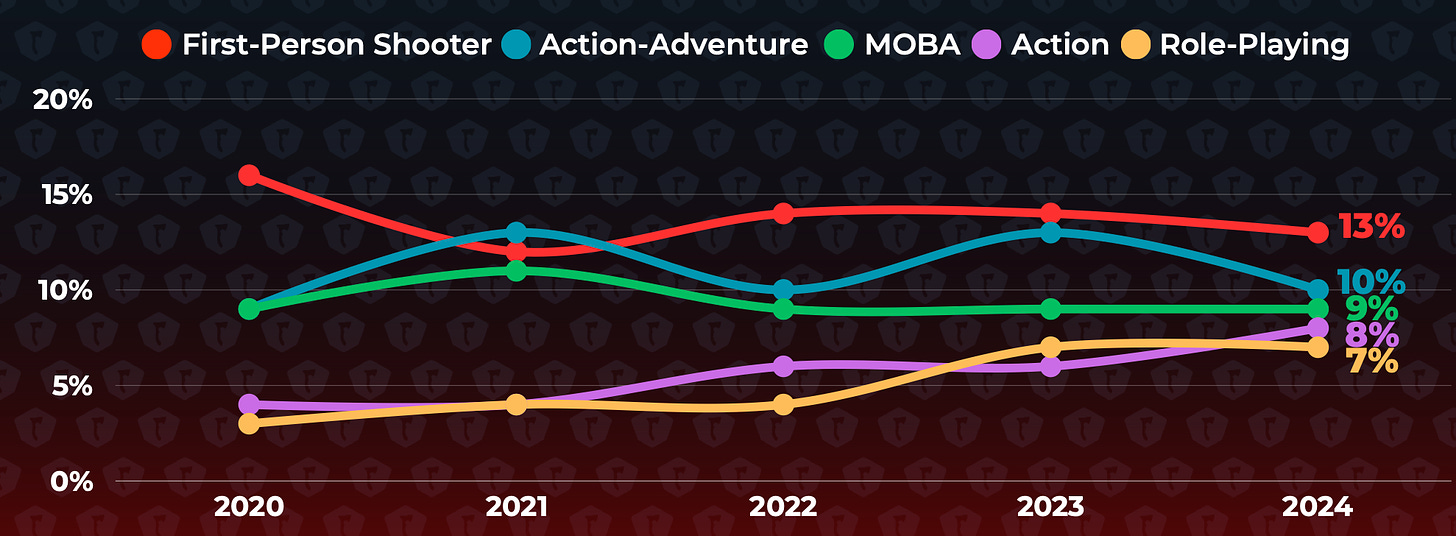
- The share of FPS dropped to 13% in Q2 2024 from 16% in Q2 2020. MOBA's share fell from 11% to 9% over the same period. However, views for Action games rose from 4% in Q2 2020 to 8% in Q2 2024. RPG views increased from 3% to 7%.
Streamer Statistics
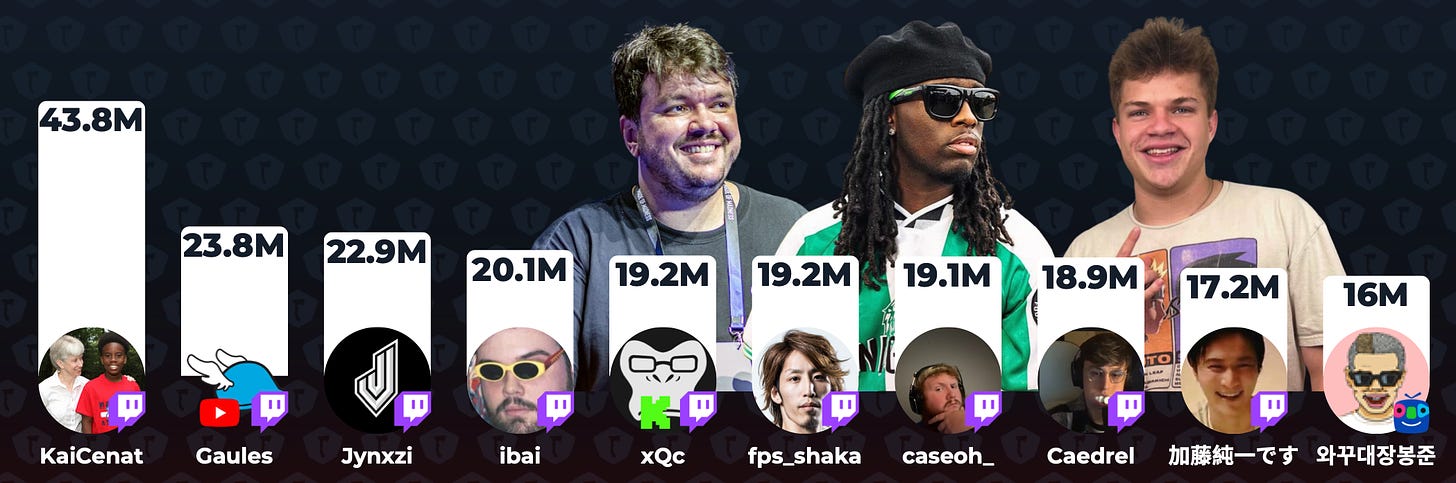
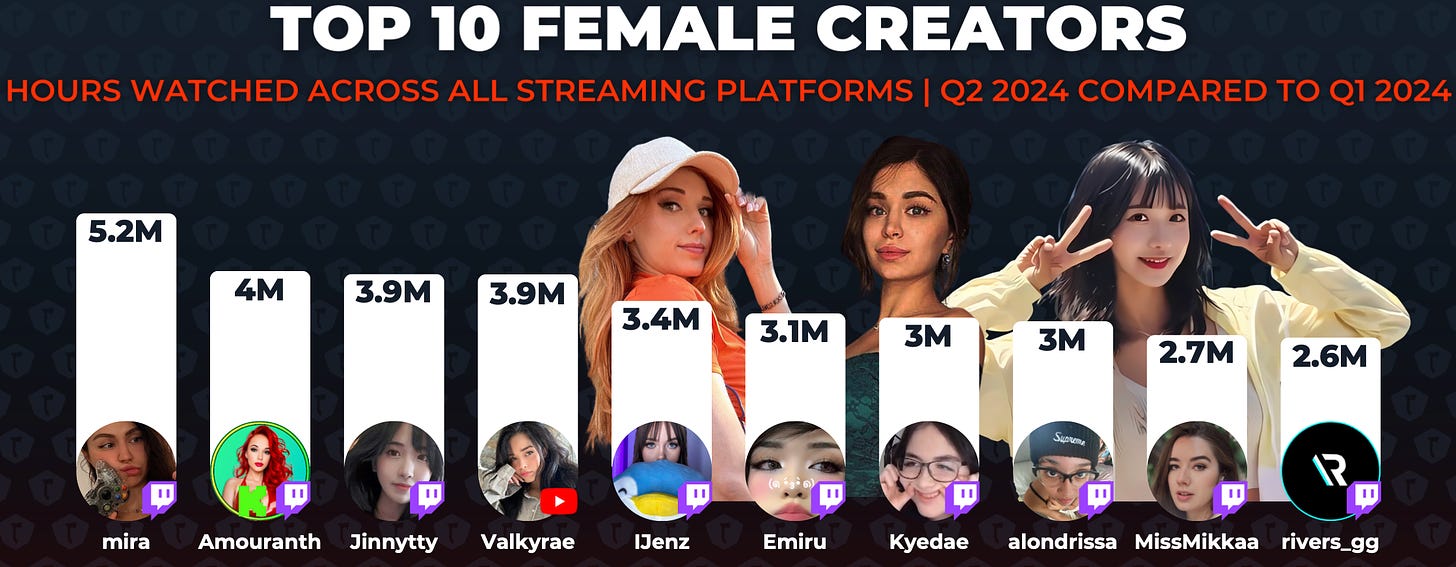
- KaiCenat was the most popular streamer in Q2 2024, with 43.8 million hours watched.
- Over the years, the share of top channels has been declining. This allows new faces to emerge on the scene.
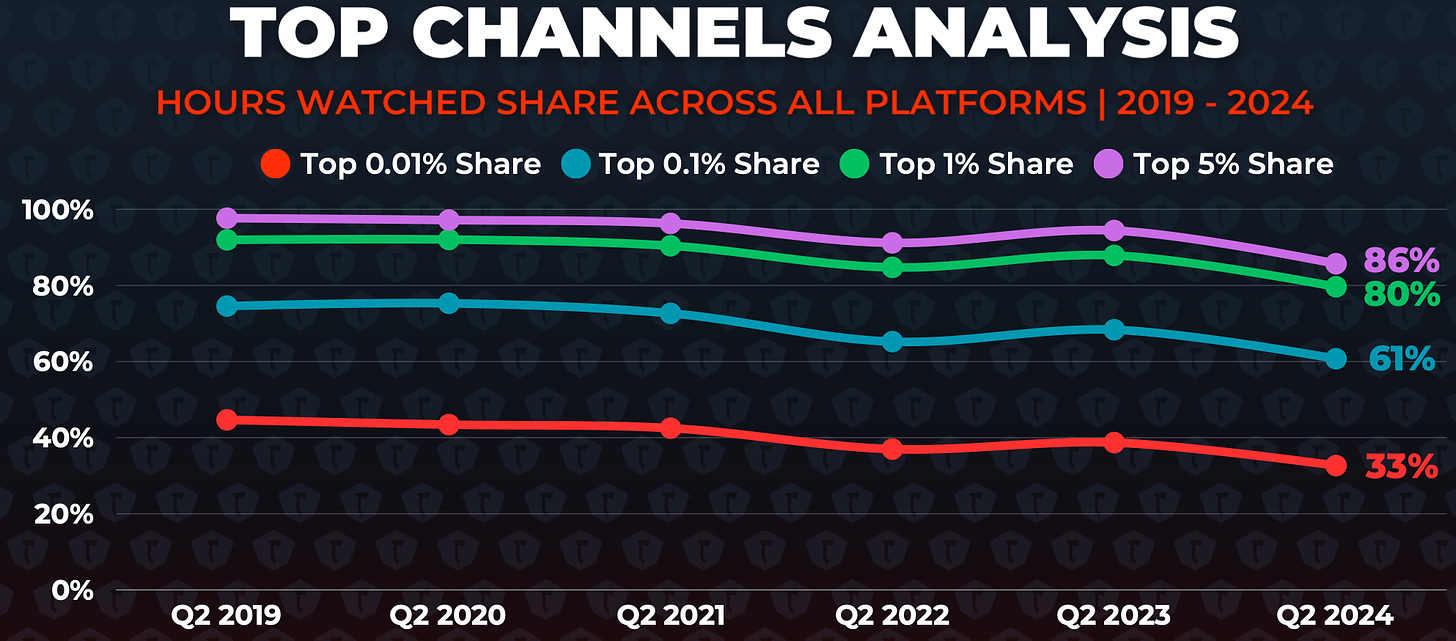
- In Q2 2024, the top 5% of channels accounted for 86% of all hours watched. The top 0.01% of channels accounted for 33% of all hours watched.
GameDiscoverCo: Top-Grossing Games on Steam in H1'24
GameDiscoverCo provides a Gross Revenue estimate, not actual figures.
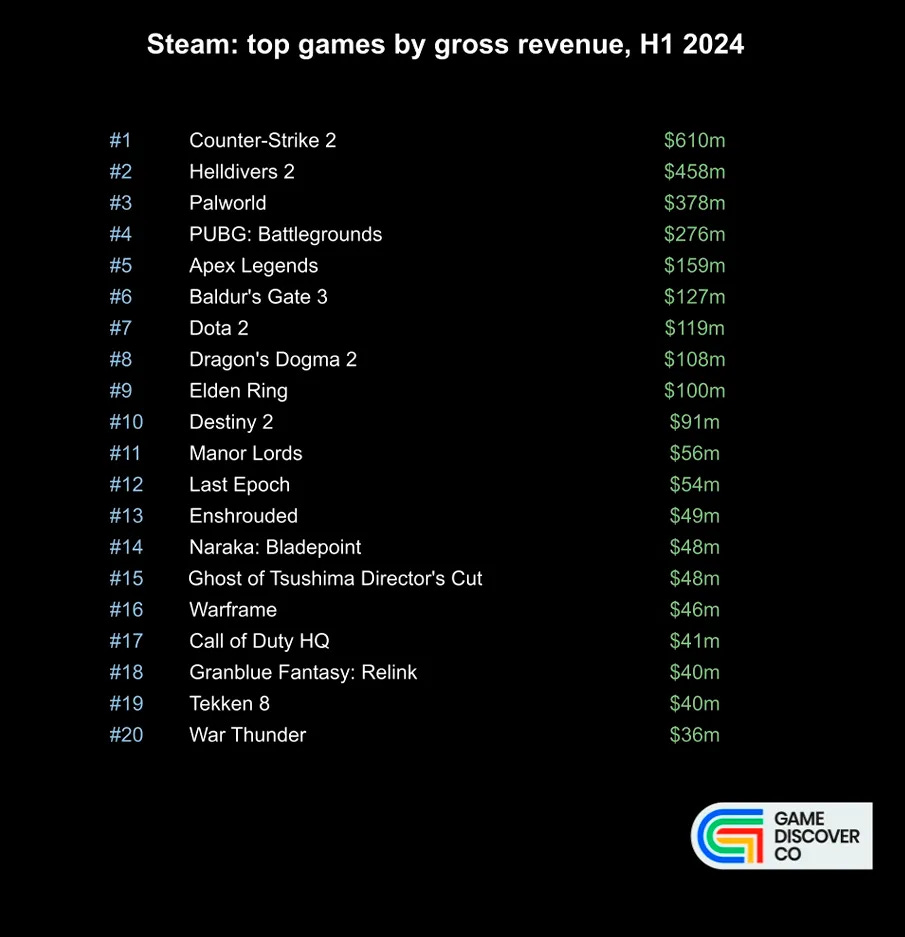
- According to the service, the leaders in revenue for the first half of 2024 are Counter-Strike 2 ($610 million), Helldivers II ($458 million), and Palworld ($378 million).
- F2P (Free-to-Play) games make up less than 50% of the total revenue in the top 20.
- There are 7 new games in the top 20 by revenue. In addition to Helldivers II and Palworld, the list includes Dragon’s Dogma 2 ($108 million), Manor Lords ($56 million), Enshrouded ($49 million), Granblue Fantasy: Relink ($40 million), and Tekken 8 ($40 million). In some sense, Ghost of Tsushima: Director’s Cut ($48 million) can be considered a new game, as it had not been released on PC before.
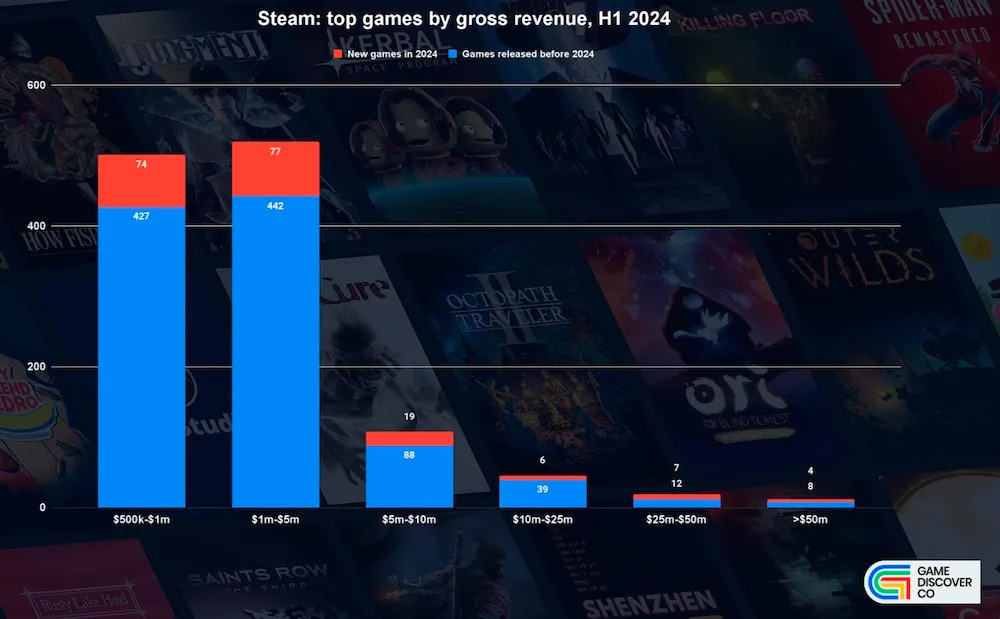
- The share of new games that earned up to $5 million in the first half of the year is around 15%. Among the most successful projects (those with revenue over $25 million), the share of new games is over 30%.
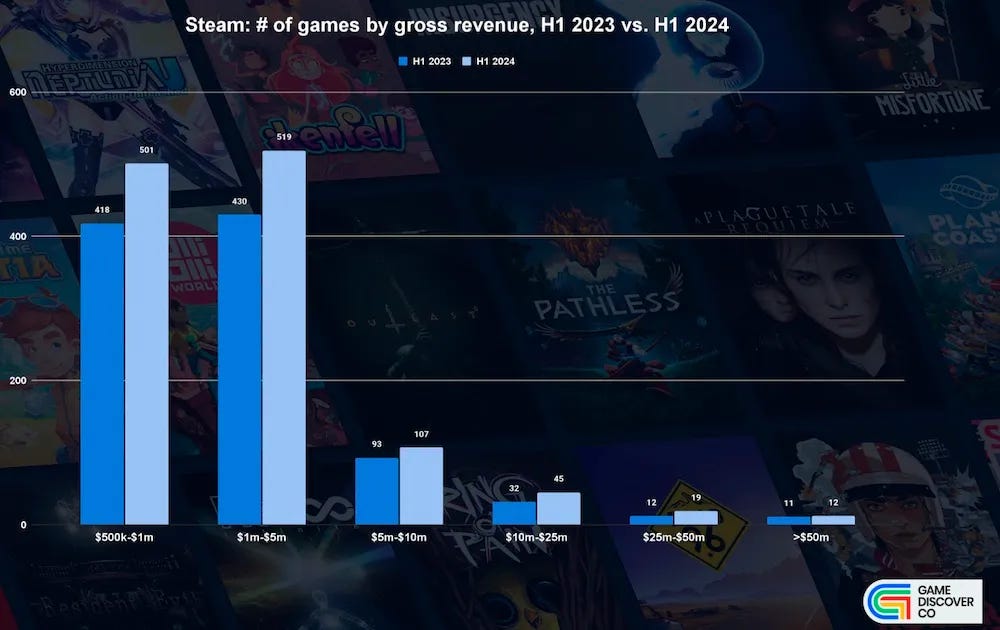
- On Steam during H1 2024, 20% more games earned between $500,000 and $1 million YoY. There were 15% more games earning between $5 and $10 million. And one more game earned over $50 million in the half-year period. At the same time, there were 22% more games on Steam overall in H1’24 compared to the H1’23. This indicates that while users are spending more, the offering has increased even more sharply.
❗️However, it's important to assess how high-quality these new games are to understand the actual competitive landscape.
GameRefinery: Key Mobile Game Updates for July 2024

- Marvel Snap released several live events tied to the release of Deadpool & Wolverine. The game achieved its peak revenue (+300% DoD) on July 10, the day after the release of the Battle Pass featuring Deadpool. However, the game had previously achieved similar results without the addition of content from popular movies.
- The launch of a new game by Zynga based on Game of Thrones can barely be called successful. The game just made it into the top 200 for revenue in the U.S.
- Naraka: Bladepoint Mobile successfully launched in China. The project debuted at 4th place in revenue and 1st place in downloads.
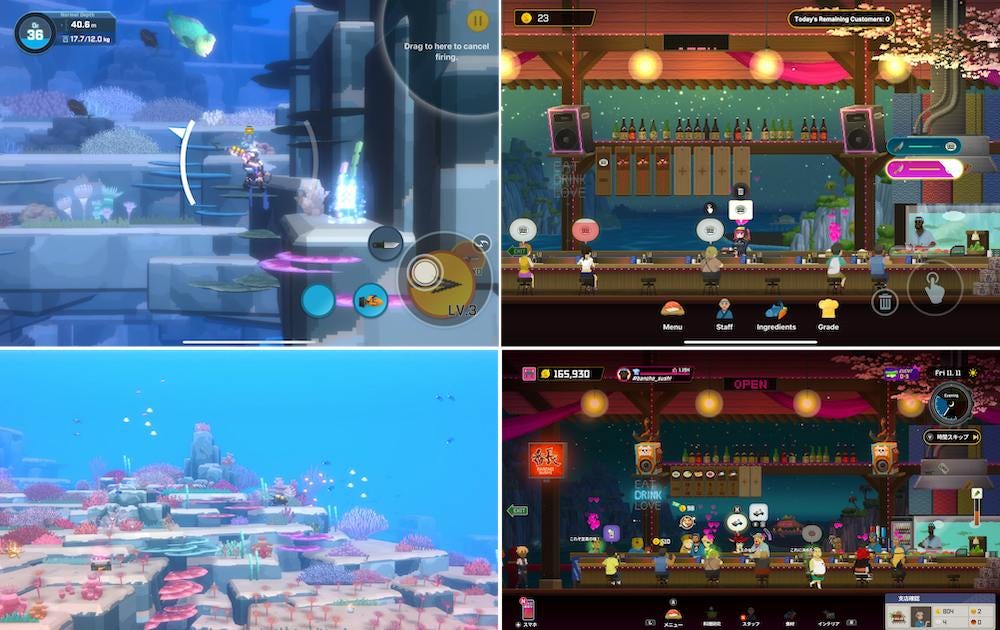
- Goddess of Victory: NIKKE launched a collaboration with Dave the Diver. Interestingly, the developers recreated the gameplay of Dave the Diver within the game, where players need to catch fish and manage their own restaurant. In November 2023, the developers of Goddess of Victory: NIKKE added a mini-game in the style of Vampire Survivors. It seems the experiment was successful.
- SuperPlay, the creators of Dice Dreams, continue to grow revenue for Domino Dreams. In July, the game made it into the top 100 for revenue on iOS.
Omdia: Gaming Accessories market reached $10.1B in 2023

- The company forecasts that the market will grow to $11.8 billion by 2029.
- Spending on gaming accessories in 2023 surpassed the pandemic peak levels of 2021.
- In 2023, 44.3% of this spending was on game controllers. User spending on headphones and keyboards in 2023 exceeded $1 billion.
- Omdia analysts expect that by 2029, the strongest growth will be in the categories of specialized gaming accessories such as chairs, steering wheels, and joysticks.
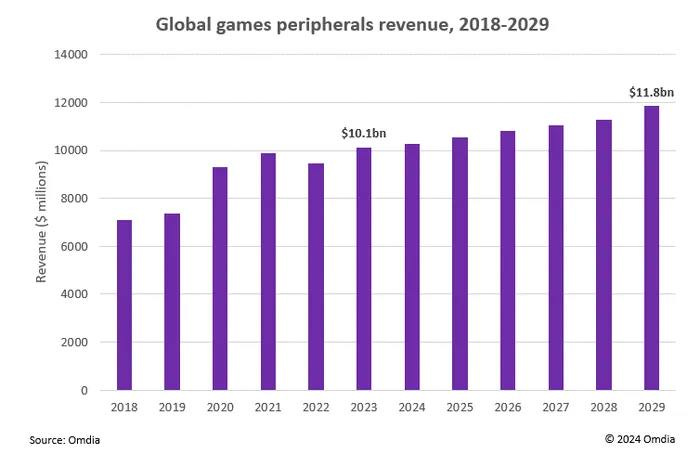
- Omdia analysts note that the demand elasticity for gaming peripherals is higher than for games. For example, the DualSense Edge shows excellent sales despite its high cost.
- Omdia predicts that by 2029, Sony will earn more than $2 billion annually from game controllers. This is influenced by both the popularity of the Japanese company's consoles and the growing popularity of DualSense on PC. Meanwhile, Xbox controllers are the most popular on Steam, accounting for 59% of all sessions.
AppsFlyer: The Mobile Gaming Market in 2024
The company analyzed over 15,000 gaming apps (with at least 3,000 non-organic installs per month); 21.2 billion non-organic installs from January 2023 to June 2024; and 1.5 billion remarketing conversions.
Key Trends
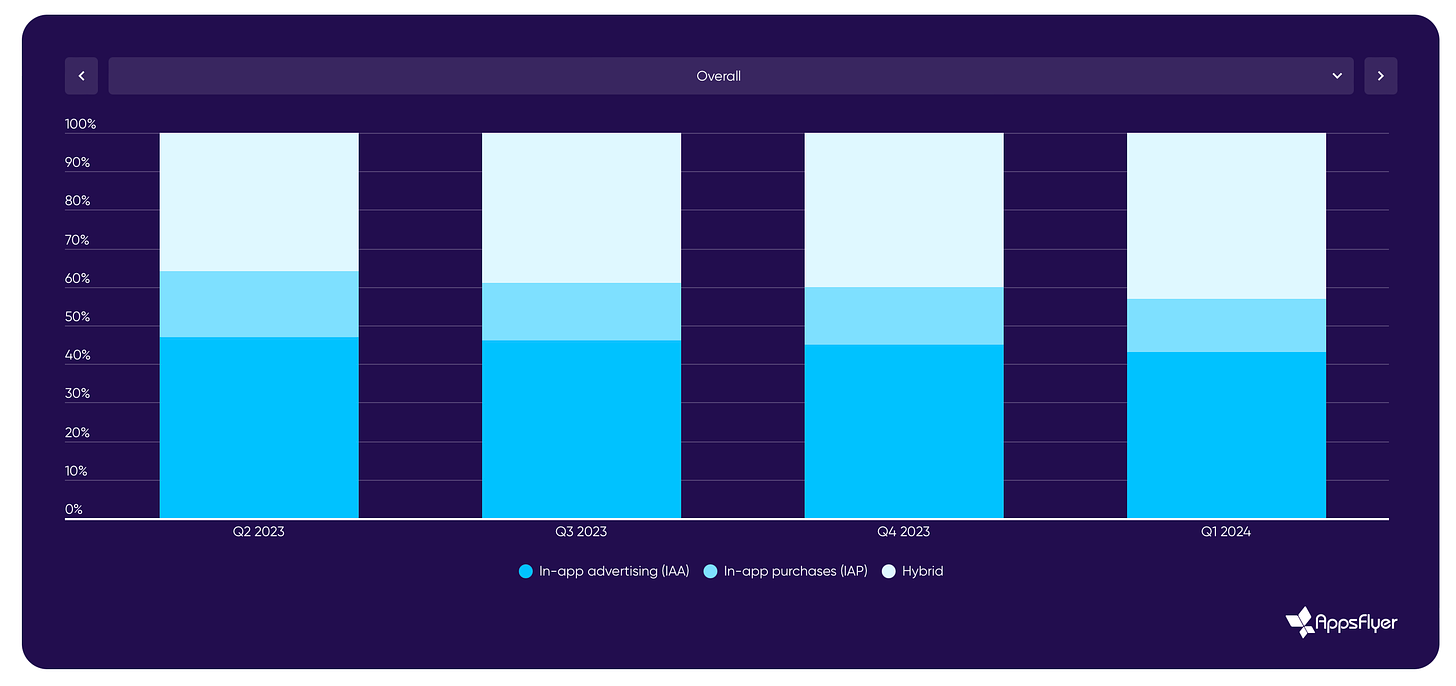
- Games in genres with IAP monetization are integrating ads; games in genres with IAA are integrating IAP monetization. For example, RPGs have seen an increase in ad revenue but a decrease in IAP revenue. The overall trend is as follows: the share of games with hybrid monetization grew from 36% in Q2 2023 to 43% in Q1 2024; the share of games with ad-only monetization decreased from 47% in Q2 2023 to 43% in Q1 2024; the share of games with IAP-only monetization decreased from 17% in Q2 2023 to 14% in Q1 2024.
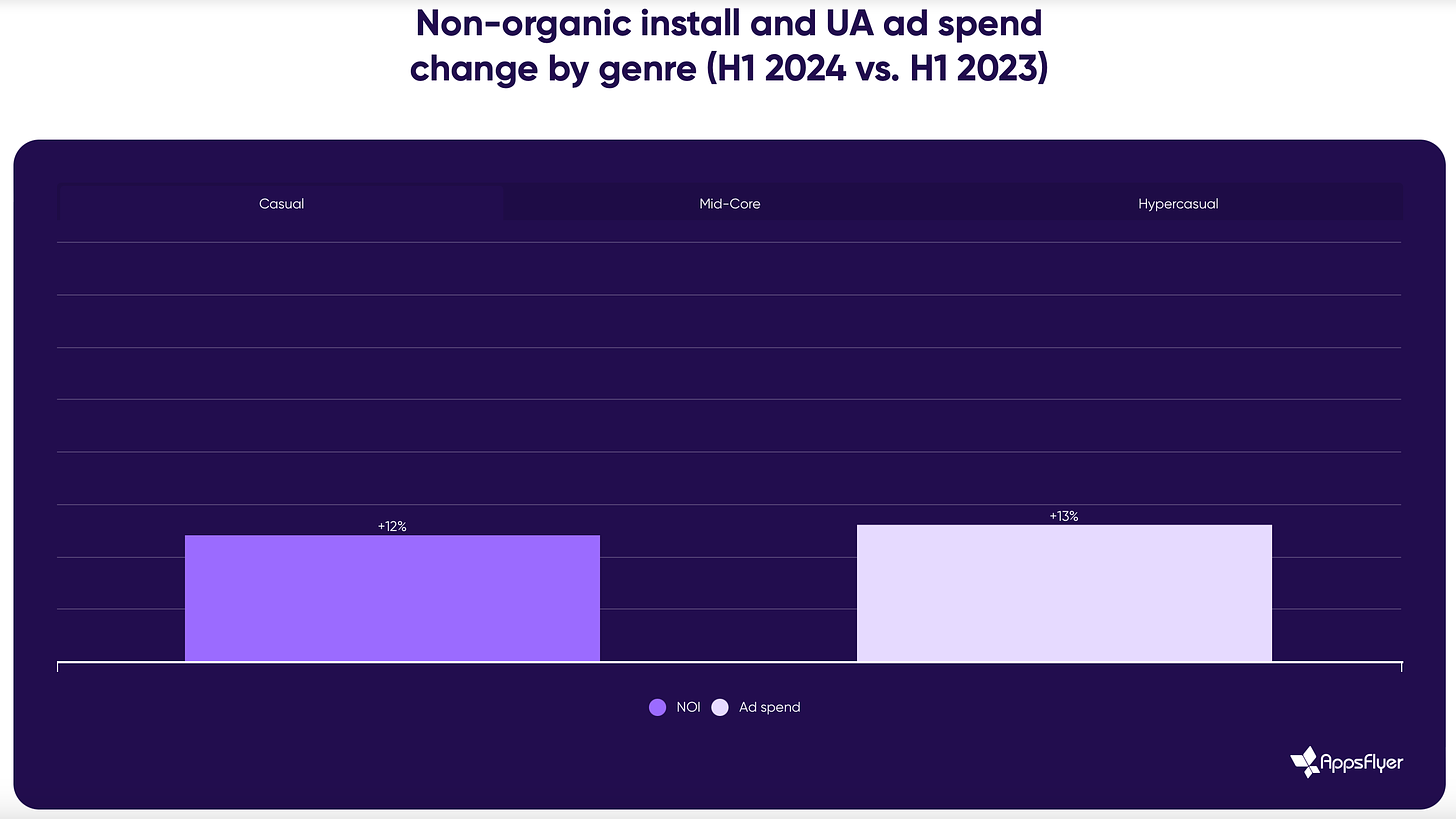
- Acquisition in casual games is growing; in mid-core and hyper-casual games, it is declining. In H1 2024, non-organic installs in mid-core games decreased by 5% on Android and by 15% on iOS. In hyper-casual games, ad spending decreased by 6%. Meanwhile, casual games are trending upward—Match games (+13% on Android); action games (+18% on iOS); simulation games (+25% on Android); board games (+29% on iOS). Puzzle and sports games are also showing growth on iOS.
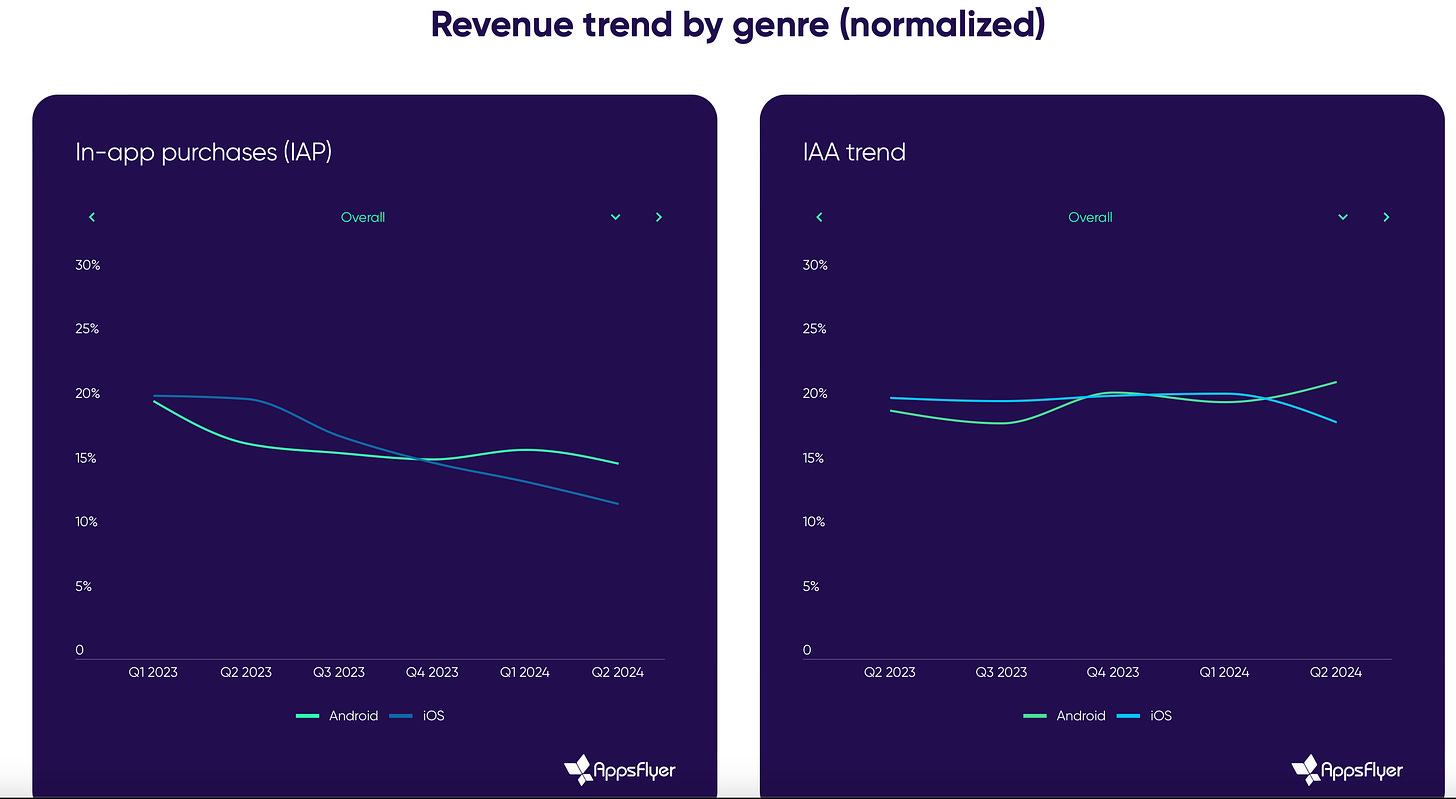
- Game ad revenue increased by 4% in Q2 2024 compared to Q2 2023. Android grew by 12%, while iOS dropped by 10%. Year-over-year, ad revenue grew by 3%. However, IAP revenue decreased by 15% on Android and by 35% on iOS.
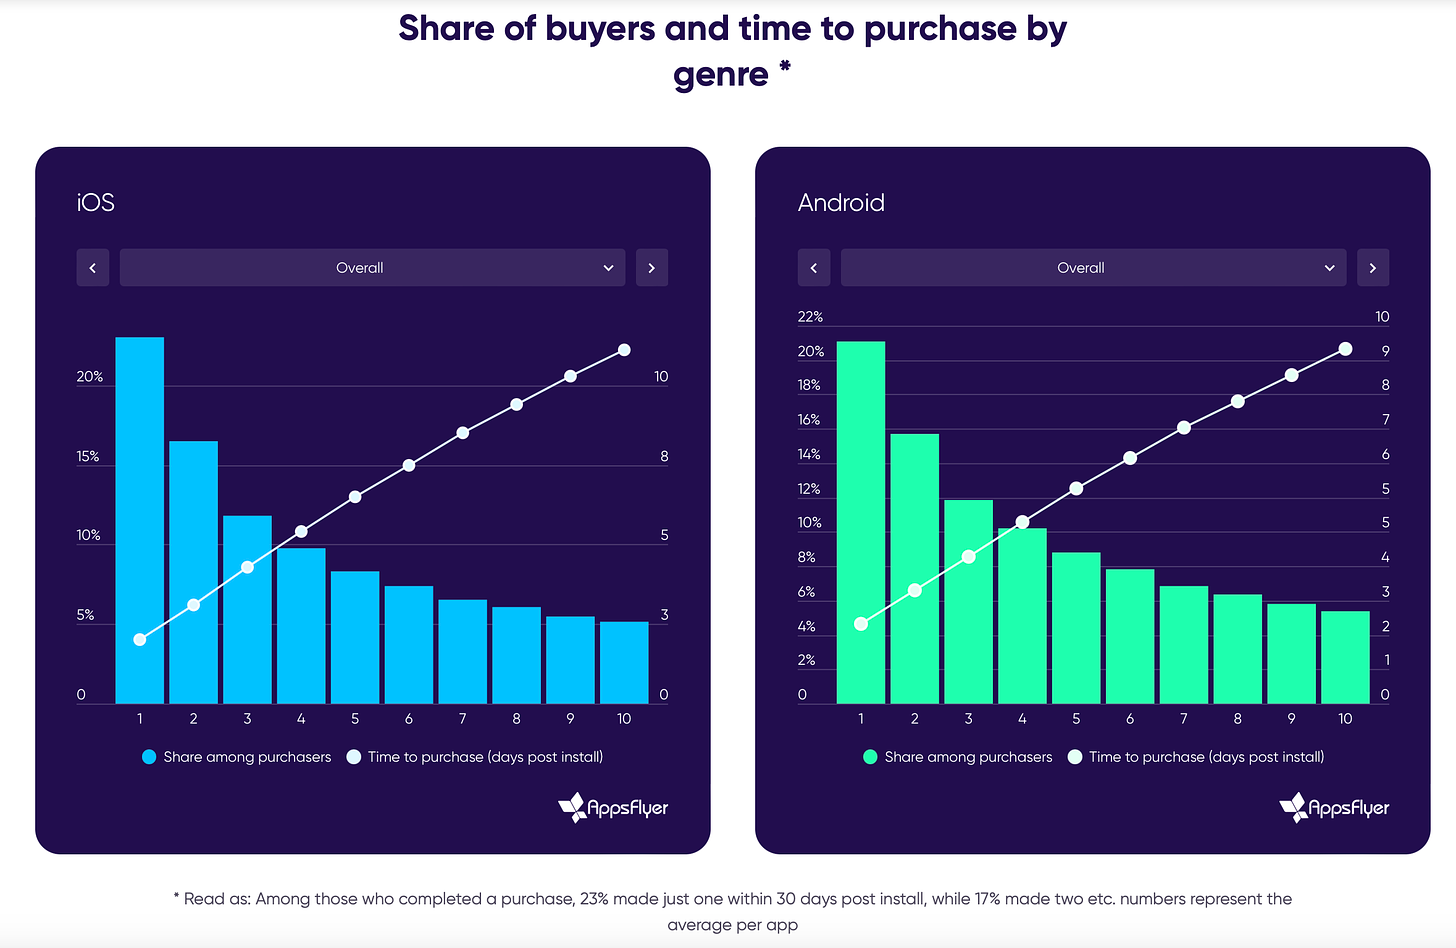
- The first week is crucial for assessing a project's monetization potential. On iOS, 22.99% of all paying users within the first 10 days make a purchase on Day 1. On Android, this figure is 21.11%.
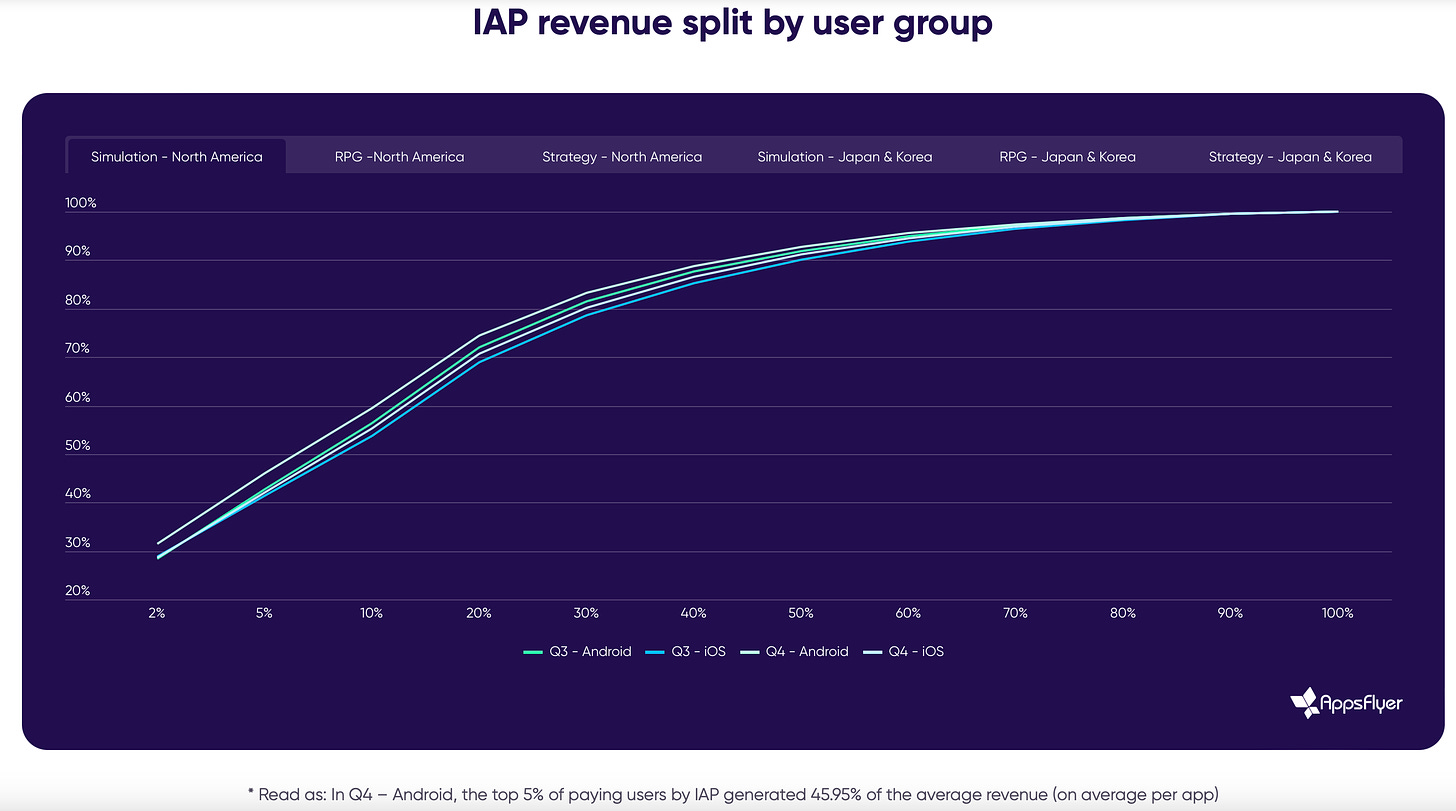
- It's becoming harder to find "whales" on iOS. The share of revenue from top-paying users in North America dropped from 34% in Q1 2023 to 27% in Q1 2024. On Android, however, it slightly increased—from 34% to 35% over the same period. On both iOS and Android, the top 5% of paying users generate about 50% of total revenue.
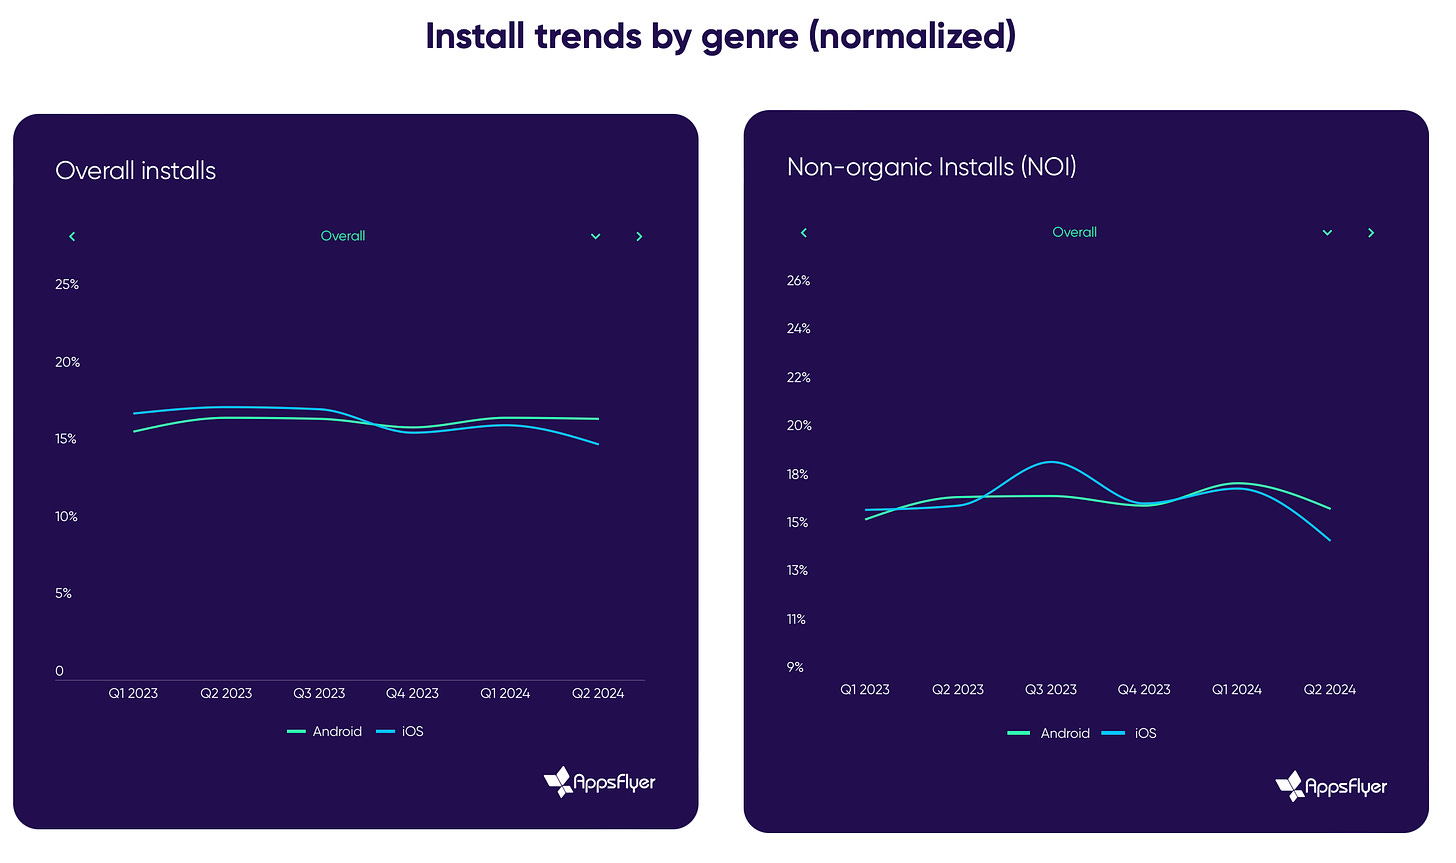
- Installs on Android increased by 3% (both overall and non-organic installs) in the first half of 2024. On iOS, however, there was a 9% overall decline and a 2% drop in non-organic installs. The biggest declines in installs on iOS were in RPGs (-36% overall; -25% in paid traffic) and strategy games (-15% overall; -48% in paid traffic).
Growing Genres
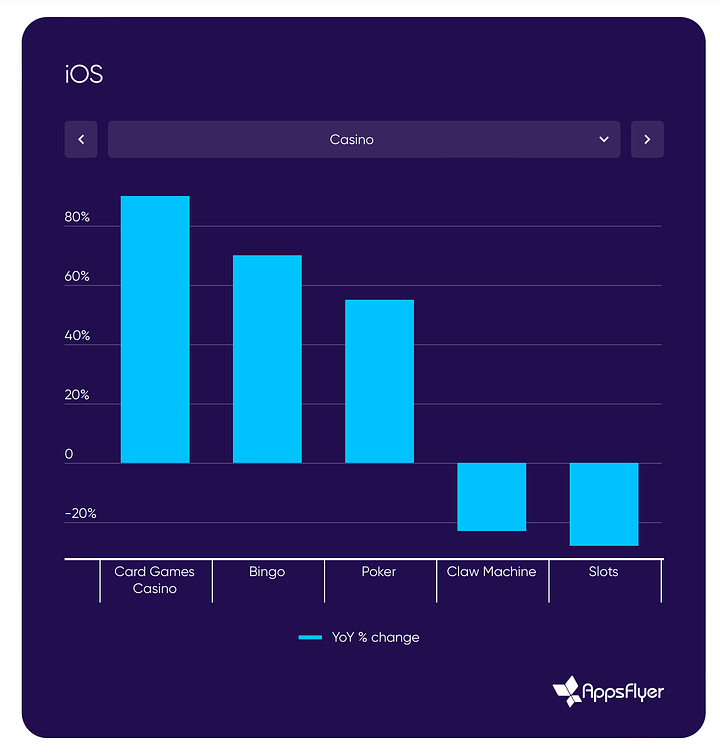
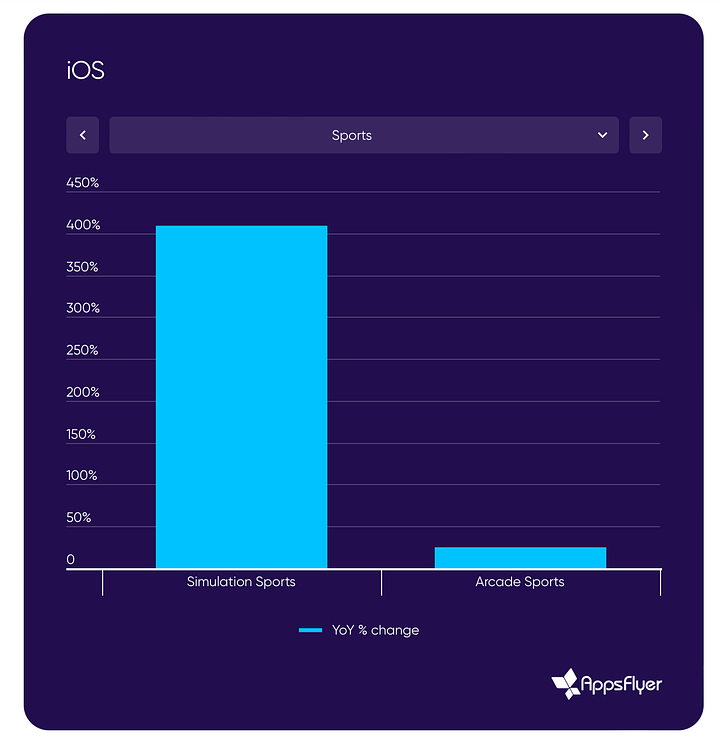
- The strongest growth in non-organic installs on iOS was seen in sports games, racing games, and merge games. Casino and bingo games are also growing.
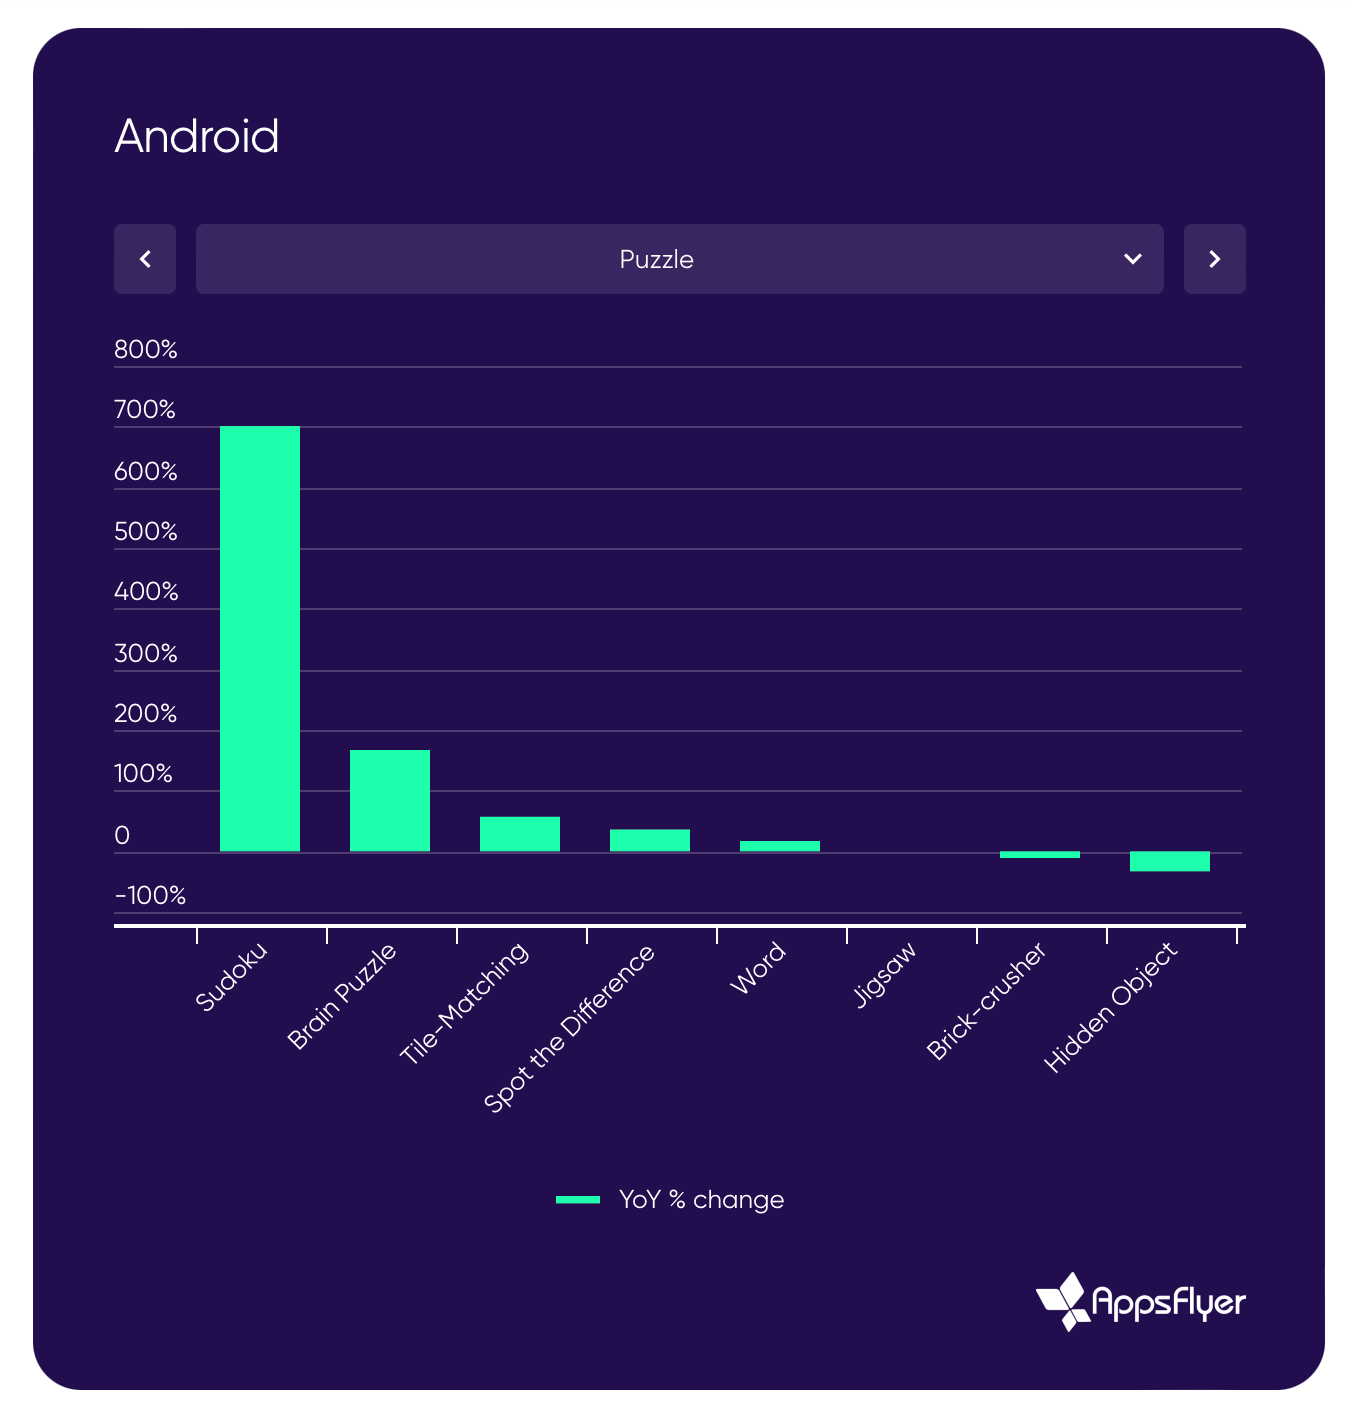
- On Android, puzzles showed the strongest growth in non-organic installs. Among subcategories, Sudoku saw the highest growth.
Acquisition by Region
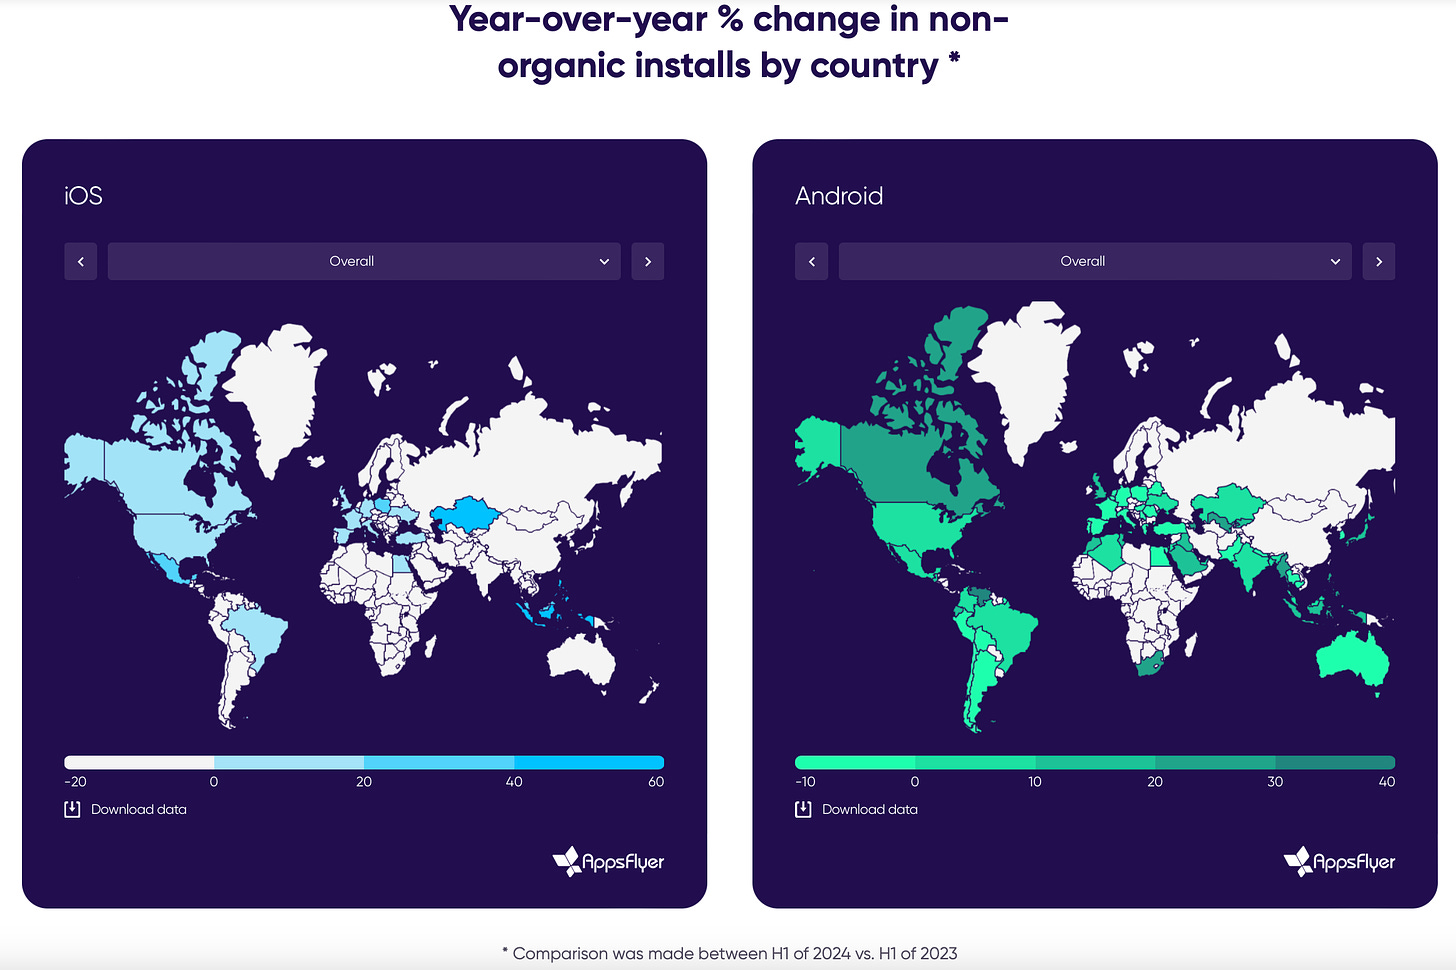
- AppsFlyer has a positive outlook on the marketing market over the past year and notes that the number of non-organic installs increased on both iOS and Android.
- The U.S., the largest market for iOS, grew by 1%. The number of non-organic installs in the U.K. on iOS increased by 9%; on Android, by 14%. There were also significant declines—installs in South Korea fell by 39%; in Australia by 15%; in Japan by 15%. Mexico showed a strong growth trend, with non-organic installs in the country increasing by 21%.
- On Android, things are better, with growth across all key markets. The leaders in non-organic traffic growth are the Philippines (26%); the U.K. (18%); Japan (16%); and Indonesia (13%). The U.S. market grew by 5%.
Marketing Spending
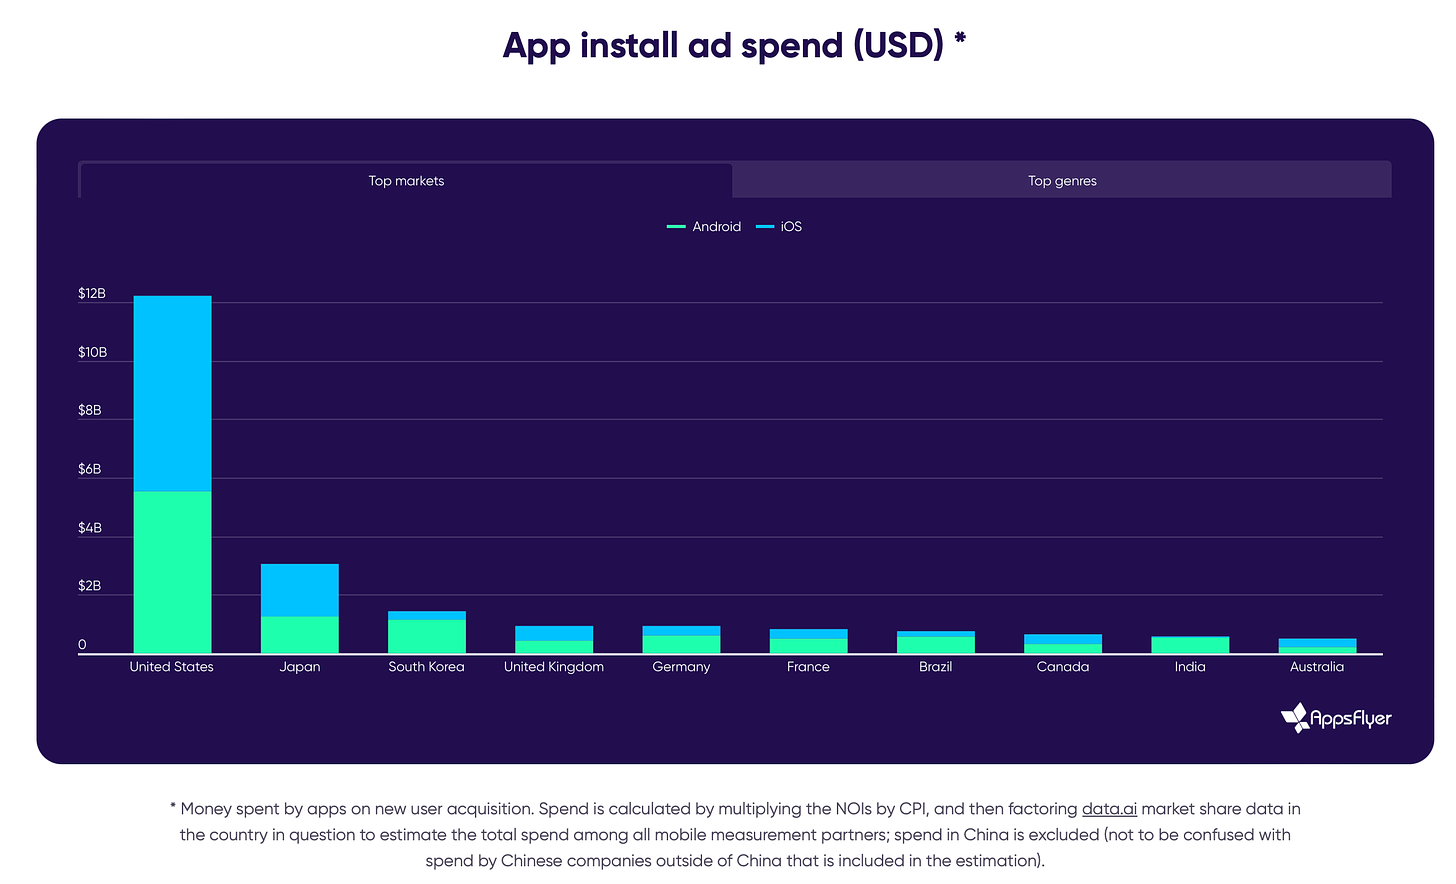
- In 2023, mobile gaming companies spent $29 billion on marketing their games.
- The U.S. accounted for $6.6 billion in iOS spending and $5.5 billion in Android spending in 2023. This is more than the next 10 markets combined.
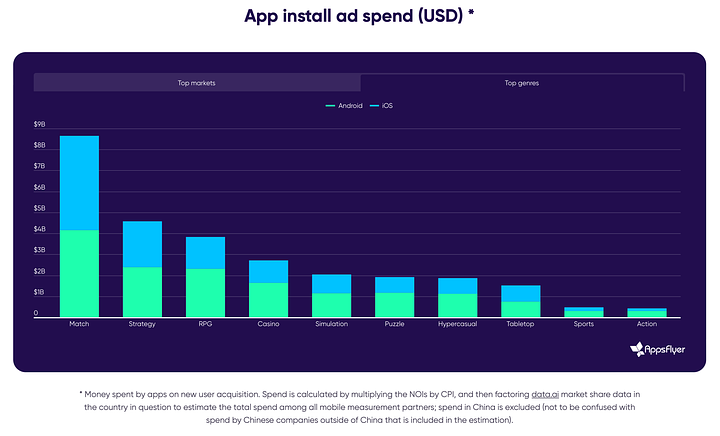
- The second-largest market in the world for marketing spending is Japan ($1.8 billion on iOS and $1.2 billion on Android). South Korea ranks third. The largest European markets are the U.K., Germany, and France.
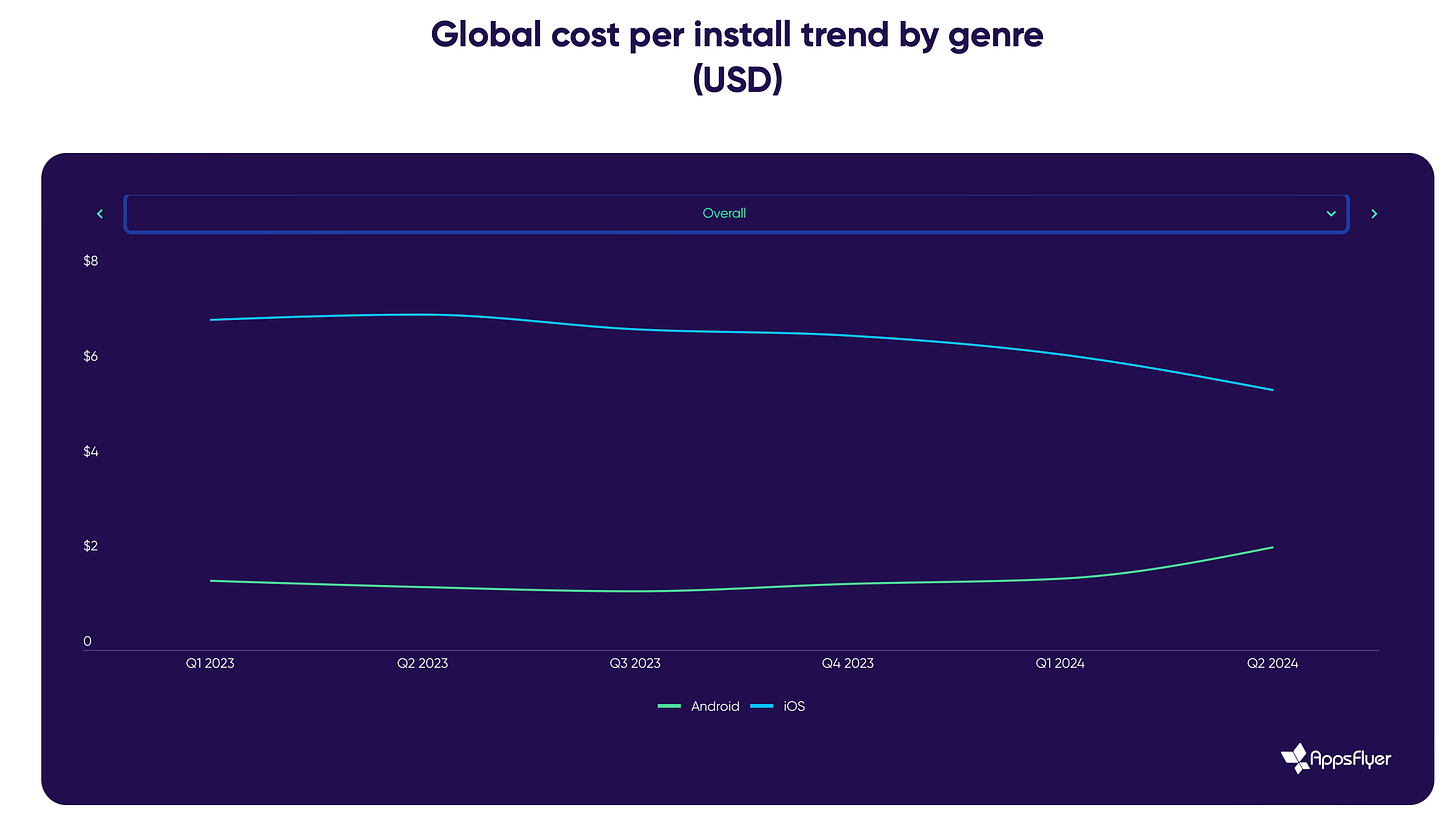
- One of the key trends in 2023 was the decrease in installation costs on iOS and the increase on Android. This was especially noticeable in puzzles, the Match genre, hyper-casual games, and the simulation genre.
Top Creatives
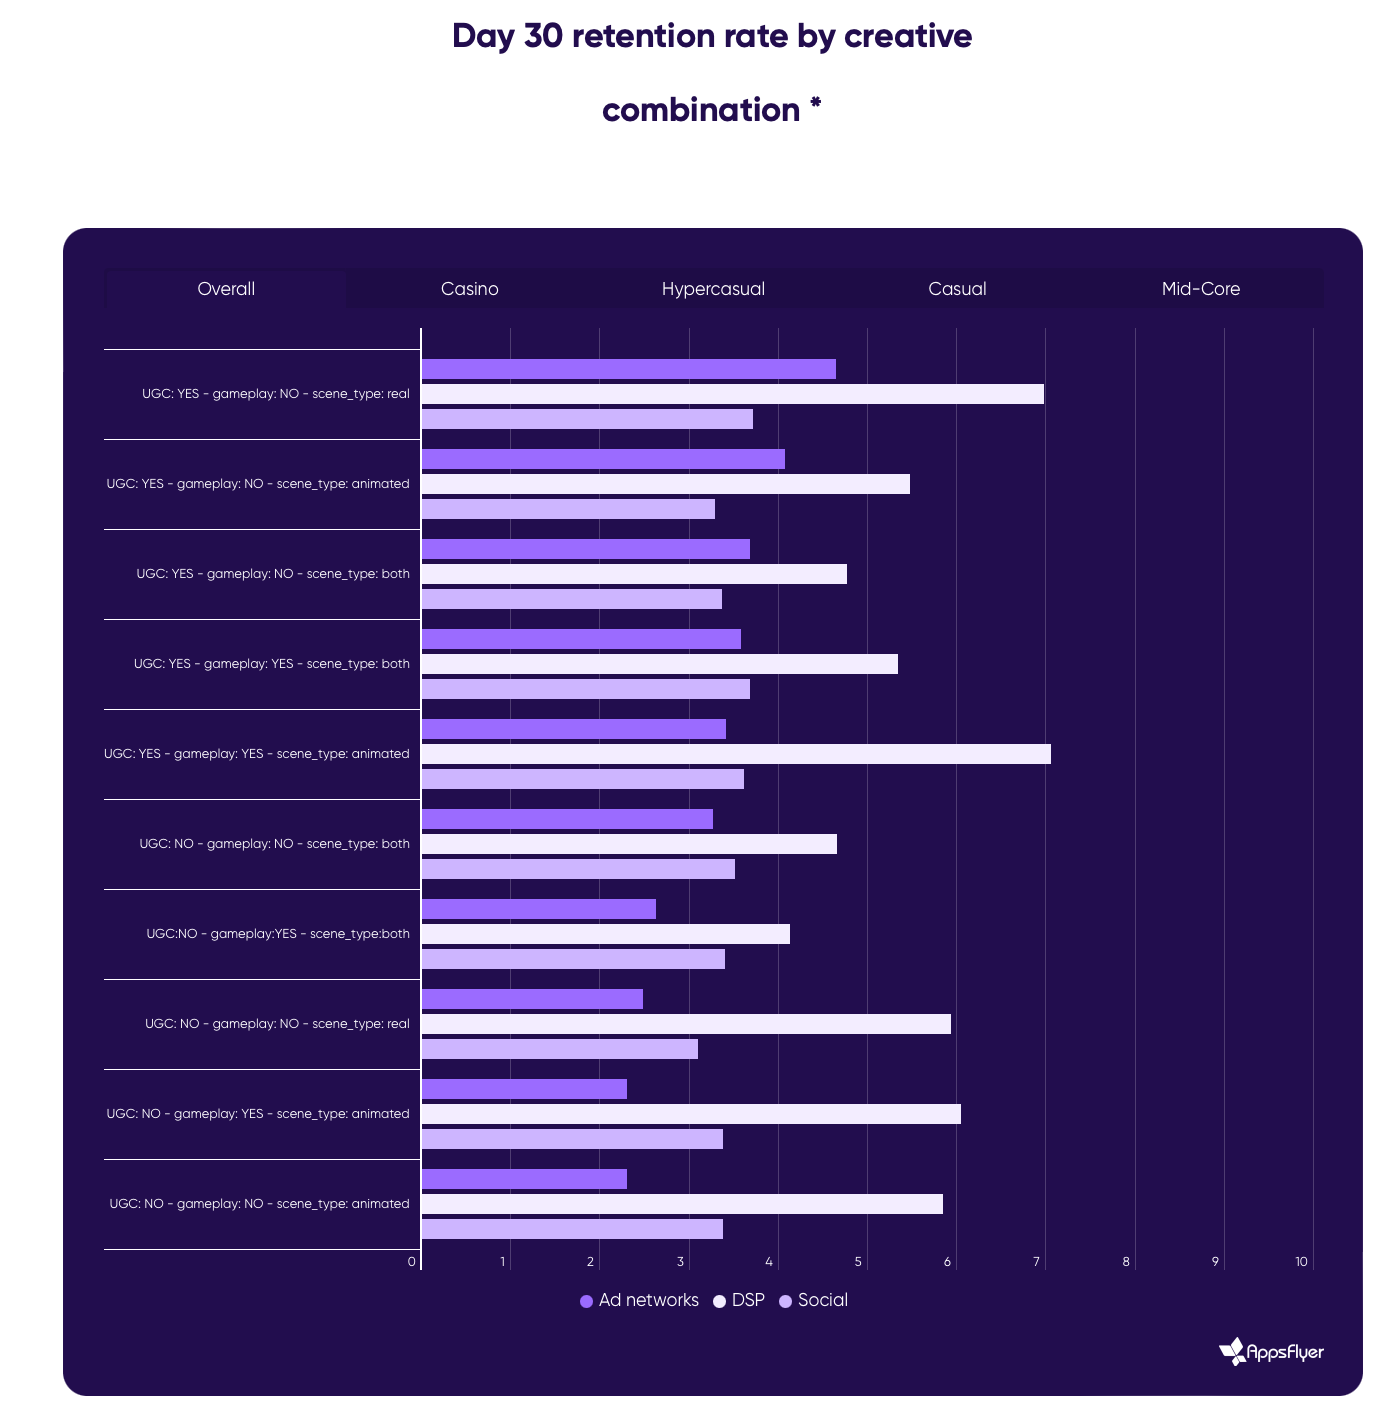
- UGC (User-Generated Content) creatives generally perform well on ad networks, DSPs, and social media.
- AppsFlyer analyzed D30 Retention for different types of creatives across various ad channels. It was found that for hyper-casual games, the best combination is UGC with real or animated scenes. For mid-core projects, both UGC and gameplay videos—whether with real or animated scenes—work well.
Stay tuned for more updates next month!
Meanwhile, you can check out our free demo to see how devtodev can help your game project succeed.