
Devtodev is helping you keep in touch with what’s happening in the game market. Every month we publish an overview of reports on the most popular games worldwide, top-grossing games, successful releases, favorite video game types, trends, etc. This overview was prepared by Dmitriy Byshonkov, the author of the GameDev Reports by the devtodev Telegram channel. You can also read the November and December reports.
Contents
- StreamHatchet: 2024 Streaming Results
- SocialPeta: Mobile Game and Mini-Game Marketing Trends in 2024
- AppMagic: Top Mobile Games by Revenue and Downloads in December 2024
- InvestGame & GDEV: Major exits in the Gaming Industry over the last 10 years
- Game Industry Layoffs: 14,600 people lost their jobs in 2024
- Games and Numbers (December 25, 2024 - January 7, 2025)
- Aream & Co.: Gaming Company CEOs on expectations for 2025
- Sensor Tower: South Korean Market in H2'24
- In 2024, China issued 1,416 game licenses - a record since 2019
- AppsFlyer: Mobile market trends in 2024
- A16Z Games: Use of AI in Gaming in 2024
- Steam reviews have become more negative over 5 years
- ERA: UK gaming market in 2024 fell behind the video market in size
- Games for Nintendo have dominated the retail gaming market for the last 20 years in Japan
- Stream Hatchet: Most popular launches on streaming platforms in 2023-2024
- PC/Console game sales in Europe Increased by 1% in 2024 - European gaming market results
- Games & Numbers (January 8 - January 22, 2025)
- Sensor Tower: Mobile Market in 2025
- InvestGame: Gaming Investment Market in Q4'24 and 2024
StreamHatchet: 2024 Streaming Results
Data is provided for the period from January to November 2024.
Platforms
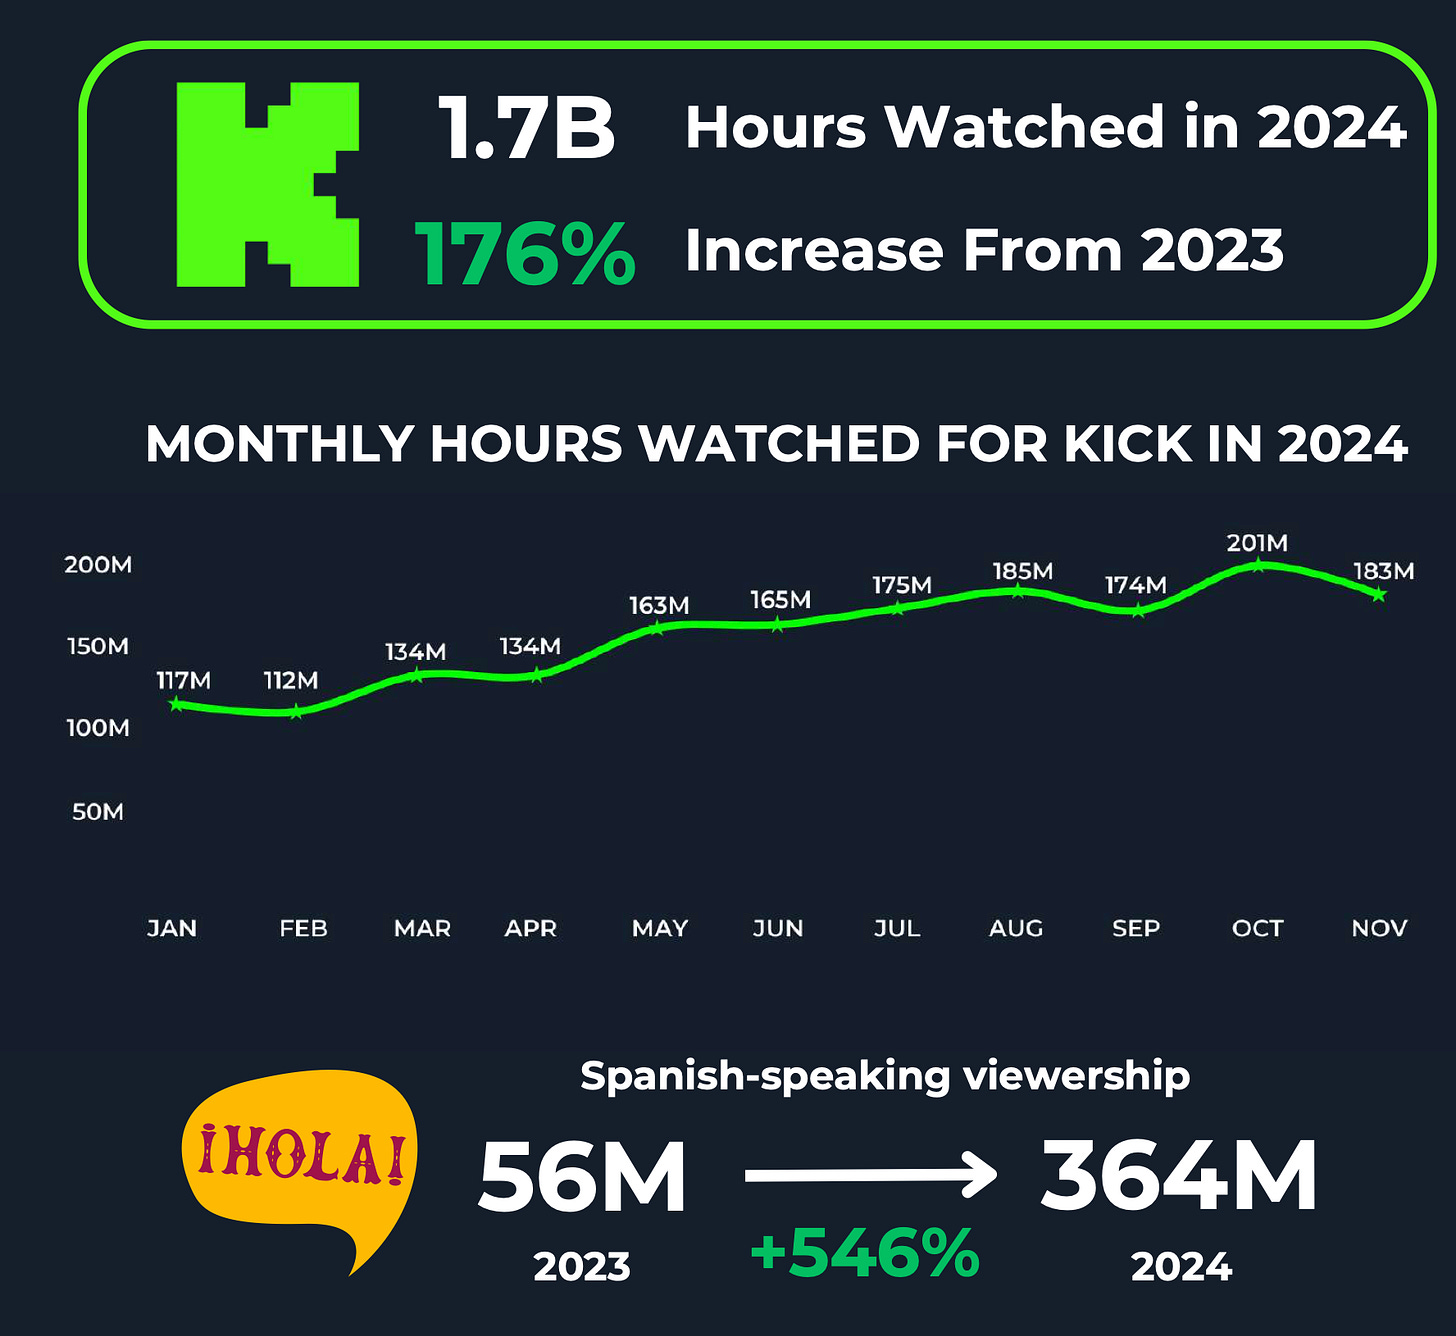
- Kick showed the most impressive growth. The number of watched hours reached 1.7 billion in 2024 - 176% more than in 2023. At the same time, the number of watched hours by Spanish-speaking viewers increased from 56 million in 2023 to 364 million in 2024 (546% growth).
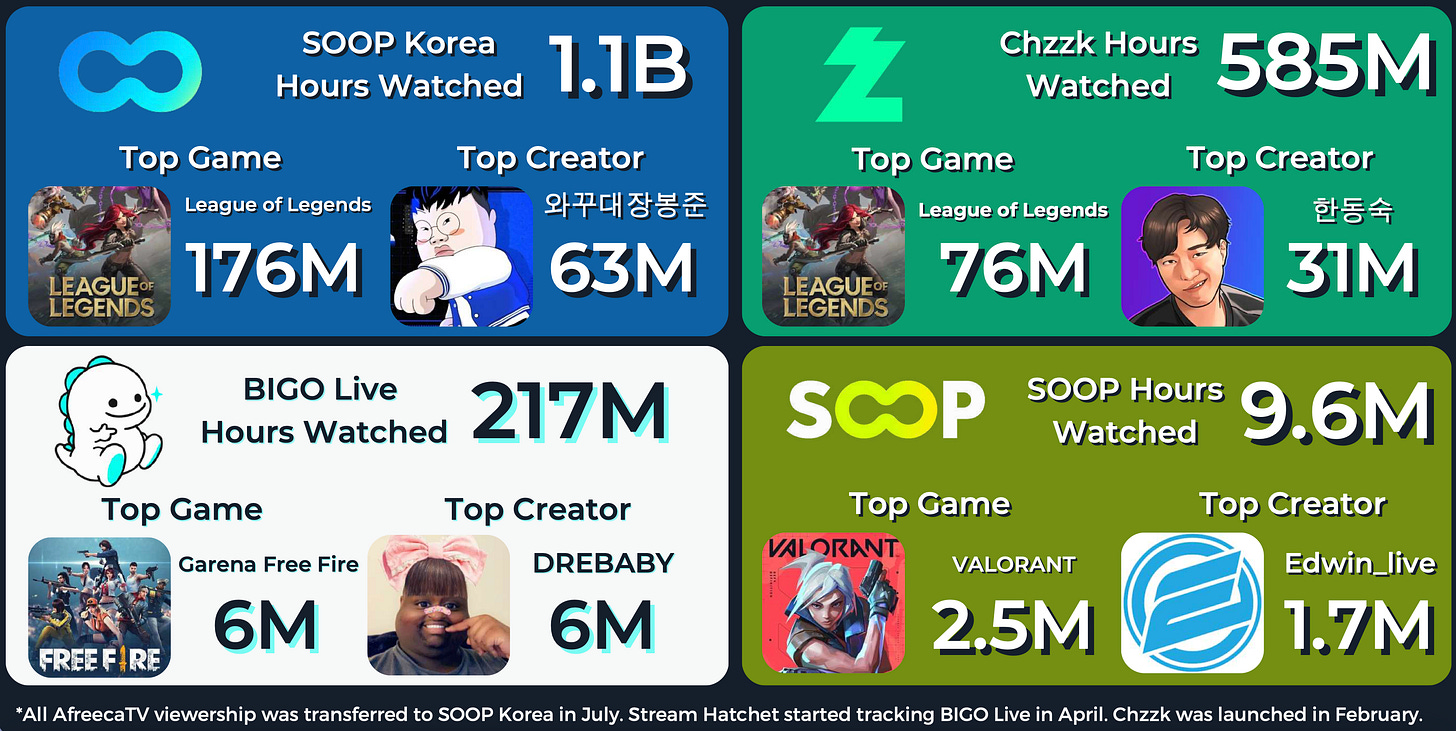
- Other significant new platforms - are SOOP Korea (1.1 billion watched hours), Chzzk (585 million hours), BIGO Live (217 million hours), and SOOP (international version of SOOP Korea - 9.6 million hours).
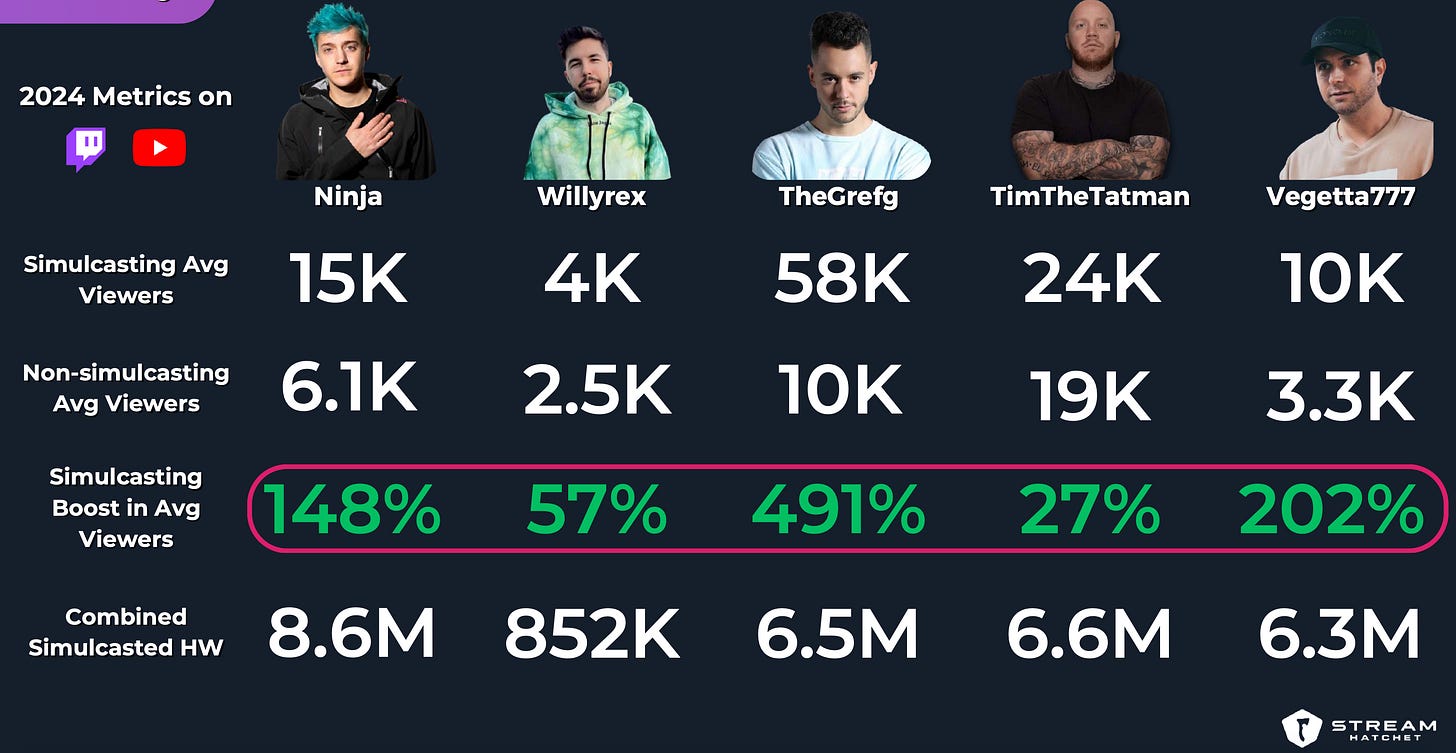
- Due to changes in platform collaboration terms with streamers, they began streaming on multiple platforms simultaneously. When top streamers broadcast on multiple platforms, the growth in average viewership ranges from 27% to 491%.
Twitch Results
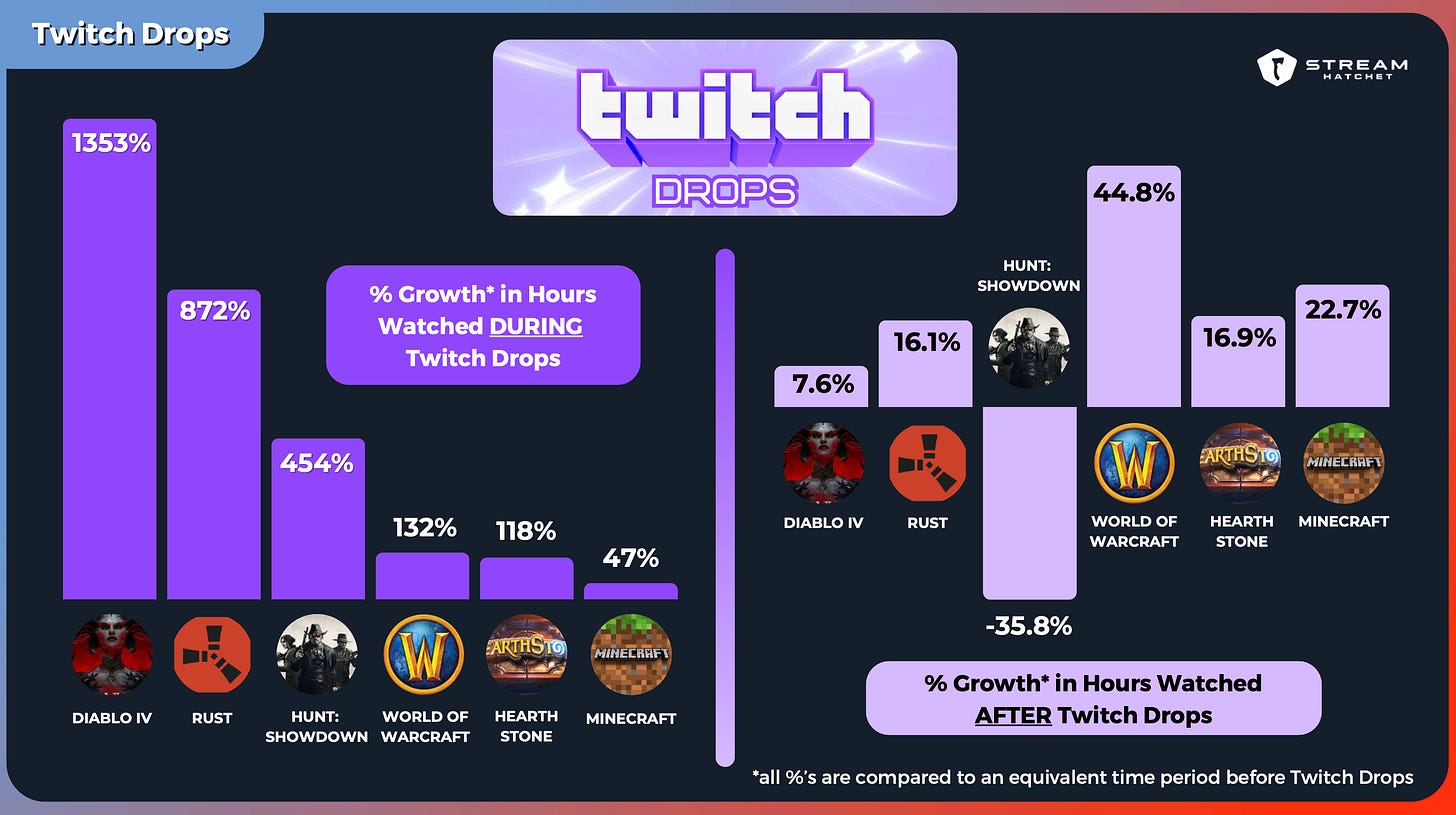
- Twitch Drops significantly affect the growth in watched hours. Growth ranges from 47% (Minecraft) to 1353% (Diablo IV). Moreover, many projects see noticeable growth in views even after the campaign ends.
Streamers
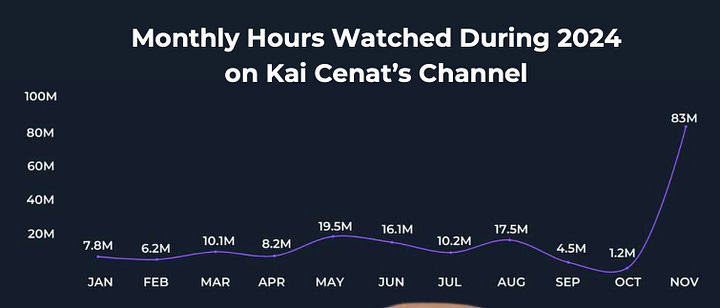
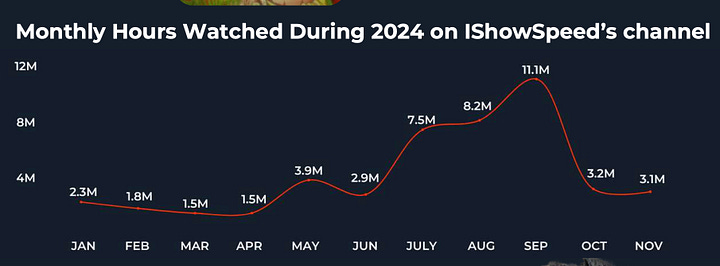
- Kai Cenat (185 million hours) and iShowSpeed (47 million hours) are global leaders of streaming platforms.
- The growing popularity of VTubers on the English-speaking streaming scene is worth noting separately. In 2024, the number of viewing hours with virtual streamers reached 294 million hours. Their most popular games are GTA V, League of Legends, and Minecraft.
Games
- The RPG genre flourished in 2024 on streaming platforms. In total, games of this genre received over 2 billion viewing hours. The most popular game is Elden Ring (293 million hours). Path of Exile (90 million hours) and Monster Hunter: World (66 million hours) show good results.
- DLCs have become on par with full-fledged games. Elden Ring: Shadow of the Erdtree was watched for 127 million hours. World of Warcraft: The War Within (55 million hours), Destiny 2: The Final Shape (26 million hours), and Diablo IV: Vessel of Hatred (22 million hours) have many views. After The Game Awards organizers announced that DLCs and expansions could also be nominated, mentions of the word DLC in chats increased by 45%.
- Stream Hatchet notes that people actively watch remakes and remasters. Leaders are Silent Hill 2 Remake (27 million hours), Final Fantasy VII: Rebirth (16 million hours), and Dragon Quest 3 (5.7 million hours).
Transmedia
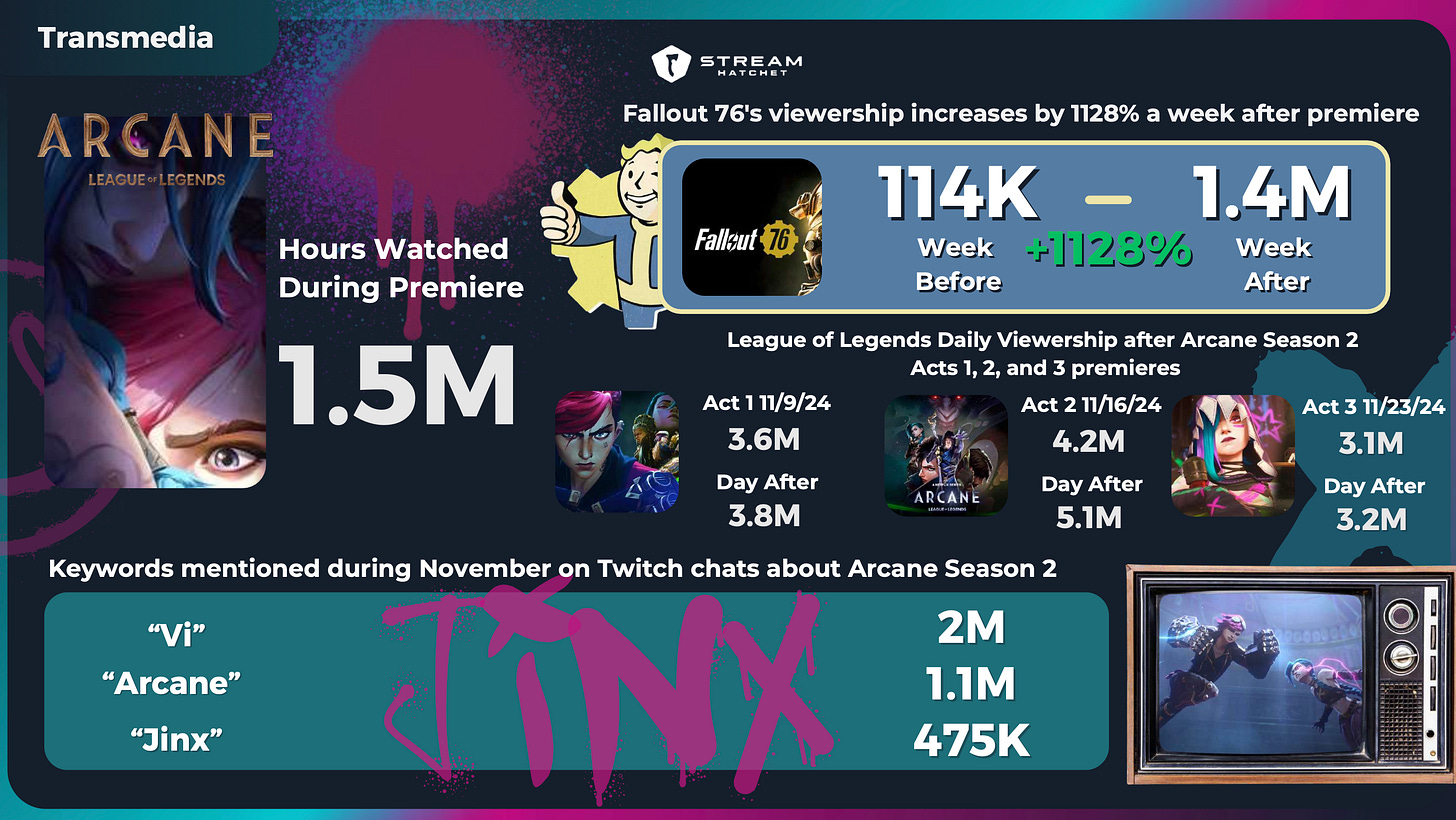
- Fallout 76 stream views increased by 1128% a week after the series release. A positive effect was also observed for League of Legends streams.
Gaming Events and Esports
- The eSports World Cup gathered over 103 million viewing hours. At its peak, 2.8 million viewers watched the competitions in Saudi Arabia. DOTA 2 and Mobile Legends: Bang Bang are the leaders in viewer interest.
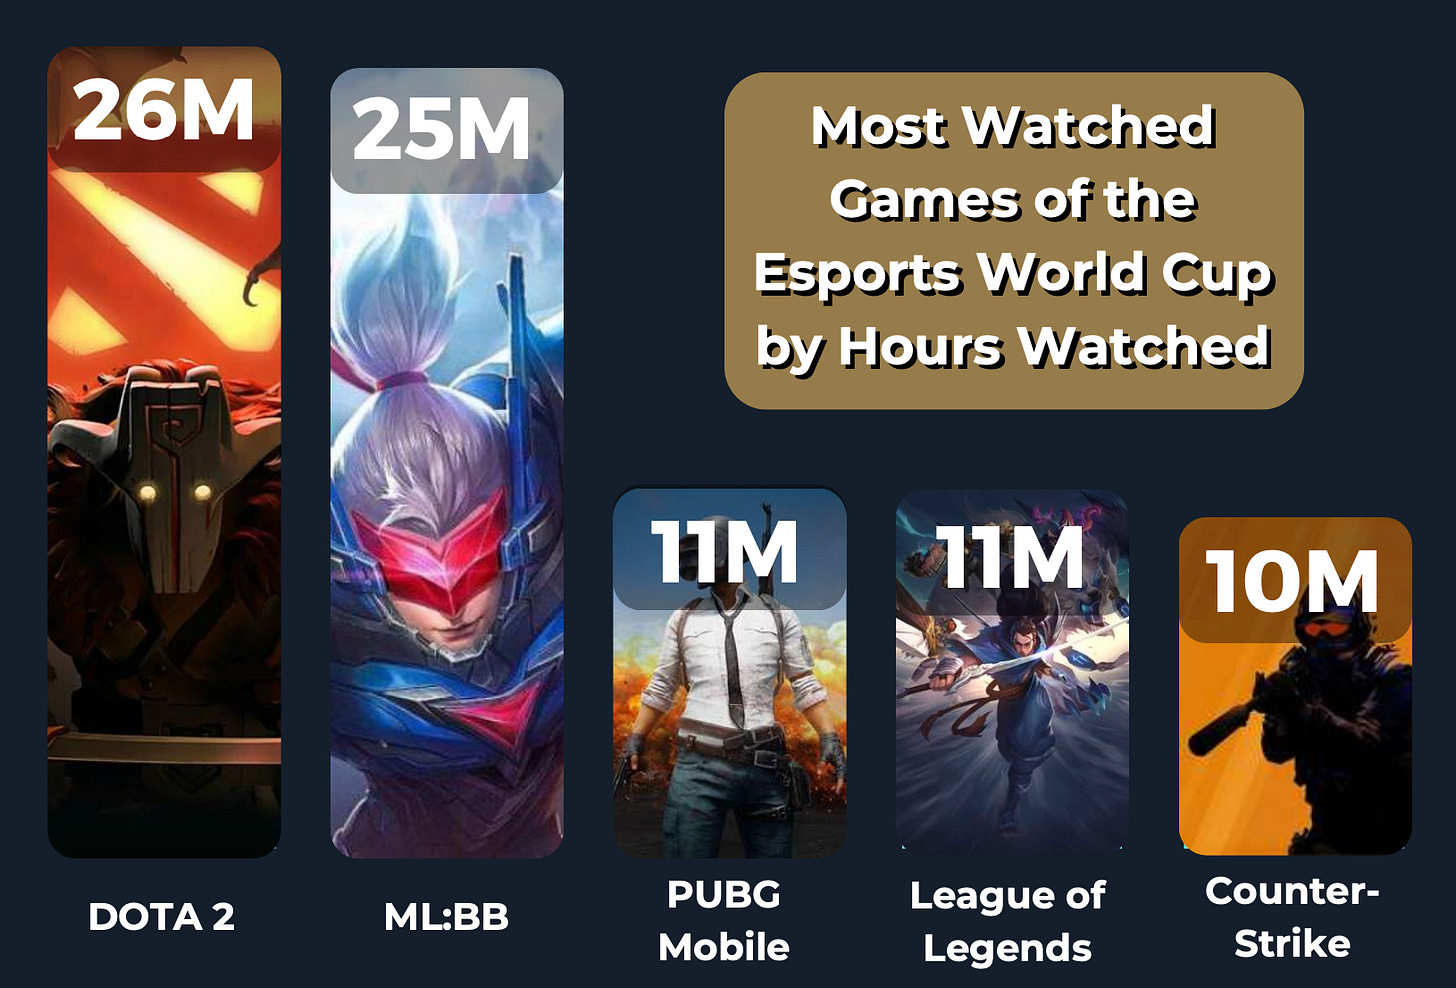
- People started watching more mobile esports competitions. Views in 2024 increased by 41%. The main games are Mobile Legends: Bang Bang (340 million viewing hours), PUBG Mobile (82 million hours), Honor of Kings (72 million hours), and Garena: Free Fire (17 million hours).
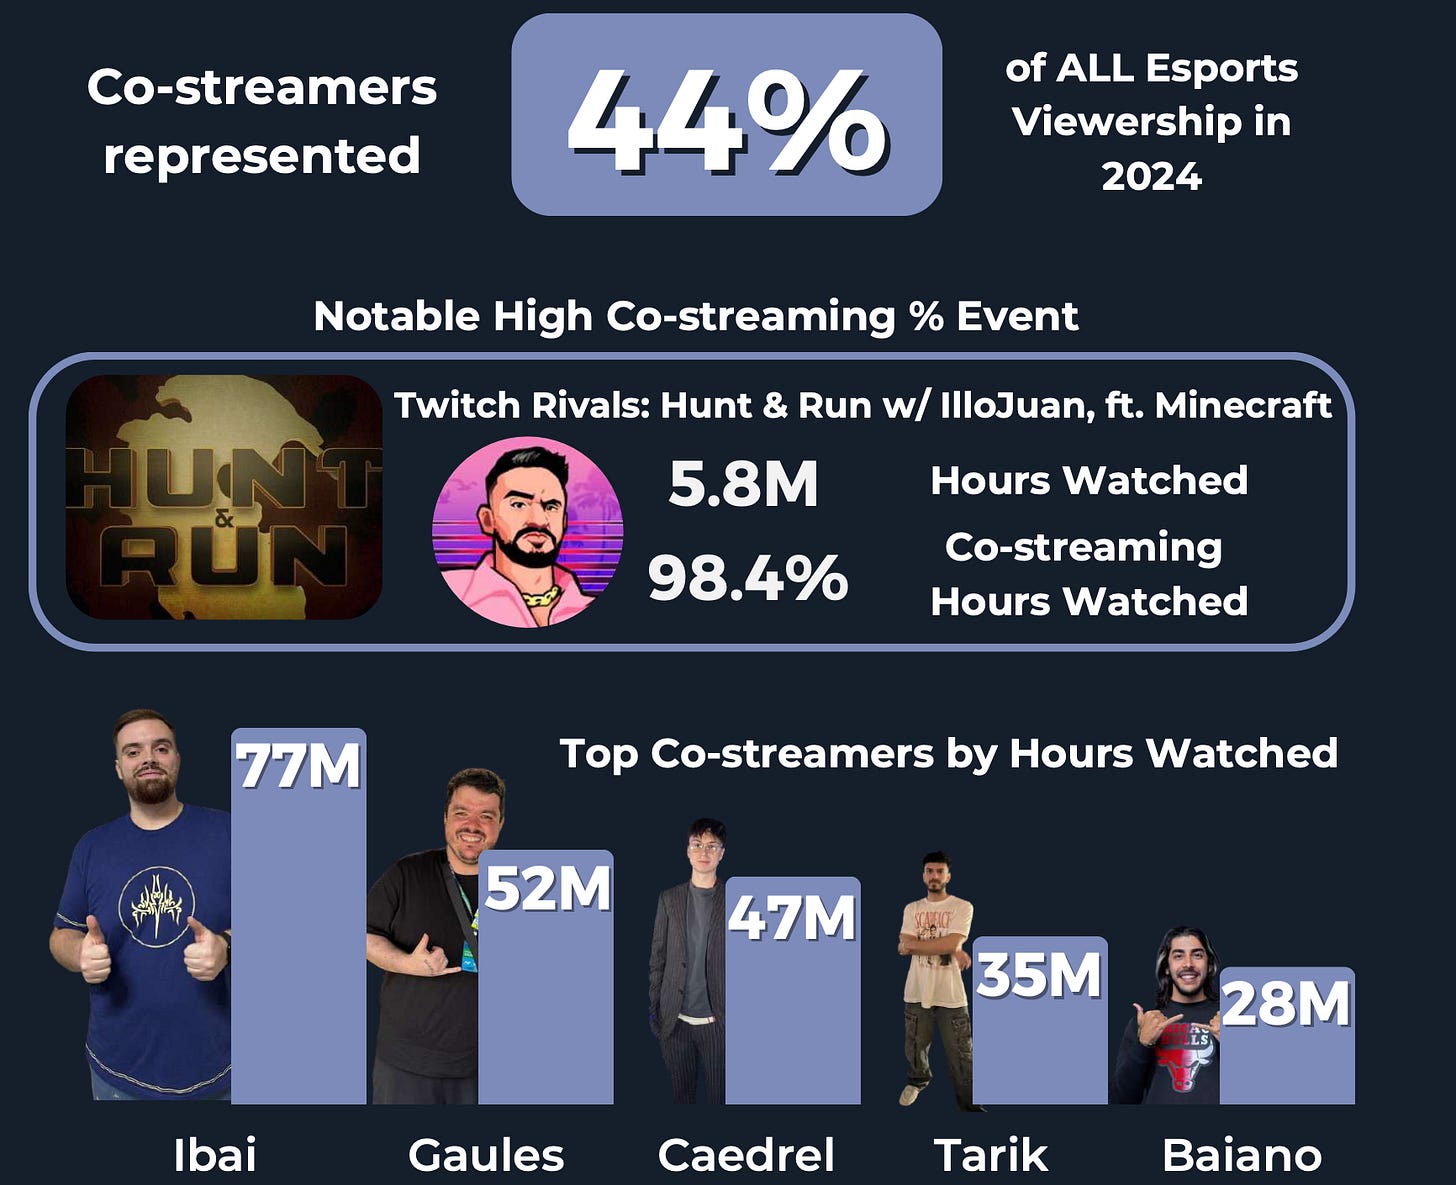
- Co-streaming (streaming esports events outside the main broadcast) accounted for 44% of all views in 2024.
SocialPeta: Mobile Game and Mini-Game Marketing Trends in 2024

The report doesn’t cover the Q4’24.
Mobile Games
- The average monthly number of advertisers in 2024 reached 63,500 companies, which is 31.6% higher than the previous year. However, throughout 2024, the share of new advertisers in the market decreased. On average, in 2024, their share was 8.2% (6% less than last year).
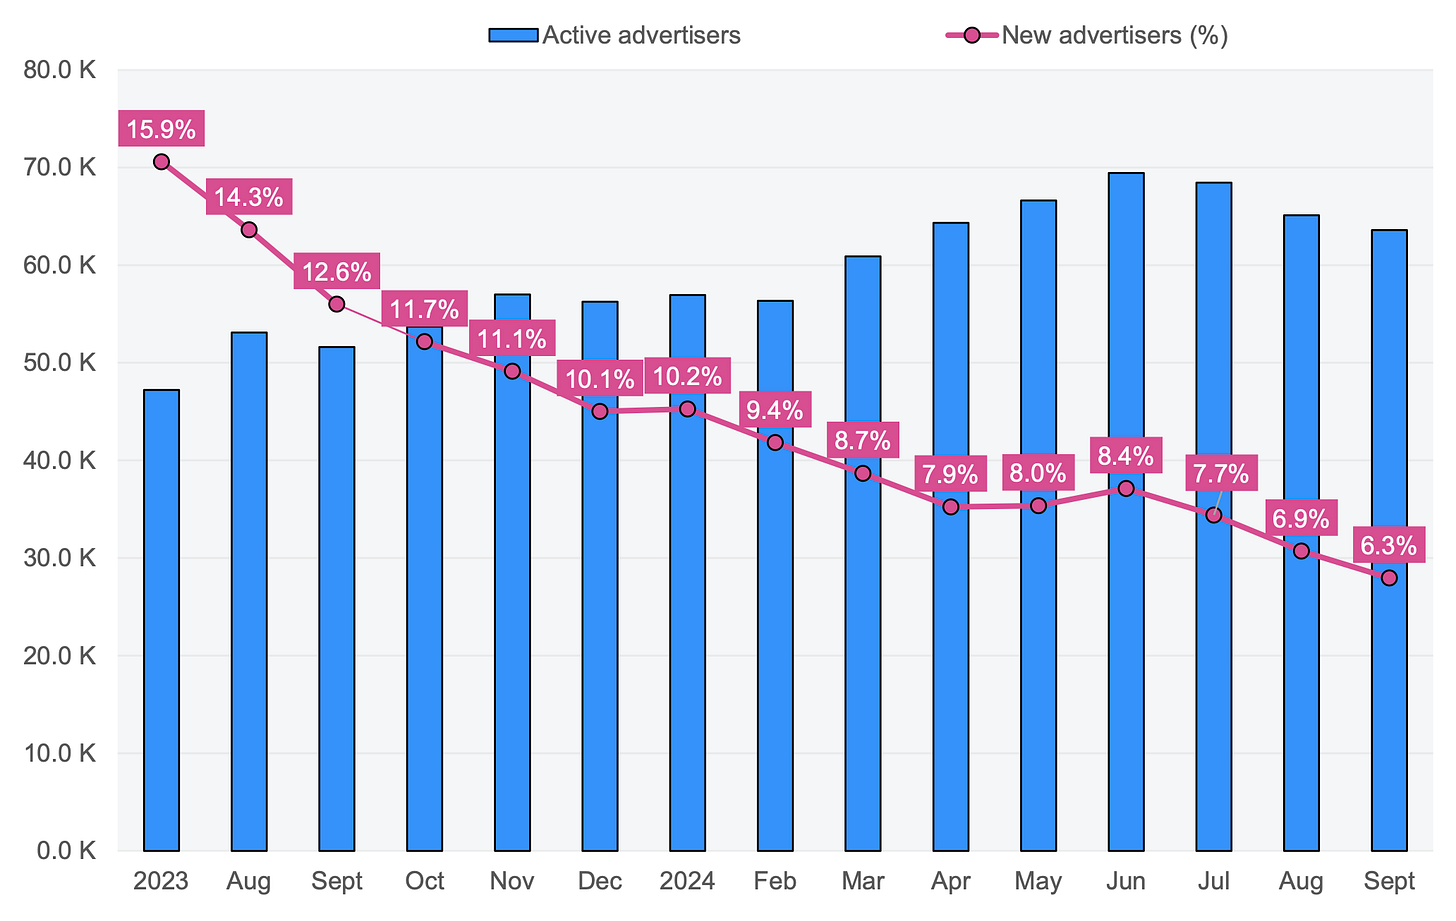
❗️This may indicate several reasons: the difficulty for new companies to enter the market and a decrease in the number of new mobile studios overall.
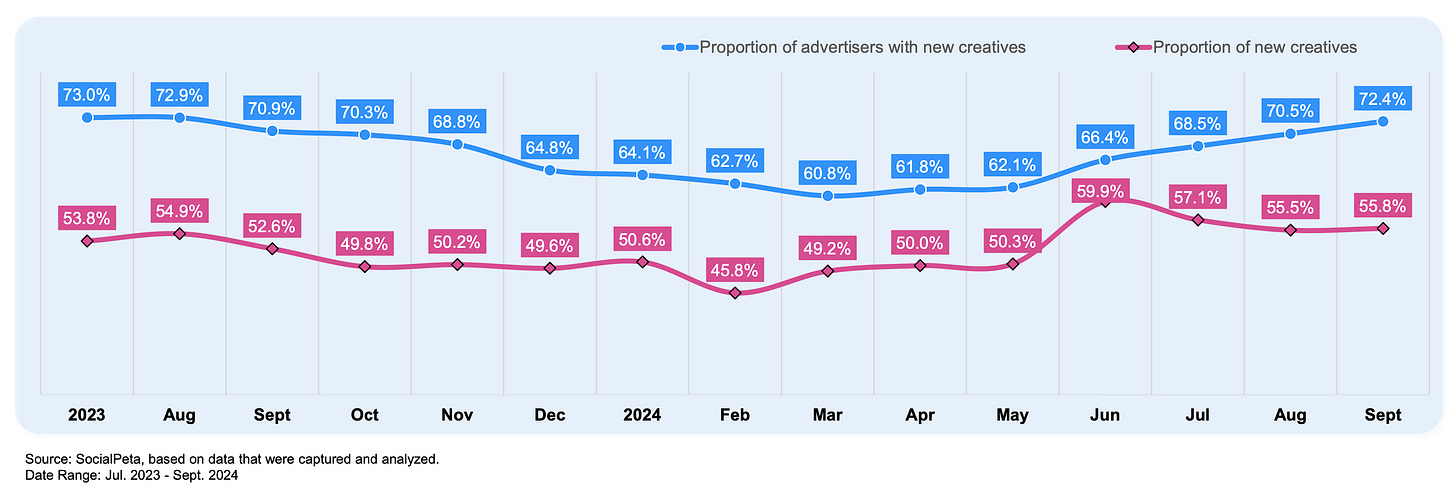
- Since March 2024, advertisers have begun to increase the share of new advertising creatives. From June onwards, new creatives accounted for more than 55% of the total volume.
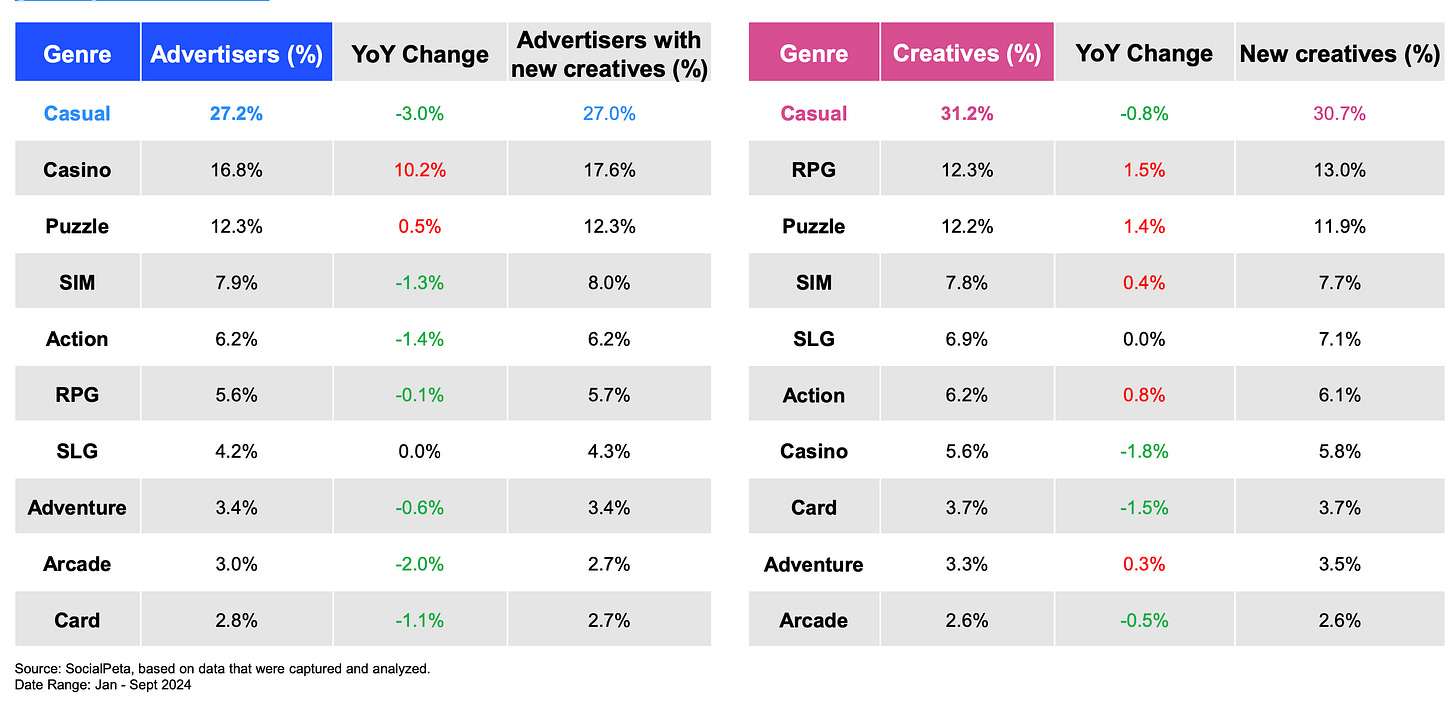
- Leaders in the number of advertisers are casual games (27.2%), casino games (16.8%), and puzzles (12.3%). In terms of creative volume, casual games lead with 31.2%, followed by RPGs (12.3%) and puzzles (12.2%). Notably, the casual games segment stands out from others with a higher proportion of new creatives.
Mini-Game Trends
- SocialPeta notes a trend in the launch of new Asian projects. They first appear in H5 format (WeChat Mini-Games; Douyin). After that, they are launched as full-fledged applications in Hong Kong, Macau, and Taiwan. Then, the launch occurs in Japan and South Korea, followed by Southeast Asia. Finally, the game reaches international markets. For example, the acclaimed Legend of Mushroom followed this path. Capybara Go! experienced a shortened path (after China - directly worldwide).
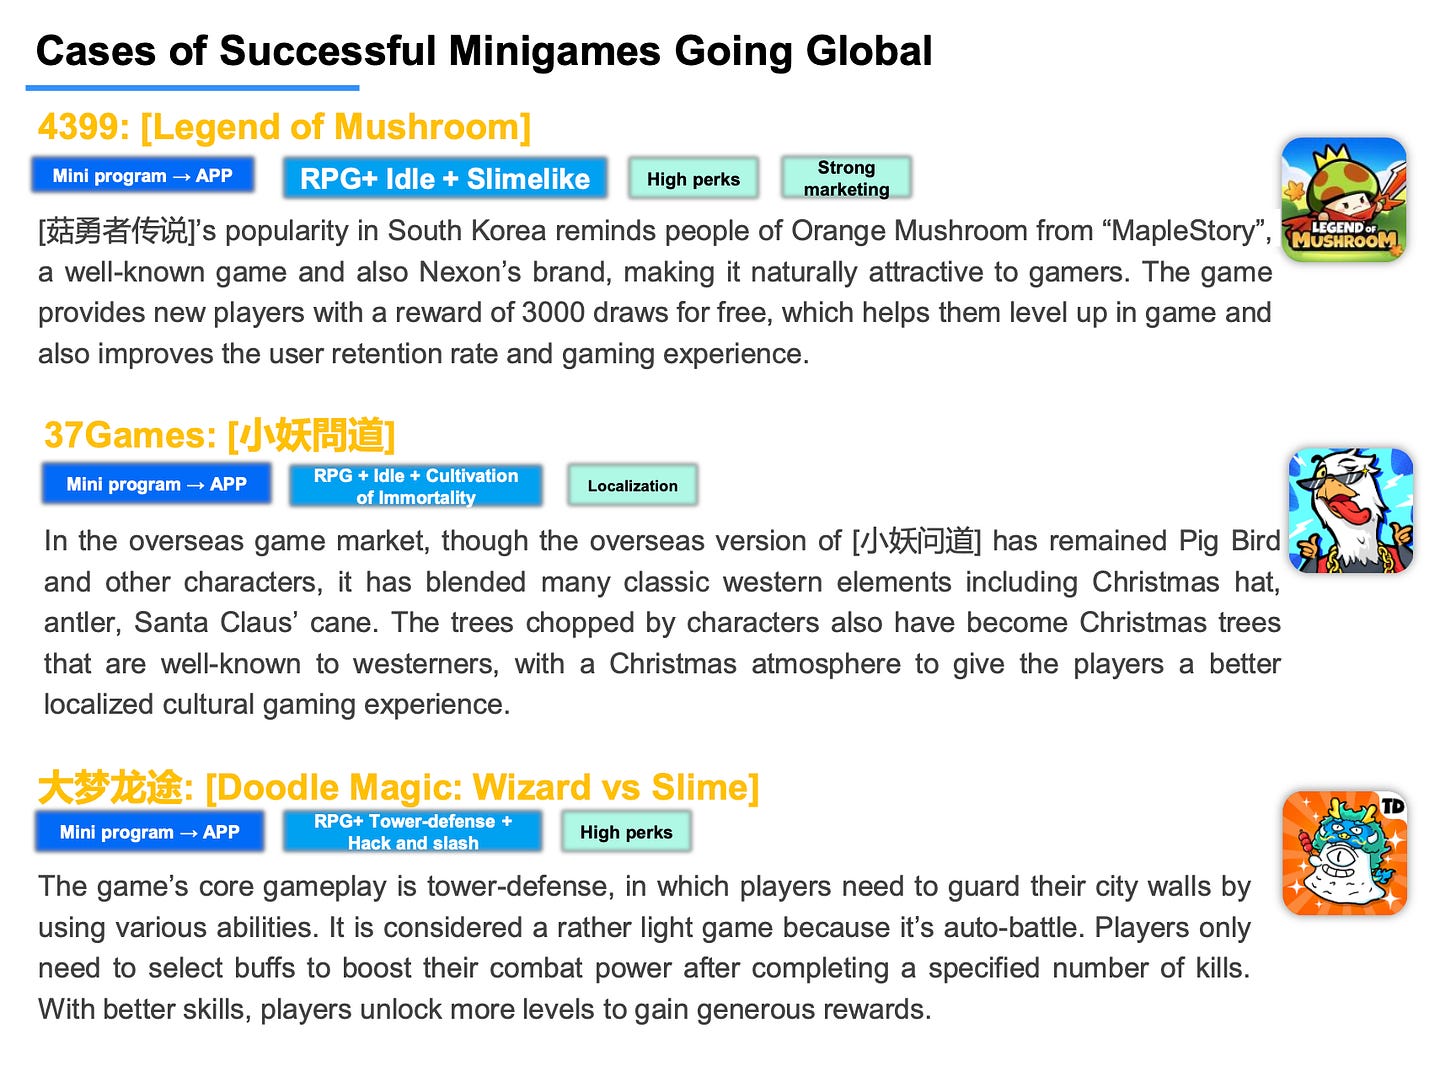
- Genres that launch well under this scenario are RPGs (or games with RPG elements). Most often, they are united by a simplified but cute visual style. They also feature chibi heroes - mushrooms, capybaras, and kittens.
AppMagic: Top Mobile Games by Revenue and Downloads in December 2024
AppMagic provides revenue data after deducting store commissions and taxes. Revenue from Android stores in China is not included.
Revenue
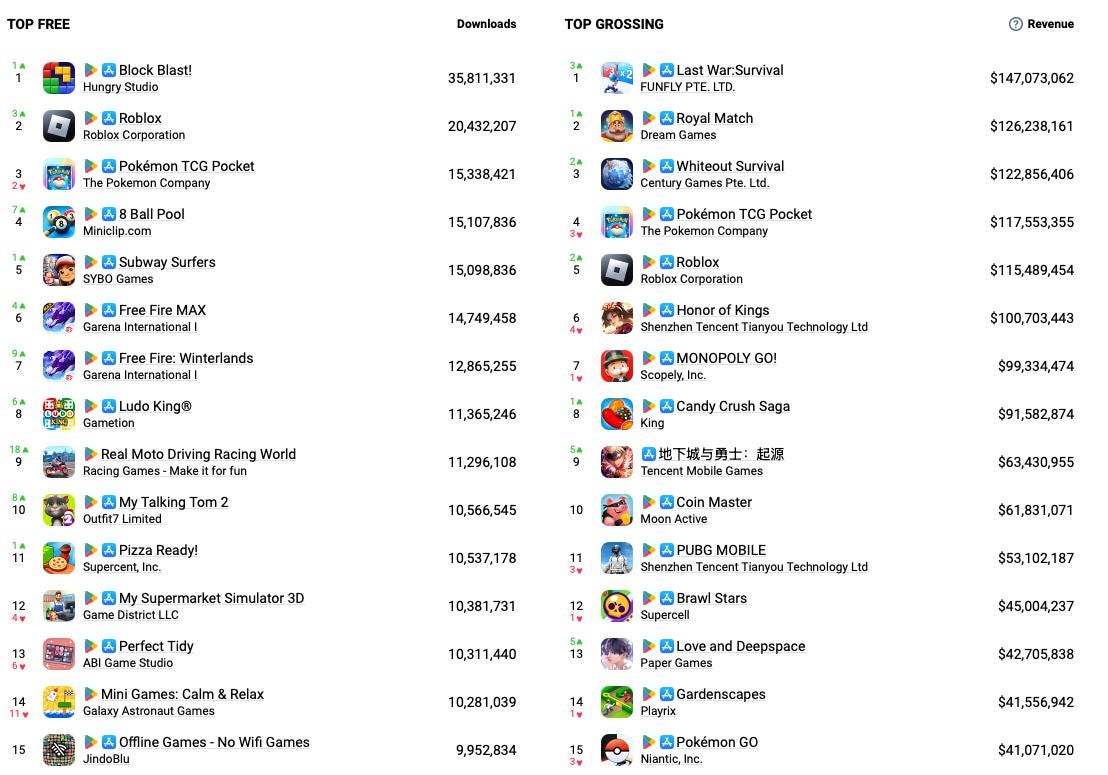
- Last War: Survival set its revenue record and took first place in December with $147 million. 42% of revenue came from the US, 24% from Japan, and 17% from South Korea. Interestingly, China is not on the list of countries at all.
- Royal Match ($126.2 million) and Whiteout Survival ($122.8 million) performed well in December. Both projects rose to the top 3 in revenue charts.
- Honor of Kings showed its worst result since December 2021 - $100.7 million. However, it’s worth remembering that the game’s main audience is in China, and the main in-game events will coincide with the Chinese New Year (which happens in late January). For the past 3 years, the game’s revenue has grown significantly during this period.
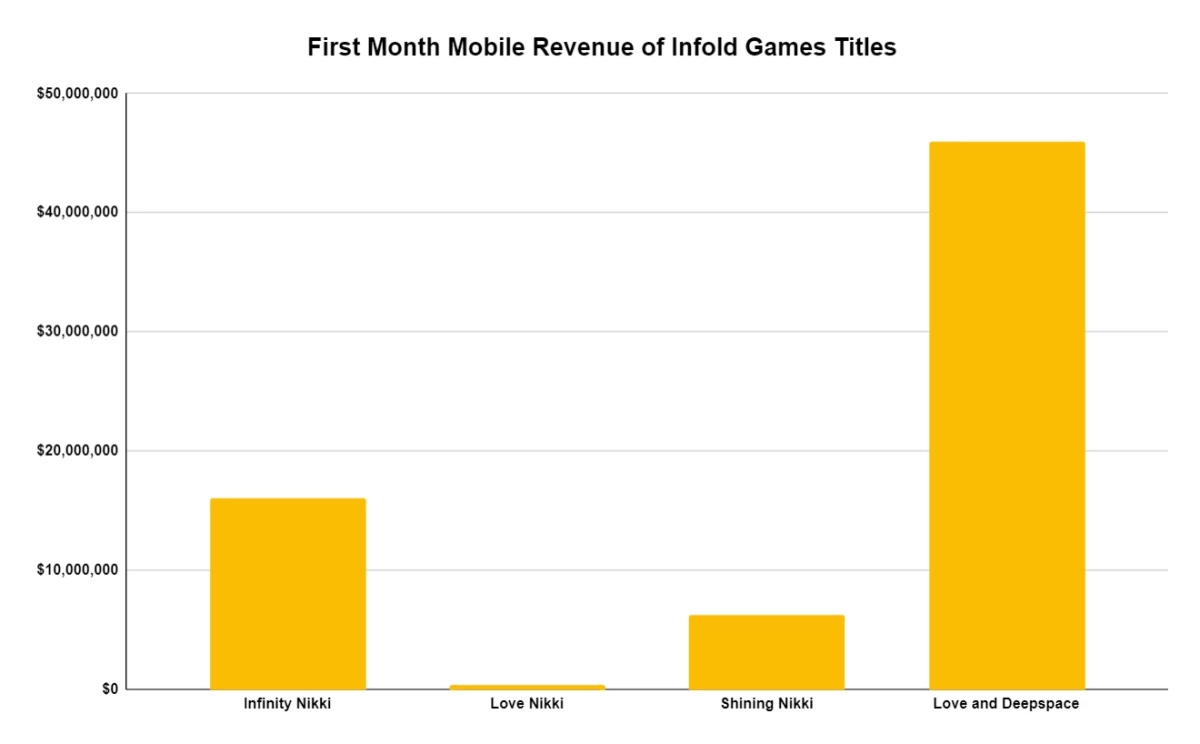
- Love and Deepspace is far ahead of all visual novels/dating sims. The game earned $42.7 million in December, 10 times more than its closest genre competitor and also the best month in the project’s history. It’s important to note that the game has RPG elements and Action combat - not typical features for this genre.
Downloads
- The leaders in the download rankings remained the same - Block Blast! returned to first place (35.8 million installations); Roblox is second (20.4 million); Pokemon TCG Pocket moved to 3rd place (15.3 million installations).
- Downloads increased for Garena: Free Fire (14.7 million for the MAX version; 12.8 million for the regular version).
- Real Moto Driving Racing World made it into the top 10 with 11.3 million installs. The majority (37%) came from India.
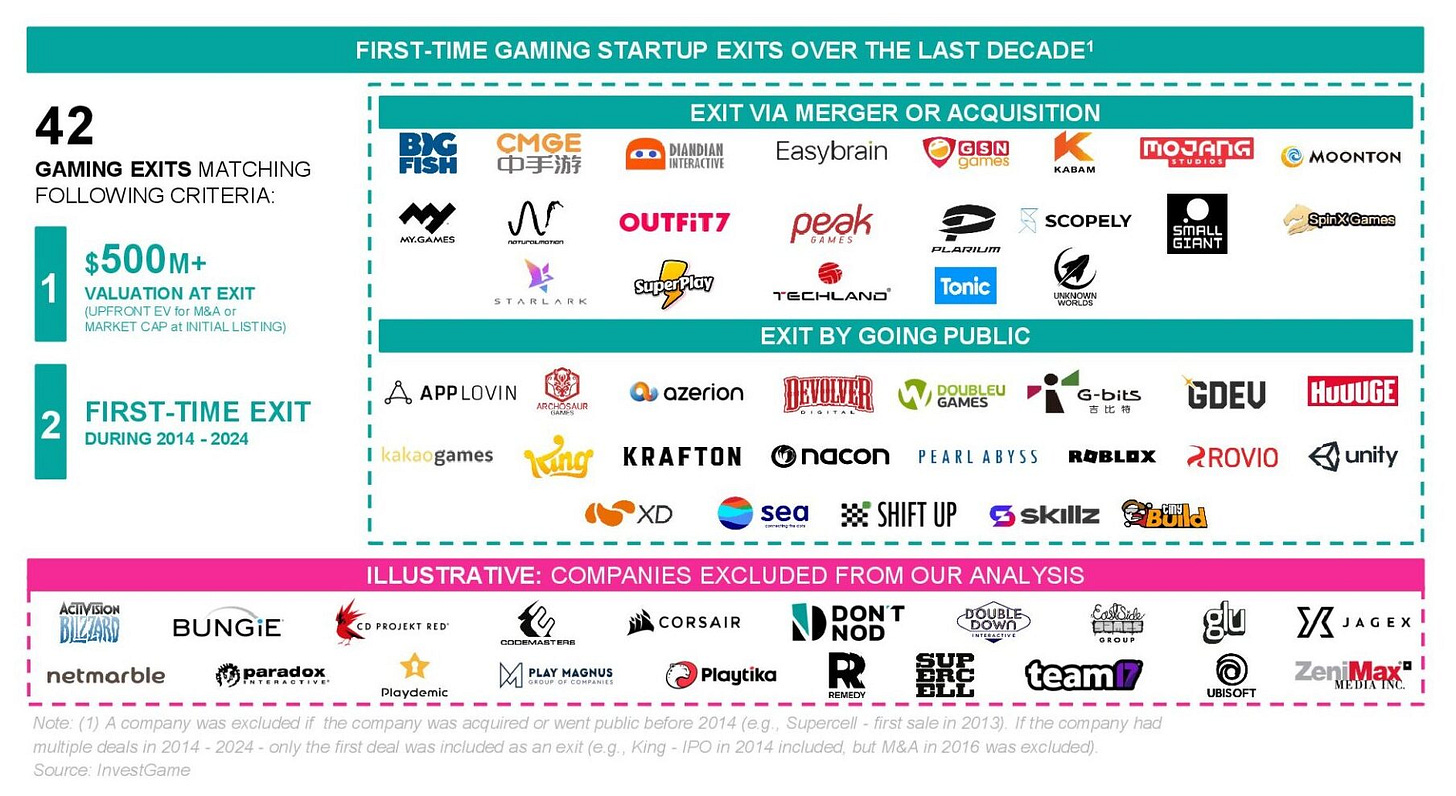
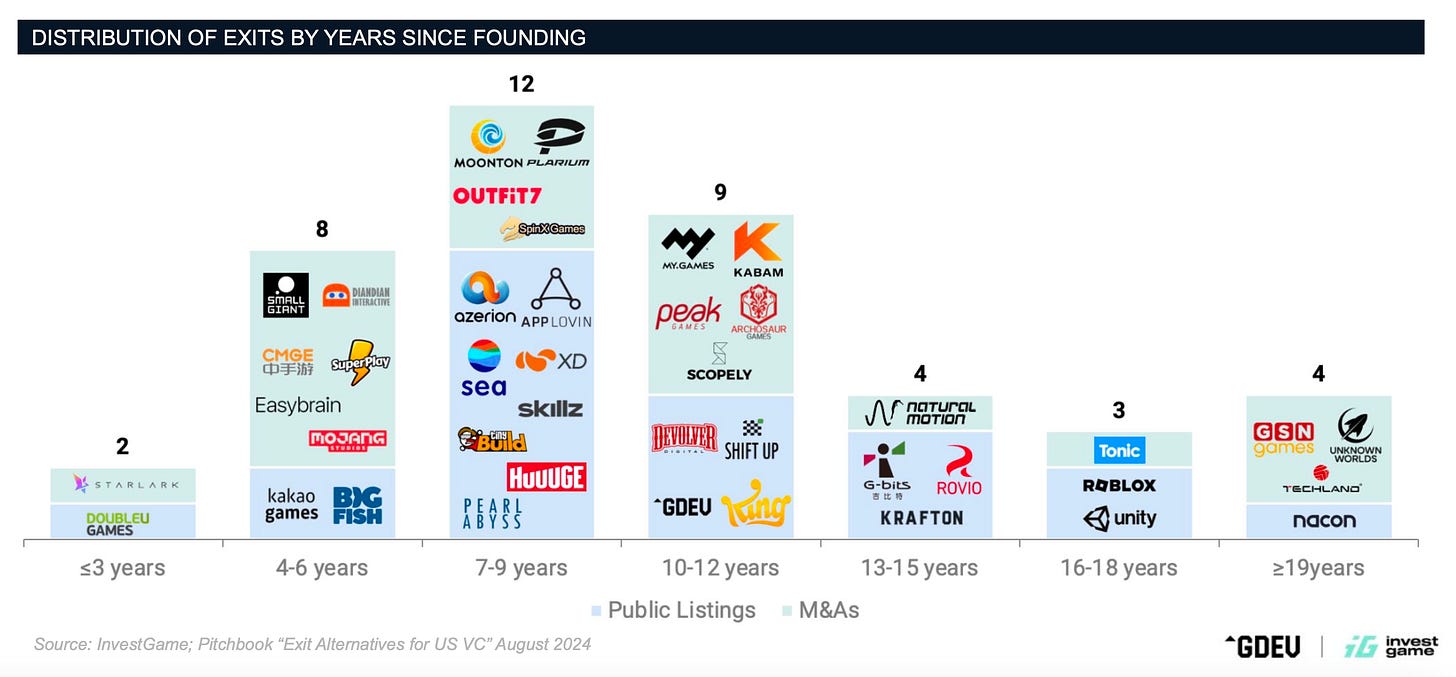
InvestGame & GDEV: Major exits in the Gaming Industry over the last 10 years

The InvestGame team defines “major” exits as those valued at $500 million and above. Data from the past 10 years is considered. Only companies for which such a deal is the first are included (which is why Jagex or Activision Blizzard, for example, are not on the list).
Top 5 Largest M&As and Public Offerings
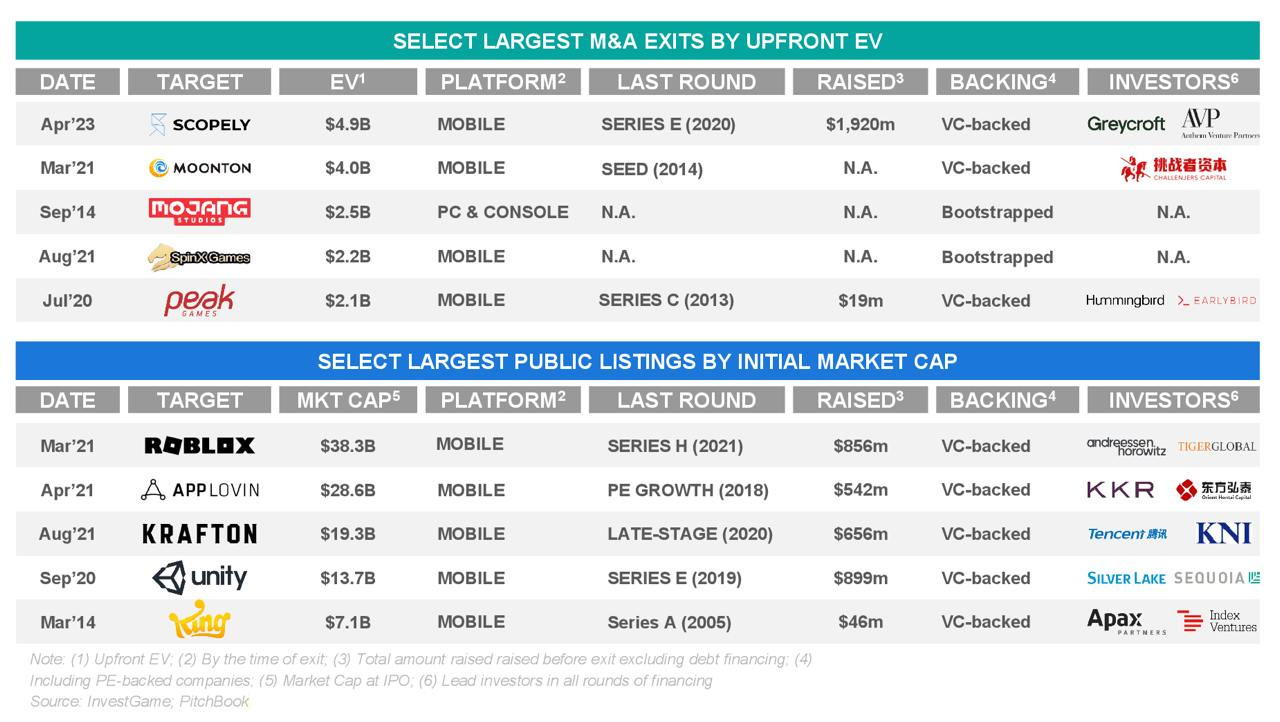
- 4 out of 5 largest M&A deals in the last 10 years involved mobile companies. Mojang Studios stands out, as at the time of the Microsoft deal, most of its revenue came from PC and consoles. Two companies (Mojang Studios and SpinX Games) were built without external investors.
- The leaders in valuation at the time of public offering are companies working with the mobile market. All of them generated most of their revenue from mobile devices at the time of listing (including Krafton). It's also worth noting that VC funds financed all the companies on the list.
Deals timeline
- 2021 proved to be the most productive year in terms of large M&As and public offerings. There were 7 M&A deals totaling $9.5 billion and 7 public offerings with a total valuation of $90.7 billion at the time of listing.
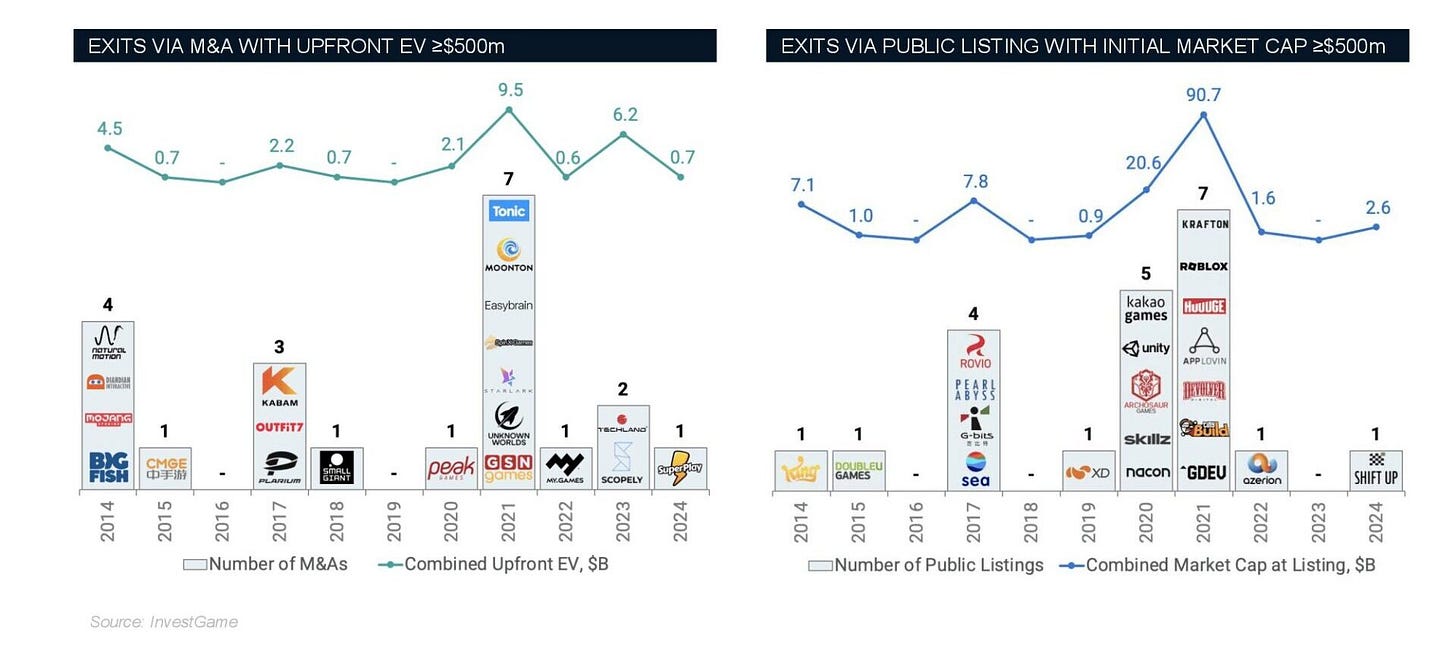
- The industry median is one M&A deal and one public offering larger than $500 million per year.
Deals by backing method
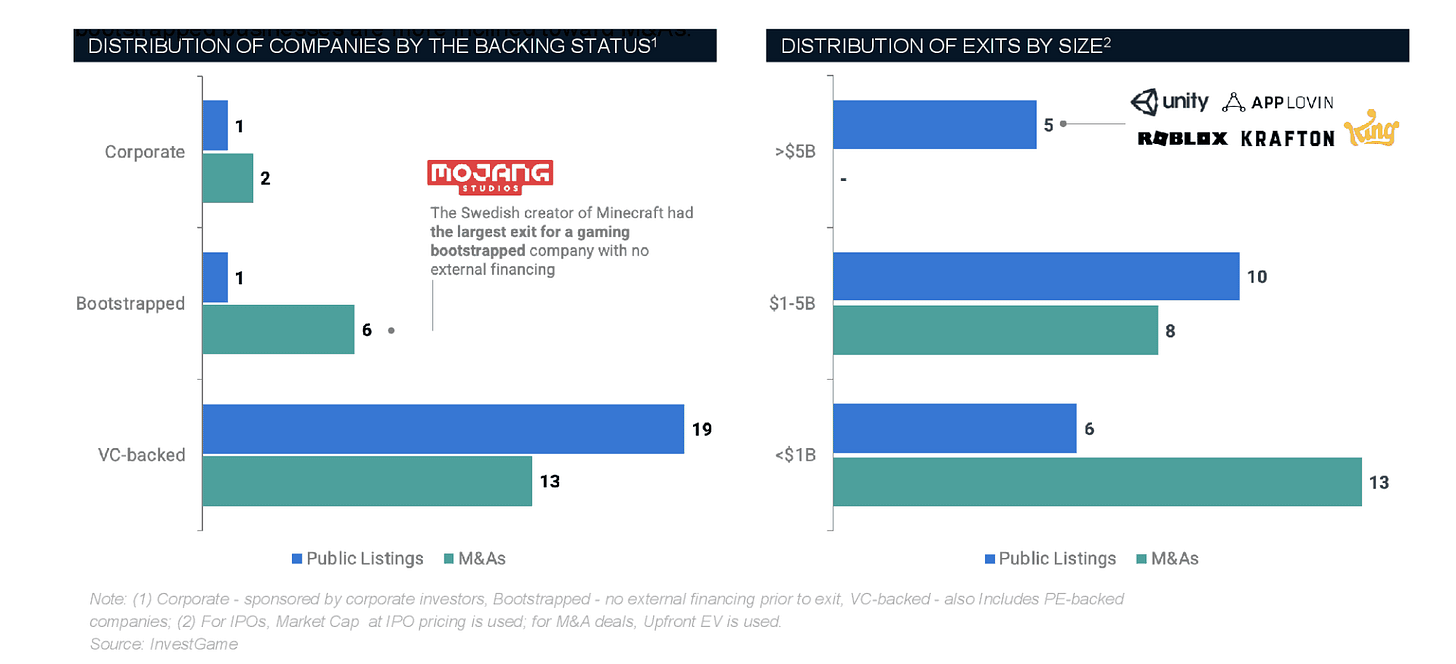
- Companies with VC fund involvement account for 75% of all major deals (valued over $500 million). 60% of VC-funded companies went the public offering route.
- Among companies founded with their own funds, only 1 out of 7 went public - GDEV. All the others were bought by larger players. Interestingly, out of 7 companies, 5 had a valuation exceeding $1 billion at the time of the deal.
- When looking at companies financed by corporate funds, 3 companies made it into the sample. One was bought, and the other two went public.
❗️The goal of many corporate funds is to consolidate successful companies in their early stages. This might be why there aren't many of them on the list. The valuation simply doesn't have time to "grow".
Deal Sizes and Time to Completion
- Only companies that went for an IPO have valuations above $5 billion. M&A deals dominate in the category of deals up to $1 billion.
- Mobile gaming companies, on average, exit 40% faster compared to PC/console studios.
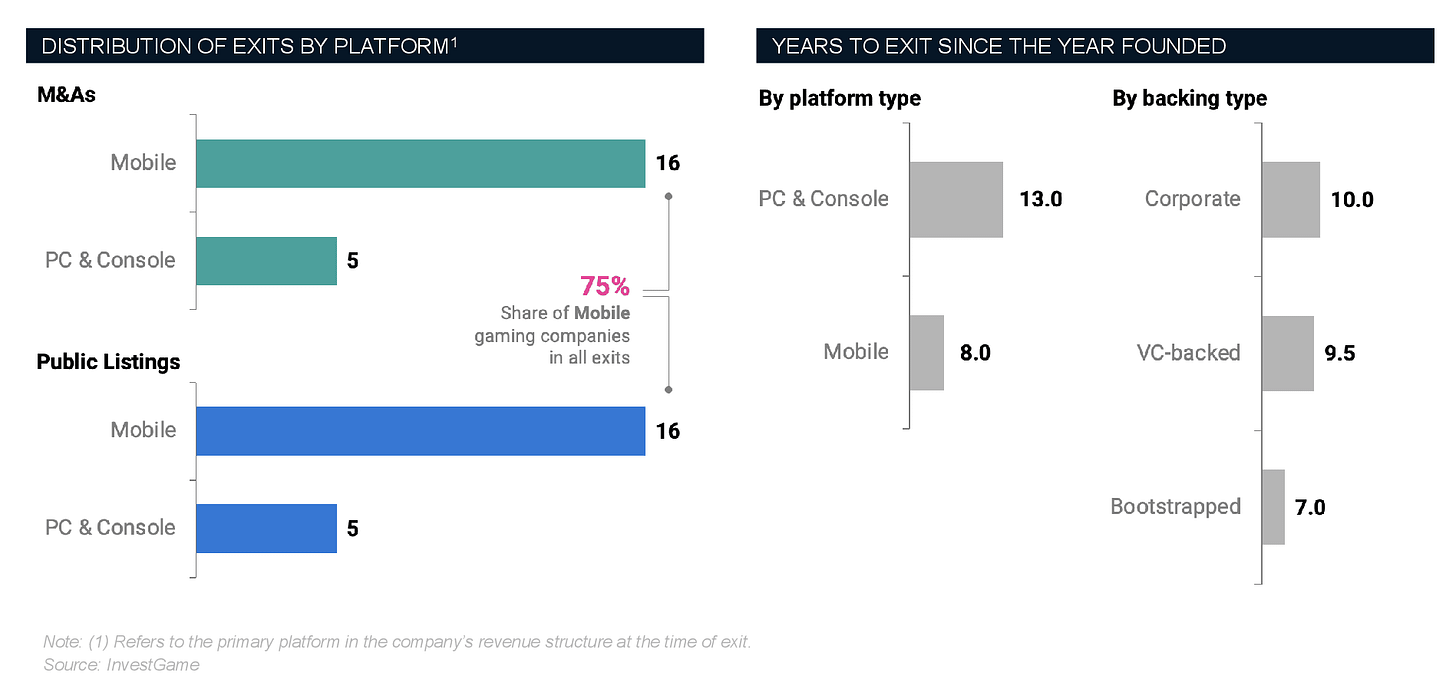
- Statistically, companies that raised funds from corporations take the longest to exit (10 years). Companies with VC funding take 9.5 years. The fastest to reach the point of sale or public offering are companies without external financing - they take an average of 7 years.
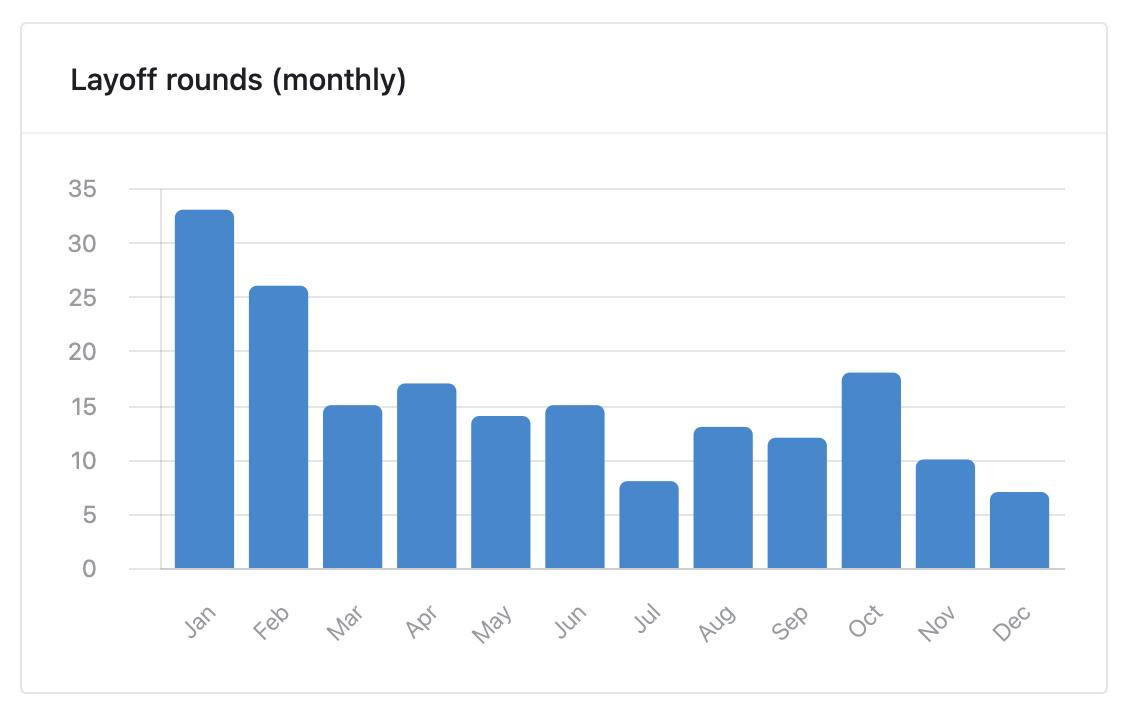
Game Industry Layoffs: 14,600 people lost their jobs in 2024

Game Industry Layoffs only report public cases of layoffs in the industry. When the number of affected individuals is unknown, the portal provides its estimate.
- In 2024, 14,600 people lost their jobs. The largest rounds of layoffs occurred at Microsoft (2,800 people), Unity (1,800 people), and Sony (1,339 people).
- The peak of layoff announcements occurred in January 2024 - 33 cases were reported. In February, an additional 26 rounds of layoffs were announced. In the remaining months, there were no more than 18 announcements.
- Layoffs in 2024 were 39% more extensive than in 2023. At that time, 10,500 people lost their jobs.
- In 2022, 8,500 people lost their jobs.
Games and Numbers (December 25, 2024 - January 7, 2025)
PC/Console Games
- In December 2024, Stardew Valley sales surpassed 41 million copies. The developer announced this on the website. 26 million copies were sold on PC and Nintendo Switch accounted for another 7.9 million.
- NieR: Automata has been sold over 9 million times. The game was released on February 23, 2017.
- Sales of the Resident Evil 4 remake have reached 9 million copies. Only 3 games in the series’ history have sold more than 10 million copies - Resident Evil 7 Biohazard, Resident Evil 2: Remake, and Resident Evil: Village.
- The indie horror game MiSide from a small Russian studio (2 people) became a December hit on Steam. According to VG Insights estimates, the game has already earned almost $15 million.
Mobile Games
- Scopely has earned over $10 billion in its history, as the company wrote in its blog. The company’s games have been downloaded more than 1 billion times, with users spending 15 billion hours playing them.
- Pokemon TCG Pocket has earned more than $300 million, according to Sensor Tower. 41.5% of the money comes from Japan, 21.7% from the USA, and 7.3% from France.
- ARK: Ultimate Mobile Edition launched on mobile devices on December 18, with over 1 million downloads in the first 24 hours after release. Currently, AppMagic shows almost 2 million installs and $500 thousand in revenue (after taxes and platform fees).
Transmedia
- The box office for the Sonic movie trilogy has exceeded $1 billion. The third installment of the film has grossed more than $336.3 million since its release on December 20. The fourth part of the film is already in development.
Aream & Co.: Gaming Company CEOs on expectations for 2025
The survey included about 50 gaming company executives; conducted in December 2024.
Aream & Co. has advised deals such as the sale of Superplay ($2 billion); Easybrain ($1.2 billion); Plarium ($620 million) and many others. It’s the world’s leading investment bank focusing on games.
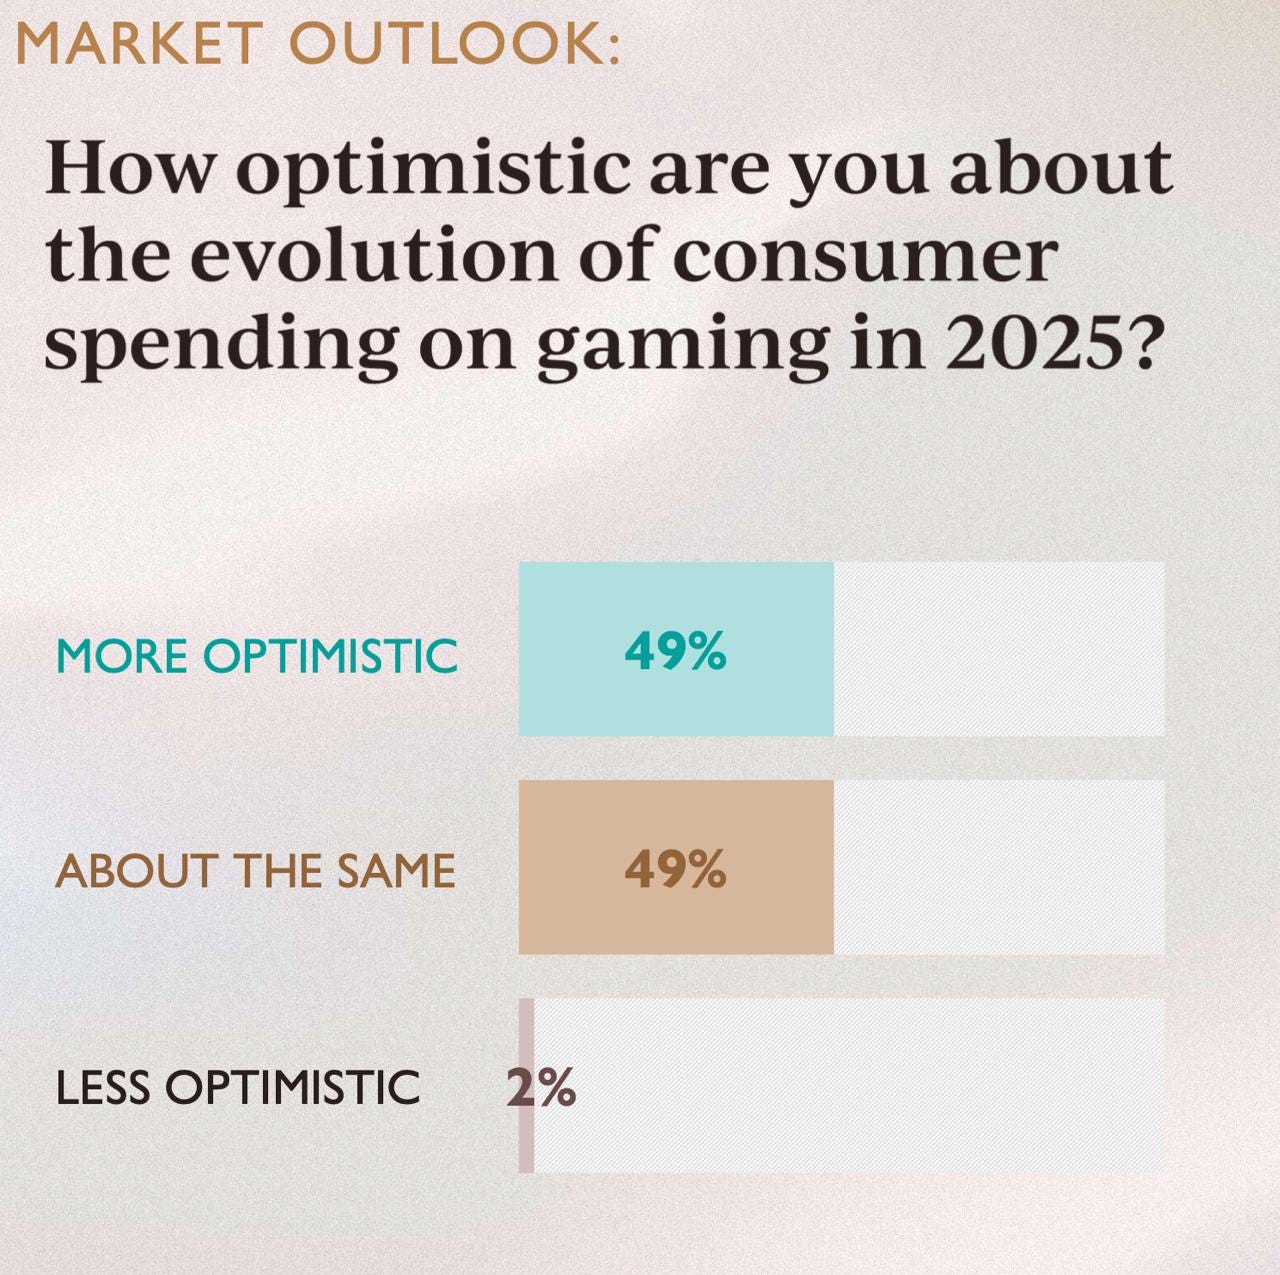
Market Condition
- 49% of respondents believe users will spend more on games in 2025. 49% think spending levels will remain unchanged. Only 2% are pessimistic and expect people to spend less on games.
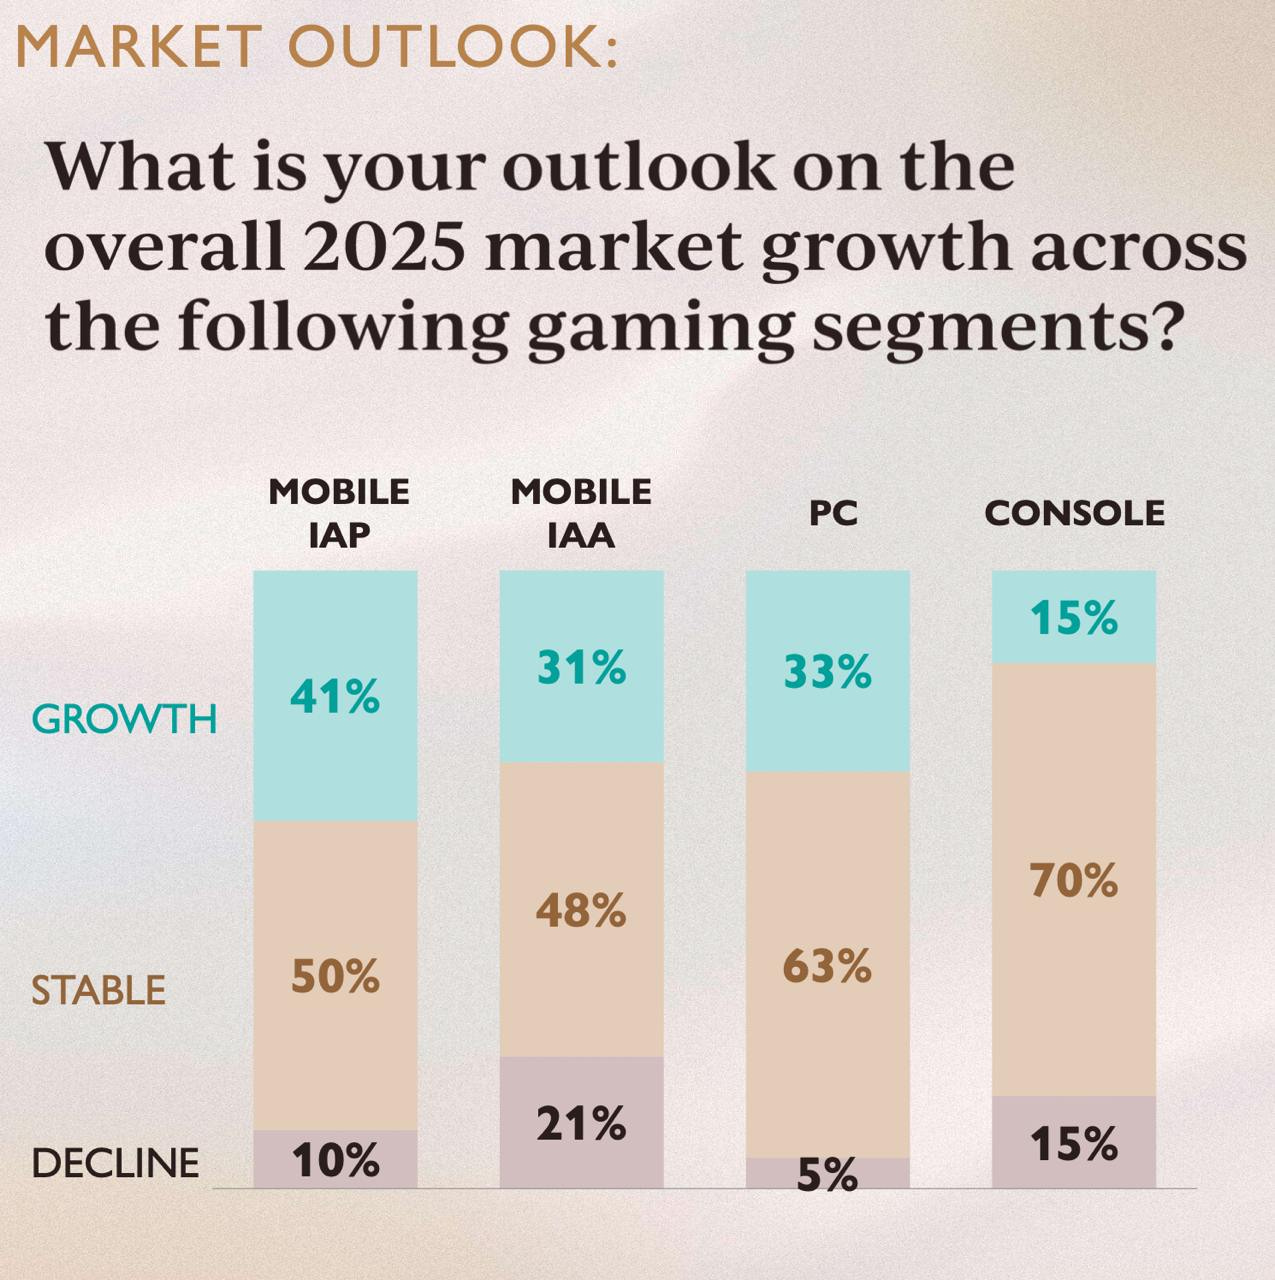
- The mobile segment is viewed most positively (41% expected growth in IAP payments; 31% growth in advertising revenue). The PC segment comes second (33% anticipated growth). The console market is seen as most static (70% predict no growth; 15% each forecast growth or decline). Interestingly, PC has the least negative outlook.
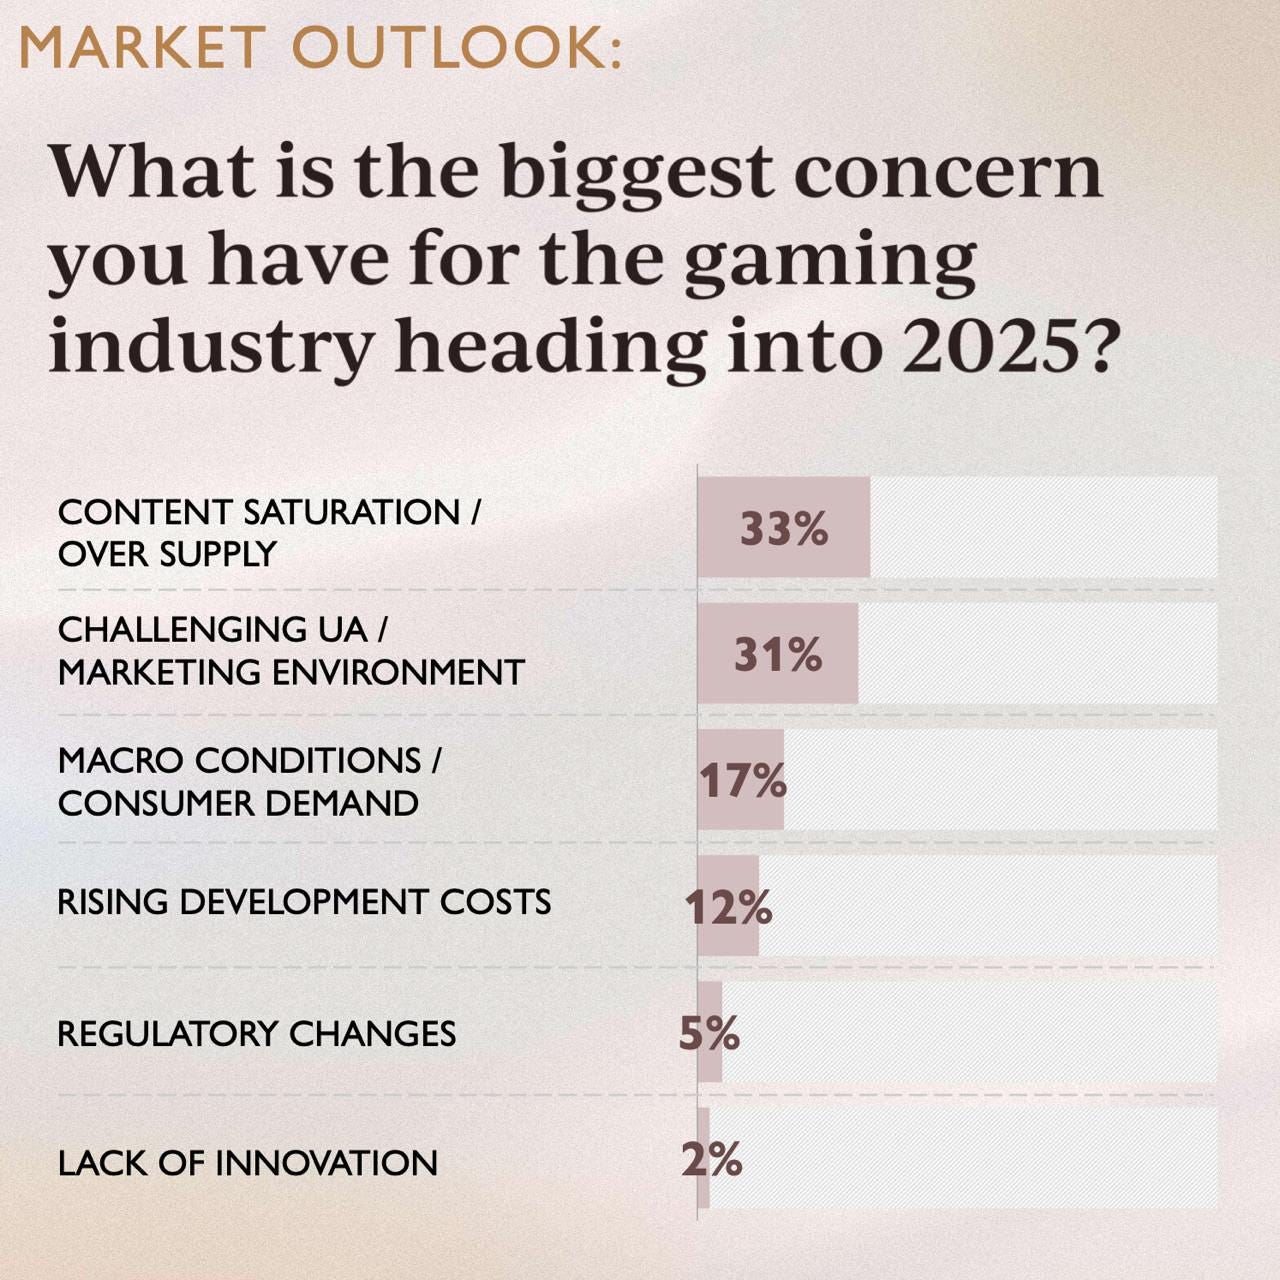
- The most common problems in the gaming industry, according to CEOs, are too much content (33% noted this point); difficulties in attracting audience (31%); macroeconomic environment and consumer demand (17%); rising development costs (12%). A small portion noted regulatory changes (5%) and lack of innovation (2%).
Plans for 2025
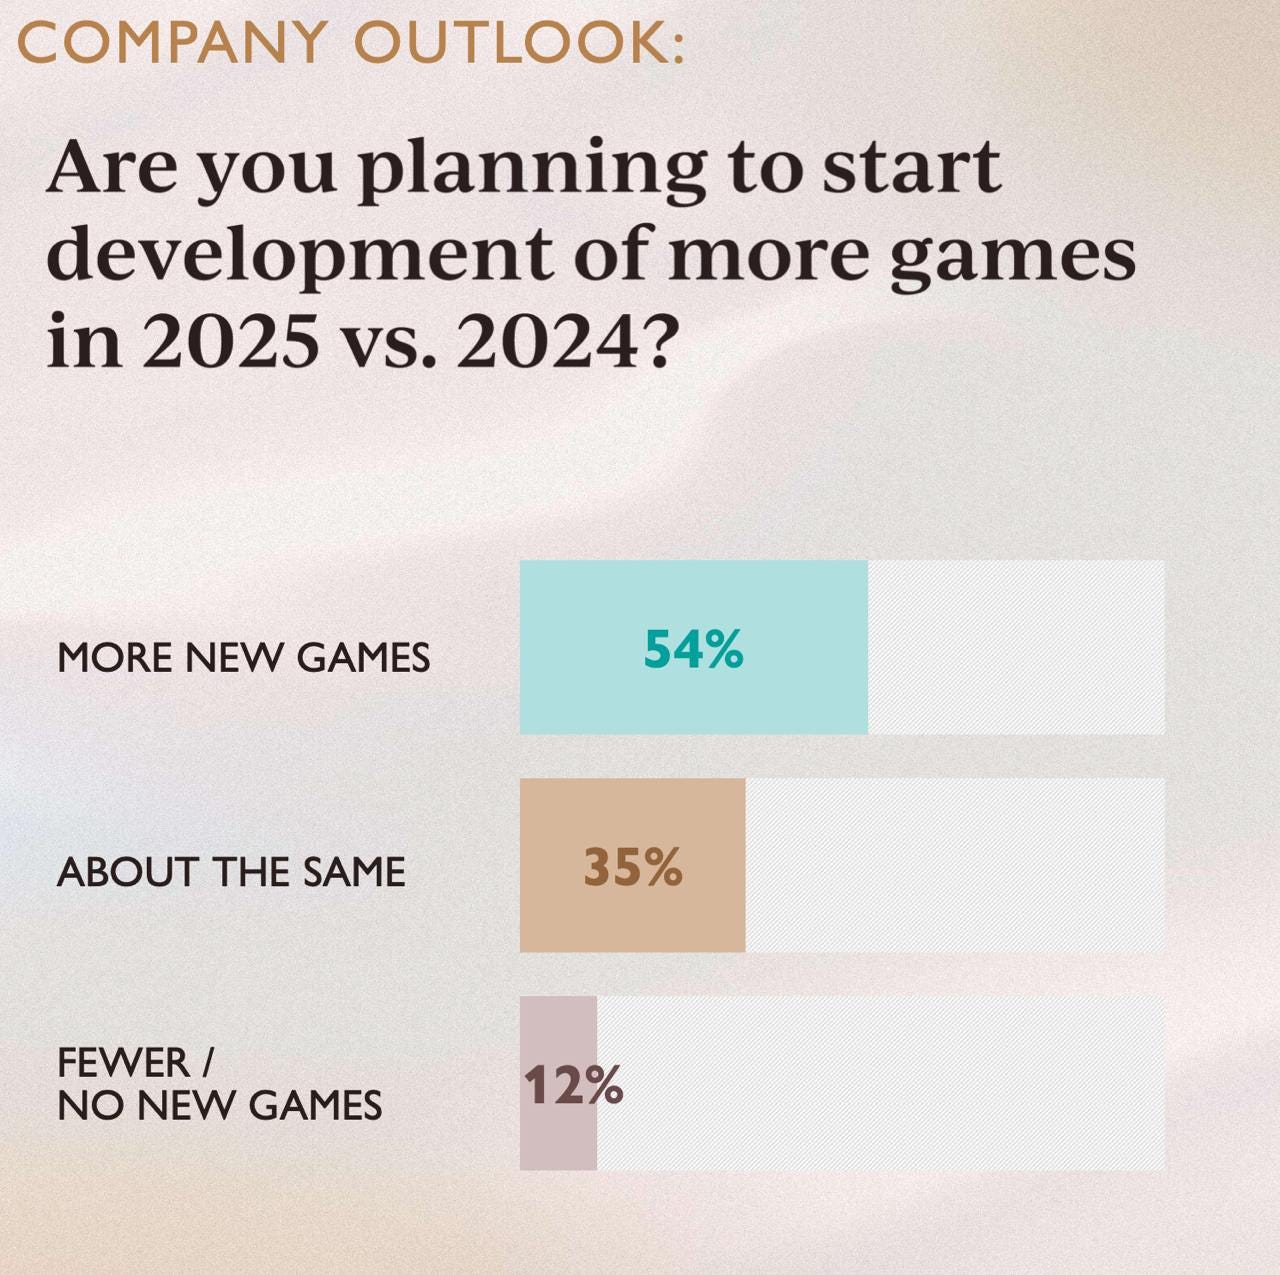
-
54% of executives plan to start working on more games than in 2024. 35% plan to work on the same number of projects, while 12% want to reduce the number of games in development.
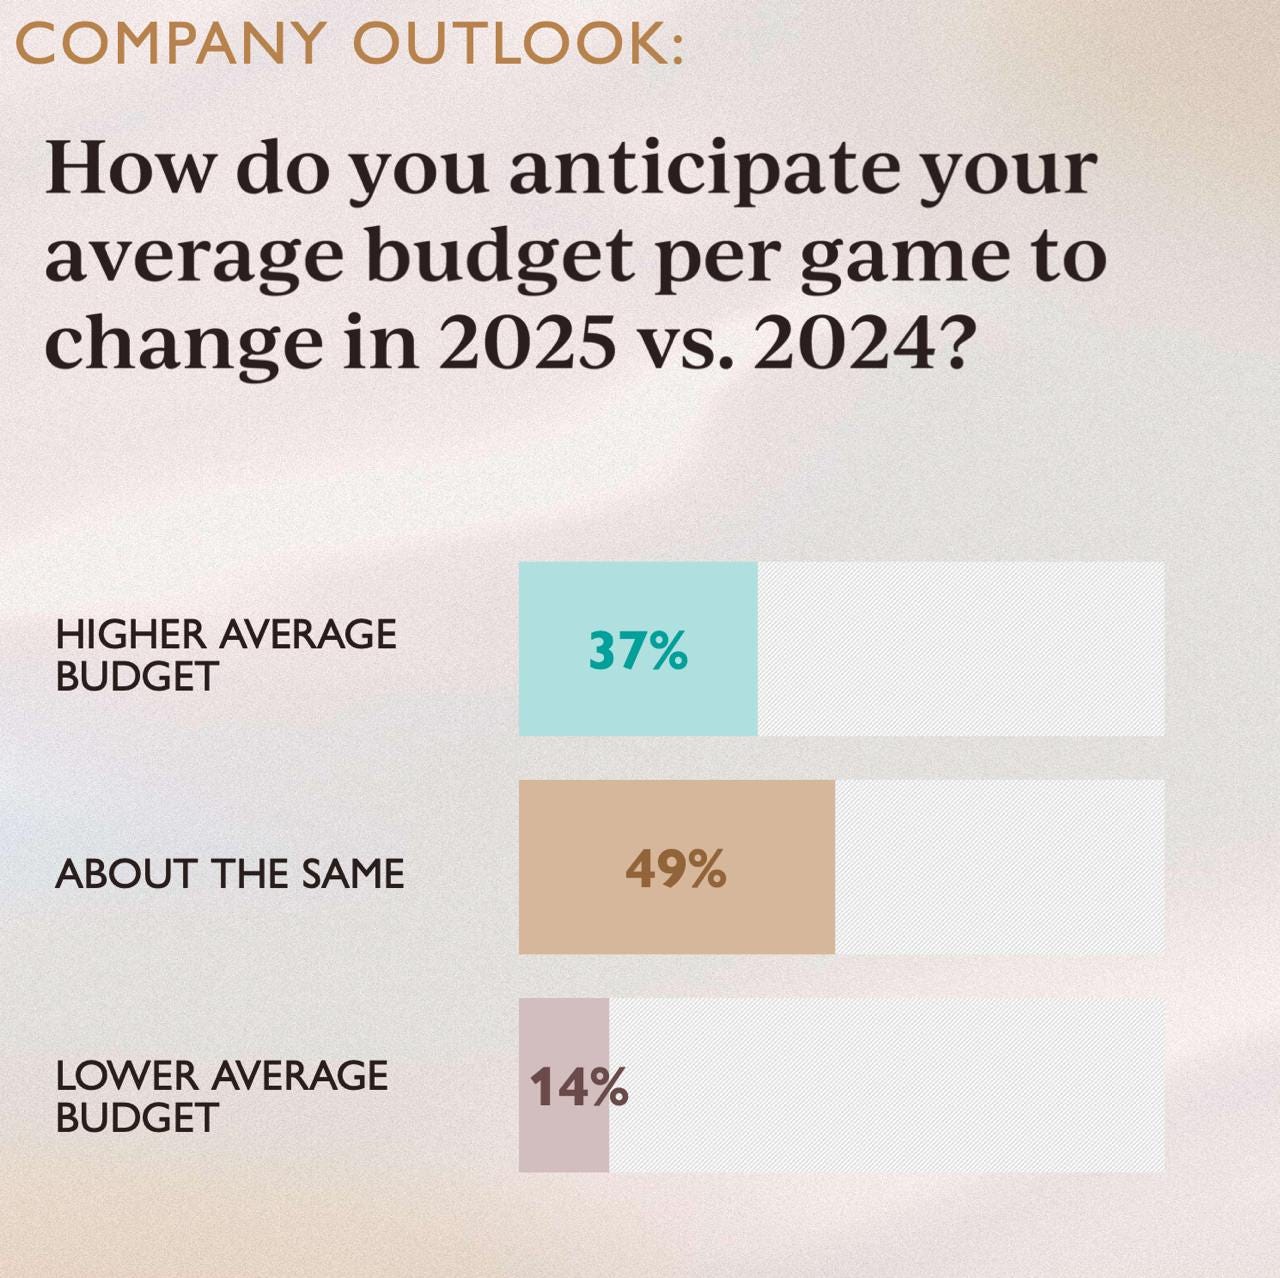
- Meanwhile, 37% are ready to increase budgets; 49% plan to maintain them at the same level; 14% plan to reduce spending on new development.
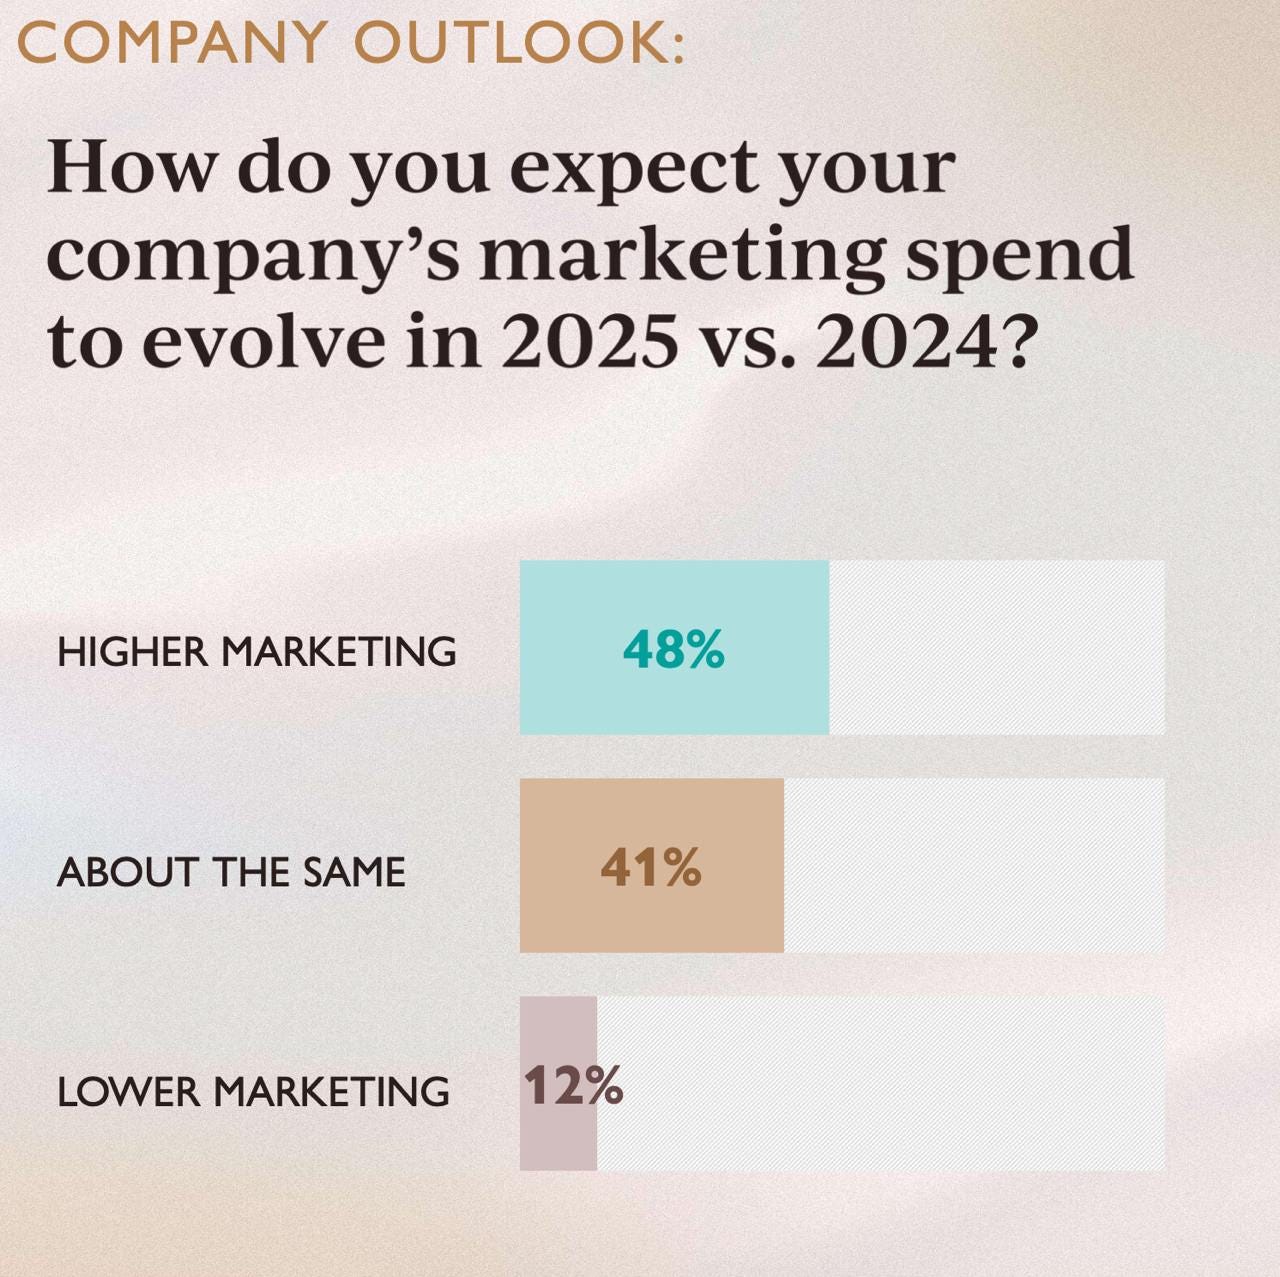
- In 2025, 48% of company executives plan to increase marketing spending. 41% want to stay at the same level, while 12% want to reduce expenses.
- In terms of hiring, executives are most interested in game developers (71%), engineers (42%), Live Ops and community building specialists (32%), as well as marketing and UA specialists (24%).
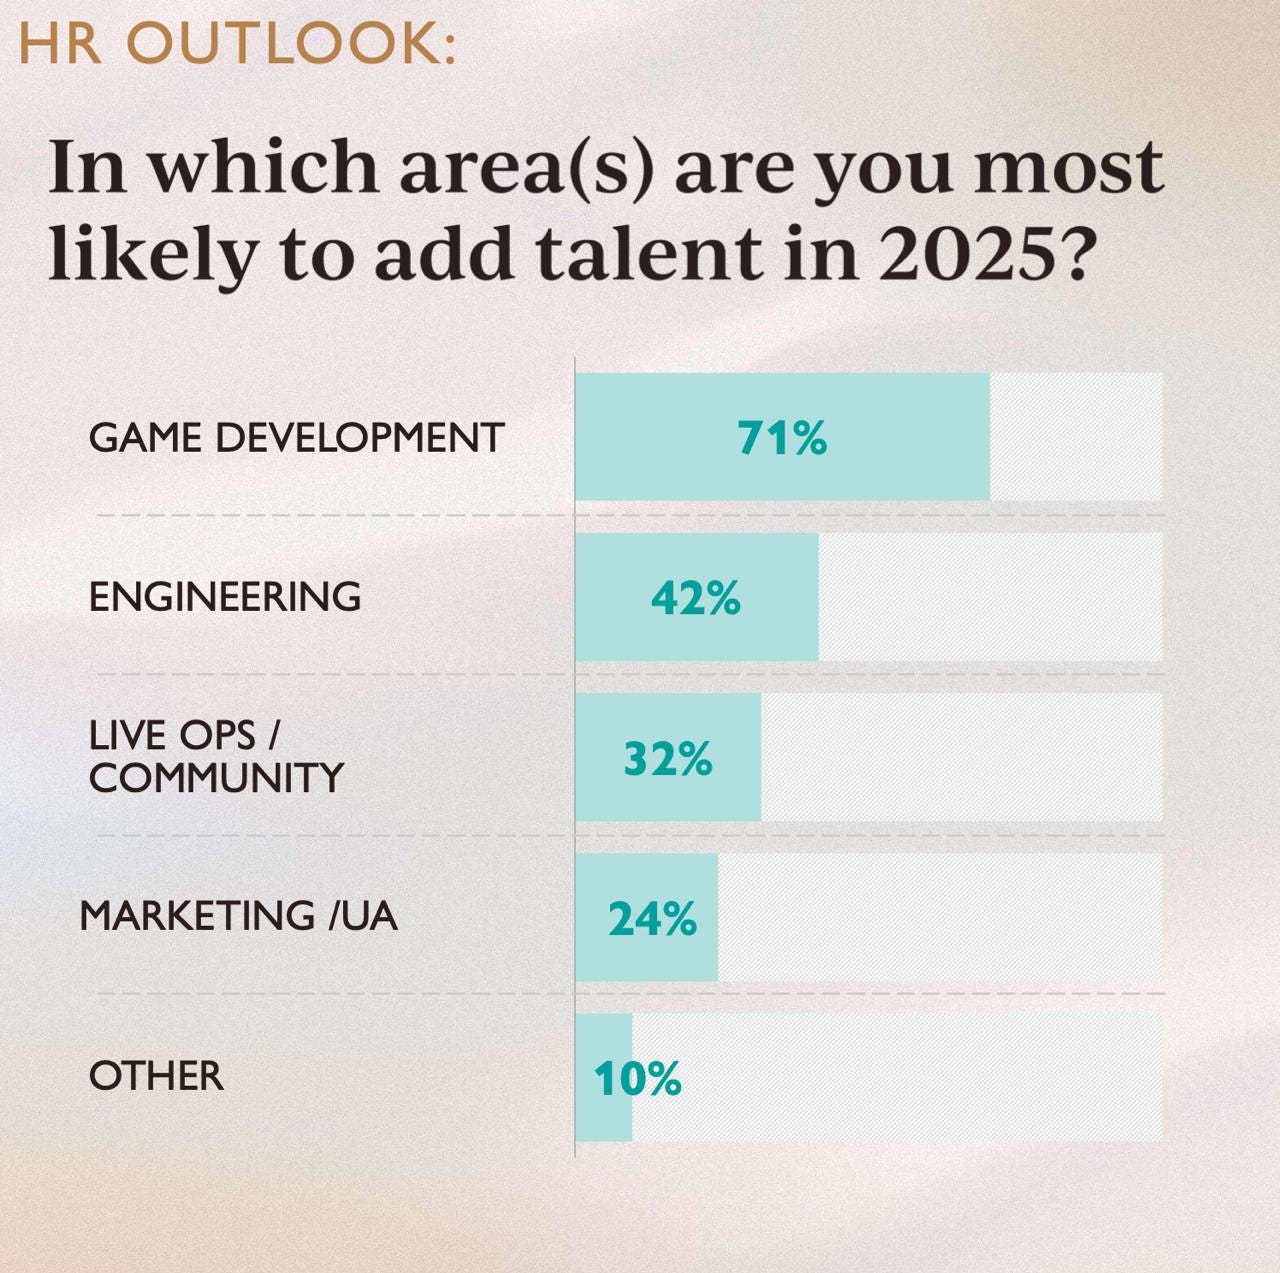
❗️Live Ops and community management are combined in the survey - I would argue that they should be in one basket.
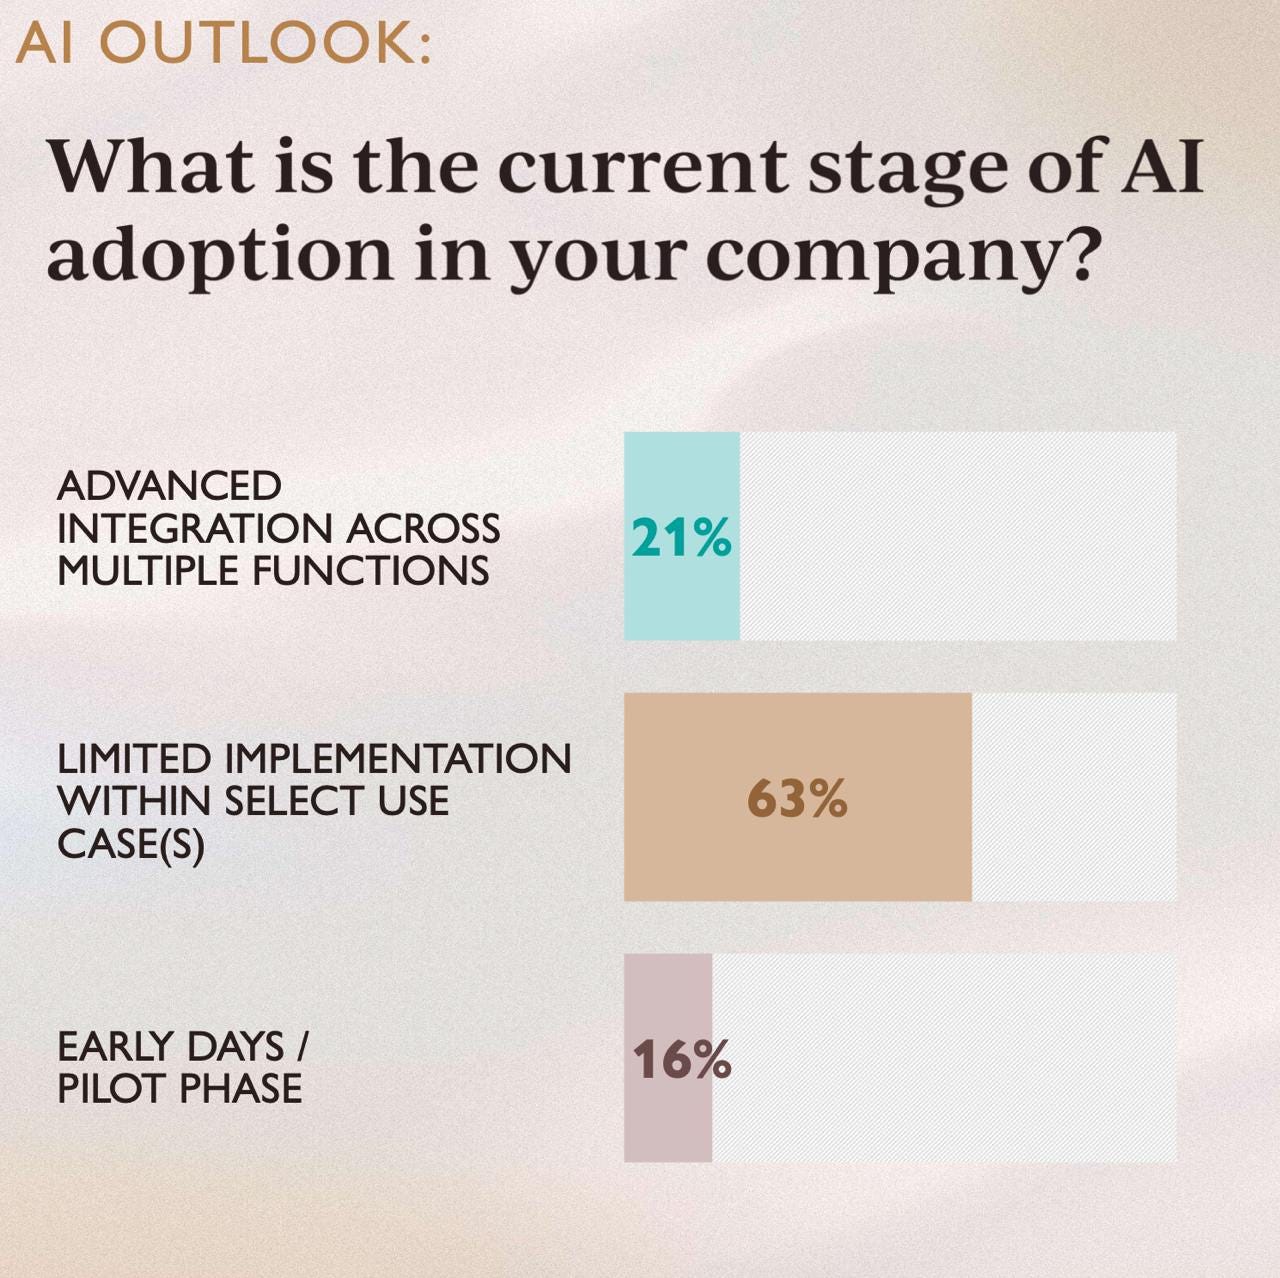
Working with AI
-
21% of executives reported AI implementation across several teams. 63% apply it in rare cases. 16% either haven’t started integration or are conducting tests.
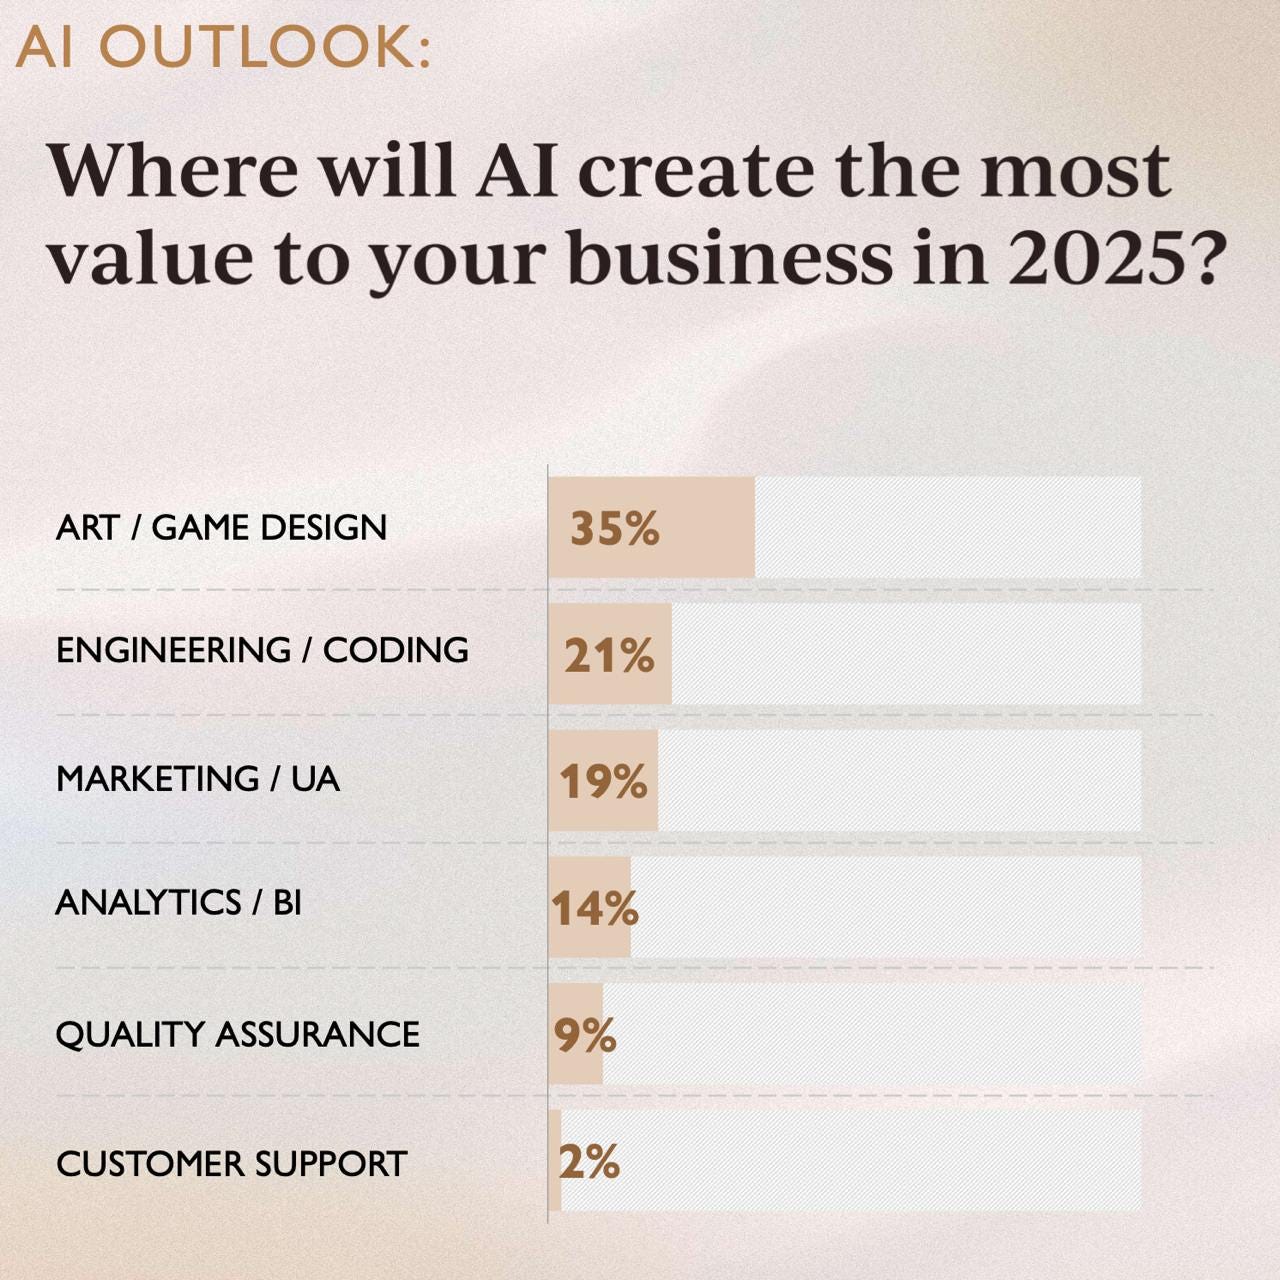
- AI finds the most application in creating art and game design documents (35%); in writing code (21%); in marketing (19%); in analytics (14%); in QA (9%) and in user support (2%).
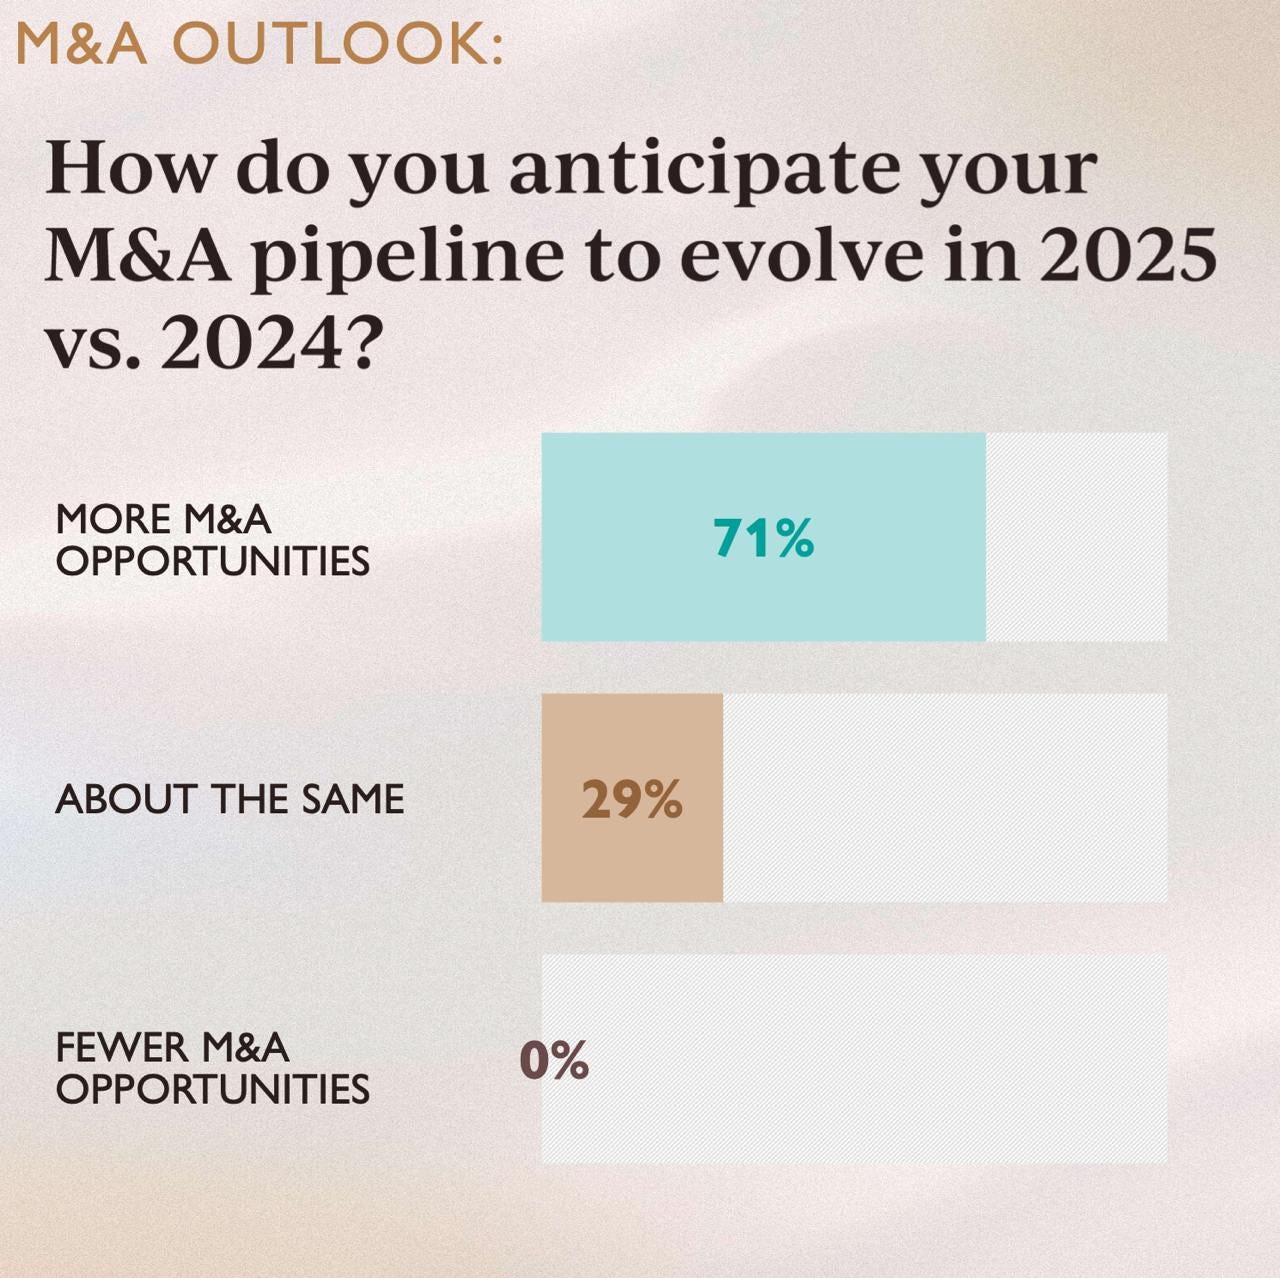
Investment Opportunities
-
71% of executives believe more M&A opportunities will emerge in the market in 2025. 29% think the market won’t change. No one said there would be fewer opportunities.
Sensor Tower: South Korean Market in H2'24

Overall Market Condition
- The second half of 2024 results in dollars were slightly worse than in the second half of 2023, but not significantly. Considering the exchange rate (the Korean won began to weaken against the dollar in September), revenue in the national currency may be in the positive zone.
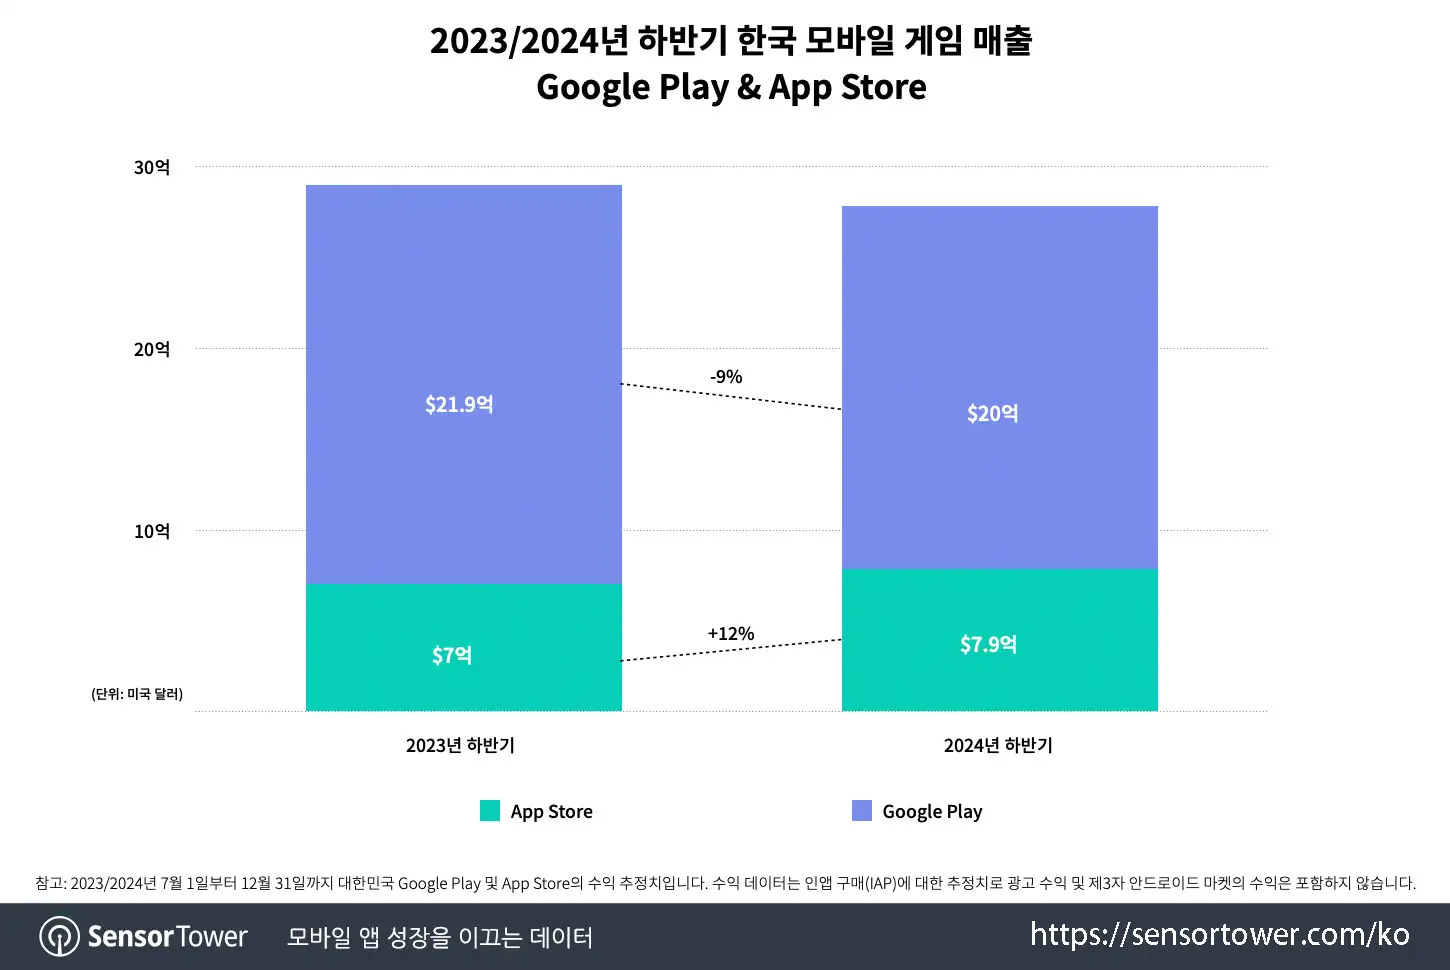
- Android accounted for 71.8% of all revenue; iOS - 28.2%. Compared to the previous year, Android's share decreased by 9%, while iOS increased by 12%.
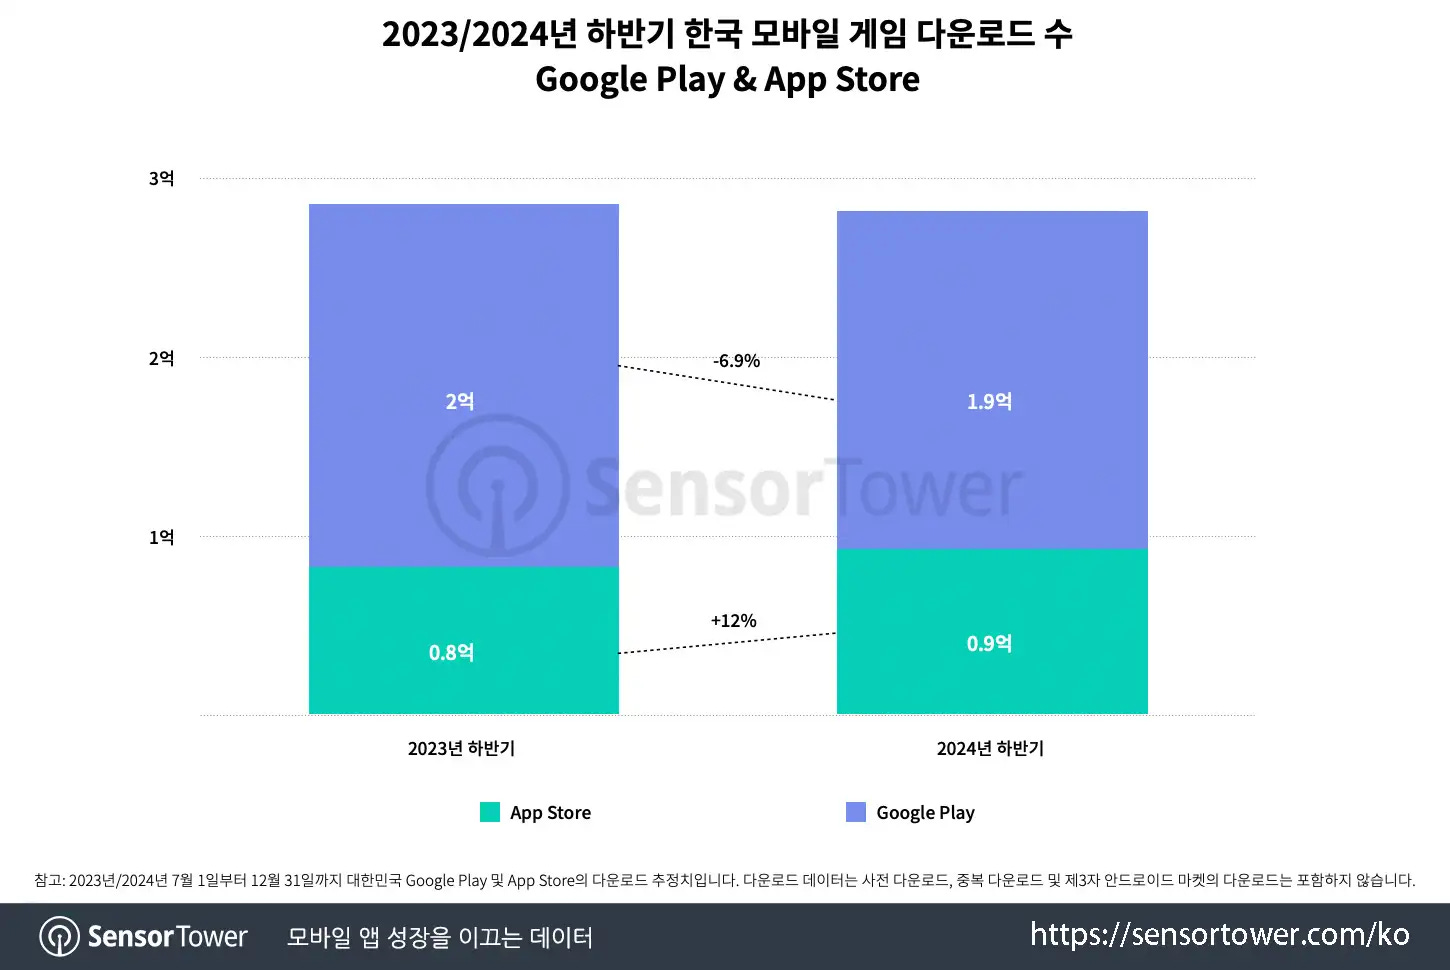
- In the second half of 2024, Koreans downloaded 280 million games - slightly less than in the same period of 2023. The share of Android downloads fell by 6.9%, while the share of iOS installations increased by 12%. The trend of strengthening iOS positions continues throughout 2024.
Most Successful Games in the H2’24
- Lineage M returned to first place in revenue (in August 2024, the game earned a record $45 million, thanks to events for the 7th anniversary), and Last War: Survival is in second place.
- Road Nine from Smilegate is the only newcomer in the revenue chart for the second half of the year in the South Korean market. The game took 5th place.
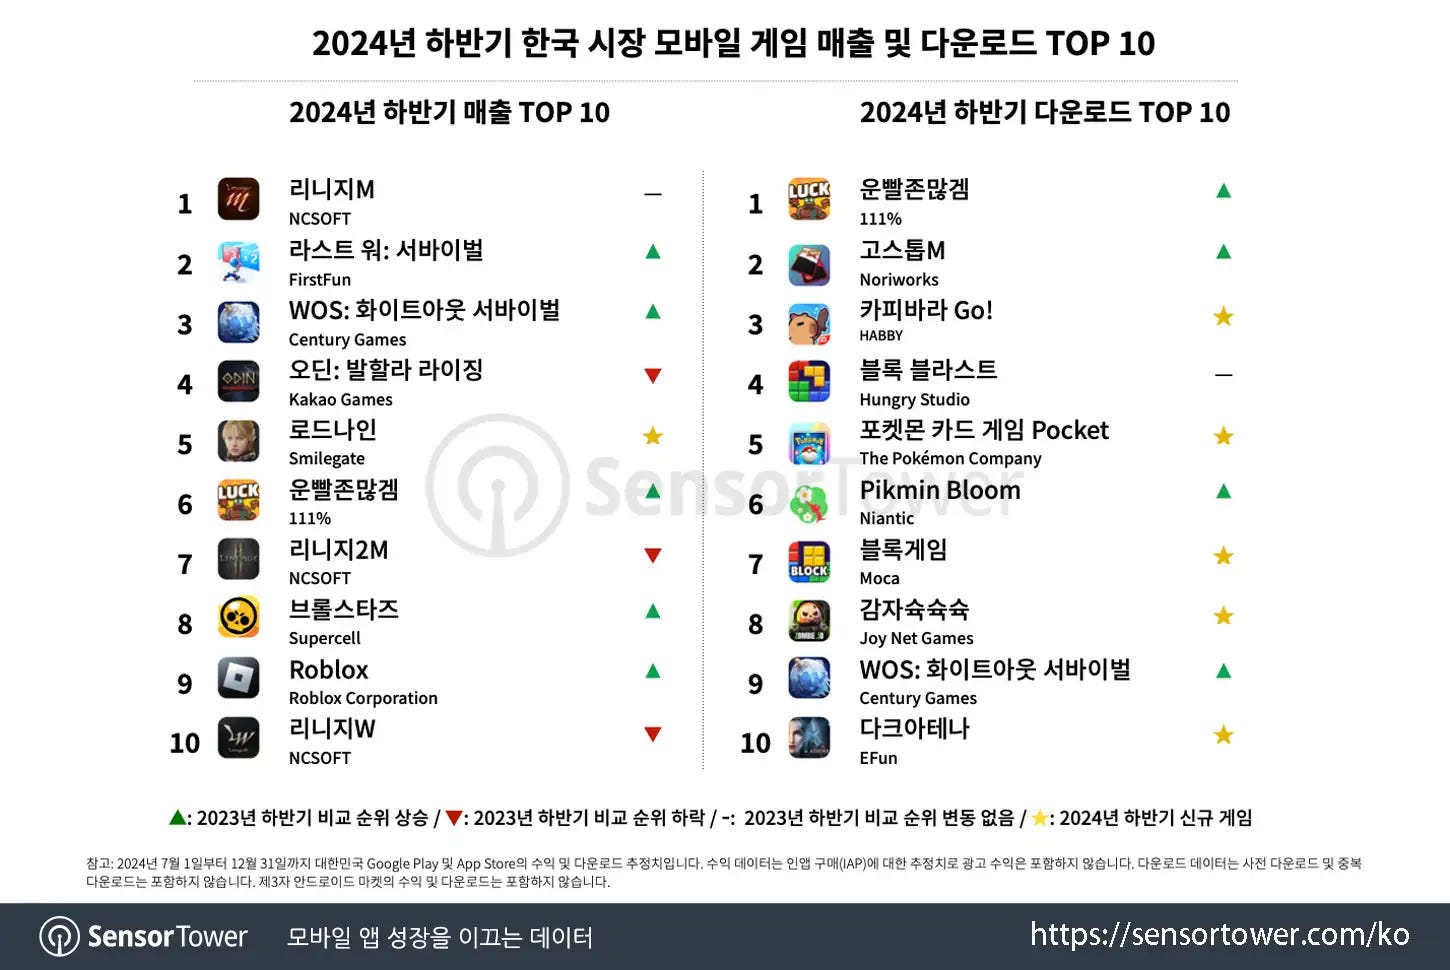
- There is significantly more movement in the download charts. Lucky Defense! by 111 percent, is in first place. GoStop 21 and Capybara Go! are also among the leaders in downloads. Among the new projects are Pokemon TCG Pocket, Block Game by Moca; Zombie.io - Potato Shooting by Joy Net Games, and Devil Athena: Dark Olympus by EFUN.
Leaders in Revenue and Download Growth
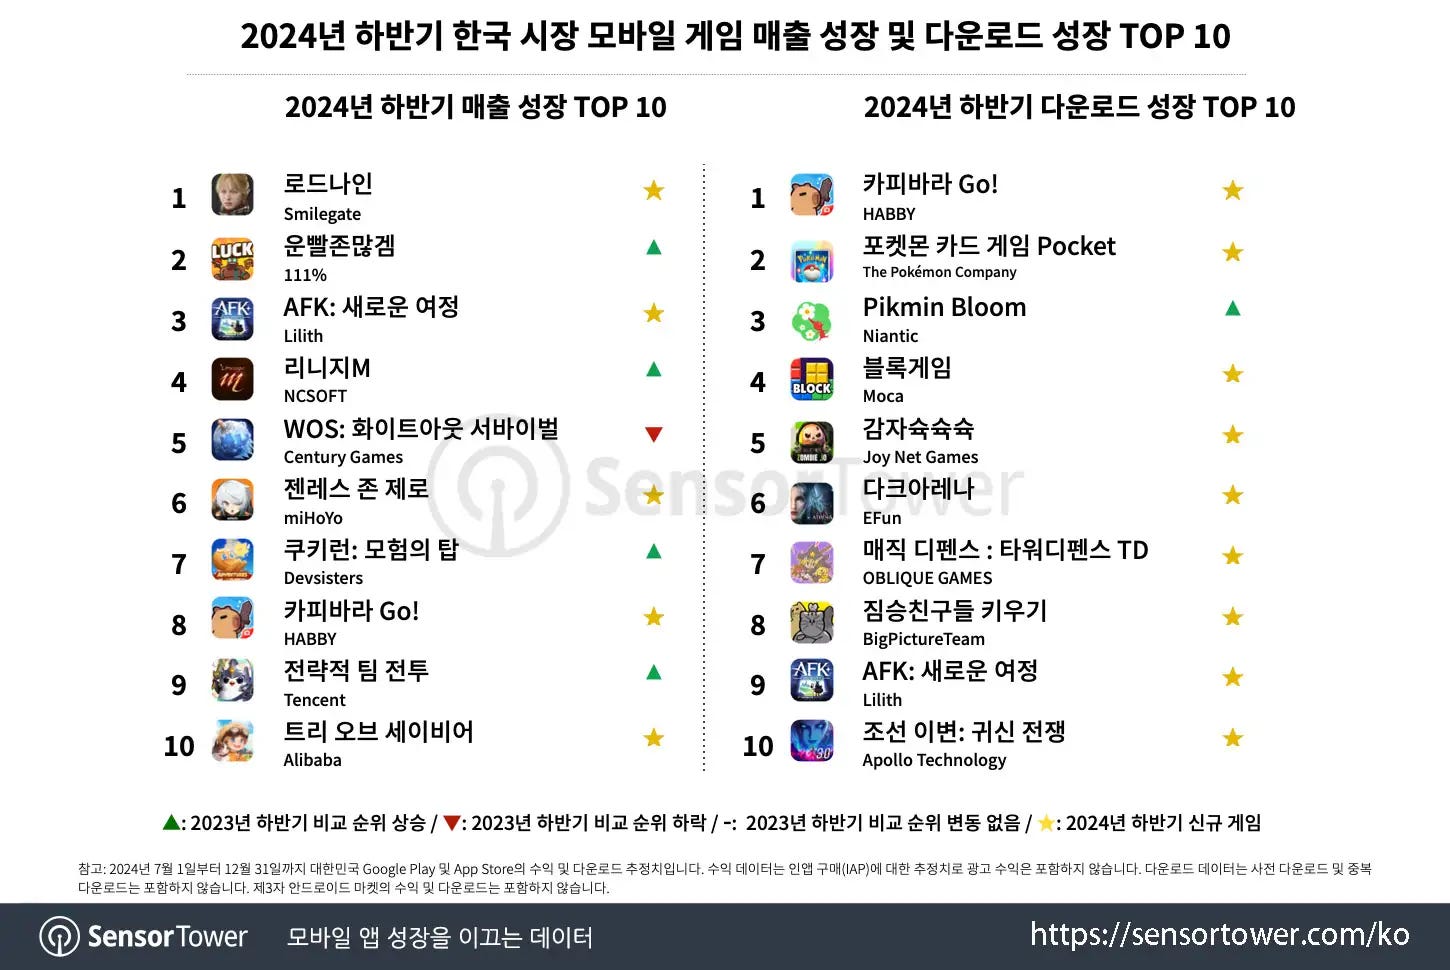
- Road Nine is the fastest-growing revenue project in the second half of 2024.
- The fastest dynamics in new downloads are for Capybara GO!; Pokemon TCG Pocket and Pikmin Bloom. Interestingly, the latter is the only non-new game that made it into the chart (it was released in October 2021).
Publisher Revenue Rankings
- NCSOFT is the most successful publisher by revenue in the second half of 2024. Success comes from Lineage 2M; Lineage W and Lineage M.
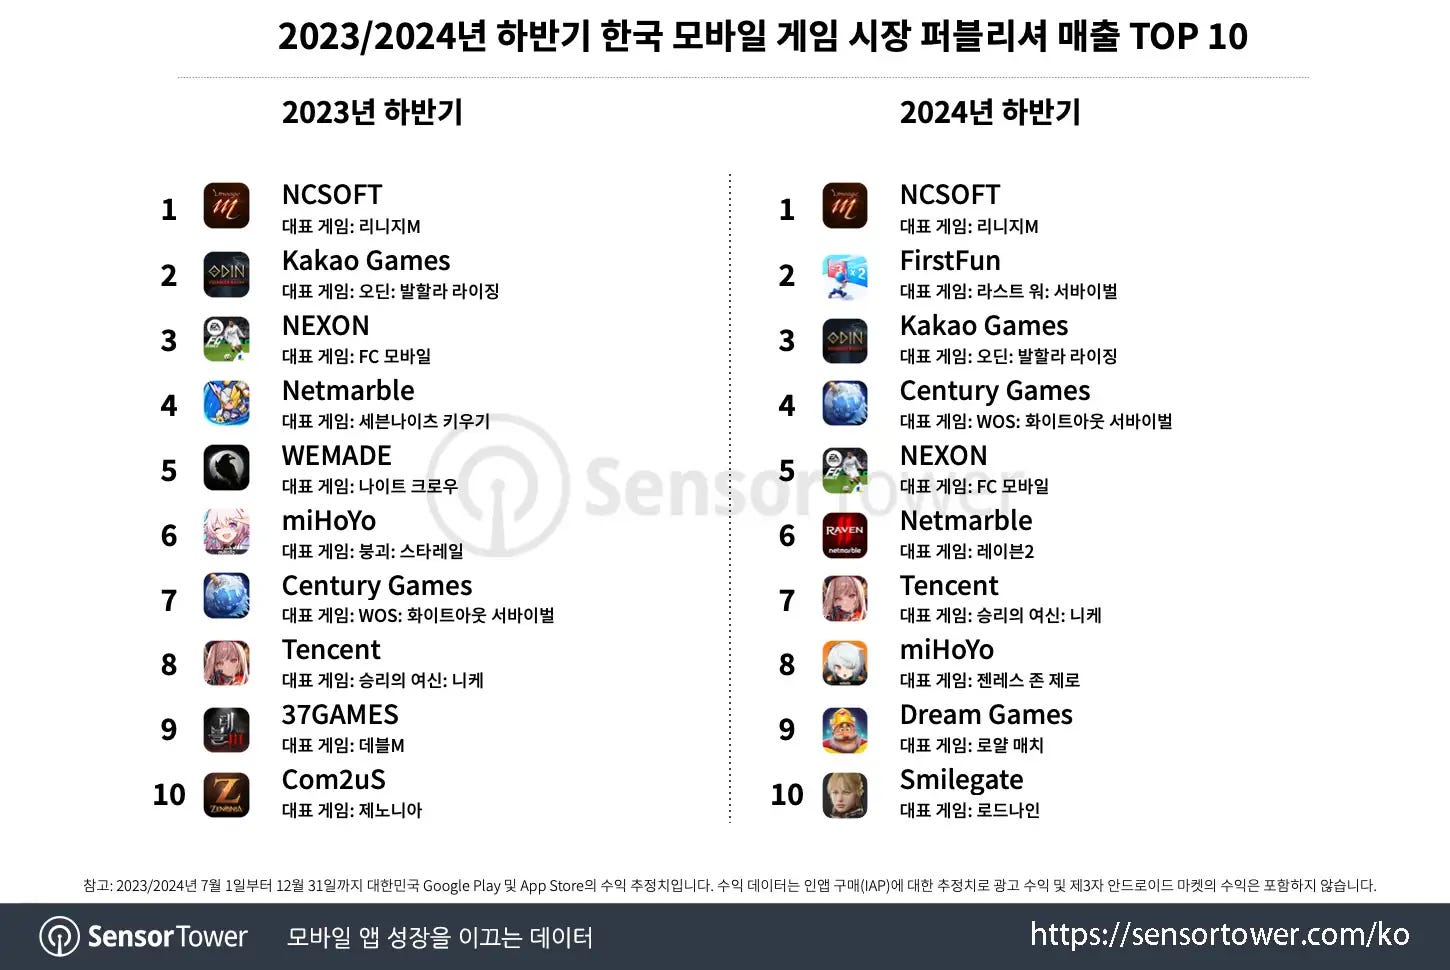
- For the first time since the first half of 2020, foreign publishers made it into the top 5. This time, there are two - FirstFun (Last War: Survival) in 2nd place and Century Games (Whiteout Survival) in 4th place. Both companies are based in China.
- Dream Games (Royal Match) made it into the top 10 for the first time, and Smilegate (Road Nine) returned after a 6-year break.
- Looking at the top 10, the list includes 5 Korean companies; 4 Chinese and 1 from Turkey.
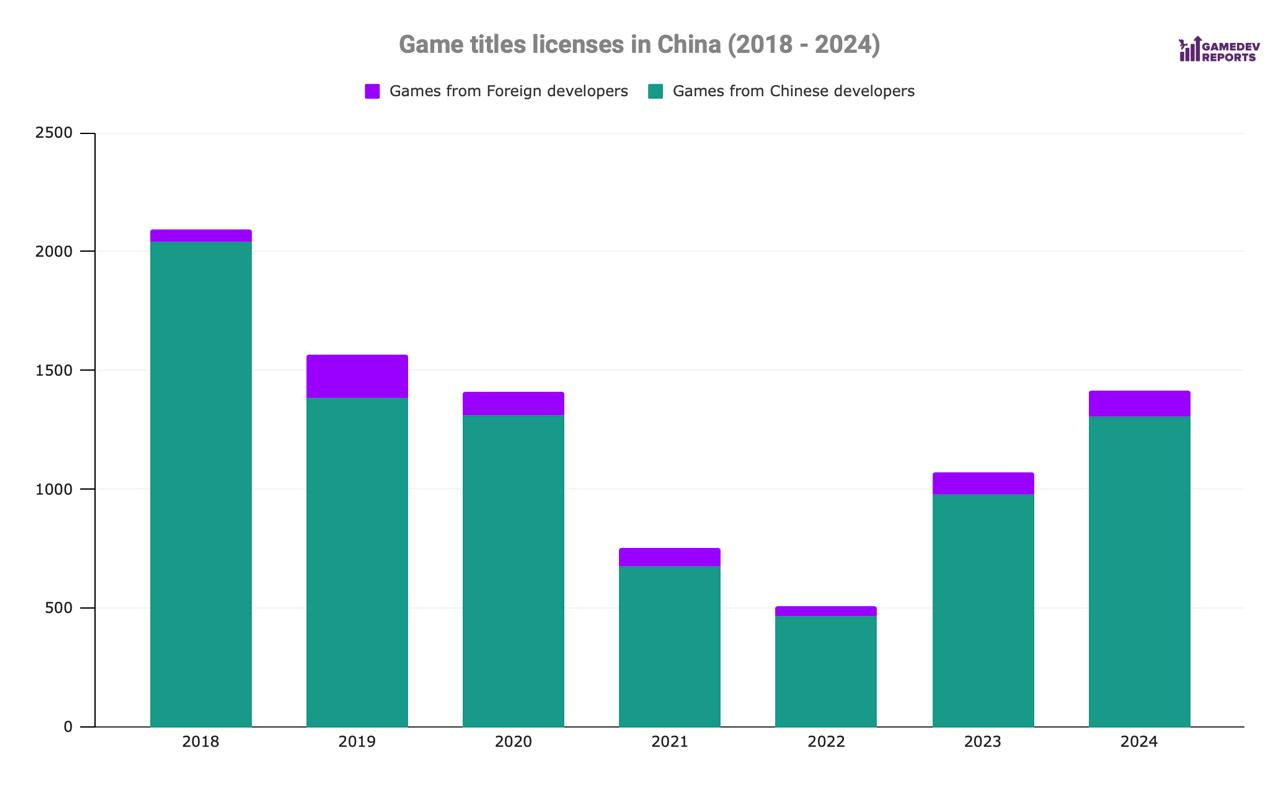
In 2024, China issued 1,416 game licenses - a record since 2019
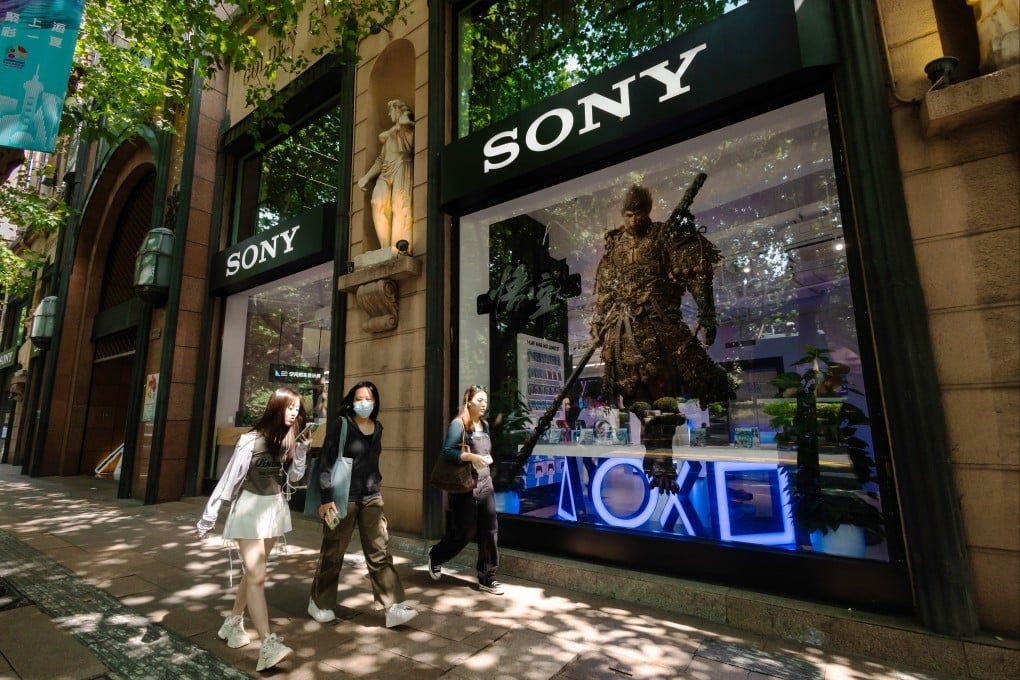
- Among the 1,416 licenses, 1,306 were issued for local projects (made by Chinese developers). Consequently, 110 licenses were given to foreign projects.
- In 2023, 1,075 licenses were issued (977 for local games; 98 for foreign); in 2022 - 512 (468 local games; 44 foreign); in 2021 - 755 (679 local games; 76 foreign); in 2020 - 1,411 (1,314 local games; 97 foreign); in 2019 - 1,570 licenses (1,385 local games; 185 foreign); in 2018 - 2,095 licenses (2,040 local; 55 foreign).
- China stopped issuing licenses in July 2021. Restrictions were lifted for local developers in April 2022 and for foreign developers in December 2022.
AppsFlyer: Mobile market trends in 2024

The report was prepared using data from over 35,000 apps. The total number of analyzed installations is 140 billion; and re-marketing conversions - 53 billion.
UA spending
- Overall UA spending in 2024 increased by 5% to $65 billion. The market is recovering after a 6% decline in 2023.
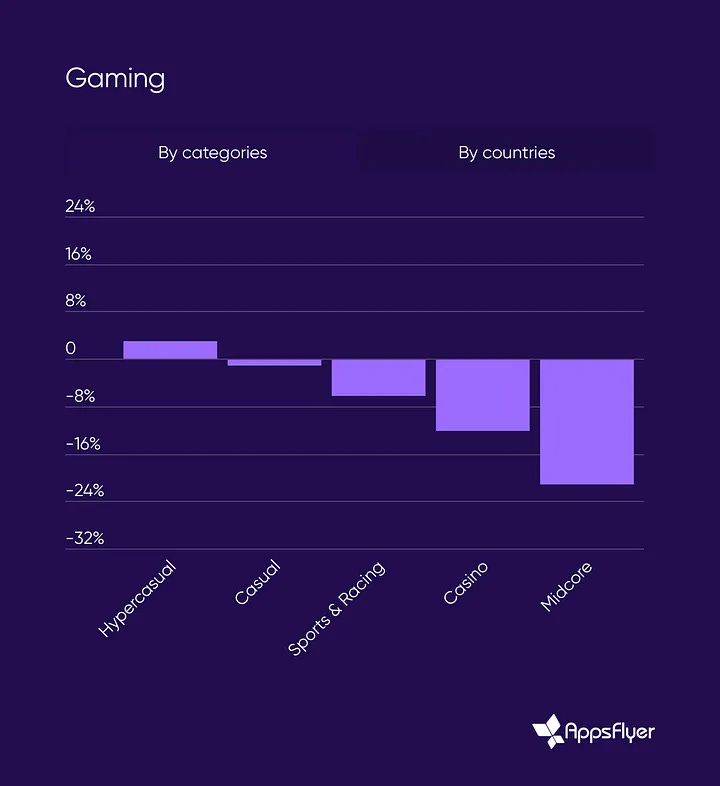
- However, there’s no good news for games. Spend on non-gaming apps increased by 8% while spend on gaming apps fell by 7%.
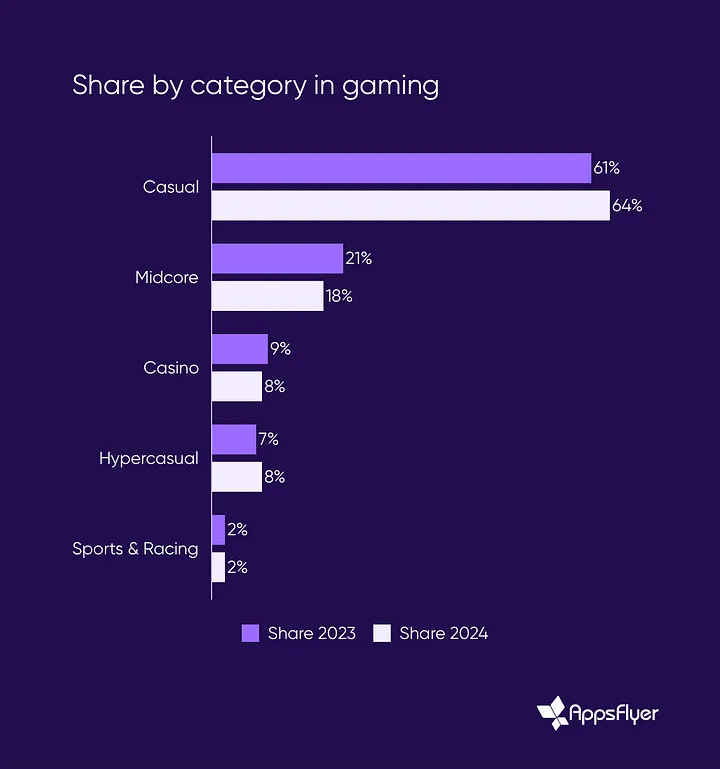
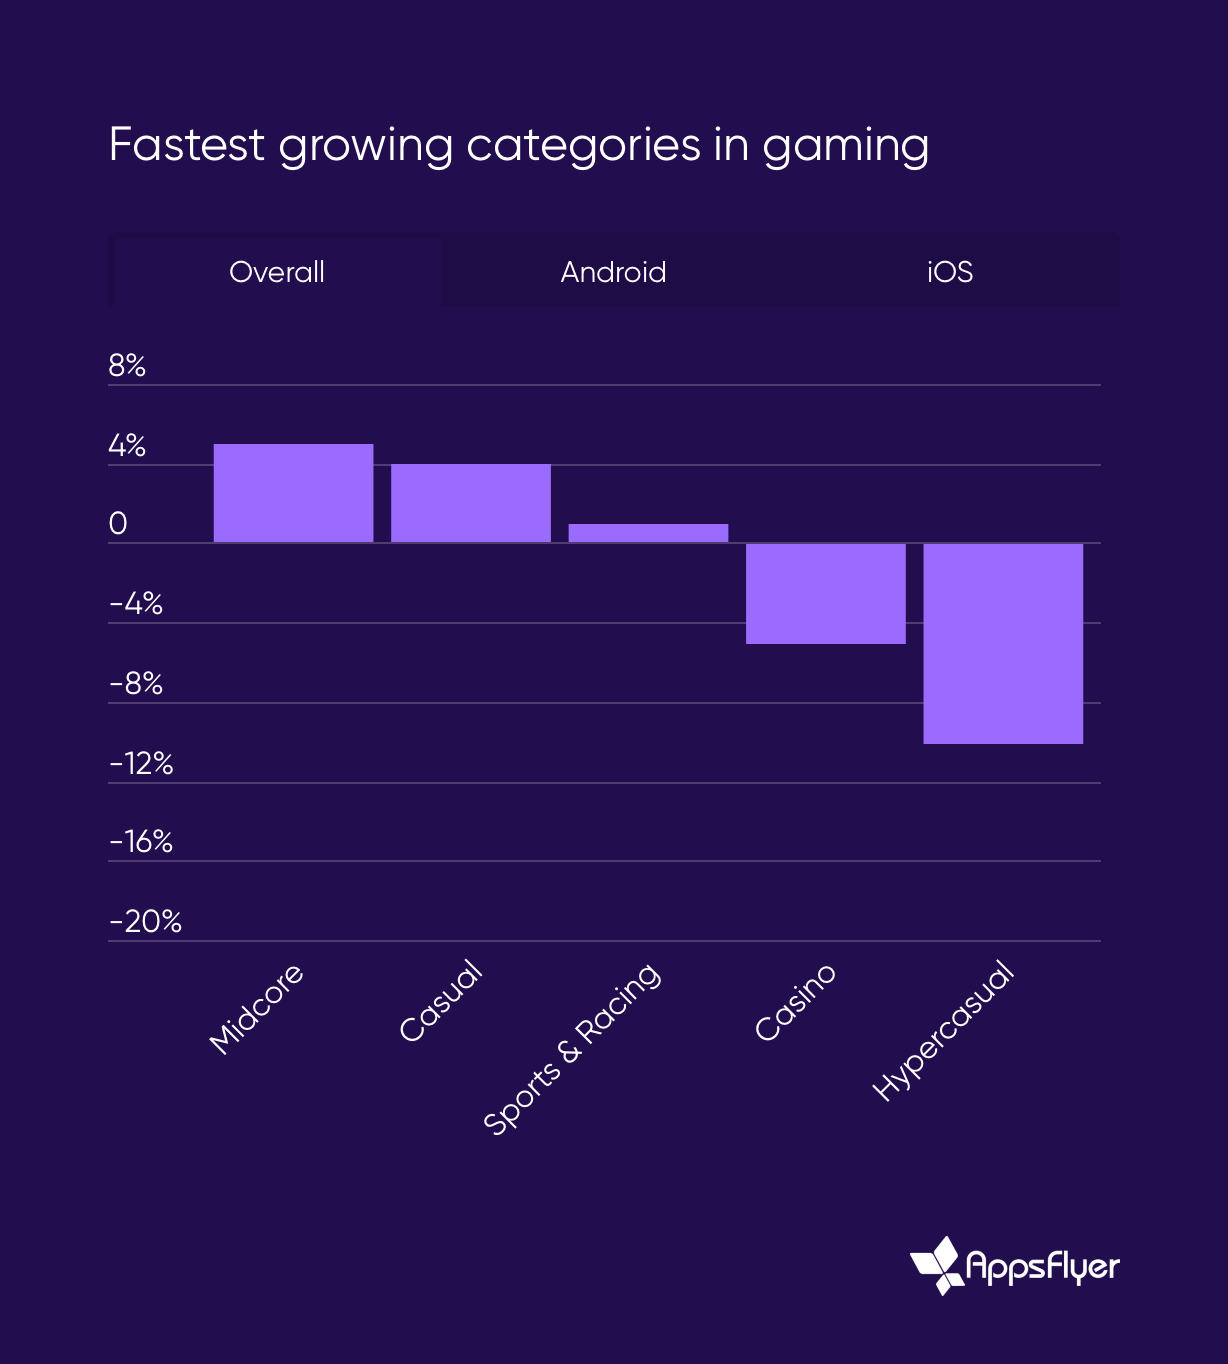
- In the volume of gaming spending, the share of casual projects increased from 61% to 64%. The volume of UA on mid-core games (-21% YoY, share in total spend fell to 18%) and social casinos (-12% YoY, share in total spending fell to 8%) significantly decreased.
- The number of attracted paid users increased in sports and racing projects (by 18% YoY), casual games (+14% YoY), mid-core projects (+6% YoY).
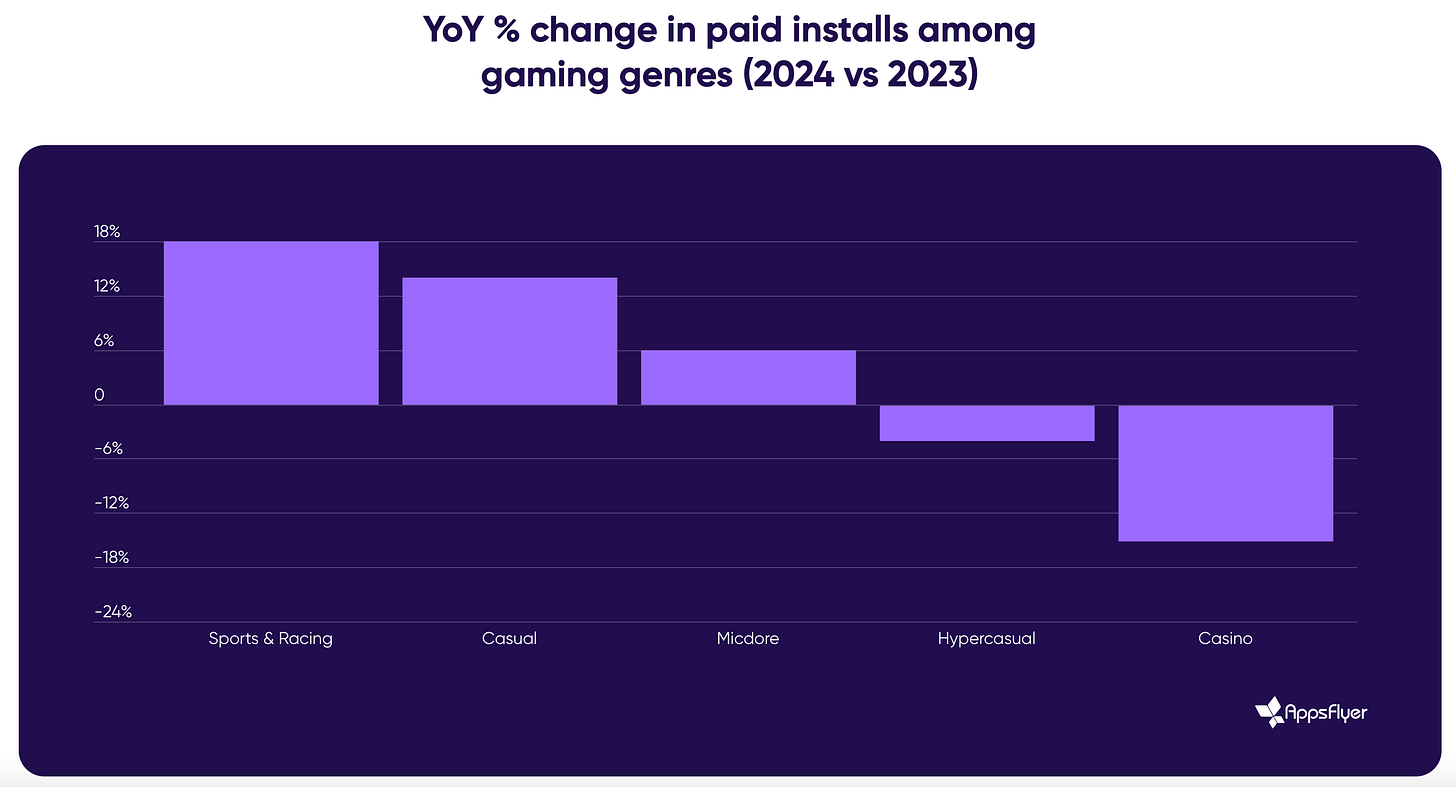
❗️AppsFlyer notes that due to the decrease in CPI, the mid-core genre, for example, managed to attract more users while spending less money.
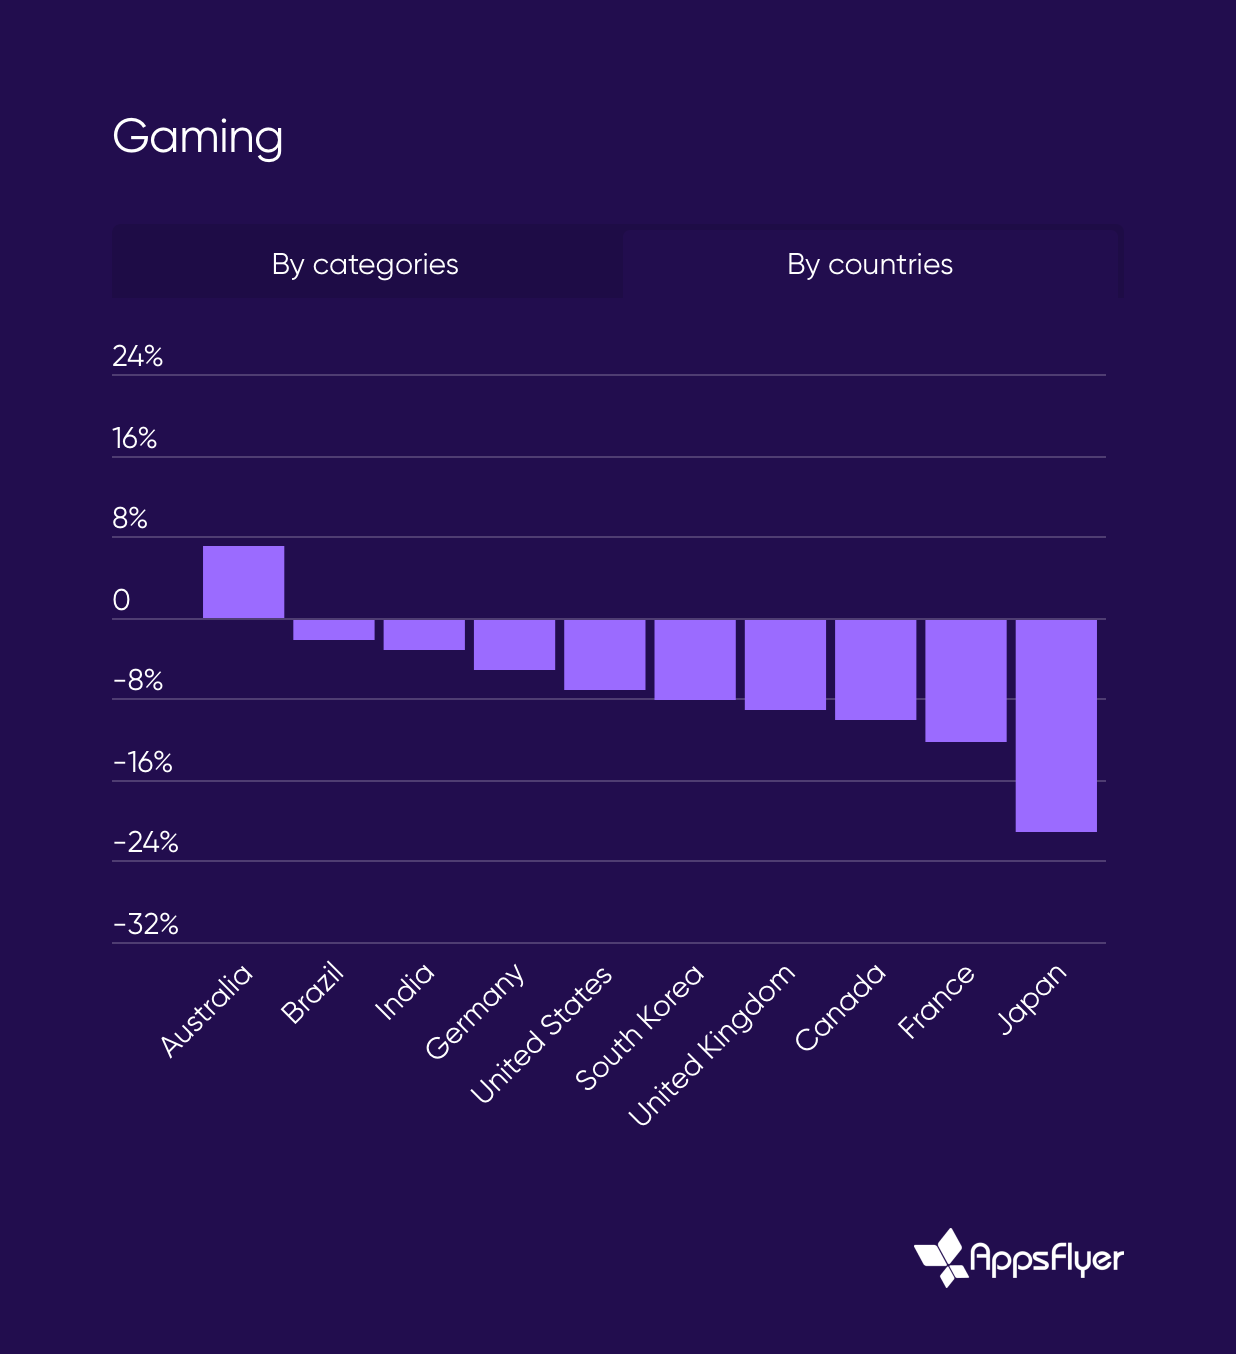
- Looking at the regional breakdown, a decline is observed worldwide. This has affected developed countries the most.
- AppsFlyer reports that the UA by non-gaming apps in “gaming” ad networks (such as Unity Ads) increased by 38% in 2024, while investments from gaming companies in these networks fell by 19%. Games still dominate in terms of purchase volume, but the trend is interesting.
Revenue
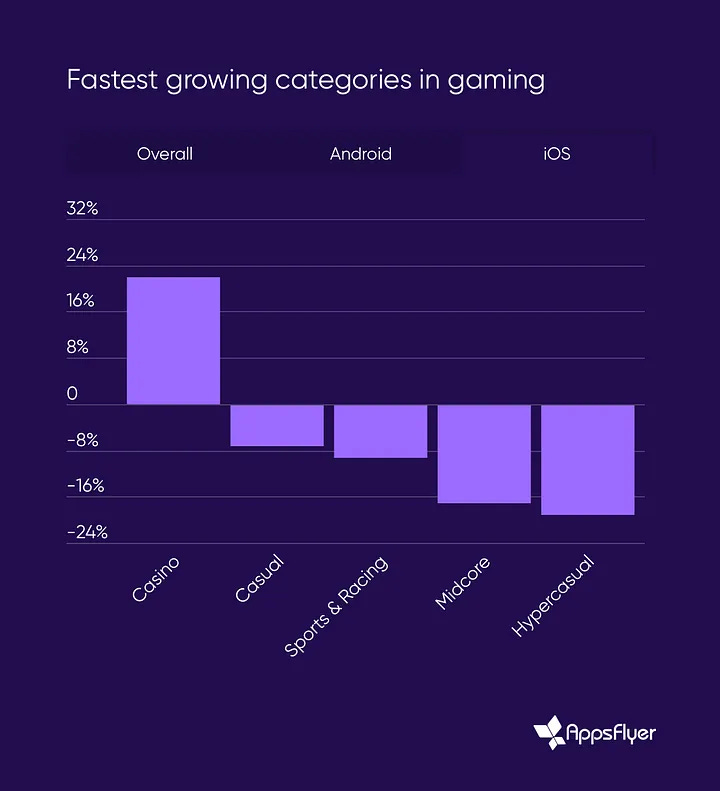
- Non-gaming apps grew by almost 20% in IAP revenue in 2024. Among gaming apps, social casinos showed growth (+4% YoY), while mid-core projects fell by 2% YoY, and casual apps’ revenue fell even more (-5% YoY).
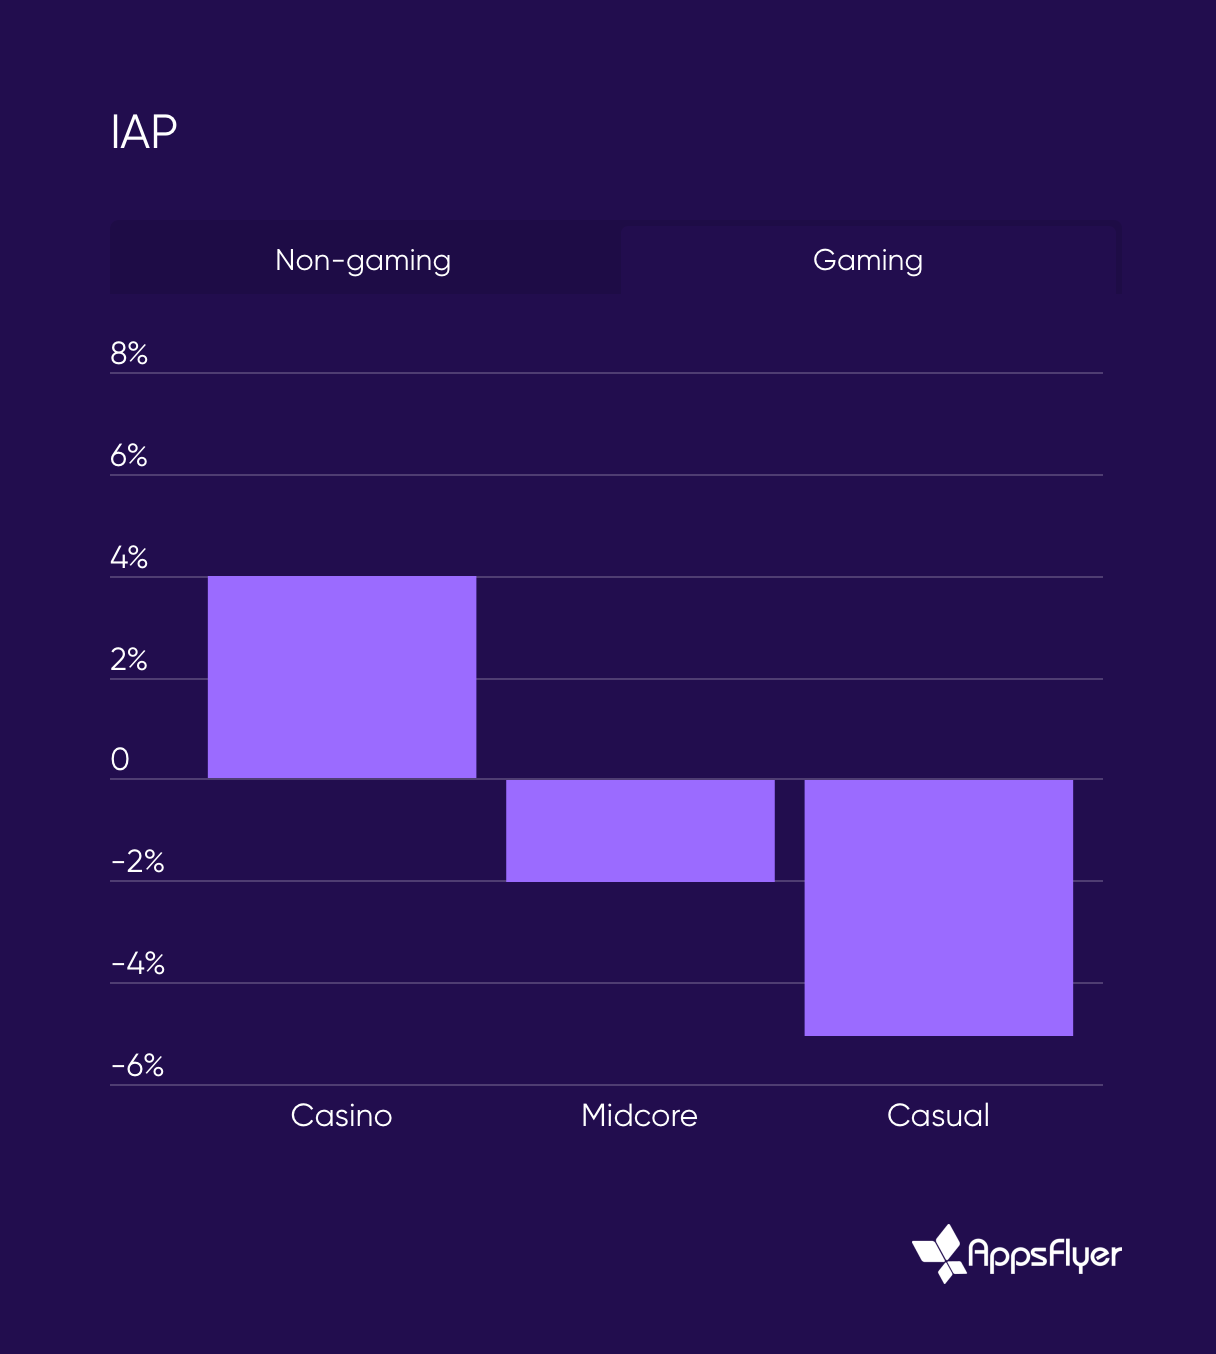
❗️The report doesn’t mention whether web shops were taken into account.
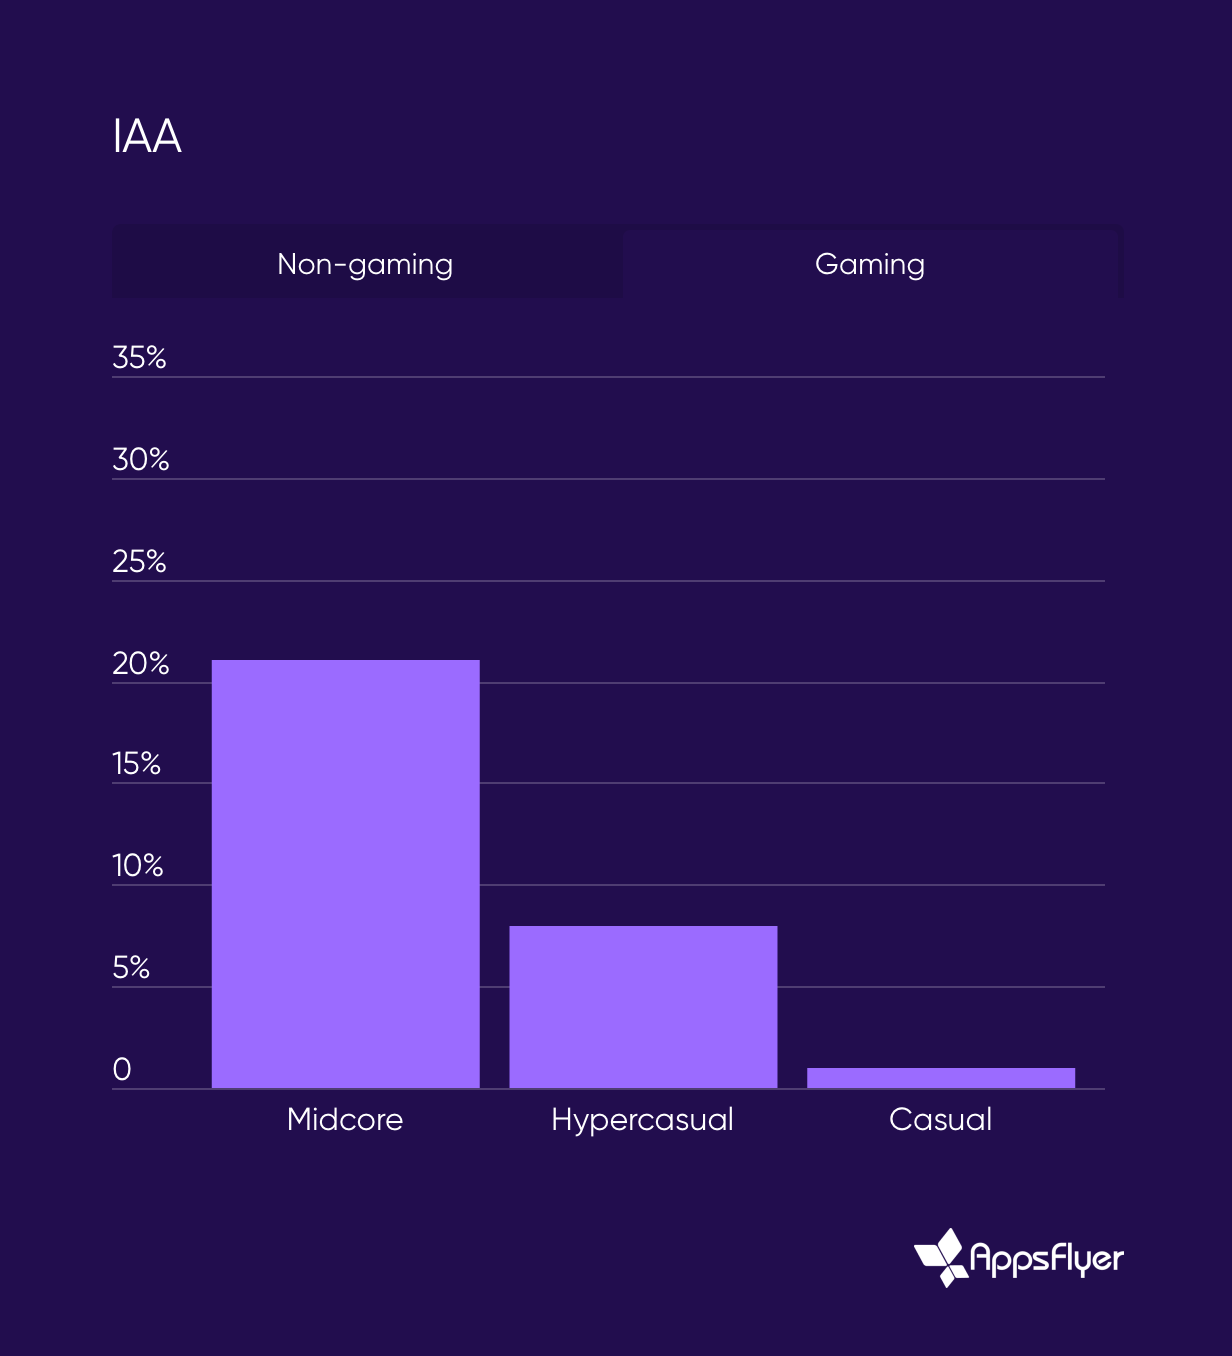
- Advertising revenue is growing in both non-gaming (+26% YoY) and gaming (+7% YoY) segments. Advertising revenue grew the most in mid-core projects, by 21% compared to the previous year.
Downloads
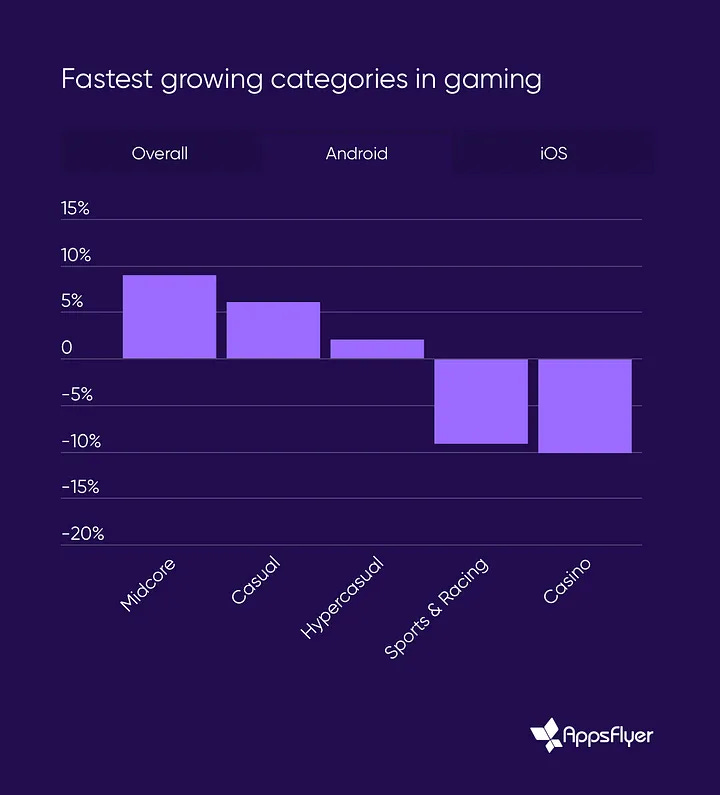
- The number of installs increased by 5% in mid-core genres, by 4% in casual, and by 1% in sports and racing projects. The number of users decreased by 5% in social casinos and by 10% in hypercasual projects. All compared to 2023.
- The picture differs on Android and iOS. On Android, mid-core projects grew in downloads (+9% YoY), casual games (+6% YoY), and the hypercasual segment (+2% YoY). On iOS, only social casinos have a positive balance (growth of 22% compared to the previous year).
Creative Production
-
In 2024, the number of creatives produced increased by 40%. Among the largest apps (with revenue over $1 million per month), the number of monthly creatives nearly doubled.
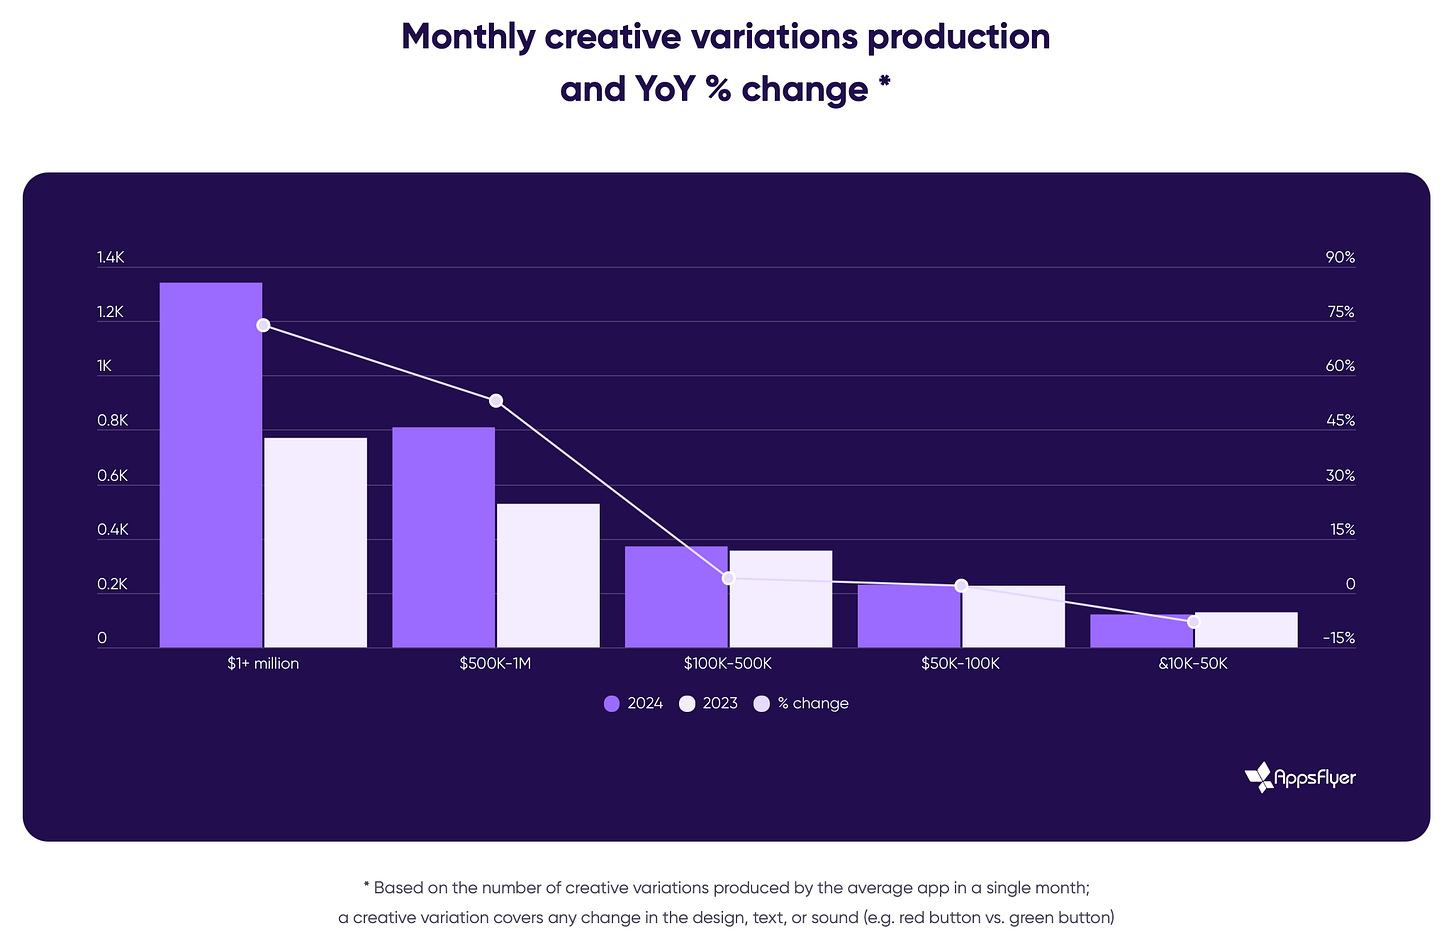
❗️This includes all versions of creatives, including those where only the icon color is changed.
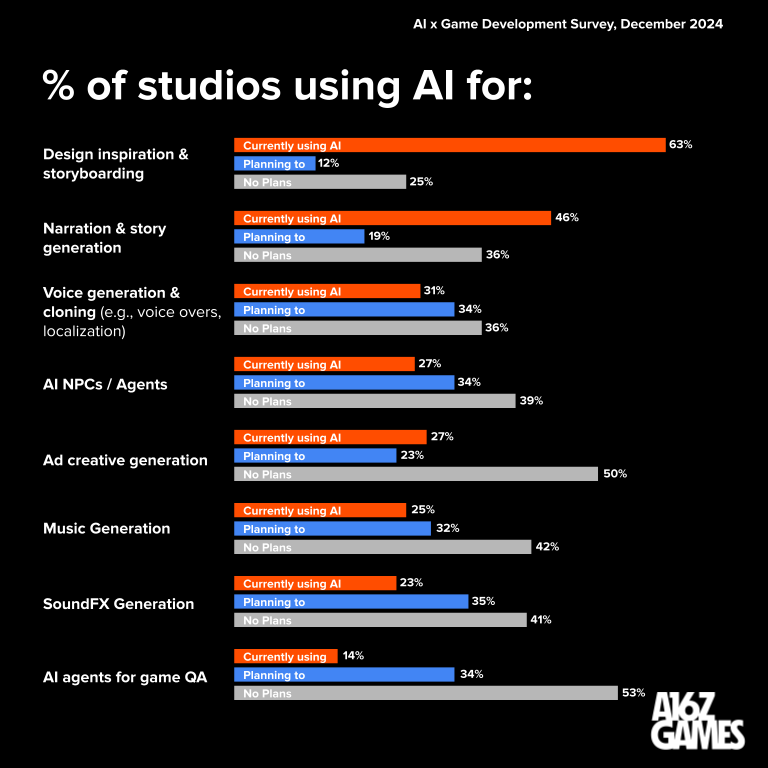
A16Z Games: Use of AI in Gaming in 2024

The company surveyed 651 employees from game industry companies of various sizes. 84% of respondents work in teams of fewer than 20 people.
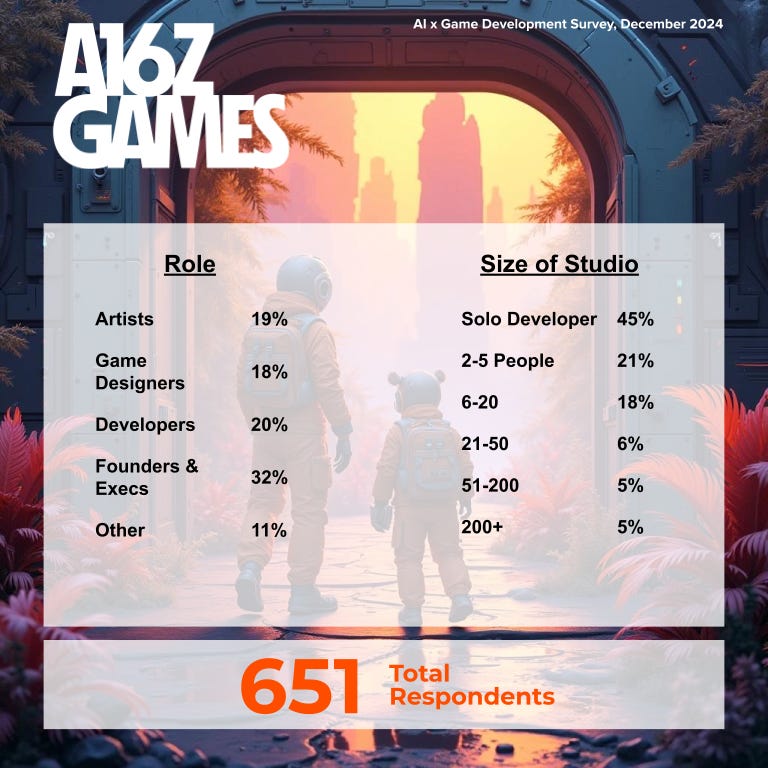
- 73% of game studios are already using AI in their processes. 88% plan to do so in the future. A16Z Games notes that company founders are the most positively inclined (85% reported using AI), while artists are the most cautious (58% use AI).
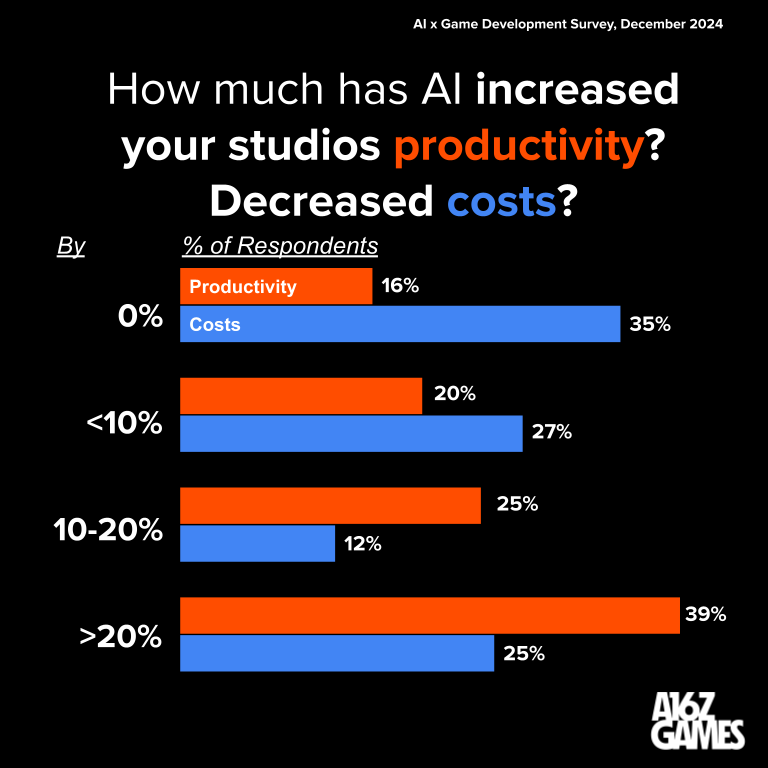
- The majority of studios saw both increased productivity and reduced costs after integrating AI. However, some were unsuccessful - 16% of respondents did not notice productivity growth, and 35% did not see cost reductions.
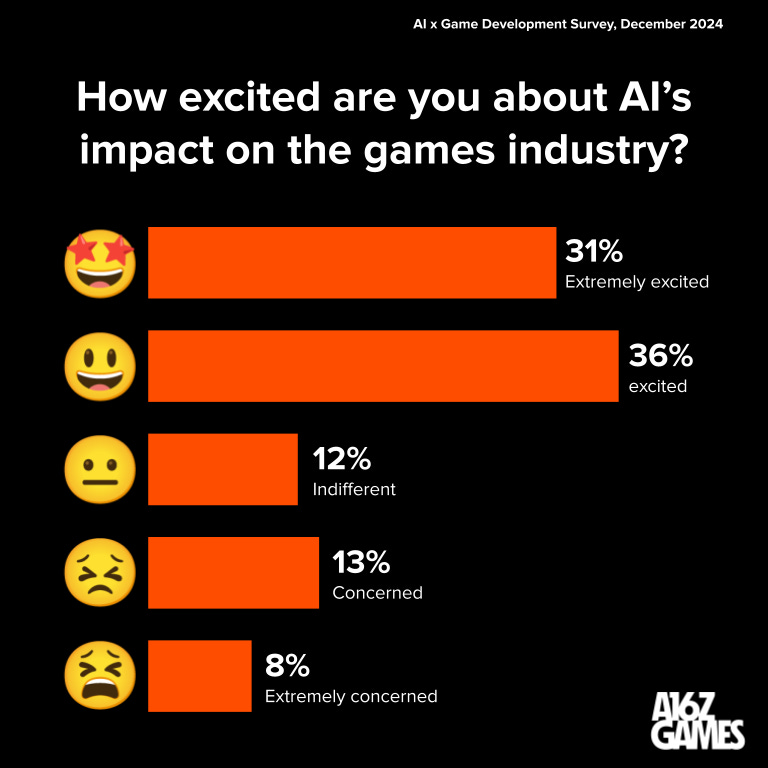
- 67% of respondents are interested in AI. Among artists, there is the highest proportion of those who view the new technology negatively (27%).
- Some people believe AI will destroy their jobs. 36% of artists consider the technology a threat to themselves; 24% of game designers and programmers feel threatened. Company founders are the least concerned, with only 15% feeling AI will replace their jobs.
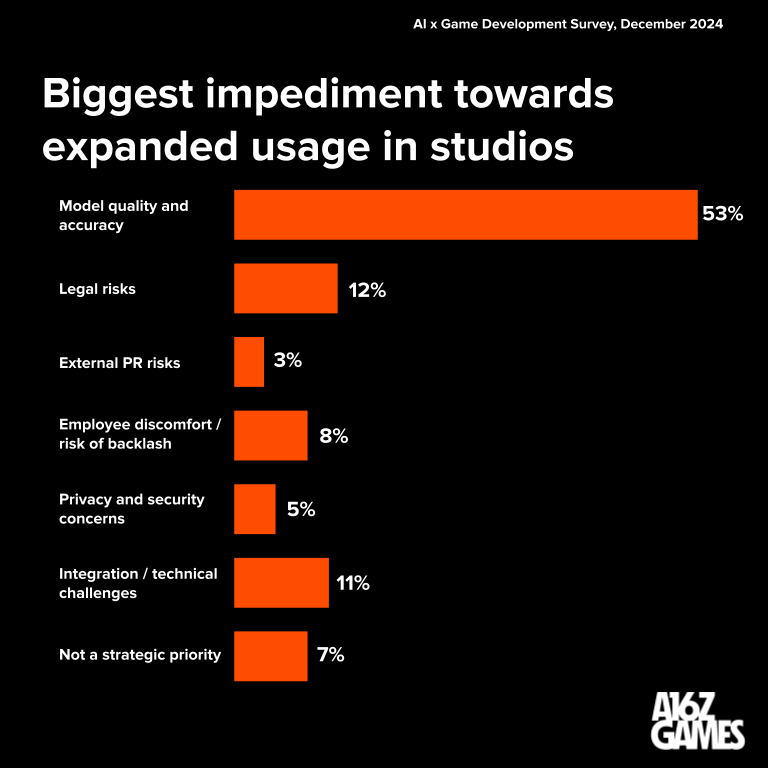
- The main problems companies face when integrating AI into their processes are the quality and accuracy of models (53%); legal risks (12%); integration issues (11%); team members discomfort and risk of negative reactions (8%).
- 53% of respondents are exploring how to apply AI in real-time. This likely refers to AI-controlled NPCs.
- 54% of studios plan to work with their own models. This allows them to eliminate legal risks and increase the consistency of produced content.
- Currently, most AI application cases are in the early stages of development (pre-production, prototyping). AI is actively used in narrative, music and voice creation, and advertising creative production.
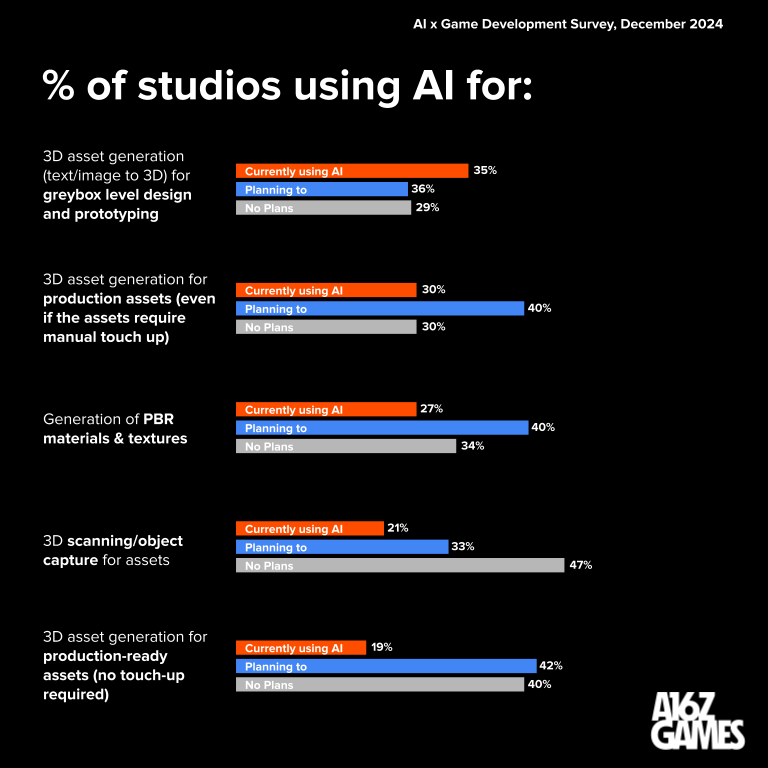
- 70% of respondents indicated that they either used or plan to use AI for generating 3D assets. Last year, only 48% reported this. It’s evident that there is industry demand for this.
- The ten most popular AI tools (or companies) among game developers are Claude, Flux, ChatGPT, Cursor, Eleven Labs, GitHub Co-pilot, Meshy, Midjourney, Stable Diffusion, and Suno.
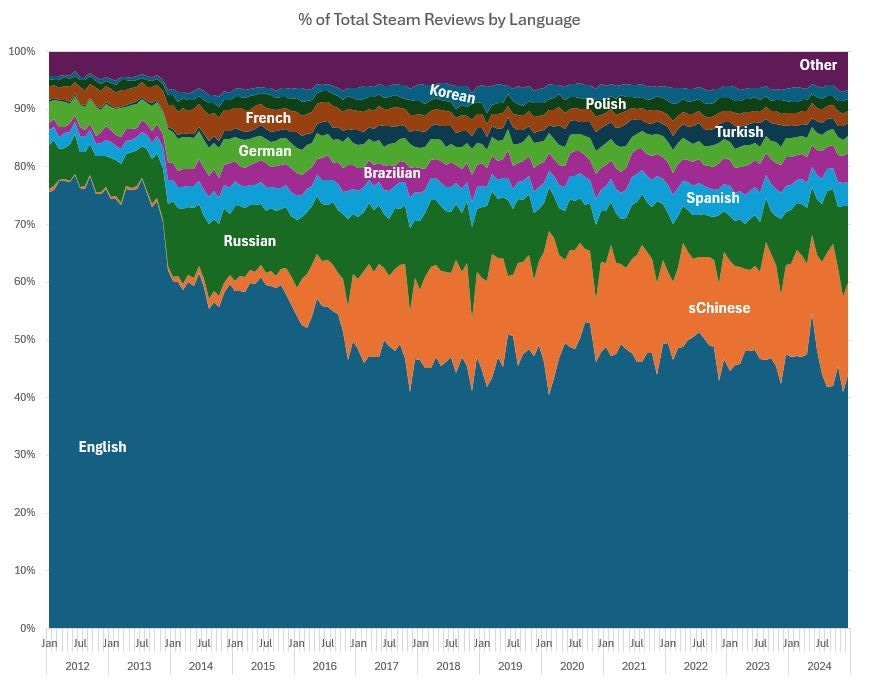
Steam reviews have become more negative over 5 years

The study was conducted by Will McCahill, director of World’s Edge studio (responsible for developing the Age of Empires series), which Microsoft owns.
- The percentage of positive reviews over the past 5 years has dropped from 90% to 84%. However, it cannot be said that users have become angrier - in 2018, positive reviews were at 83%.
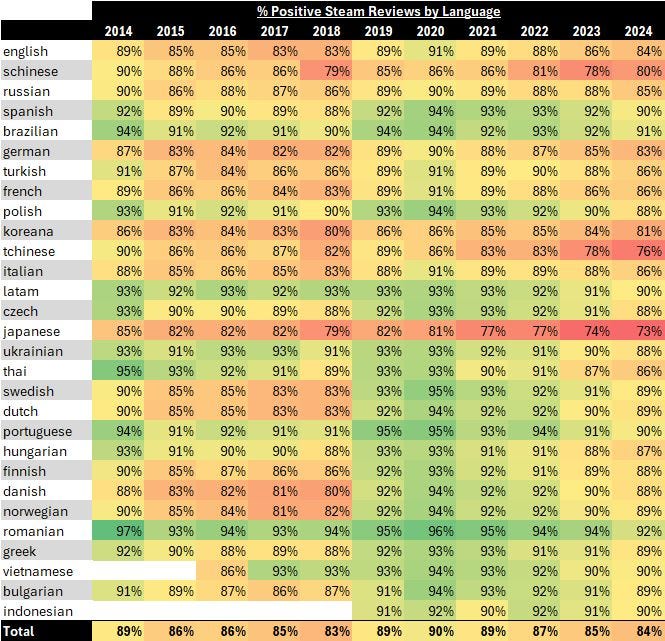
- The most positive reviews are published in Spanish, Portuguese, Romanian, Vietnamese, and Indonesian languages.
- The least positive reviews are published by users from Japan, China, and South Korea.
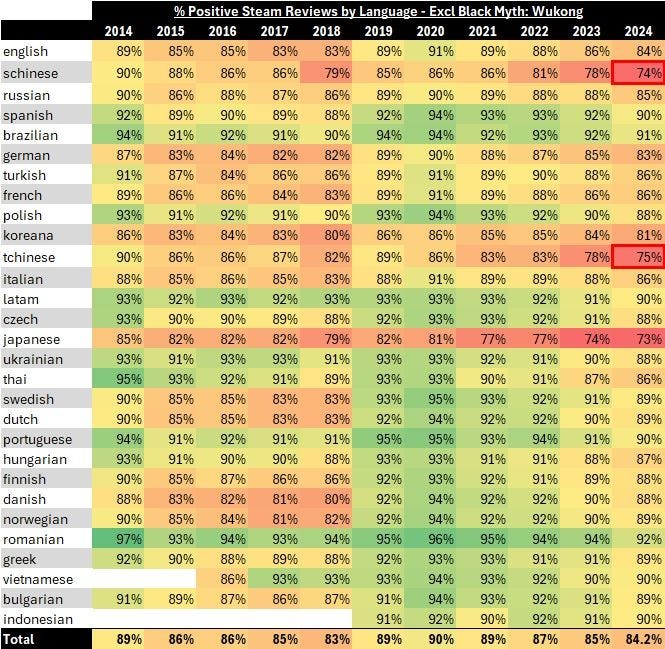
- Black Myth: Wukong accounts for about 30% of all positive reviews in Simplified Chinese on Steam (which is about 1 million reviews). If these are excluded from the overall picture, the share of positive reviews from Chinese players in Simplified Chinese decreases from 80% to 74%.
- The leading languages for reviews on Steam are English, Simplified Chinese, and Russian.
ERA: UK gaming market in 2024 fell behind the video market in size

ERA - Entertainment Retailers Association in the UK.
Overall state of the entertainment market
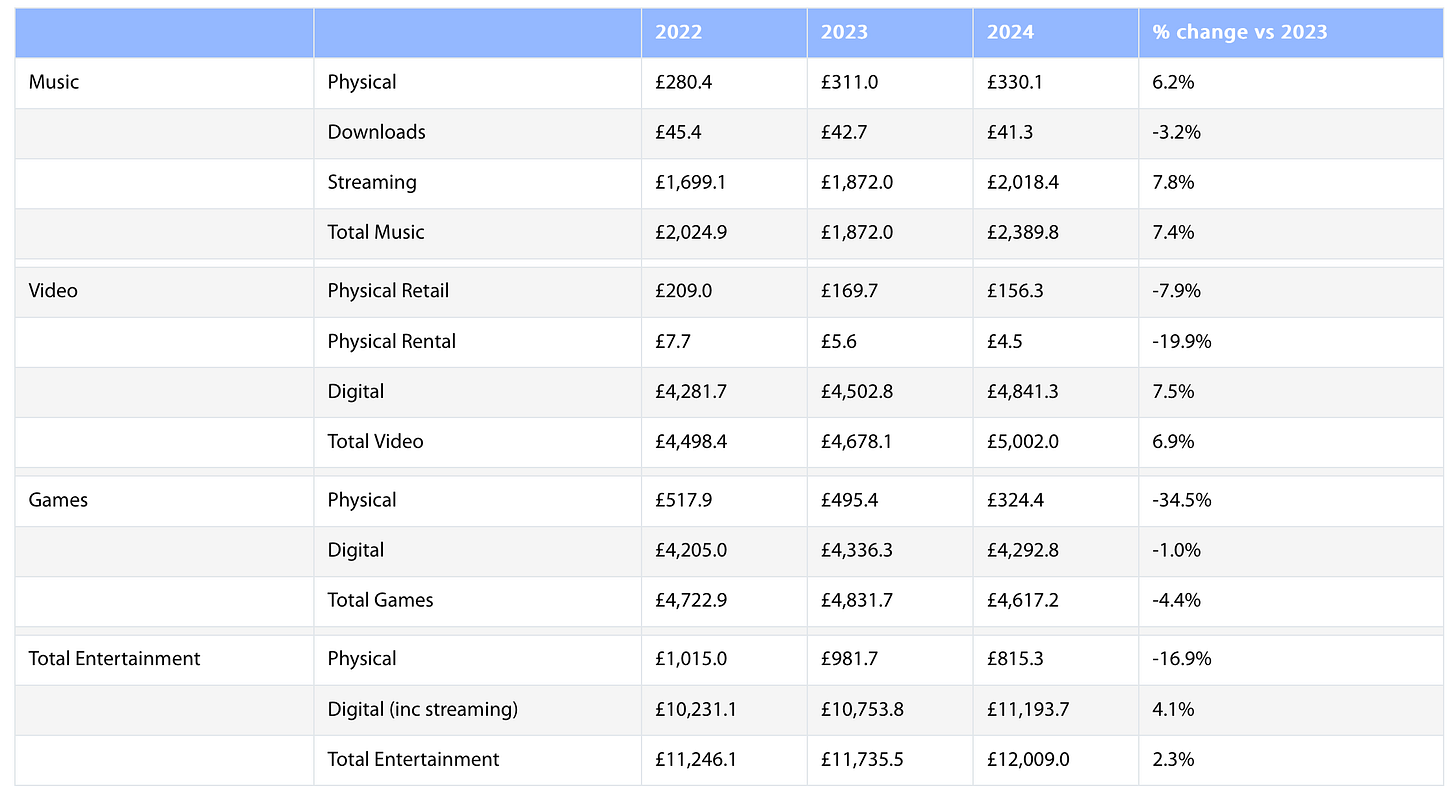
- The total volume of the music, film, streaming, TV series, and games market in 2024 exceeded £12 billion.
- The largest market segment is digital video (including subscriptions to Netflix, Amazon Prime Video, Apple TV, etc.), with a volume of £4.46 billion. Growth - by 8.3%. The total volume of the video market in the UK is just over £5 billion (growth of 6.9%). This is larger than the gaming market.
❗️It was reported that the video market had overtaken the gaming market in terms of volume based on the results of 2023. However, from the updated results table published this year, it’s clear that this only happened in 2024. It’s possible that the figures were adjusted.
- Interestingly, sales of physical copies of musical works increased by 6.2%. Overall, the music industry in the UK hasn’t generated this much revenue since the CD era.
UK Gaming Market
- The volume of the UK gaming market in 2024 decreased by 4.4% to £4.62 billion.
- Digital PC game sales fell by 5%, digital console game sales decreased by 15%, and physical copy game sales plummeted by 35%. Subscription services showed growth - by 12% compared to the previous year.
- The largest segment of the UK gaming market is mobile (£1.56 billion), which grew by 2.6% in 2024.
- The best-selling game of the year in the country is EA Sports FC 25. It was purchased 2.9 million times, with 80% of sales being digital copies.
Games for Nintendo have dominated the retail gaming market for the last 20 years in Japan

- According to 2024 results, 13 out of 15 best-selling retail games were for Nintendo Switch. The top three for 2024 are Super Mario Party Jamboree!; Dragon Quest III HD-2D Remake; and Mario Kart 8 Deluxe.
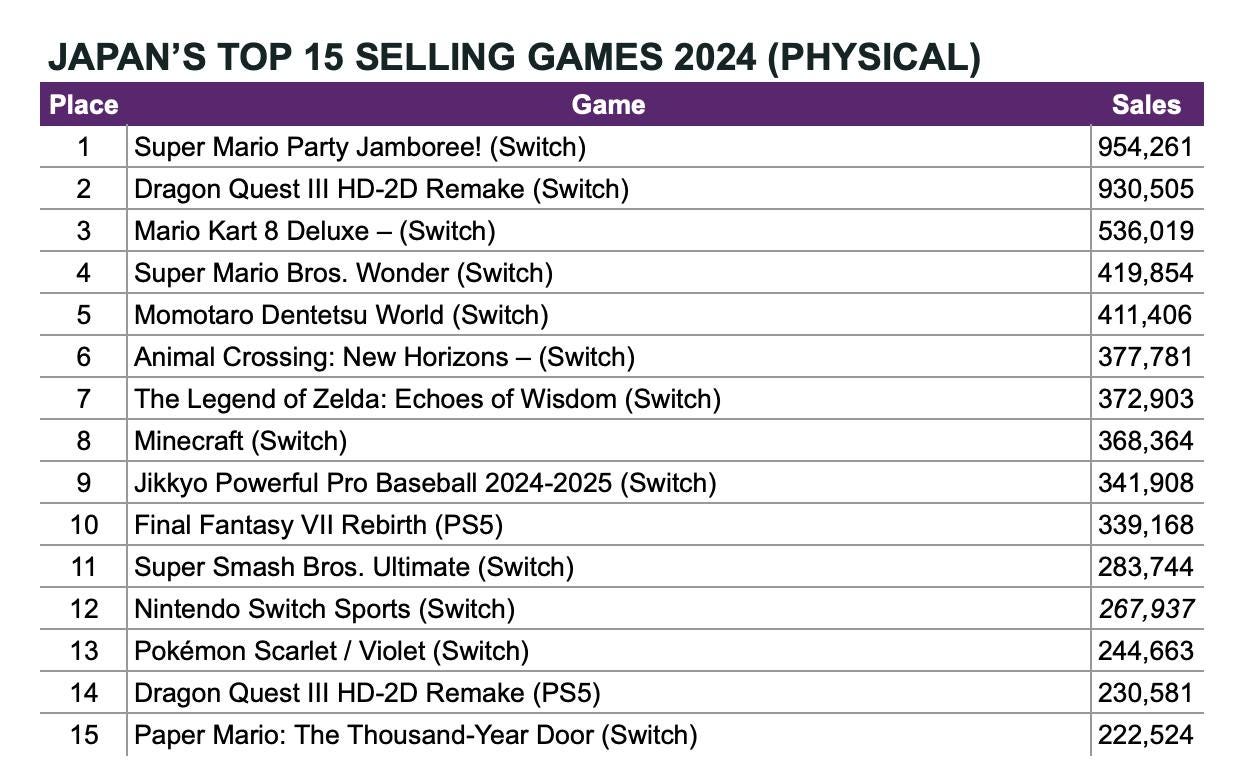
- Since 2005, most games in the year-end top 10 have been released on Nintendo consoles.
- A similar situation exists with consoles. Since 2005, Nintendo DS, Nintendo 3DS, and Nintendo Switch have led the console charts. In 2004, the best-selling system in Japan was the PlayStation 2.
- In 2024, Japanese consumers purchased over 3 million Nintendo Switch units; PlayStation 5 sold 1.4 million systems; and Xbox Series sold 118,000 units.
Stream Hatchet: Most popular launches on streaming platforms in 2023-2024
❗️Below is the analysis of the first 30 days after the project launch, and metrics on streaming platforms (Twitch, YouTube Gaming, Kick).
Leaders in Hours Watched
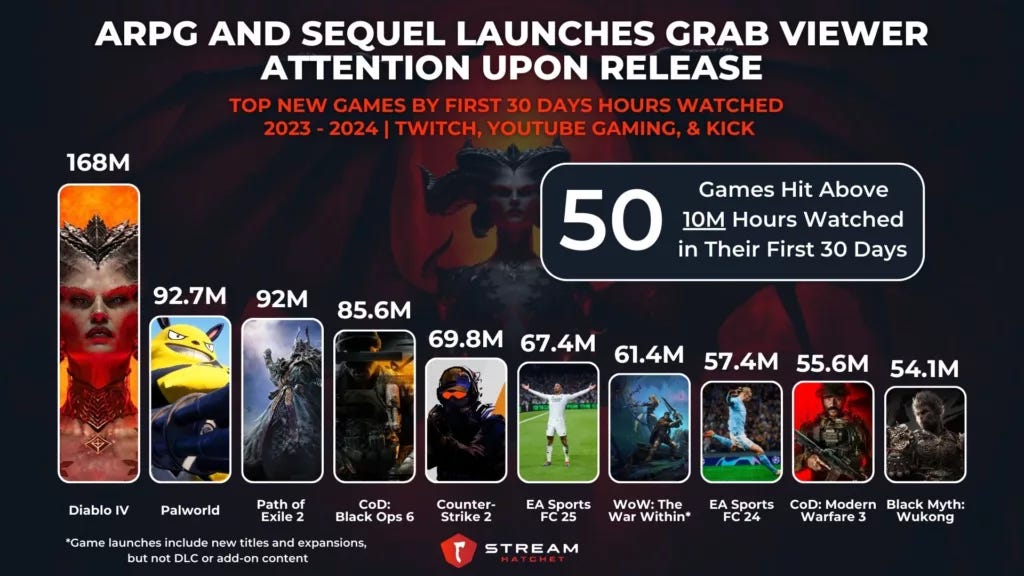
- Diablo IV (168 million hours in the first 30 days), Palworld (92.7 million hours), and Path of Exile 2 (92 million hours) are the leaders among new launches in the last 2 years.
- The Stream Hatchet team notes that the leaders are mainly continuations of already established franchises. The only exceptions are Palworld and Black Myth: Wukong.
Leaders in Viewership Growth
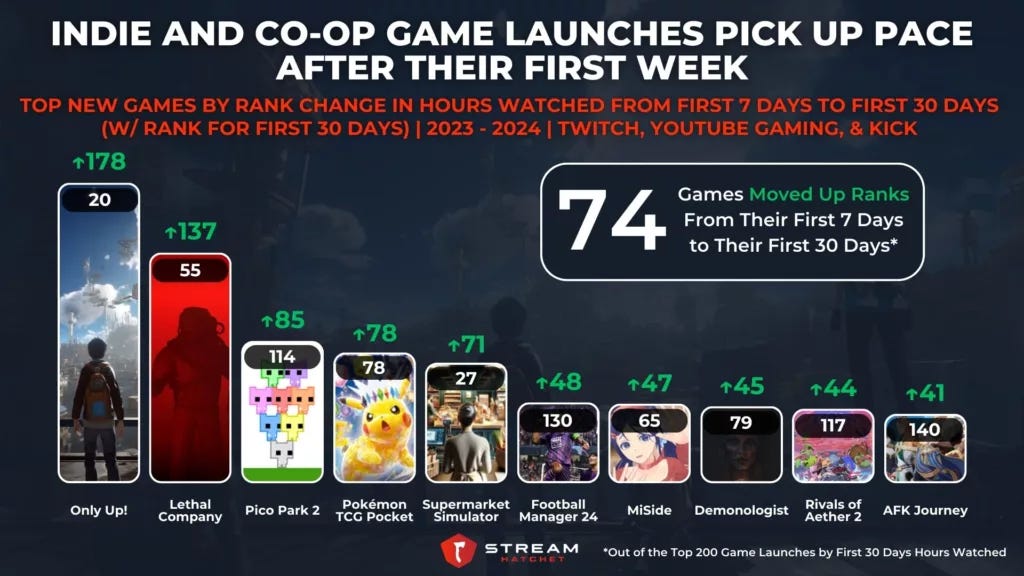
In this category, Stream Hatchet compares the ranking position in hours watched after 7 days with the ranking position at 30 days. Thus, analysts want to exclude large projects (which immediately soar to the top) and look at smaller-scale projects.
- Only Up!, Lethal Company, and Pico Park 2 are the leaders of the "indie rating". They grew the most on day 30 compared to the first 7 days - this is the viral effect.
- Interestingly, there are 2 mobile games in the ranking at once - Pokemon TCG Pocket and AFK Journey.
- Also on the list, despite the very recent release, MiSide is presented - the game is on the 7th line in the list of popularity growth.
Leaders in Peak Viewership
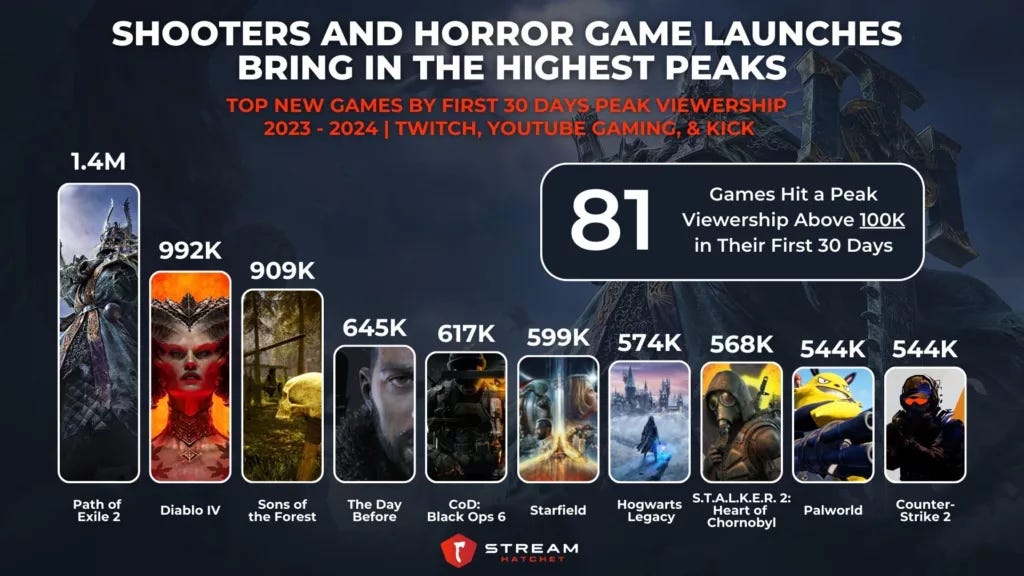
- Path of Exile 2 (1.4 million peak viewers), Diablo IV (992 thousand peak viewers), and Sons of the Forest (909 thousand peak viewers) are the leaders in peak online viewership for the first 30 days. The list also includes The Day Before (645 thousand viewers, 4th place) despite the sad story.
Leaders in Streaming Hours
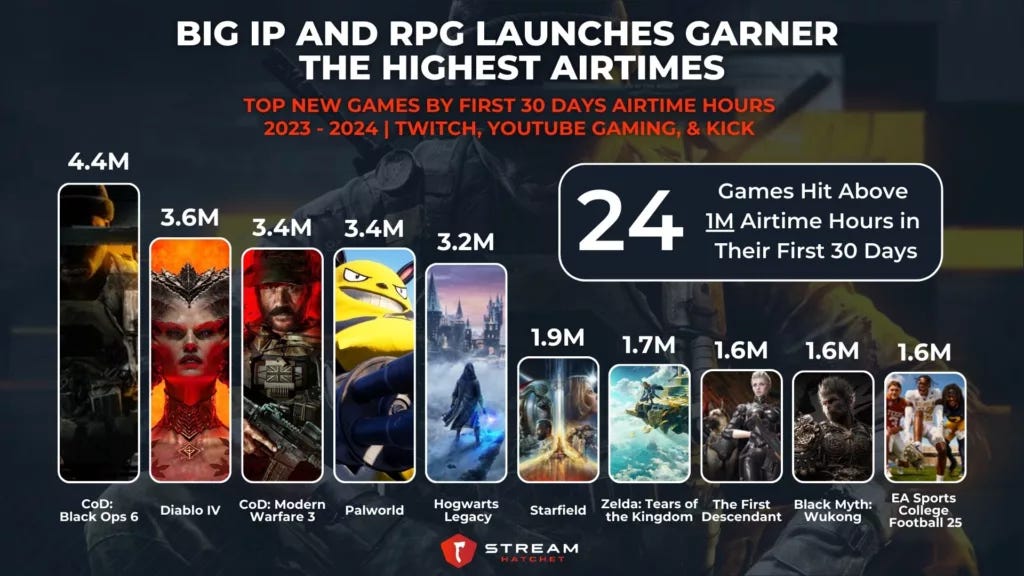
- 24 games over the past 2 years have been streamed for more than 1 million hours. The leaders are Call of Duty: Black Ops 6 (4.4 million hours); Diablo IV (3.6 million hours); Call of Duty: Modern Warfare 3 (3.4 million hours).
PC/Console game sales in Europe Increased by 1% in 2024 - European gaming market results

Game sales
- In Europe, 188.1 million copies of PC and console games were sold. This represents a 1% increase compared to the previous year.
- 131.6 million games were purchased digitally (15% more than last year), while physical copy sales declined by 22% to 56.5 million.
- EA Sports FC 25 is the region's best-selling game of the year, despite a 5% decrease in sales compared to the previous version. Call of Duty: Black Ops 6 is in second place, selling 9% better than Call of Duty: Modern Warfare 3.
- New releases accounted for 27% of copies sold. In 2023, new games were 34% of all sales.
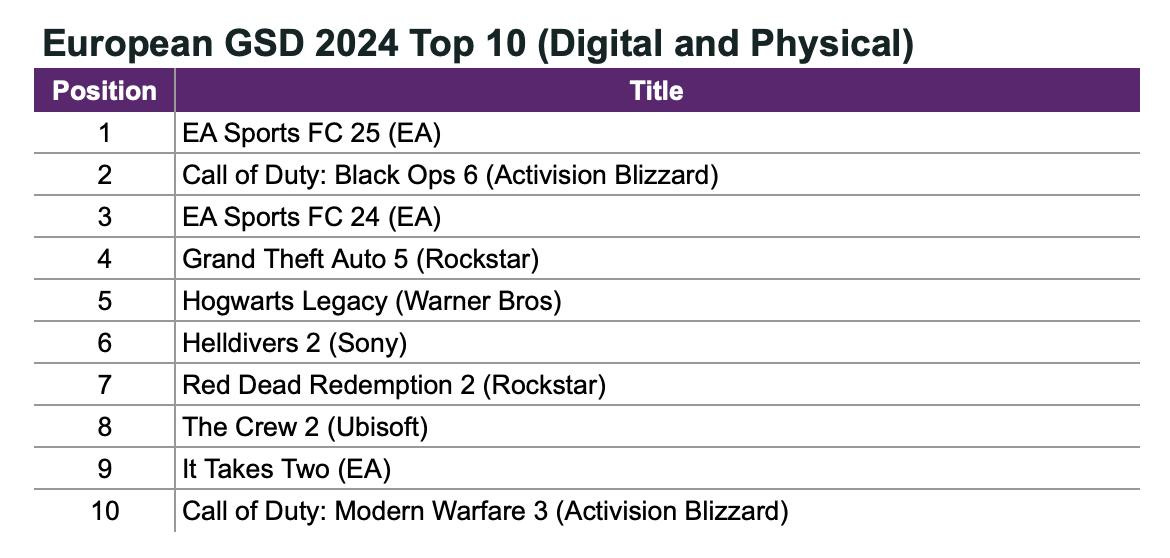
- Fallout 4 sales in 2024 surged by 183% - it is believed that the release of the TV series influenced this increase.
Console sales
- Overall gaming console sales decreased by 21%.
- PlayStation 5 remained the sales leader, but figures dropped by 20% compared to the previous year. Nintendo is in second place, with sales declining by only 15% (the console has been on the market for eight years!). Xbox Series S|X is performing the worst - sales fell by 48%.
Games & Numbers (January 8 - January 22, 2025)
PC/Console Games
- According to estimates from the Chinese portal GameLook, Marvel Rivals earned over $136 million in its first month.
- Warhammer 40,000: Space Marine 2 has surpassed 6 million copies sold.
- Sales of Balatro across all devices have exceeded 5 million copies.
- According to VGInsights, the indie horror game MiSide has earned over $28 million and sold more than 2.4 million copies. It was developed by a team of two people.
- Warhammer 40K: Rogue Trader by Owlcat Games has sold 1 million copies.
- Sales of Lollipop Chainsaw RePOP have surpassed 200,000 copies. The original version of the game sold 1.24 million copies.
- ▫️Hitman: World of Assassination has been played by more than 75 million people. This is the most successful entry in the 24-year history of the series. However, this figure does not represent sales.
- Users have downloaded mods for Baldur's Gate 3 more than 100 million times.
- The developers of the strategy game Broken Arrow have shared a milestone of 800,000 wishlists.
- PIONER has received over 100,000 wishlists in a month.
Mobile Games
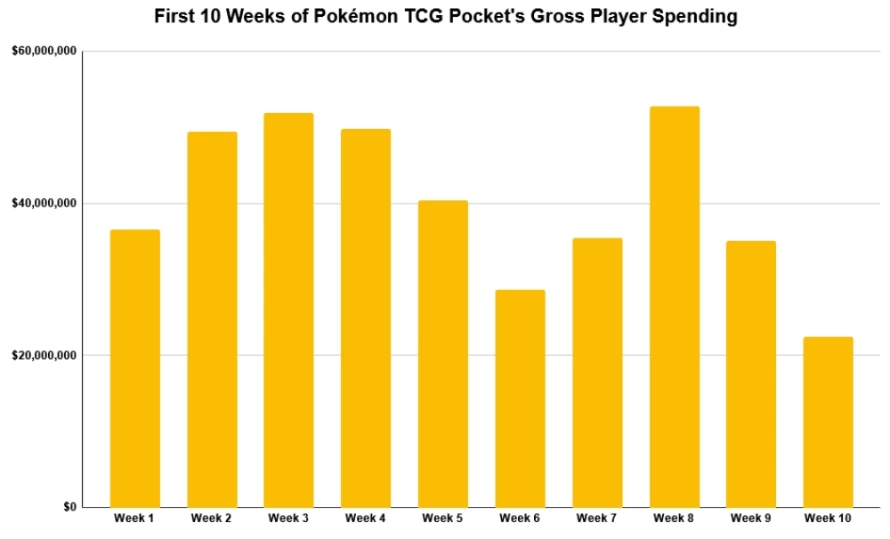
- Pokemon TCG Pocket has earned over $400 million in 10 weeks. But the revenue trend is rather negative.
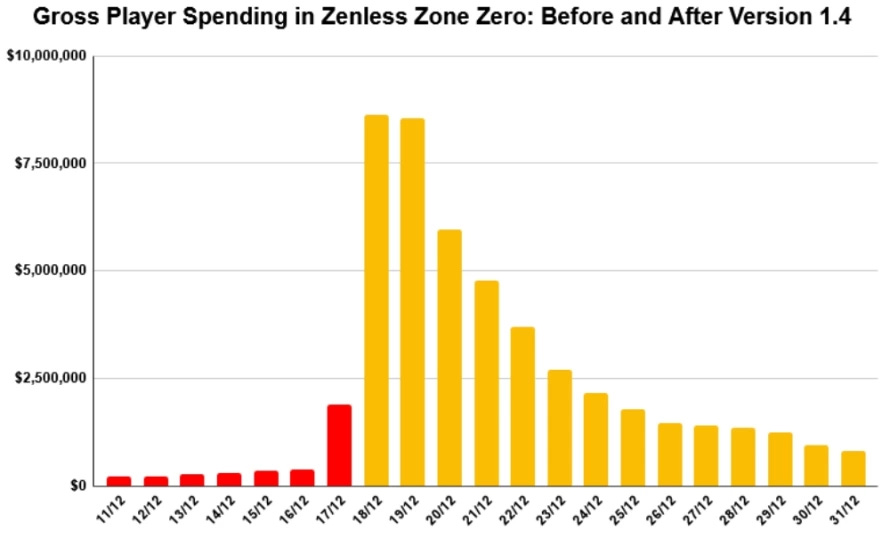
- The revenue of Zenless Zone Zero on mobile devices has surpassed $250 million. The game set a record for daily revenue on December 18, after the release of update 1.4 - $8.6 million.
- Infinity Nikki earned $16 million (after deducting commissions and taxes) on mobile devices in the first month after launch. The majority of this revenue - 63% - came from the iOS version in China. This data is shared by AppMagic.
- Archero 2 earned 8.06 million in the first 11 days after its global launch, according to AppMagic. This figure excludes platform commissions and taxes. The first game started nine times worse.
- More than 10 million people have played Where Winds Meet in China. The iOS version of the project earned $3 million after commissions and taxes in 4 days, according to AppMagic. Goldman Sachs analysts predict the game will generate $573 million in revenue in its first year of operation.
- Squid Game: Unleashed by Netflix has been downloaded 13.9 million times. The game does not require a subscription to the service, and it is the third most downloaded game from Netflix.
Sensor Tower: Mobile Market in 2025
The report is based on data from iOS and Google Play from January 1, 2014 to December 31, 2024. Revenue figures are Gross. Only iOS is counted in China.
❗️In the report analysis, I will focus on games, while providing general data on the mobile market. For more detailed data, please read the full report.
Mobile Market in 2024
- Throughout 2024, 136 billion apps were downloaded. This is 1% less than in 2023.
- Users made purchases worth $150 billion in mobile applications. This amount is Gross, before the deduction of commissions and taxes. The figure is 12.5% higher than last year.
- Engagement metrics are growing - a total of 4.2 trillion hours were spent in mobile applications (+5.8% YoY). On average, a person spends 3.5 hours daily in apps (+2.9% YoY). The average user uses 26 apps per month (+9.2% YoY).
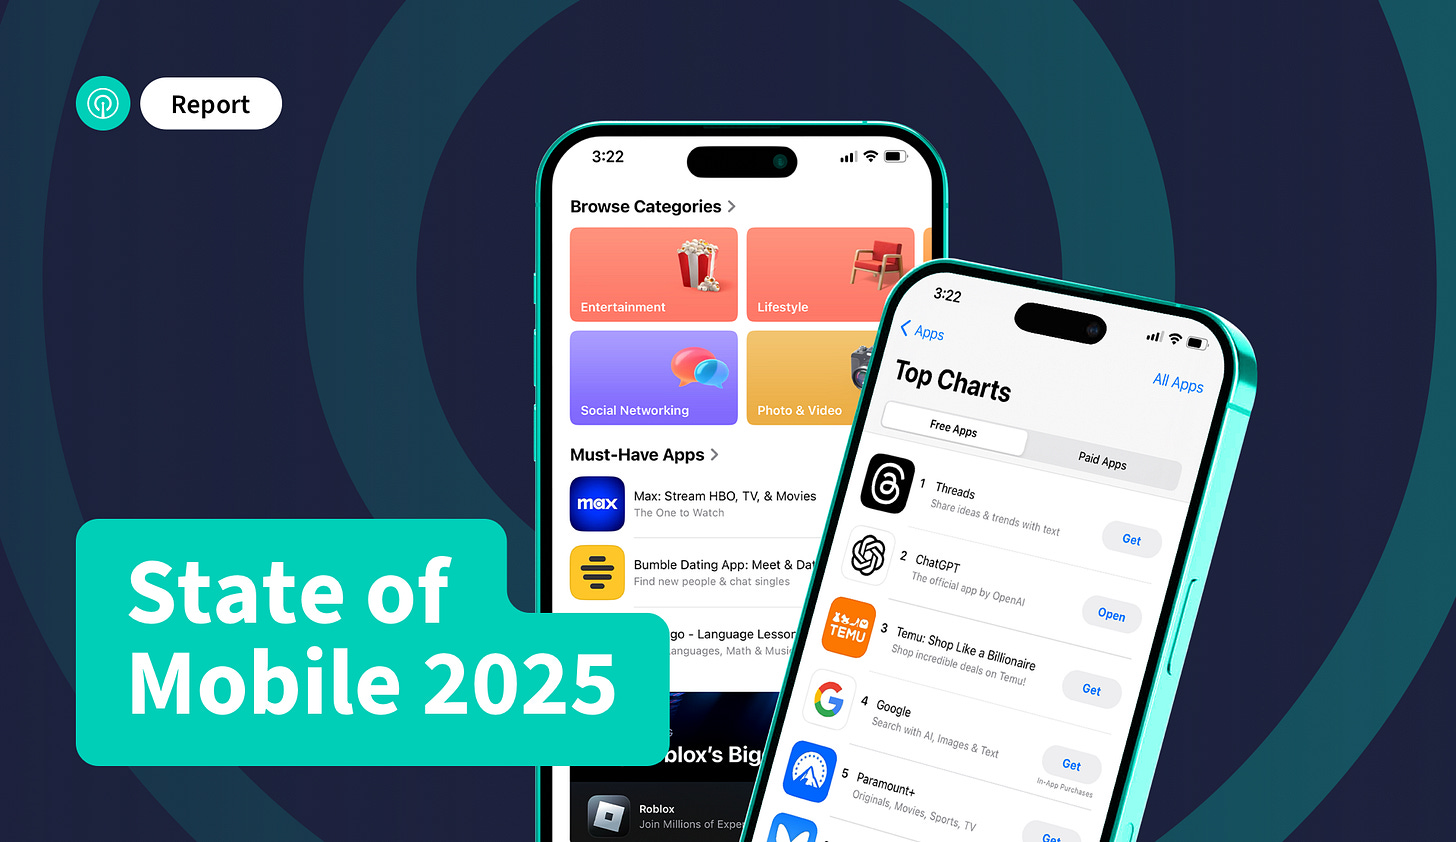
- The leading countries in downloads are still the same - India, the USA, and Brazil. However, all three countries have been declining in downloads over the past 3 years.
- The leaders in download growth in the top 20 are Indonesia, China, and Pakistan.
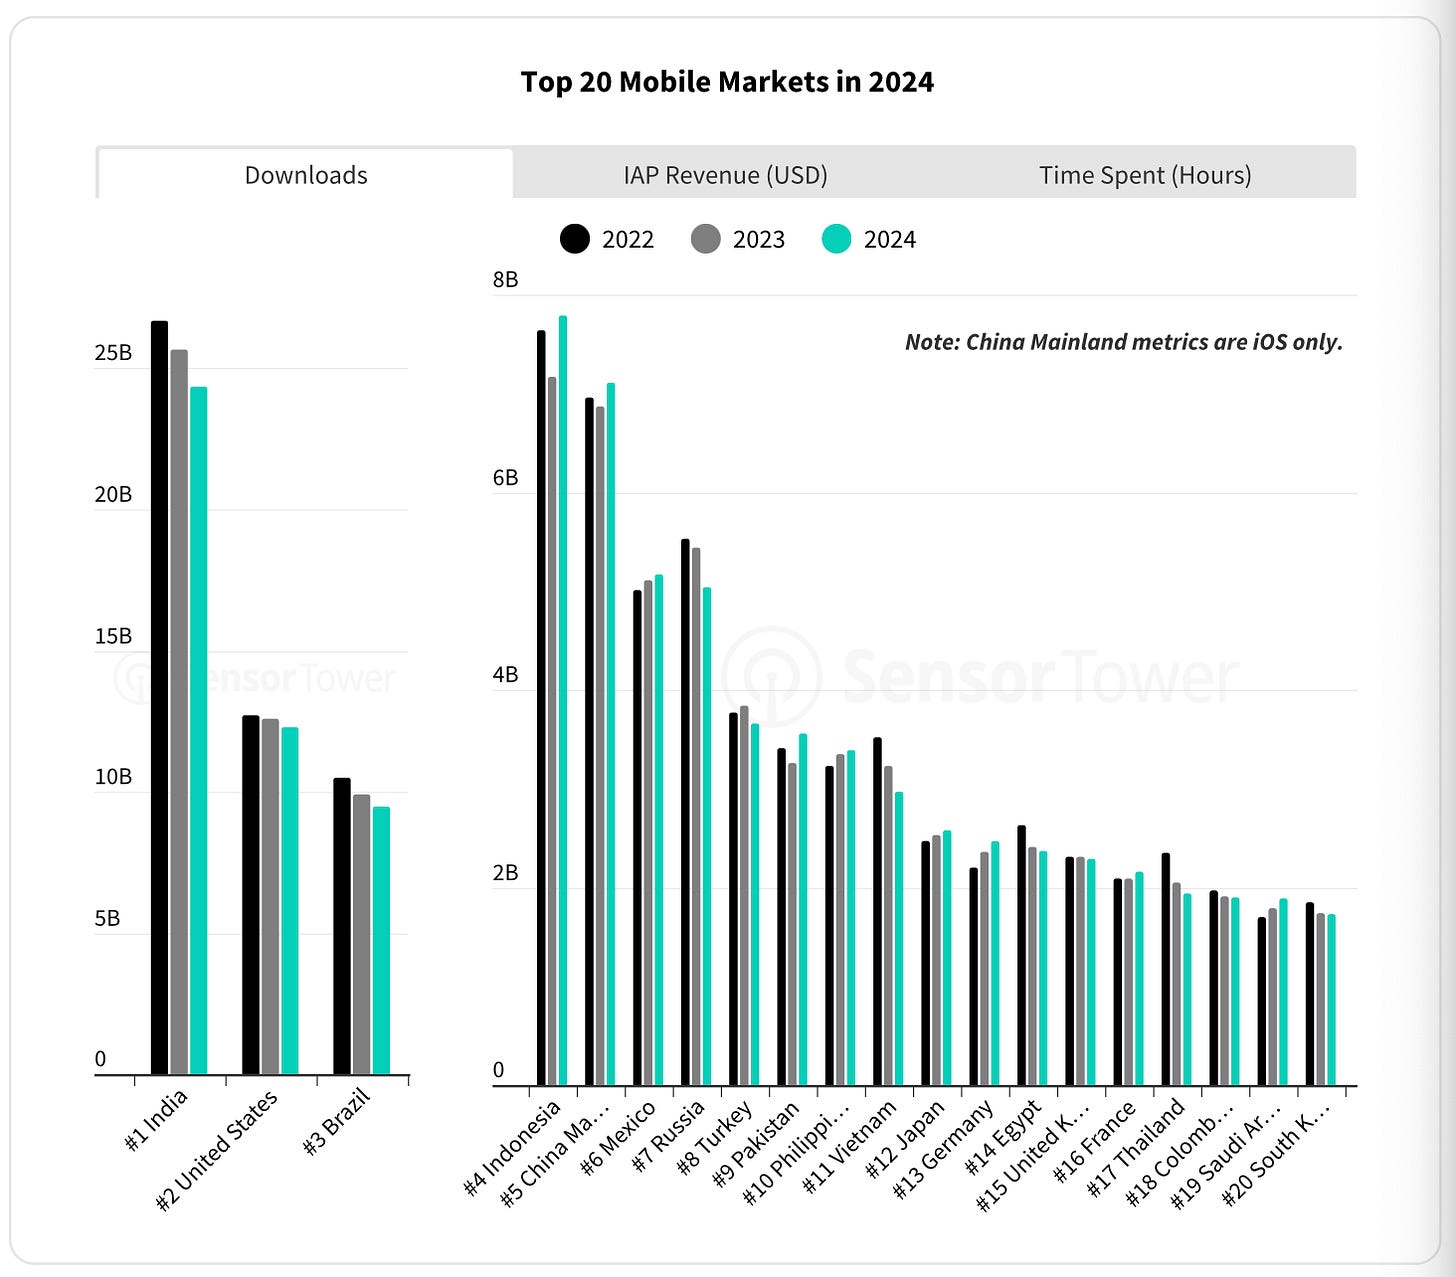
- Revenue leaders are the USA, China, and Japan. While revenue in the US and China is growing, IAP revenue in Japan is falling.
- Germany, the UK, and France are actively growing in IAP revenue.
- In terms of time spent in apps, the leaders are India, Indonesia, and the USA.
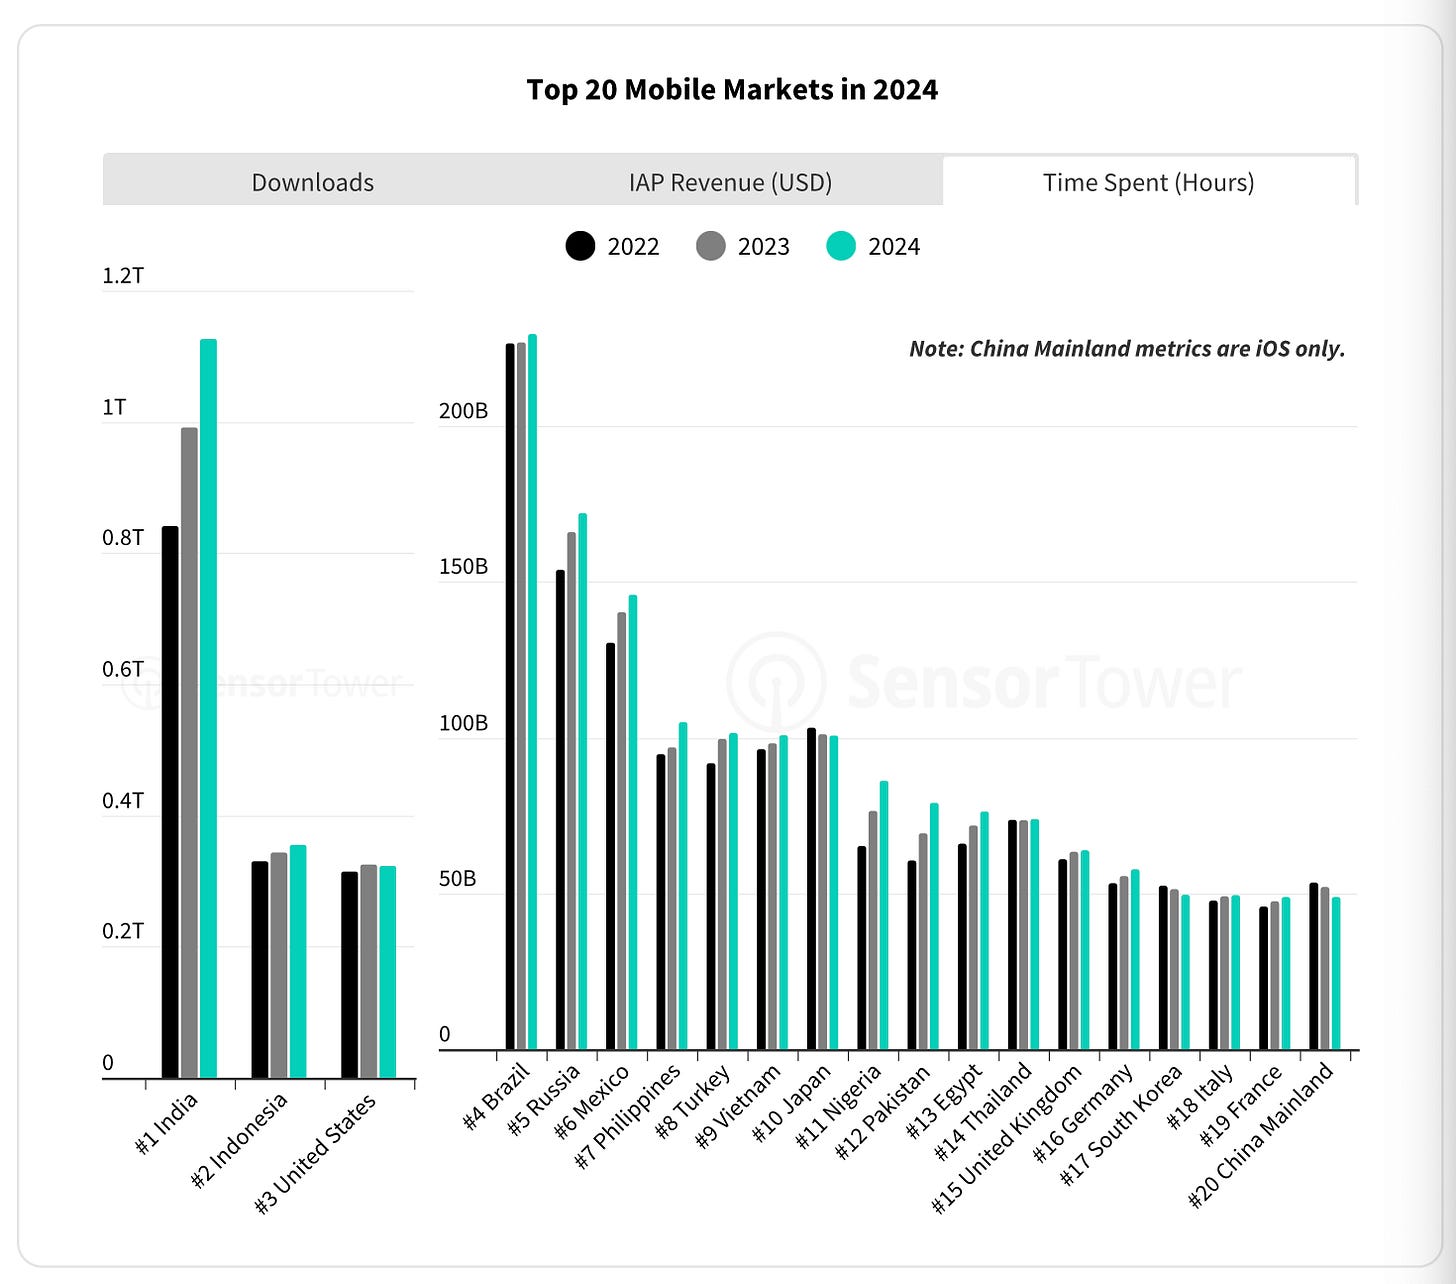
- Russia, the Philippines, and Nigeria show the most intensive growth in time spent.
Games vs non-game applications
- Non-game app revenue grew from $3.5 billion in 2014 to $69 billion in 2024, a 25% year-over-year increase.
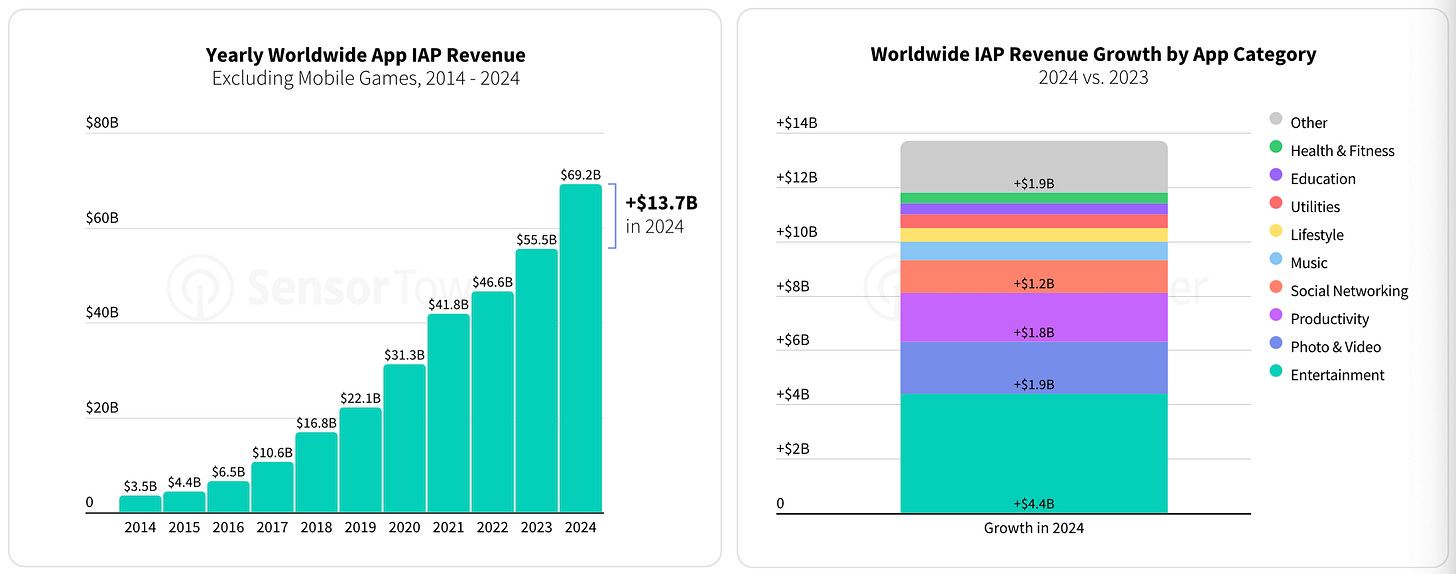
- Games still account for the majority of revenue ($80 billion in 2024), but growth was only 4%.
- Social networks, streaming services, and shopping apps are leaders in downloads. Downloads of AI chatbots are actively growing.
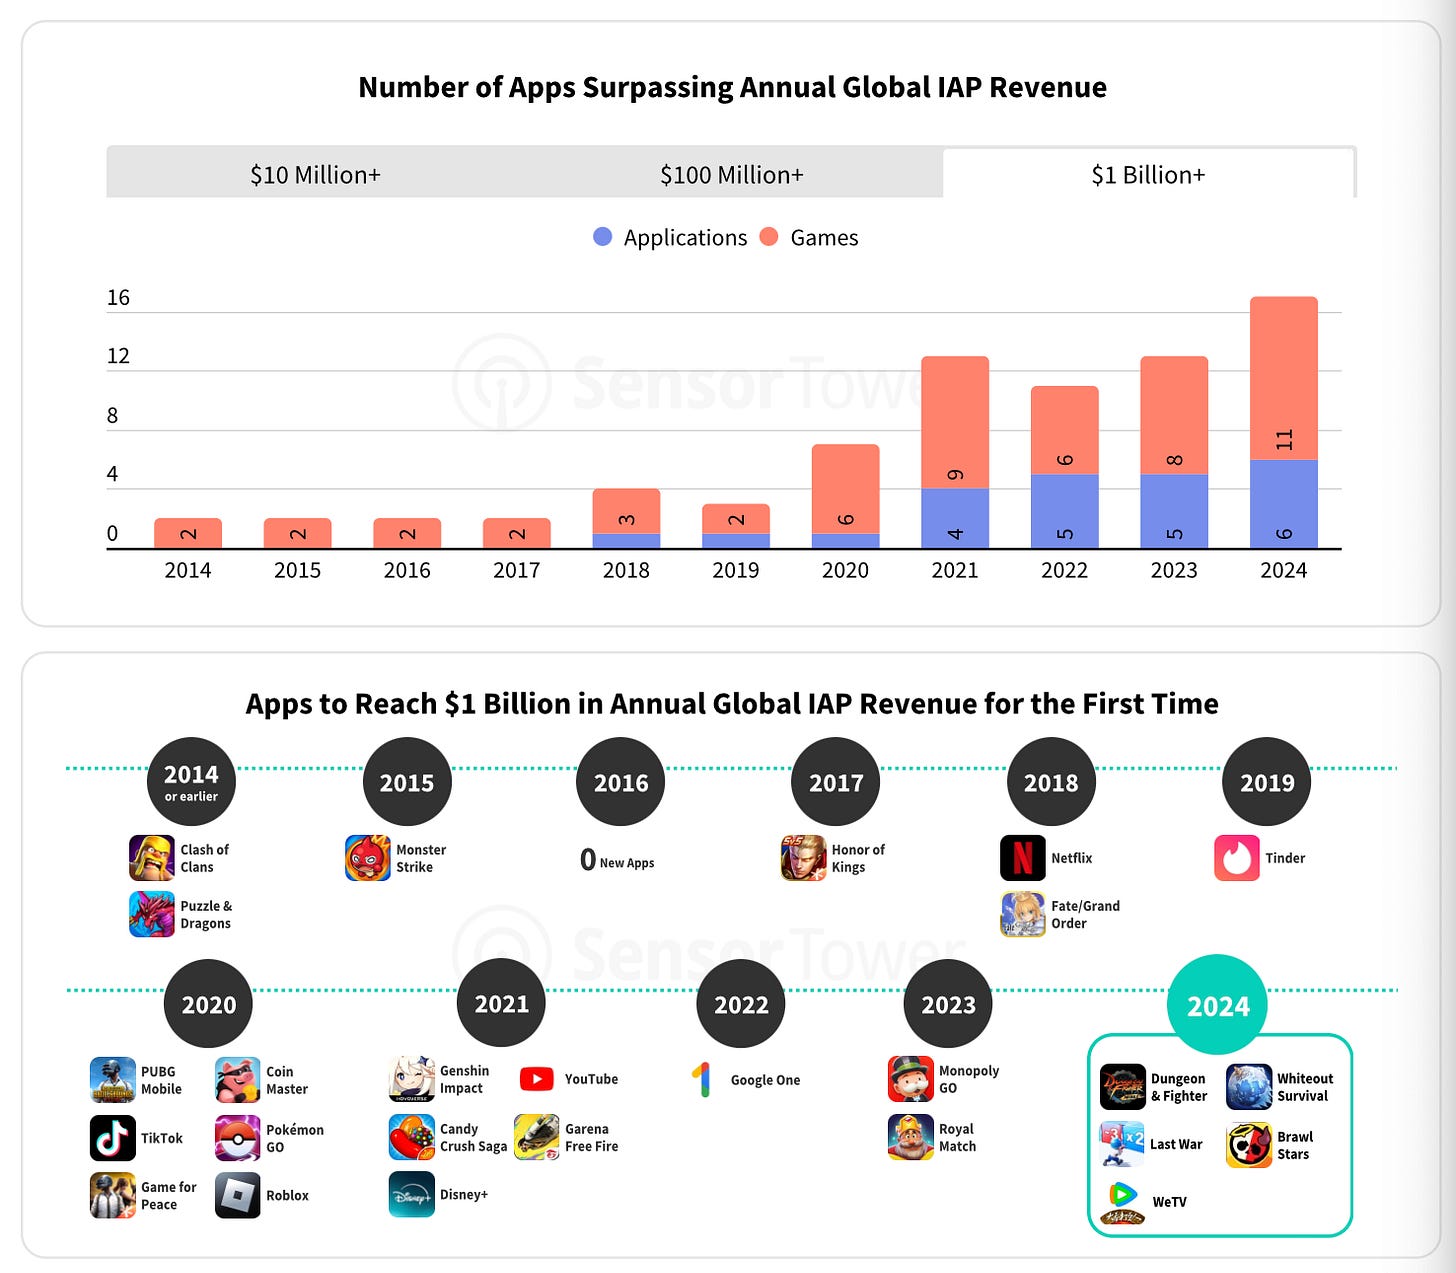
- In 2024, 4 games joined the “billionaire club” for the first time - Dungeon & Fighter; Whiteout Survival; Last War, and Brawl Stars. This is a record among games since 2020. A total of 17 apps broke this mark in 2024 - 11 games and 6 non-game apps. This is the best result since observations began in 2014.
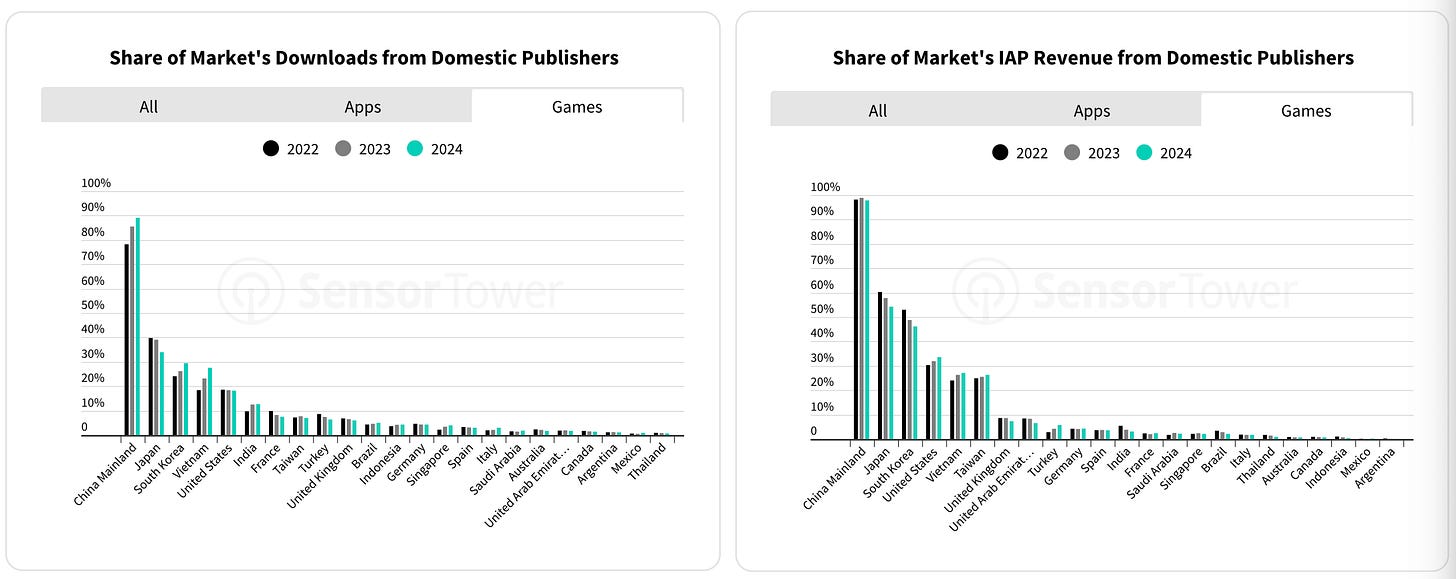
- In China, 90% of all downloads and revenue come from local publishers. A large share of local companies is in Japan, South Korea, USA. But if you look at the world as a whole, local publishers account for 21-22% of all revenue and downloads.
2024 in games - markets
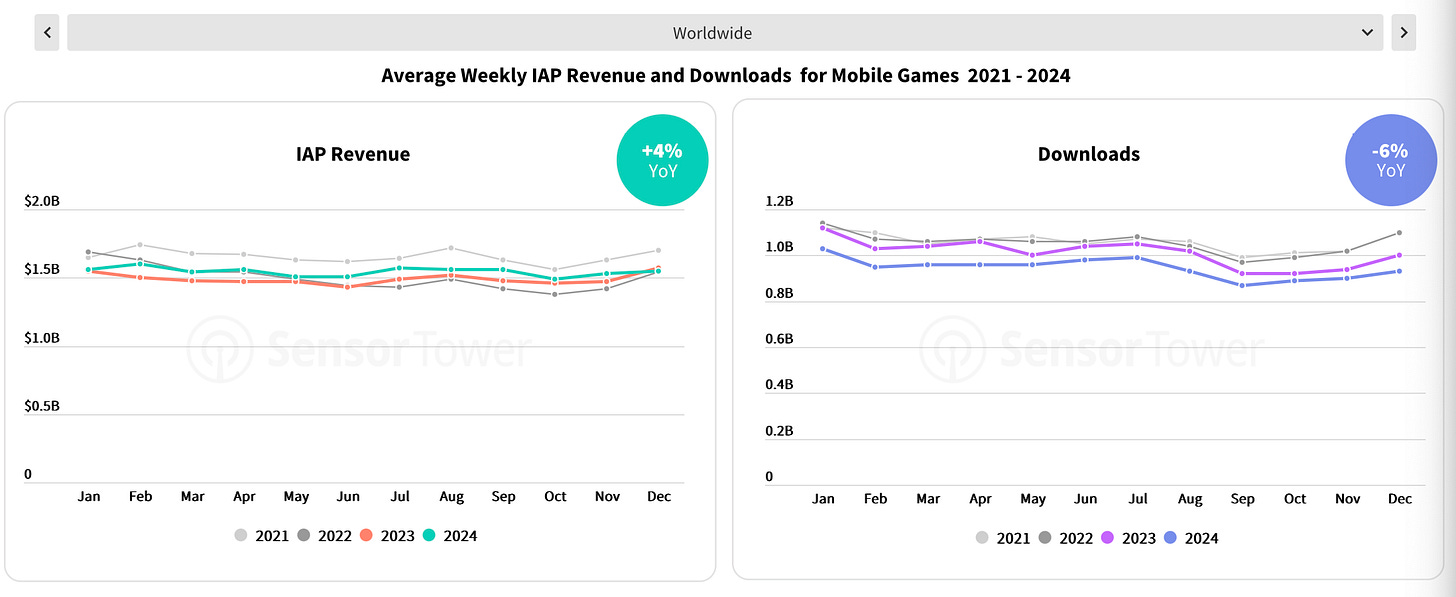
- Mobile game revenue in 2024 reached $80.9 billion - an increase of 4% over the previous year.
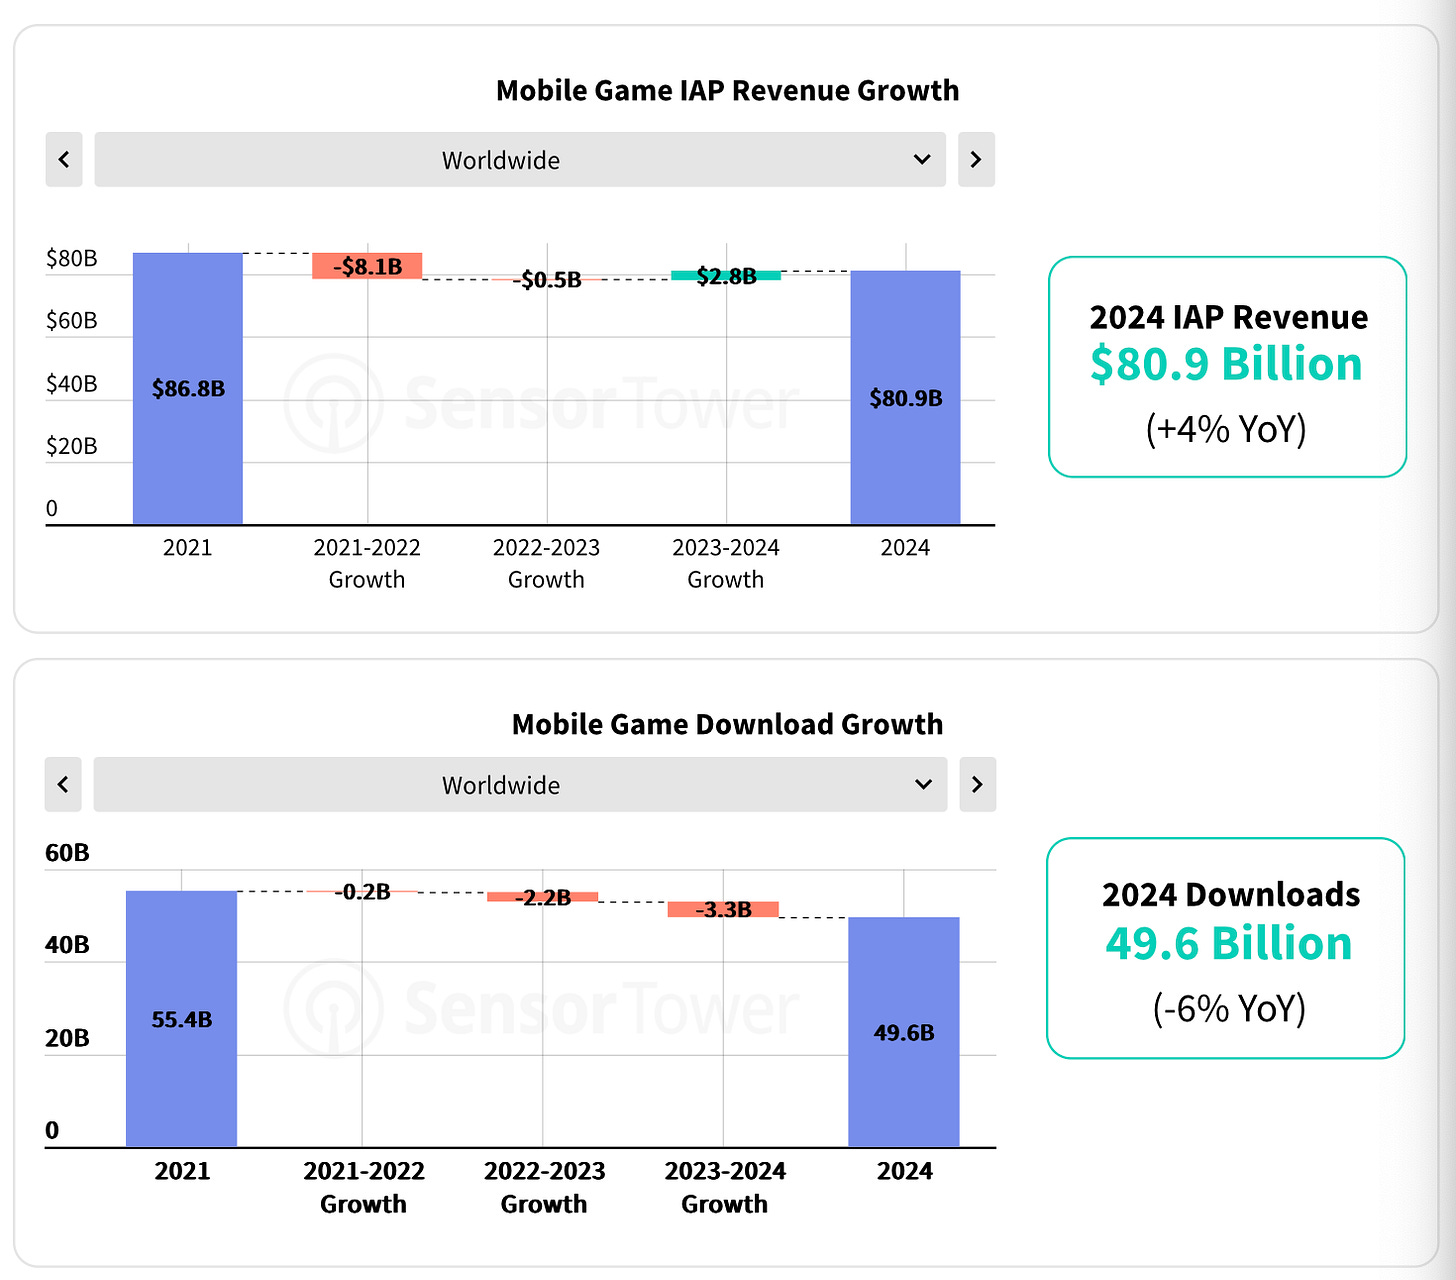
- At the same time, downloads fell by 6% year-on-year - to 49.6 billion.
- Strong growth in revenue is shown by the markets of Turkey (+28% YoY); Mexico (+21% YoY); India (+17% YoY); Thailand (+16% YoY); Saudi Arabia (+14% YoY).
- Among established markets, the US has normal dynamics (9% revenue growth, but a 7% drop in downloads). The Japanese market fell by 7% YoY.
- Most markets are falling in downloads in 2024. Exceptions are Indonesia (+4% YoY) and Saudi Arabia (+5% YoY).
- Emerging markets are growing in the structure of total revenue and downloads. And although their volume remains relatively small, these are potential growth points.
2024 in games - downloads
- Simulators (9.8 billion installs; growth of 0.4% YoY), puzzles (9.7 billion; drop of 3% YoY), arcades (9.6 billion; drop of 12.5%) are market leaders in downloads.
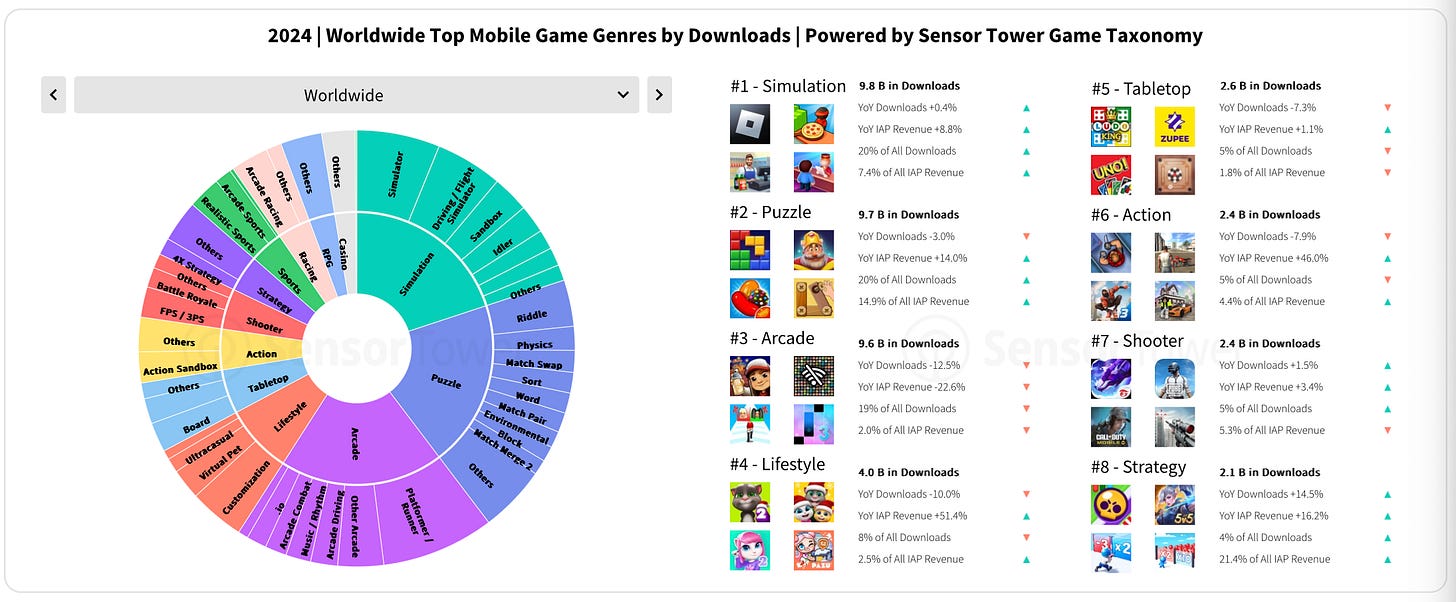
- The strongest growth in downloads was shown by strategies - by 12.5% compared to last year. At the same time, despite the fact that they account for only 4% of all downloads, strategies generate 21.4% of all mobile game revenue.
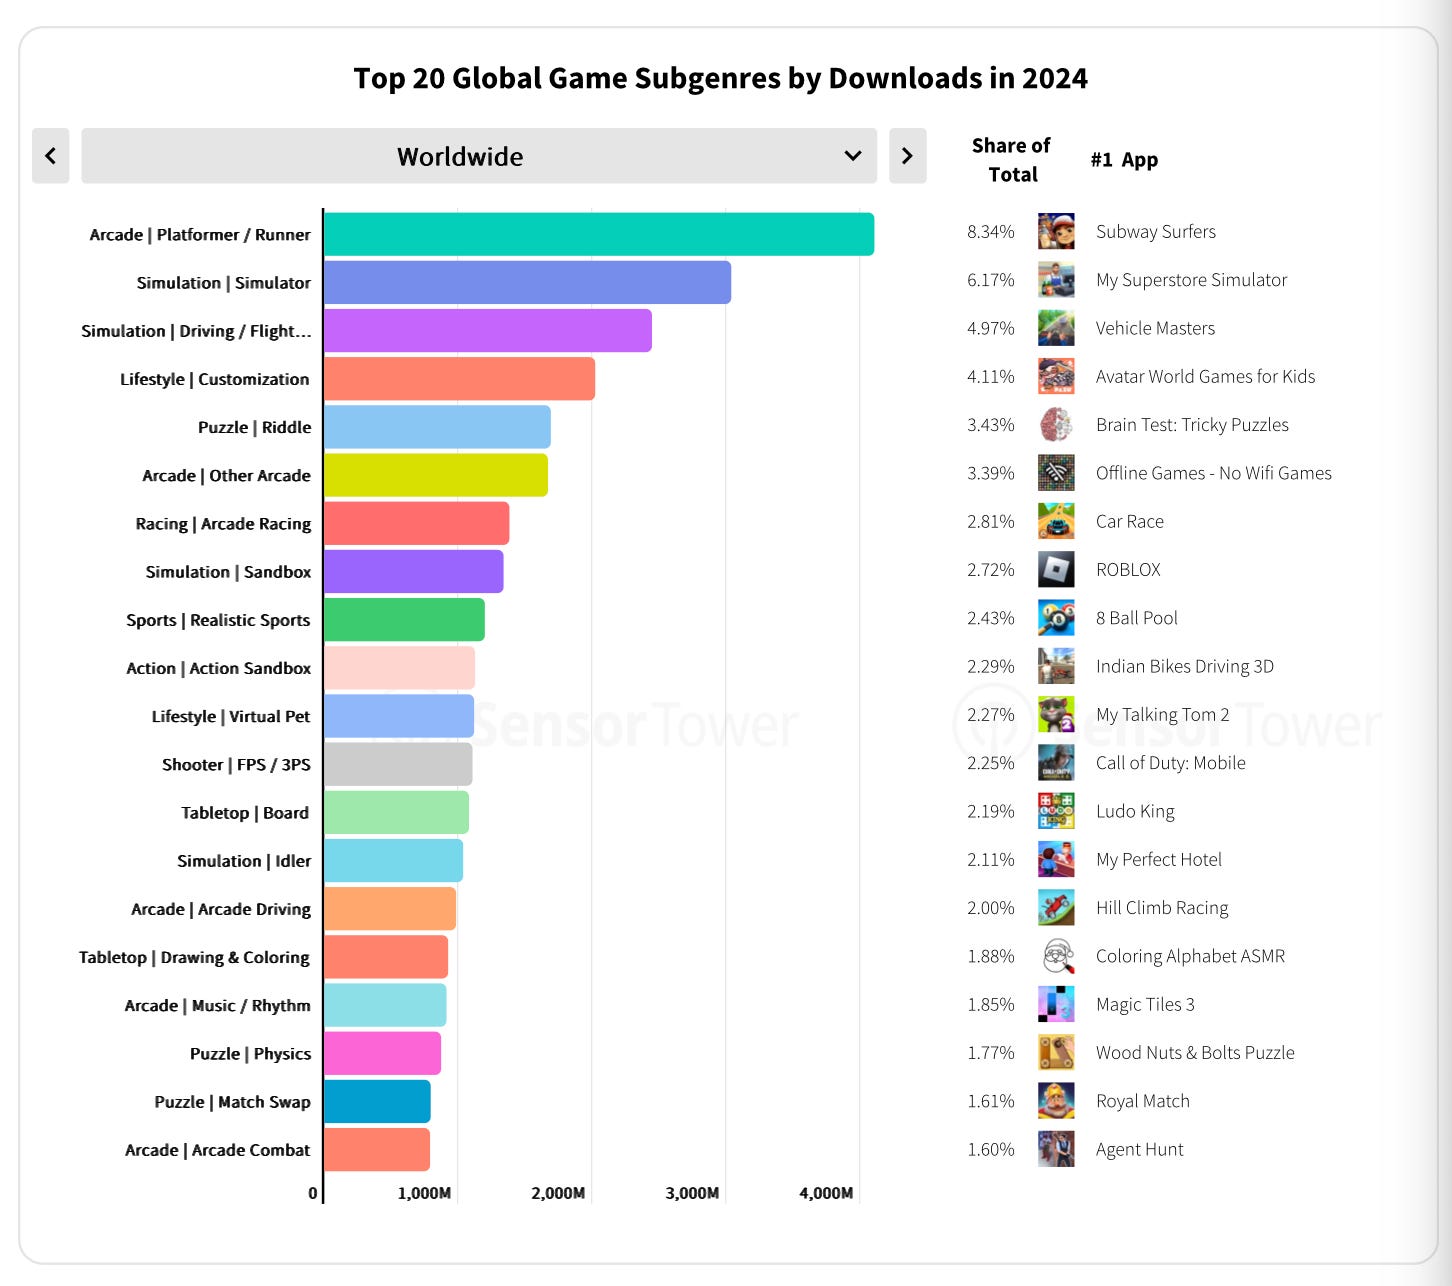
- If we consider sub-genres by downloads, the leaders are platformers/runners (8.34% of all downloads). In second place are simulators (6.17%), in third place are racing games (4.98%).
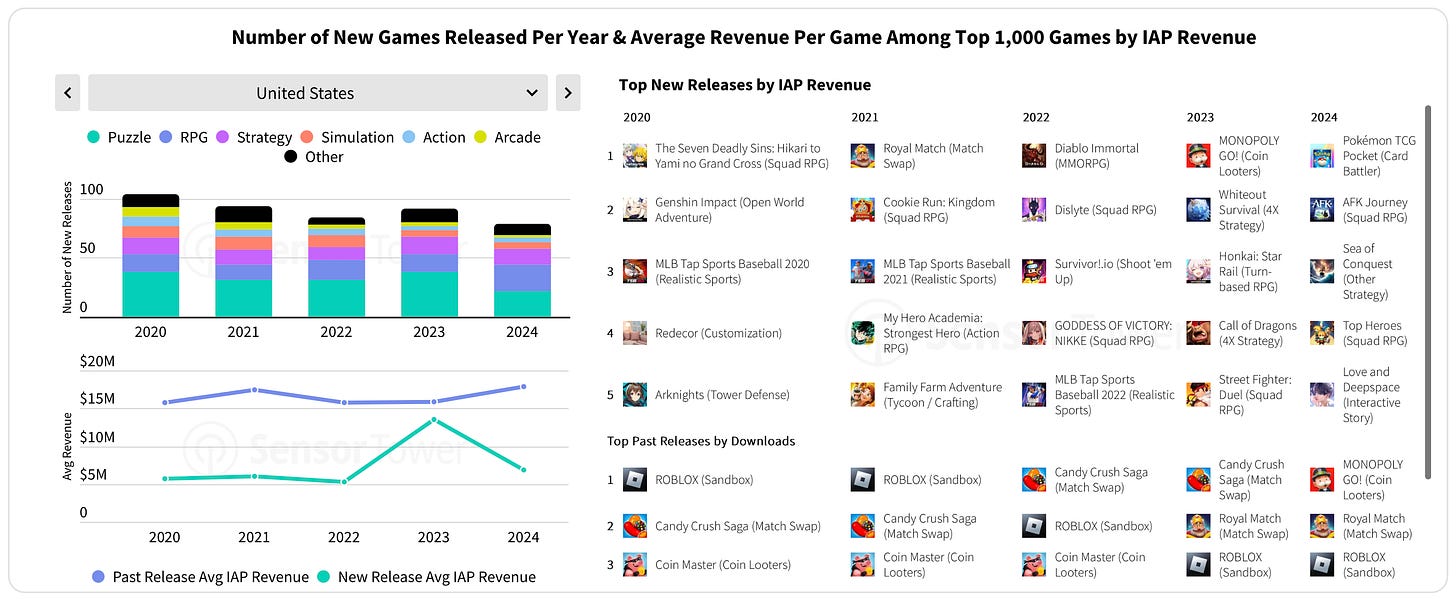
- The share of new games in the US in the top 1000 by downloads has been falling since 2020. If 5 years ago there were 200 new projects in the top, then in 2024 - just over 100. At the same time, the average number of downloads continues to remain at the level of 1-2 million installs.
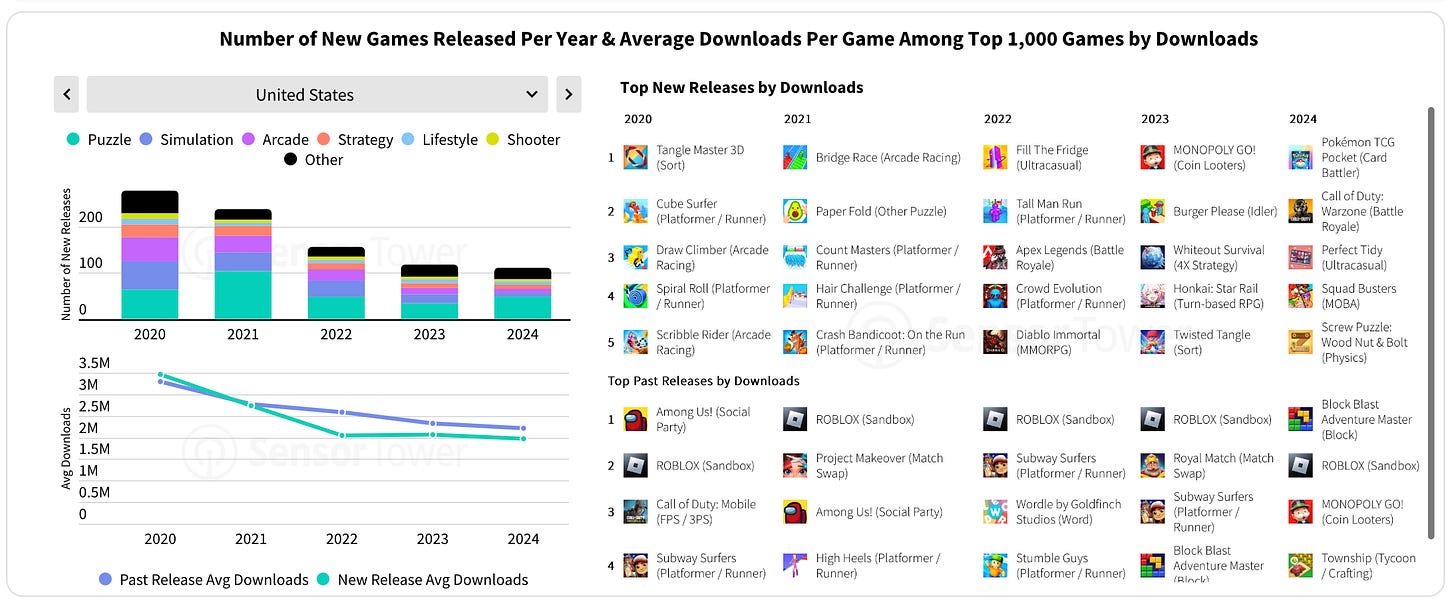
- But the situation is not same everywhere. For example, in China in 2024, downloads of new games increased. The situation is similar in Indonesia, South Korea.
- The most concentrated genres by downloads in the US are geolocation games (the top 3 games have 72.1% of all installations), shooters (21.5% of downloads for the top 3 games).
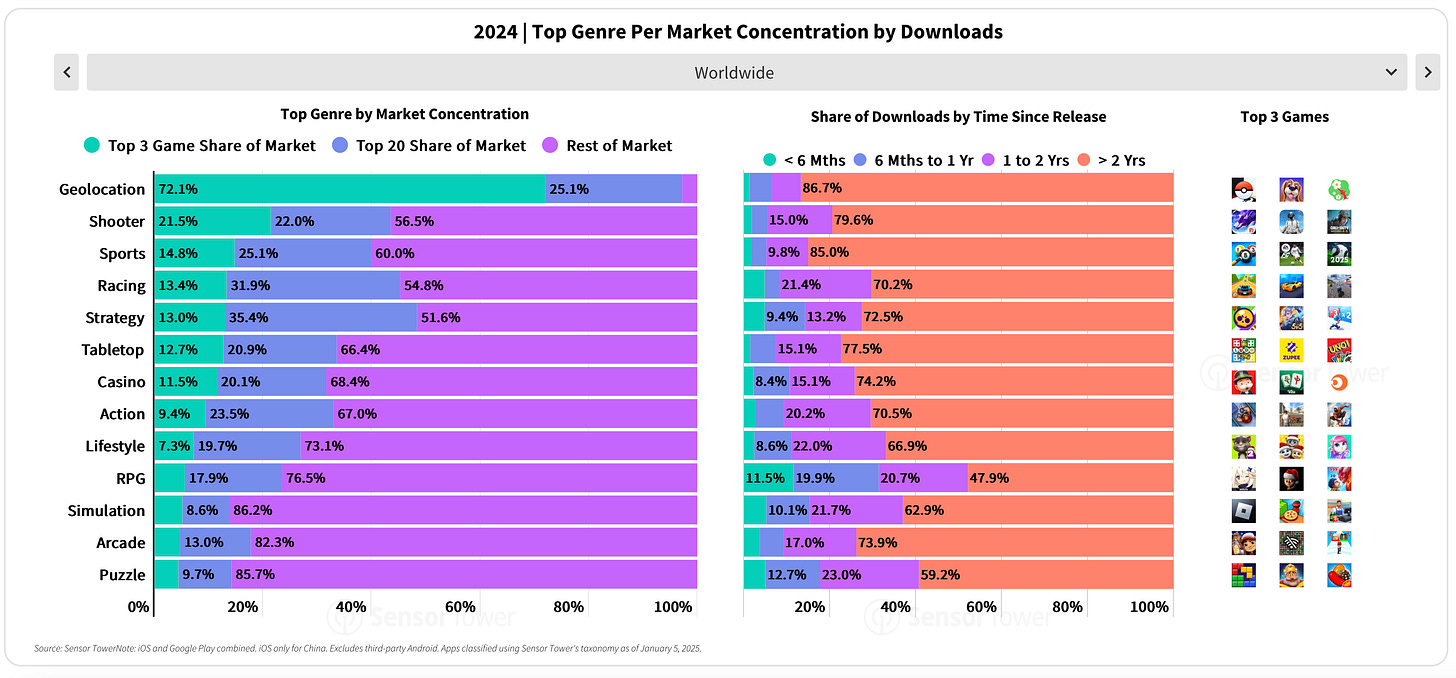
- Old projects (older than 2 years) still generate most of the downloads in all genres. Among RPGs, only 47.9% of downloads are for projects older than 2 years. But among geolocation games, 86.7% of downloads are for old projects. Sports projects have a similar state (85% of downloads for games older than 2 years).
- World leaders among genres in download growth are Battle Royale, MOBA, Sort Puzzle, simulators, physical puzzles.
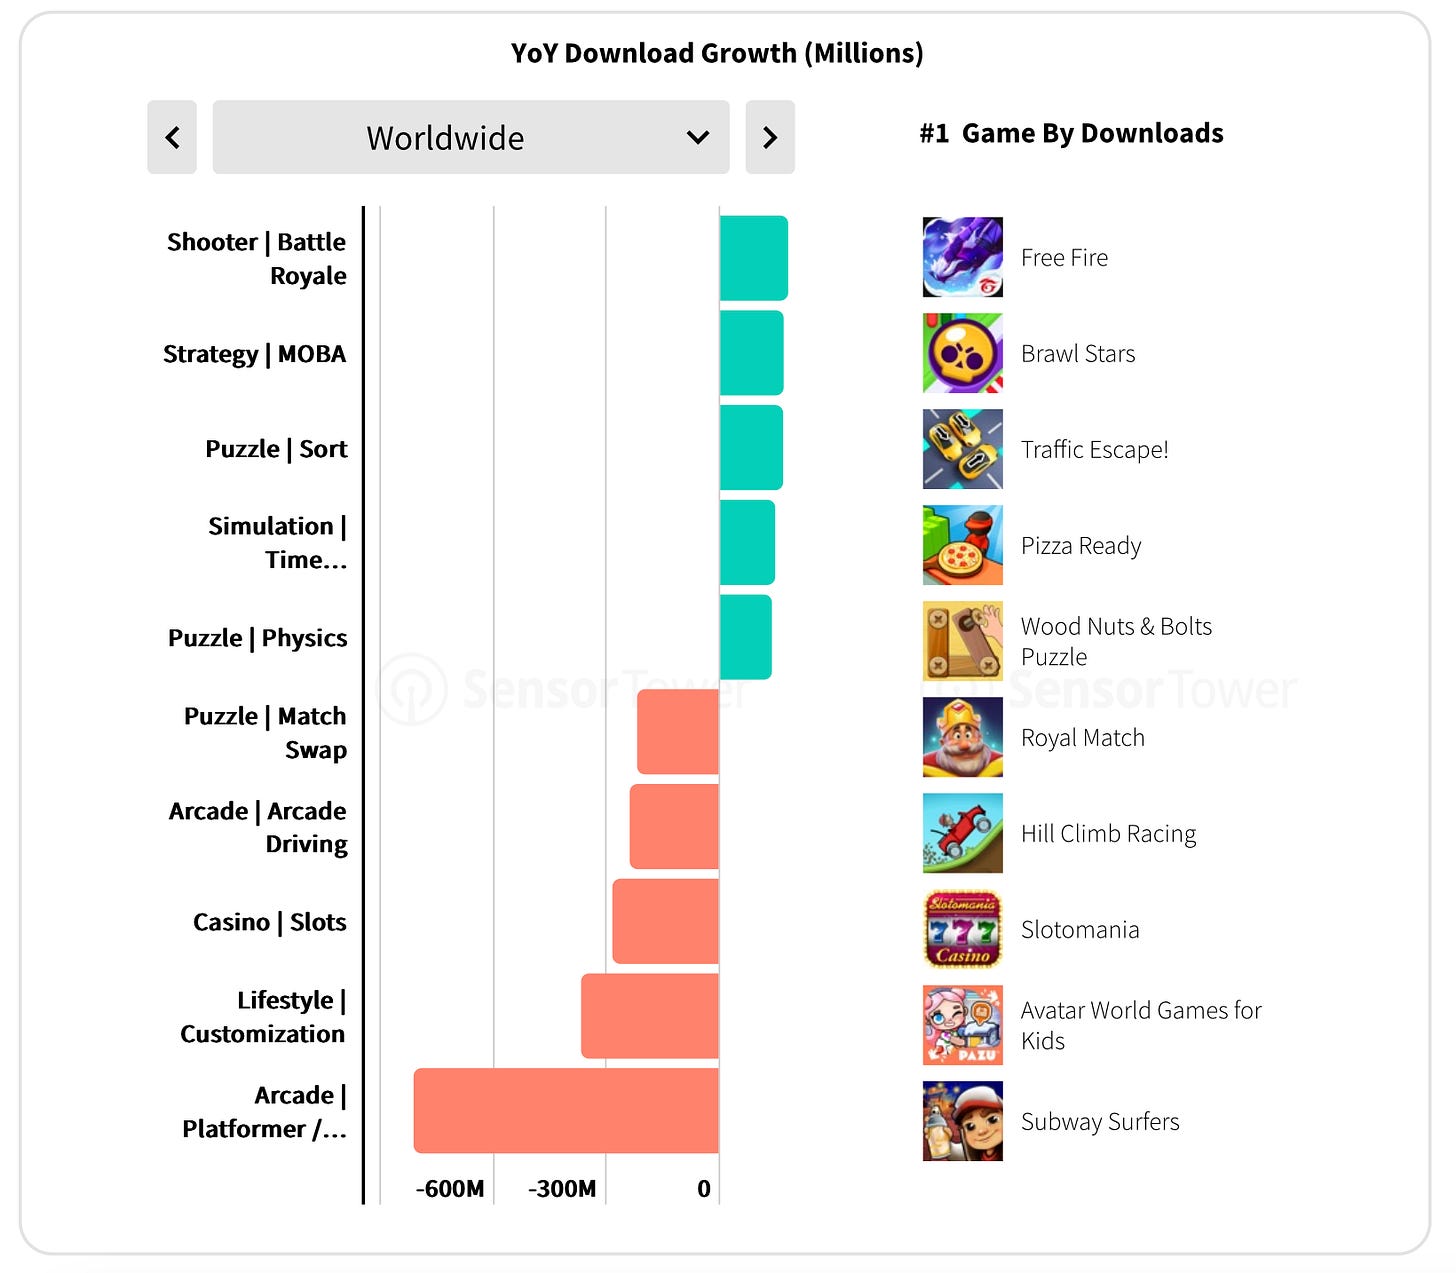
- The biggest drop in downloads was for platformers/runners, lifestyle customization games, slots, arcade racing and Match games.
2024 in games - revenue
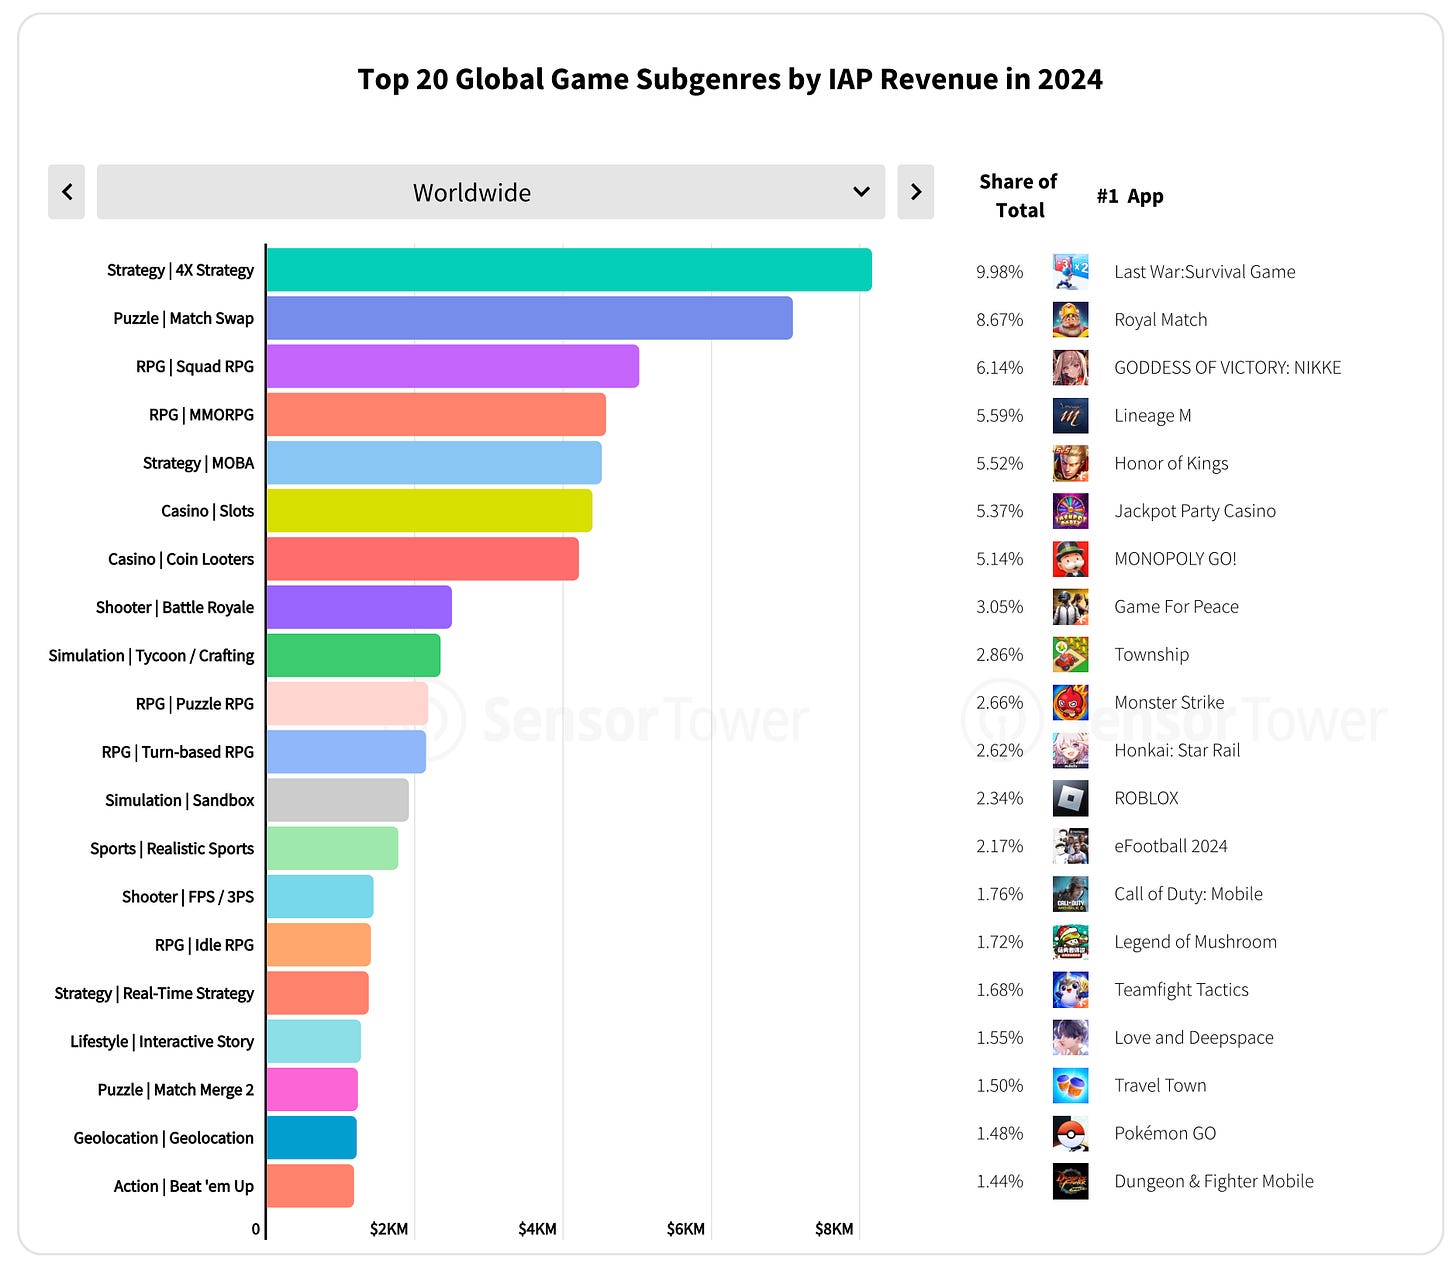
- Strategies ($17.5 billion revenue in 2024 - growth of 16.2%); RPG ($16.8 billion - drop of 17.3%) and puzzles ($12.2 billion - growth of 14%) are the largest genres by revenue on mobile devices.
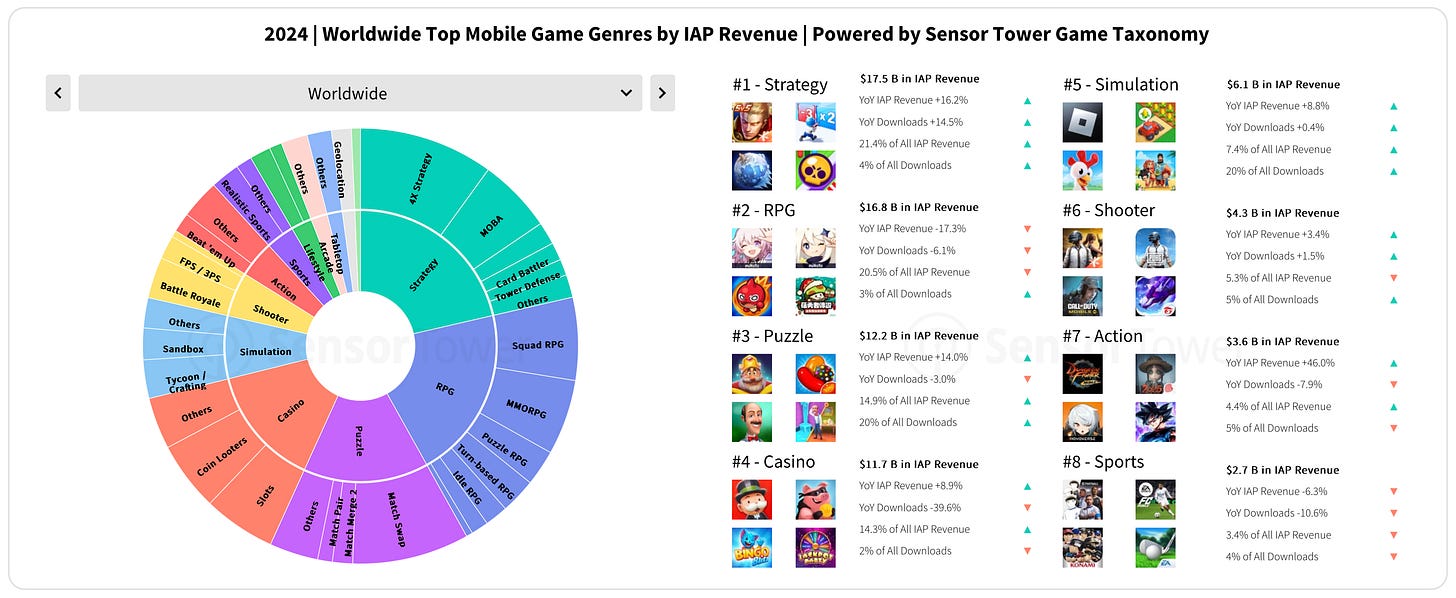
- Revenue is falling for sports games (-6.3% in 2024). But Action games are showing active growth (revenue soared by 46% at the end of 2024).
- 4X strategies are the world leader among genres in terms of revenue. They account for 9.98% of the entire market volume. Next are Match projects (8.67% of the market), Squad RPG is in third place (6.14%).
- The competitive environment in the US in the top 1000 by revenue is getting tougher over the years. Fewer and fewer projects make it into the ranking. At the same time, after a serious increase in the revenue of new projects in 2023, there was an almost equally sharp drop in 2024.
- The situation, again, is not the same across countries. For example, in China, both the number of new projects and their revenue increased - the dynamics were positive in 2022 and 2023. In Mexico, the revenue of both new and old projects has been growing since 2021. In France, the largest number of new games since 2020 entered the top 1000 in revenue, although the total revenue of new products was less than in 2023. Each market has its own dynamics.
- The most concentrated genres by revenue in the world are geolocation games (62.5% of revenue for the top 3), strategies (9.4% for the top 3; 33.2% for the top 20), shooters (8.3% for the top 3; 29.6% for the top 20). The least competition is in arcade games, racing, board games. However, the chart shows IAP monetization, and these genres are most often monetized through advertising.
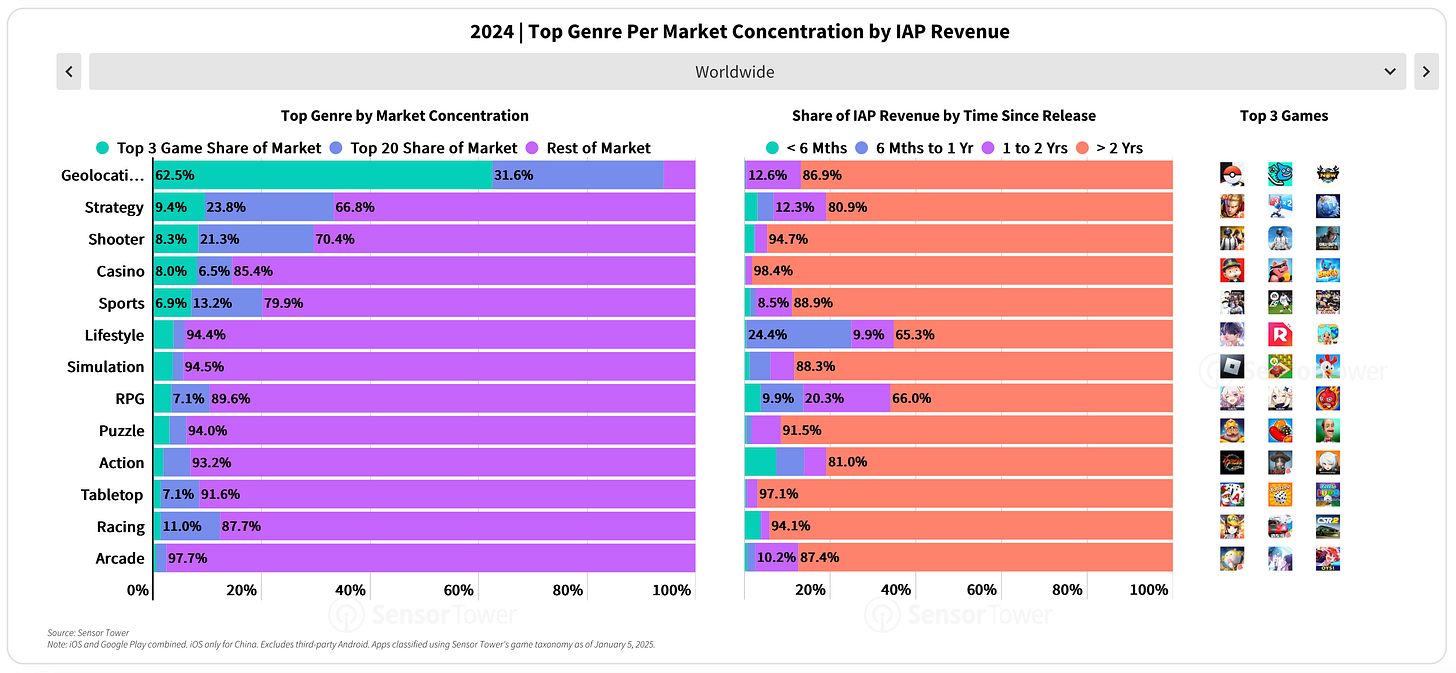
- The role of old games in the revenue structure is colossal. In most genres, projects older than 2 years account for 80%+ of revenue. In casinos, shooters, puzzles, board games, racing - more than 90% of revenue comes from projects older than 2 years.
- The sub-genre Coin Looters (where Sensor Tower includes MONOPOLY GO!) showed the strongest revenue growth in 2024, followed by 4X strategies, Beat’em Up (Dungeon & Fighter Mobile almost single-handedly pulled the genre), MOBA and interactive stories.
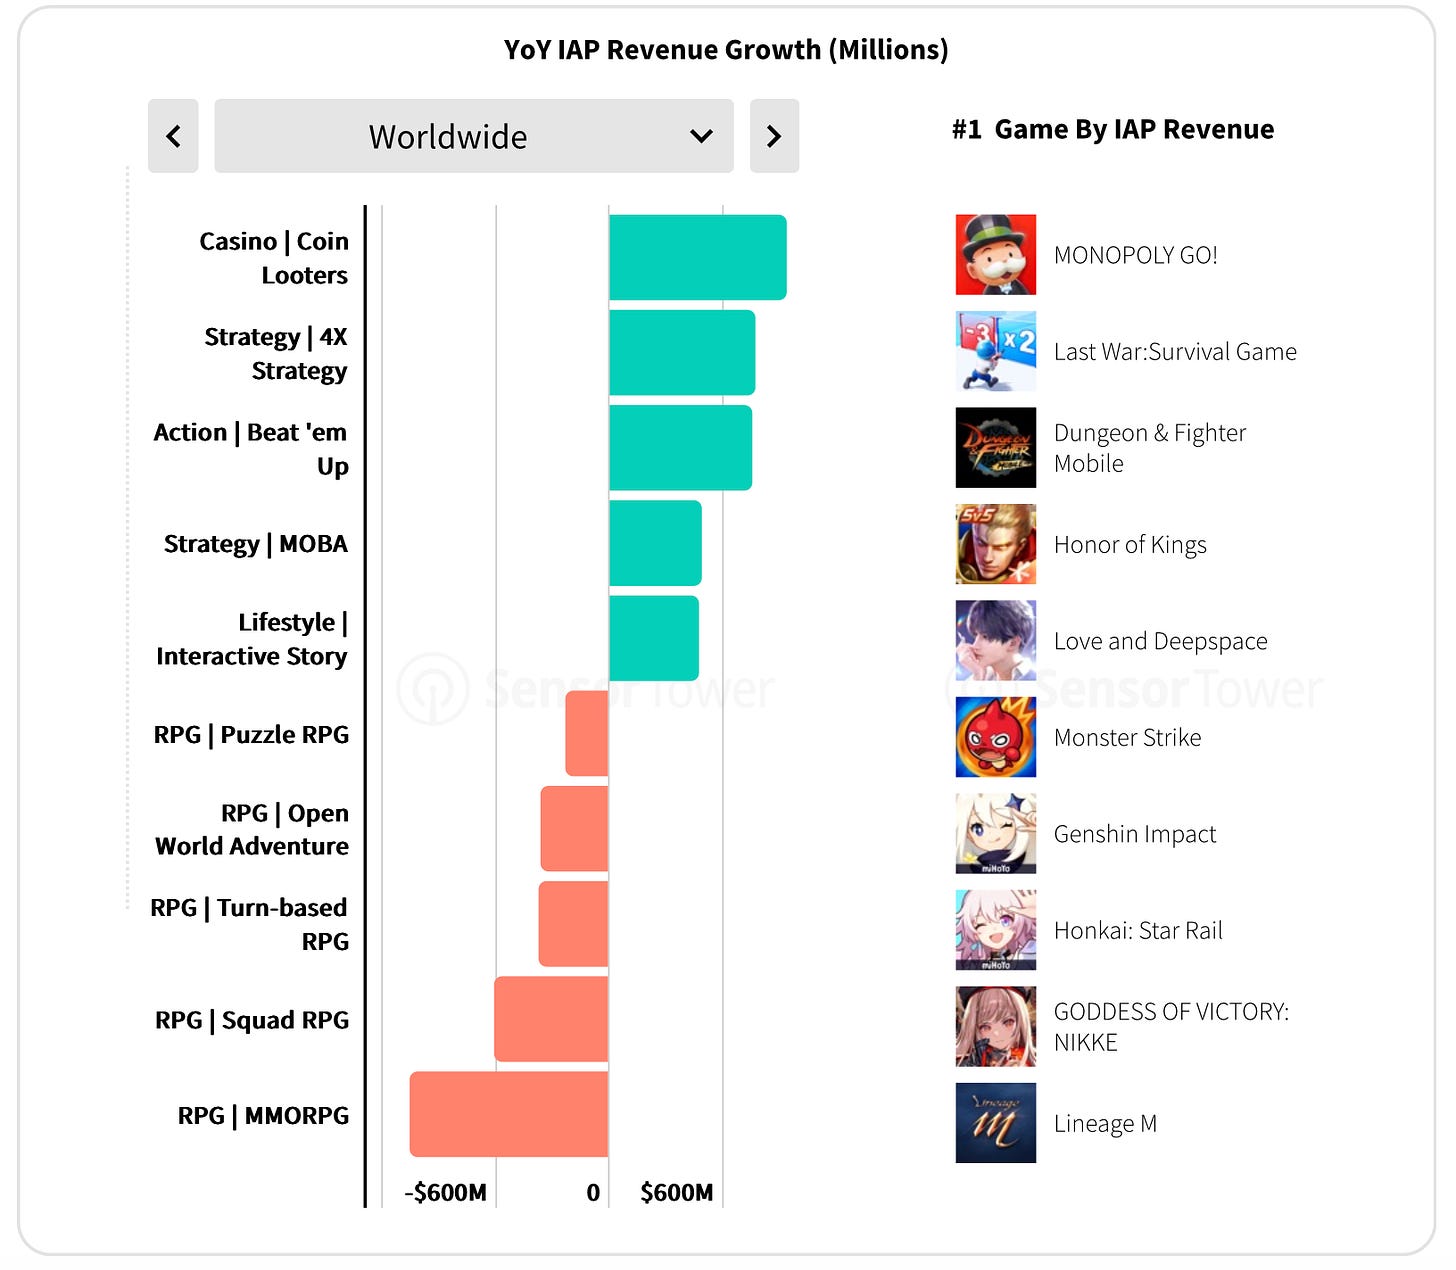
- The largest decline by revenue were in MMORPG, Squad RPG, turn-based RPG, adventure games and Puzzle RPG.
Leaders in Time Spent
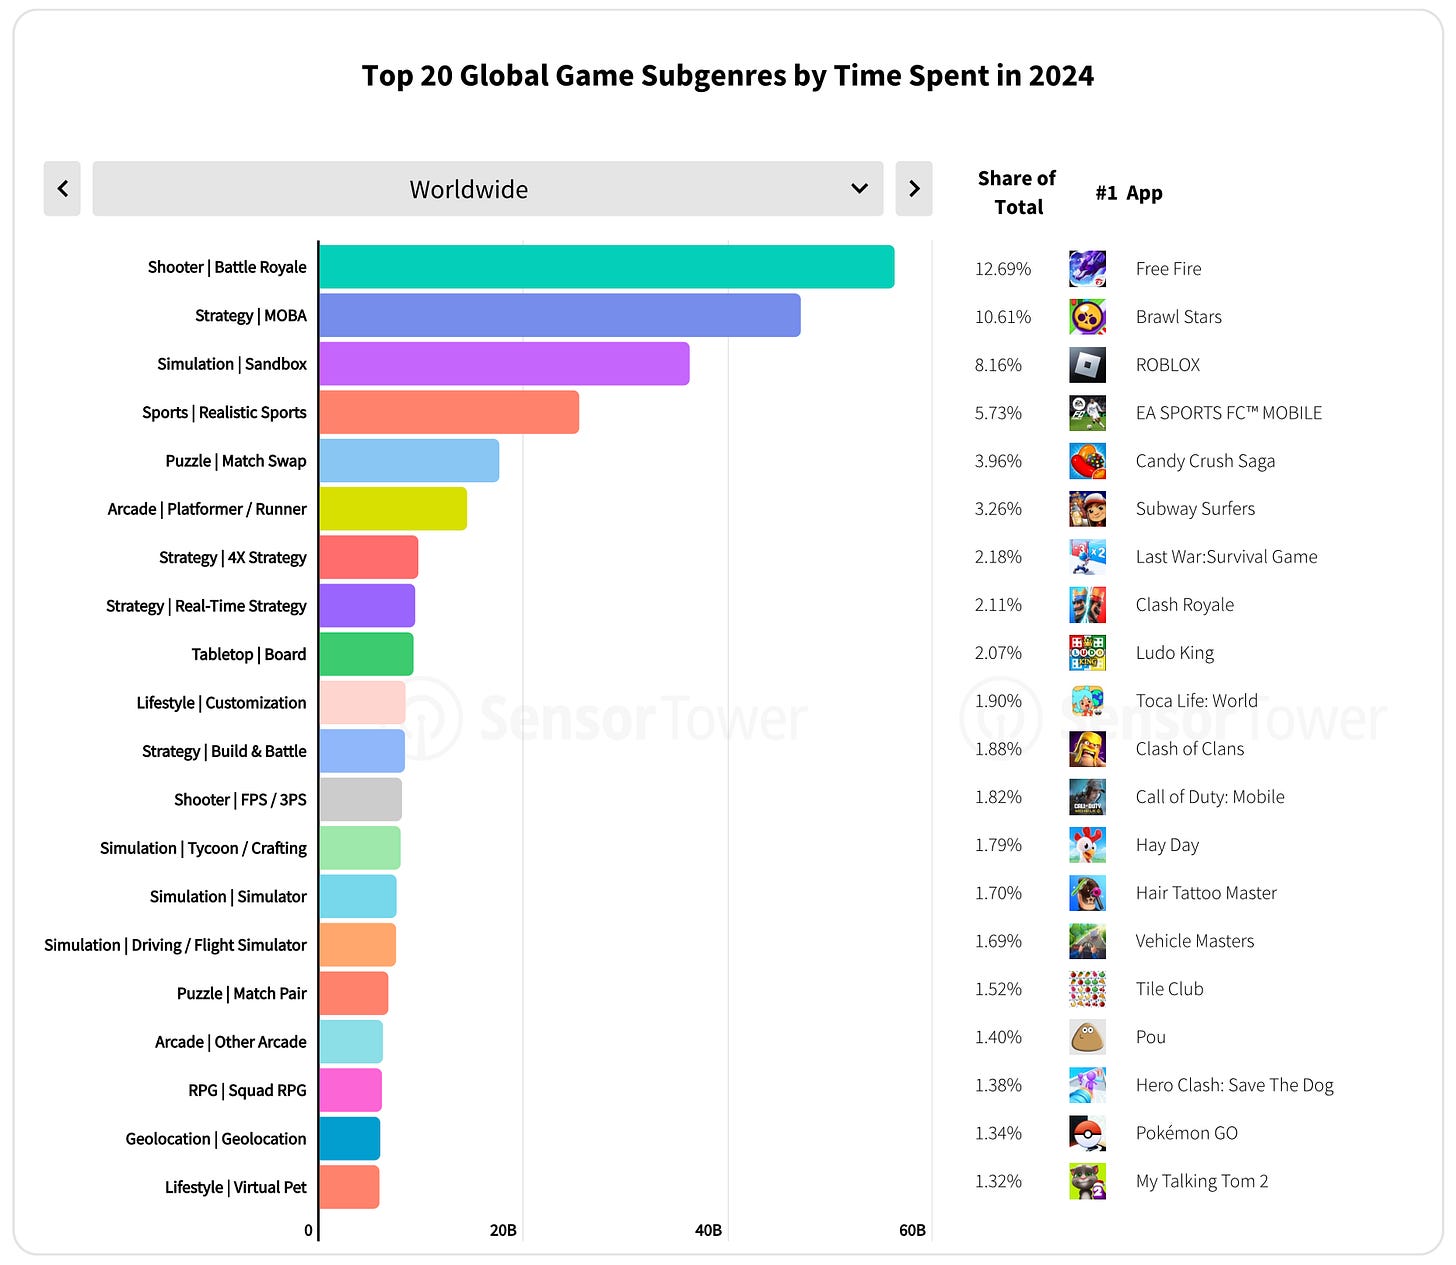
- Battle Royale (12.69% of all time in mobile games) and MOBA (10.61%) lead in terms of the amount of time users spent in them. People also spend significant time in Sandbox projects, sports games and Match.
The most successful Games & Companies in 2024
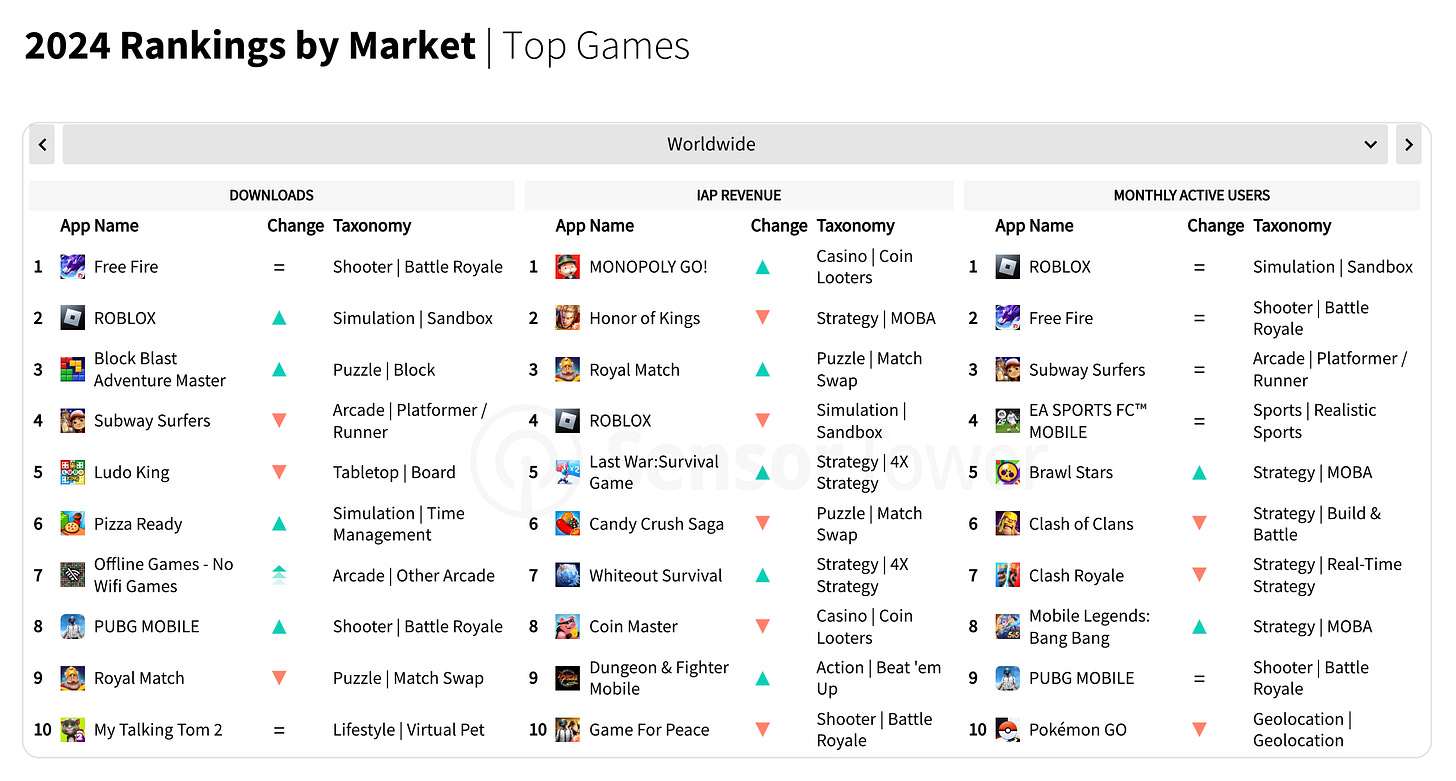
- Download Leaders - Garena Free Fire, ROBLOX, and Black Blast Adventure Master.
- IAP Revenue Leaders - MONOPOLY GO!, Honor of Kings, Royal Match.
- Top 3 by MAU - ROBLOX, Garena Free Fire, and Subway Surfers.
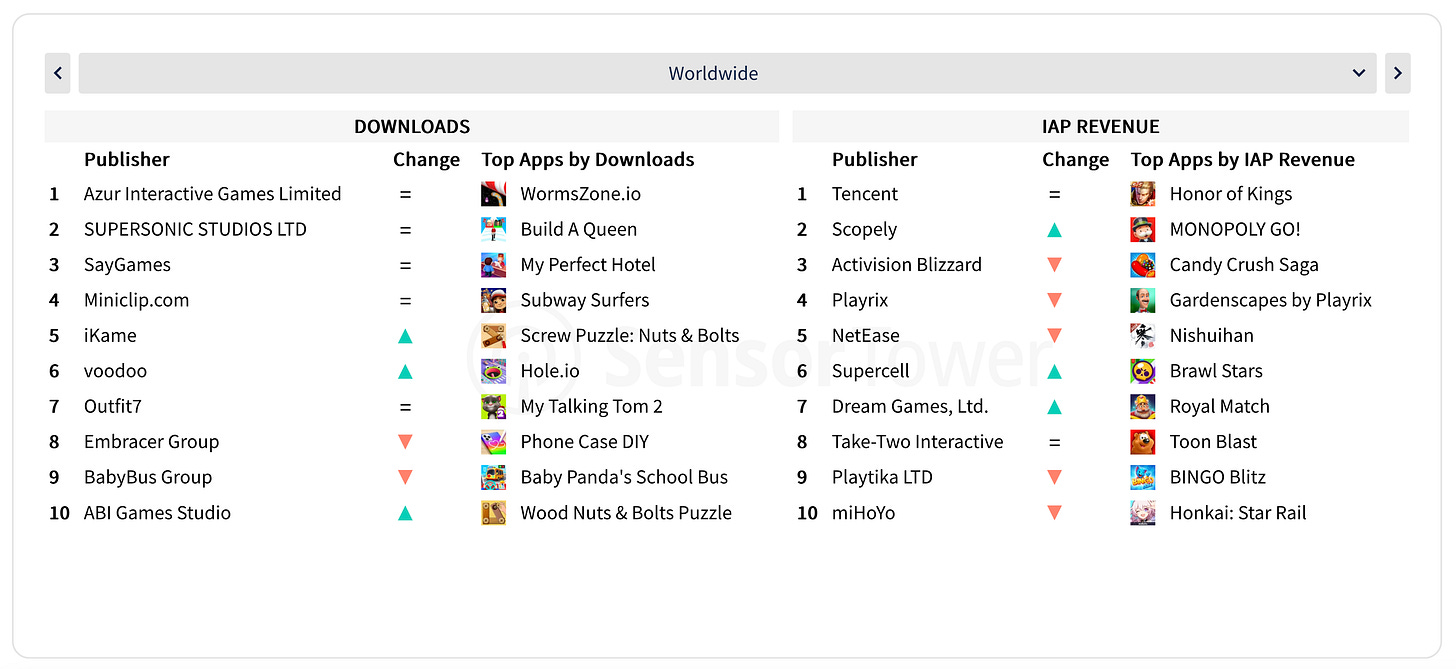
- Azur Interactive, Supersonic Studios, and SayGames - the most successful publishers of 2024 in terms of downloads. Tencent, Scopely, and Activision Blizzard earned the most.
InvestGame: Gaming Investment Market in Q4'24 and 2024

You can download the full InvestGame report here. The team is doing a fantastic job, and I highly recommend subscribing to their newsletter.
2024 results
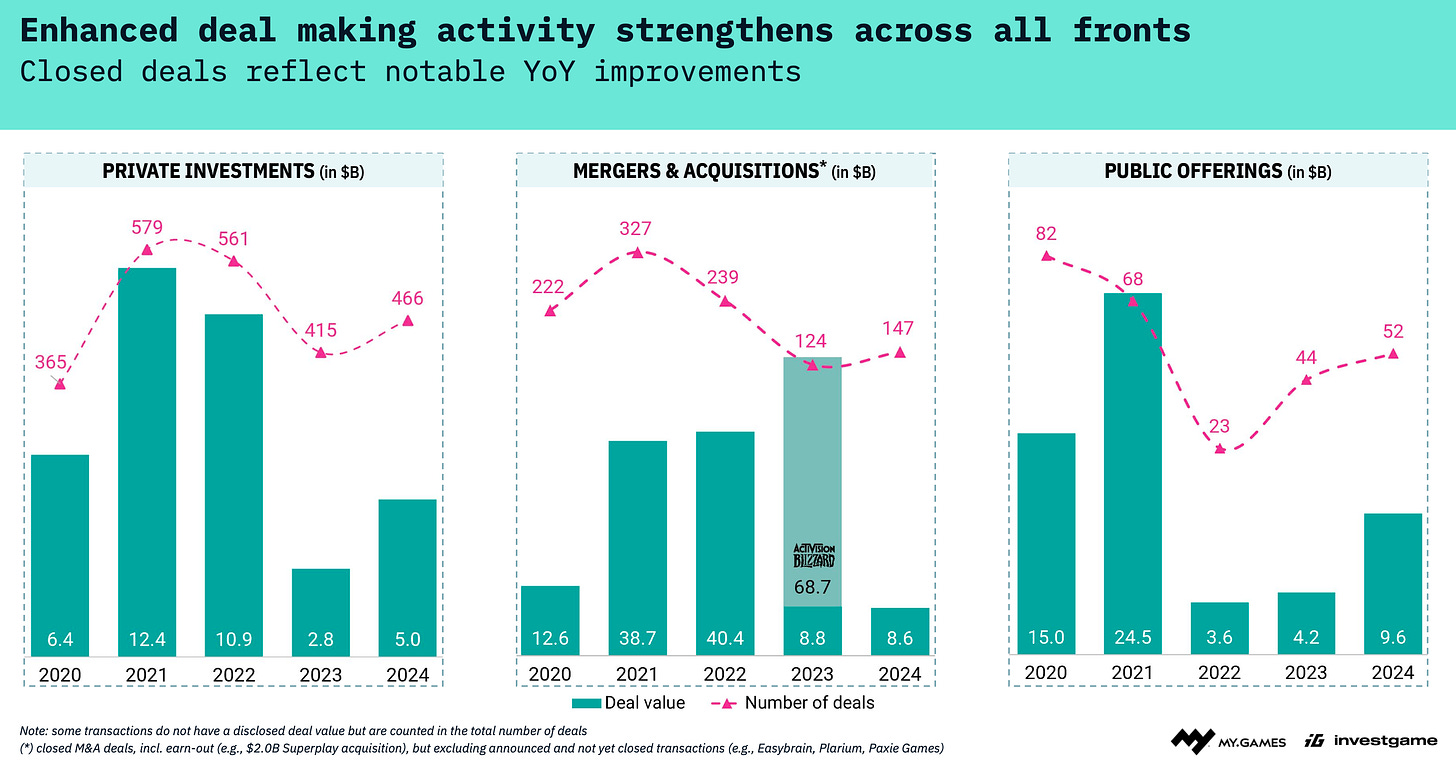
- The volume of private investments in 2024 increased compared to 2023. The total deal value was $5 billion across 466 deals.
- The number of M&A deals in 2024 increased (147 deals versus 124 in 2023). However, the transaction volume slightly decreased to $8.6 billion. If we consider the closed Activision Blizzard and Microsoft deal, the volume dropped significantly.
❗️InvestGame only accounts for closed deals, including earn-outs. Therefore, some announced but not yet closed deals (Easybrain, Plarium, Paxie Games) are not included.
- In 2024, 52 public companies made transactions (or went public). The total volume of these deals amounted to $9.6 billion. Growth in both quantity and money has continued since 2022.
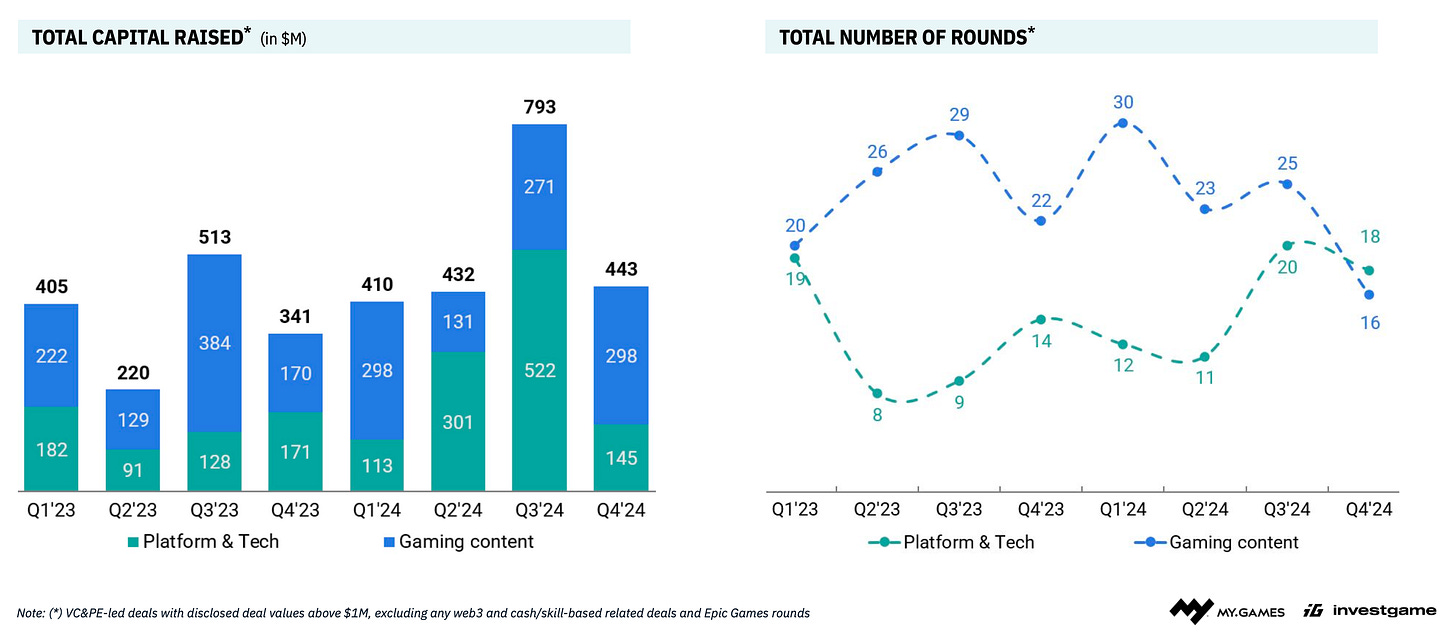
- In 2024, investor interest in platforms and technical solutions nearly doubled compared to the previous year.
- The total volume of investments in technological solutions in 2024 surpassed investments in content itself, although the total number of deals with such companies is smaller.
Private Investments in details
This section includes investments from VC funds, corporate investment funds, and PE funds.
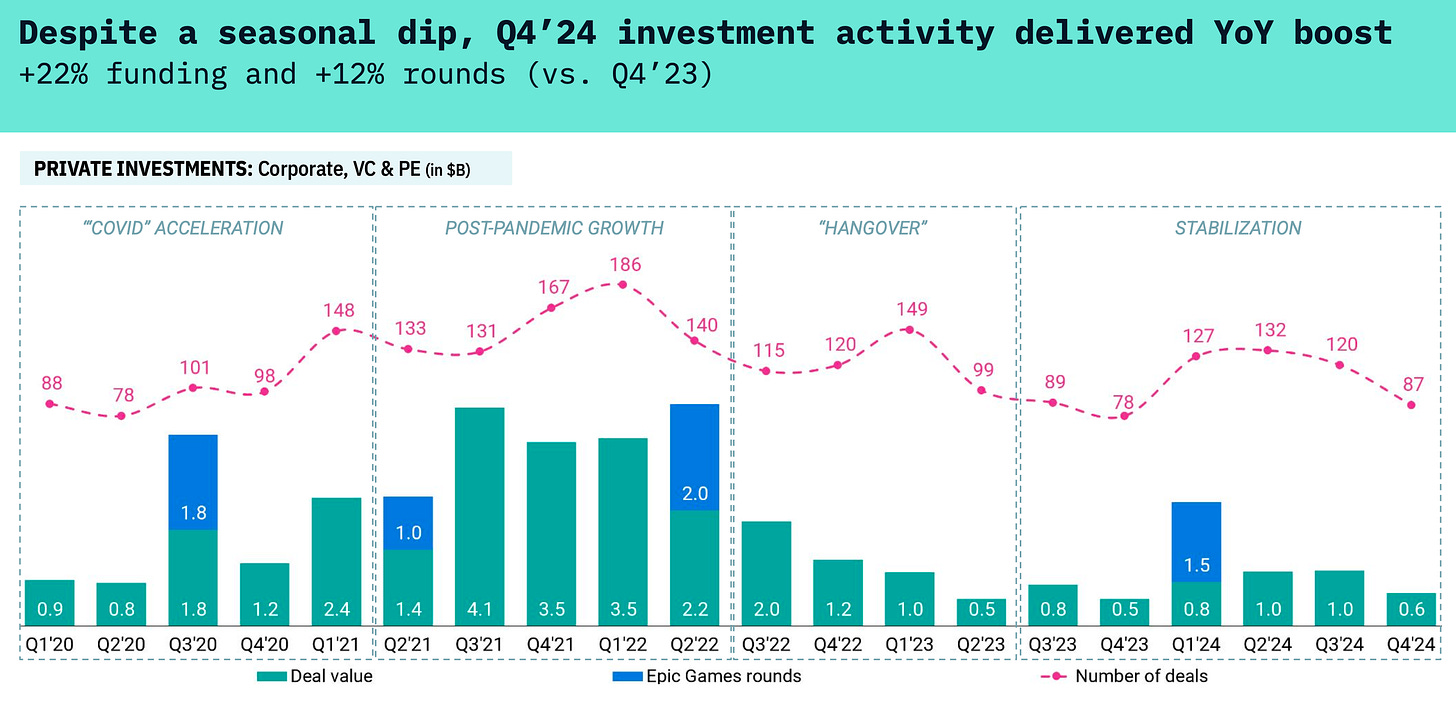
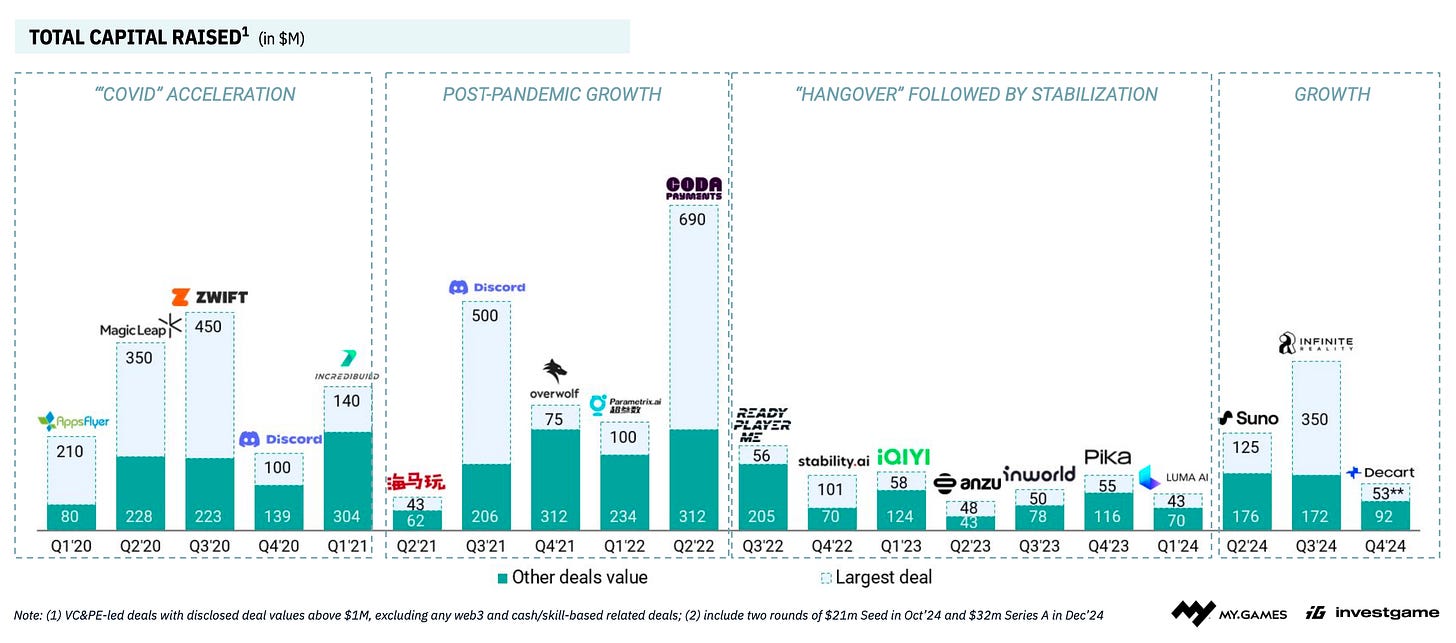
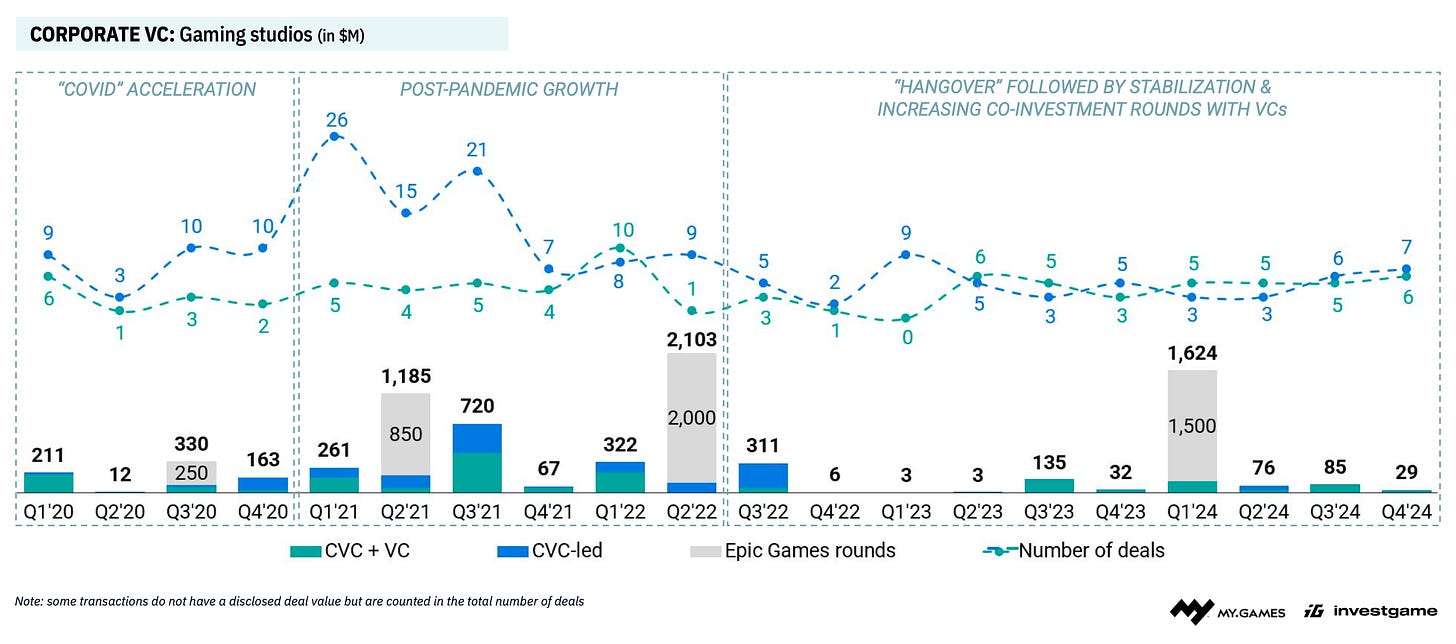
- In Q4’24, the number and volume of private deals were below the year’s average. However, growth compared to last year was 22% in deal volume and 12% in the number of rounds.
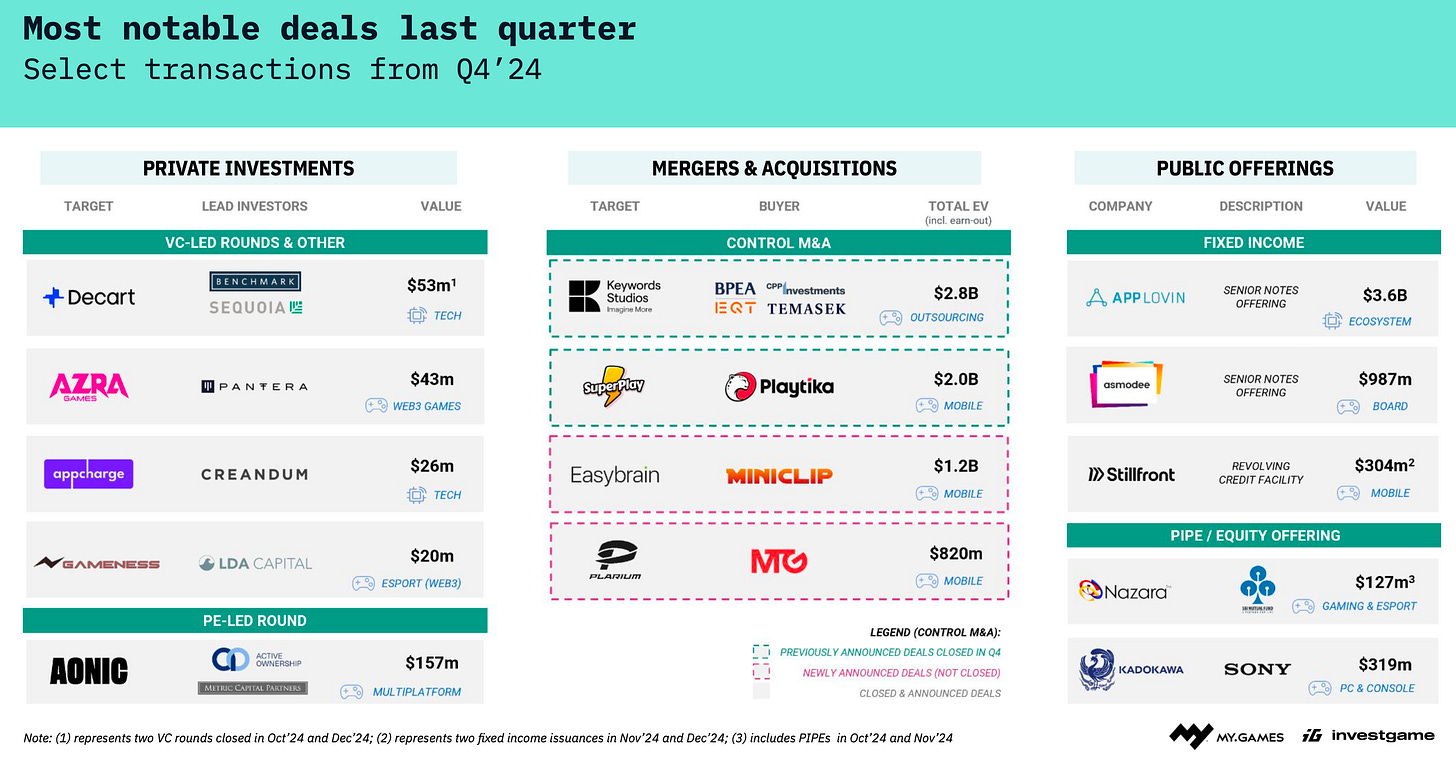
- Epic Games ($1.5 billion), Aonic ($157 million), and Build a Rocket Boy ($110 million) were the most notable deals of 2024 when it comes to game studios (Epic Games is included here as most of its revenue is generated by games).
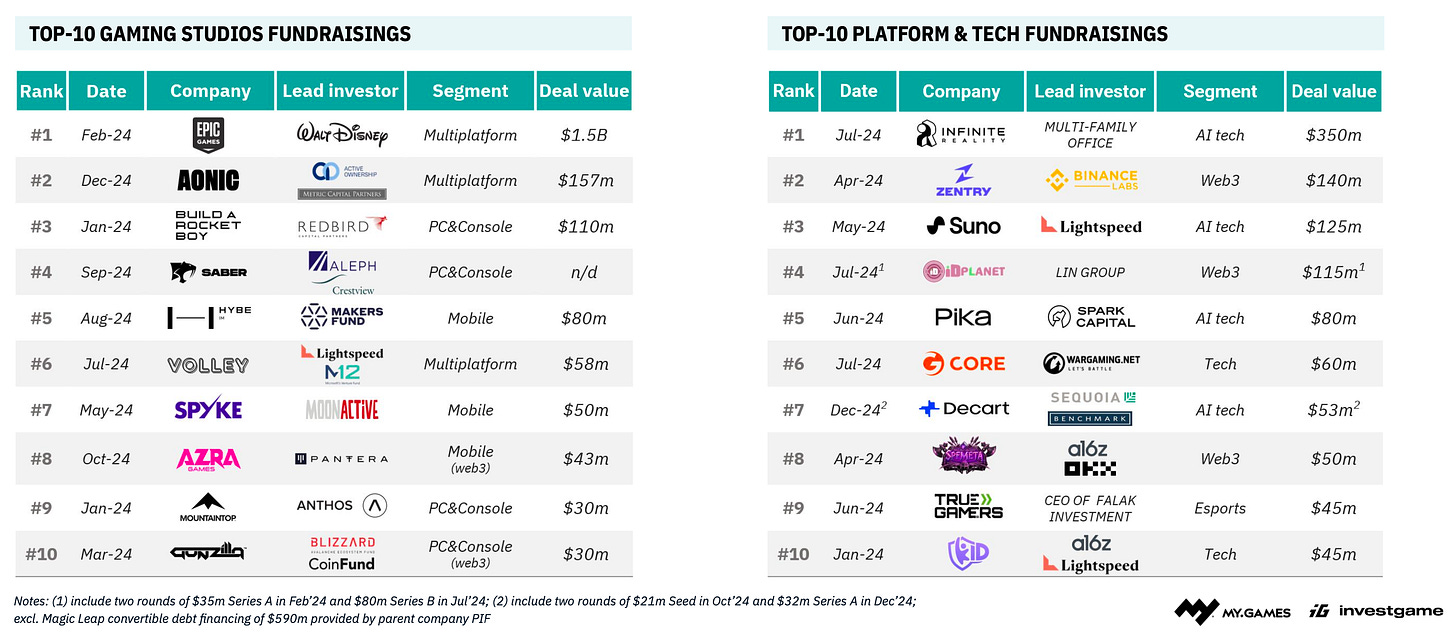
- Infinite Reality ($350 million), Zentry ($140 million), and Suno ($125 million) were the leaders in 2024 in the platforms and game technologies sector. 9 out of 10 largest deals in the list are AI or Web3 companies.
Deals with game studios
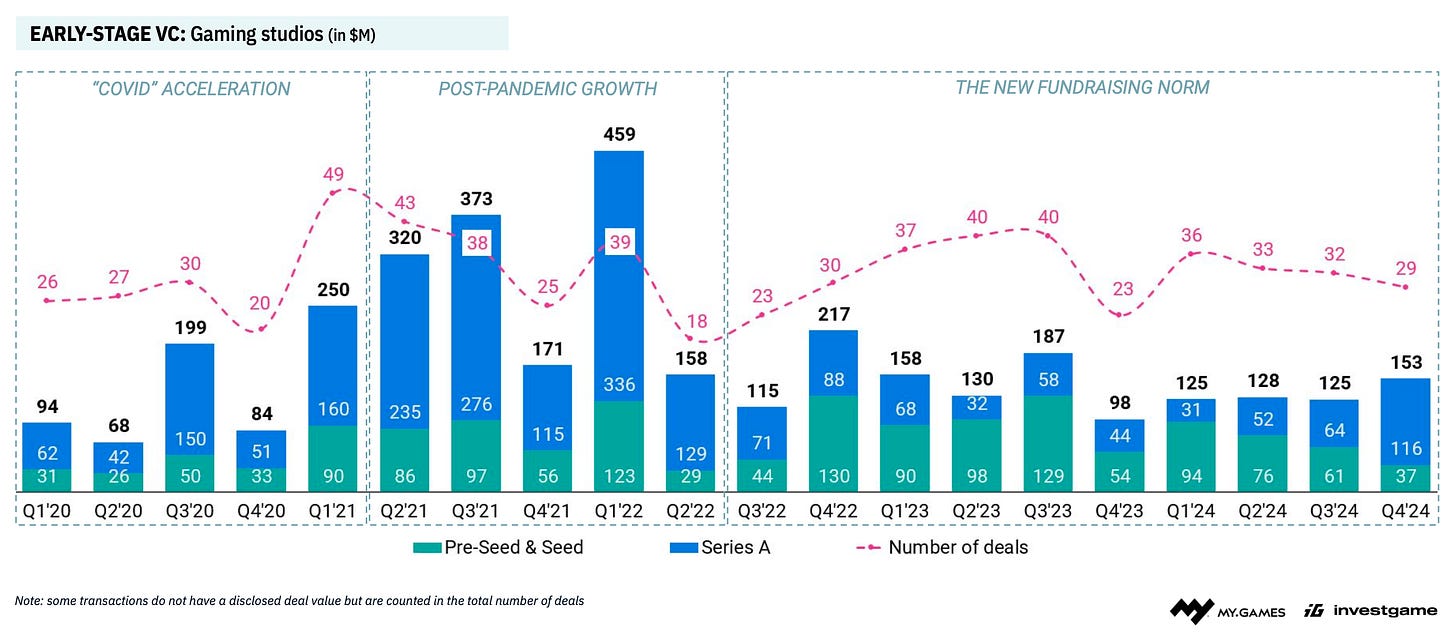
- It’s becoming more difficult for game studios to raise money in initial rounds (up to Series A). The number of deals decreased throughout 2024, while their volume plateaued.
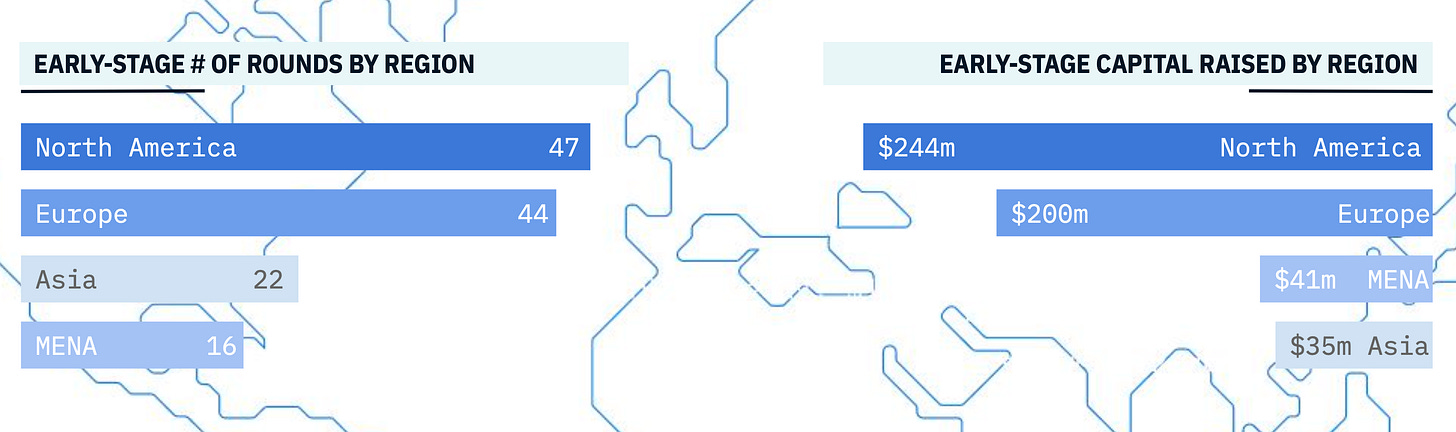
- The US (47 deals - $244 million) and Europe (44 deals - $200 million) are world leaders in financing startups at early stages among game studios.
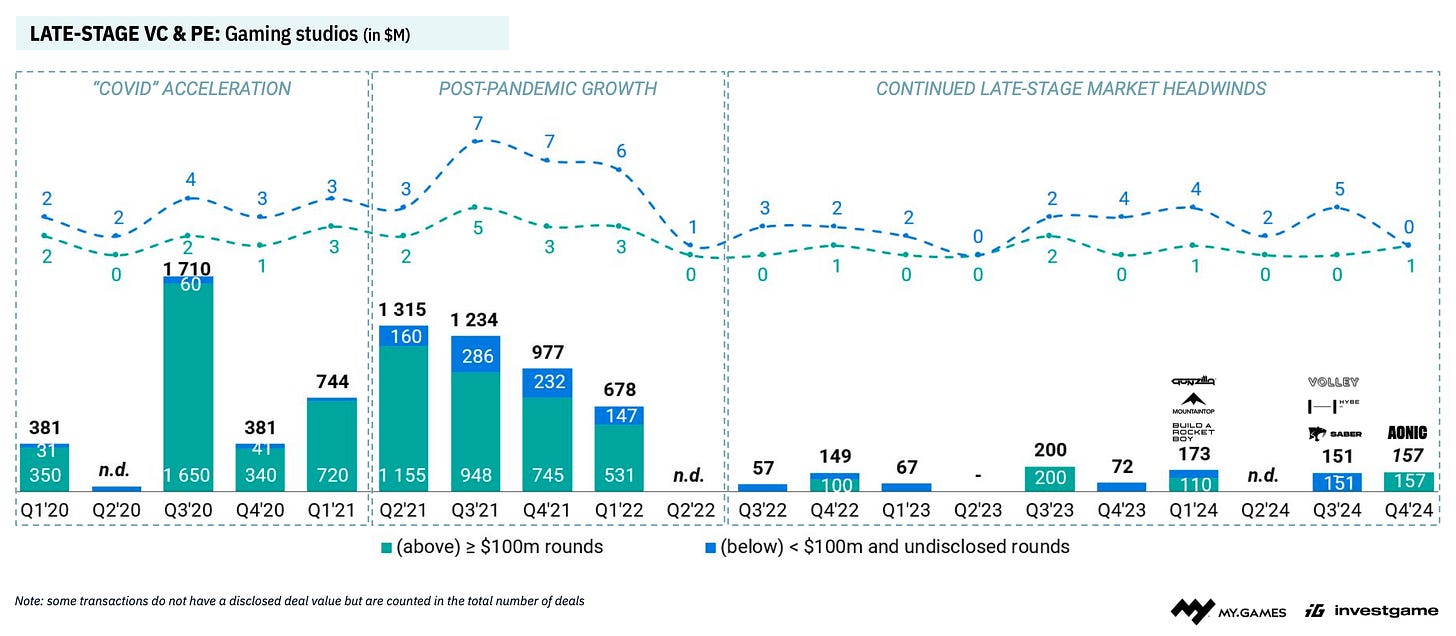
- There’s cautious optimism regarding the later stages. Compared to 2023, 30% more deals were closed, and the volume of these transactions increased by 43%. Nevertheless, InvestGame analysts note that the market remains volatile.
- Corporate VC funds have a stable interest in deals. In Q3 and Q4, the number of joint deals with traditional VC funds and deals that corporate VC funds made alone increased.
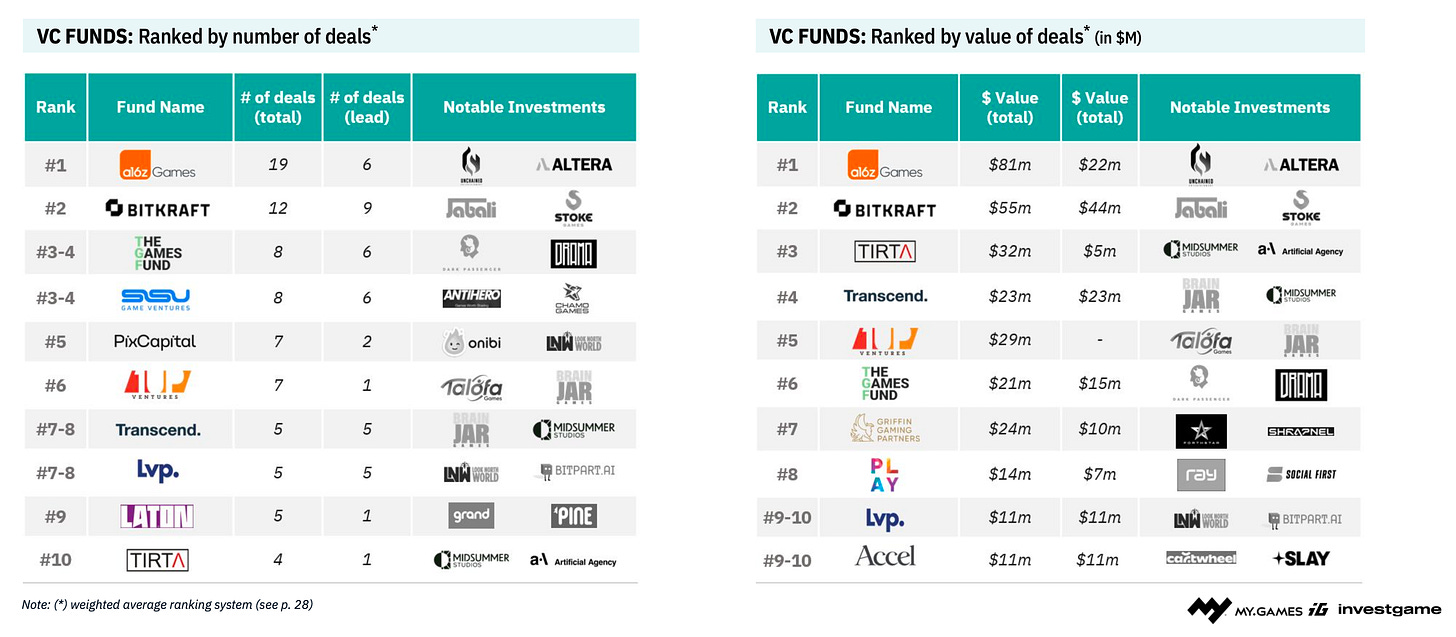
- a16z Games, Bitkraft, and The Games Fund were the most active VC funds in 2024 by the number of early-stage deals. a16z Games, Bitkraft, and Tirta Ventures are leaders in investment dollar value.
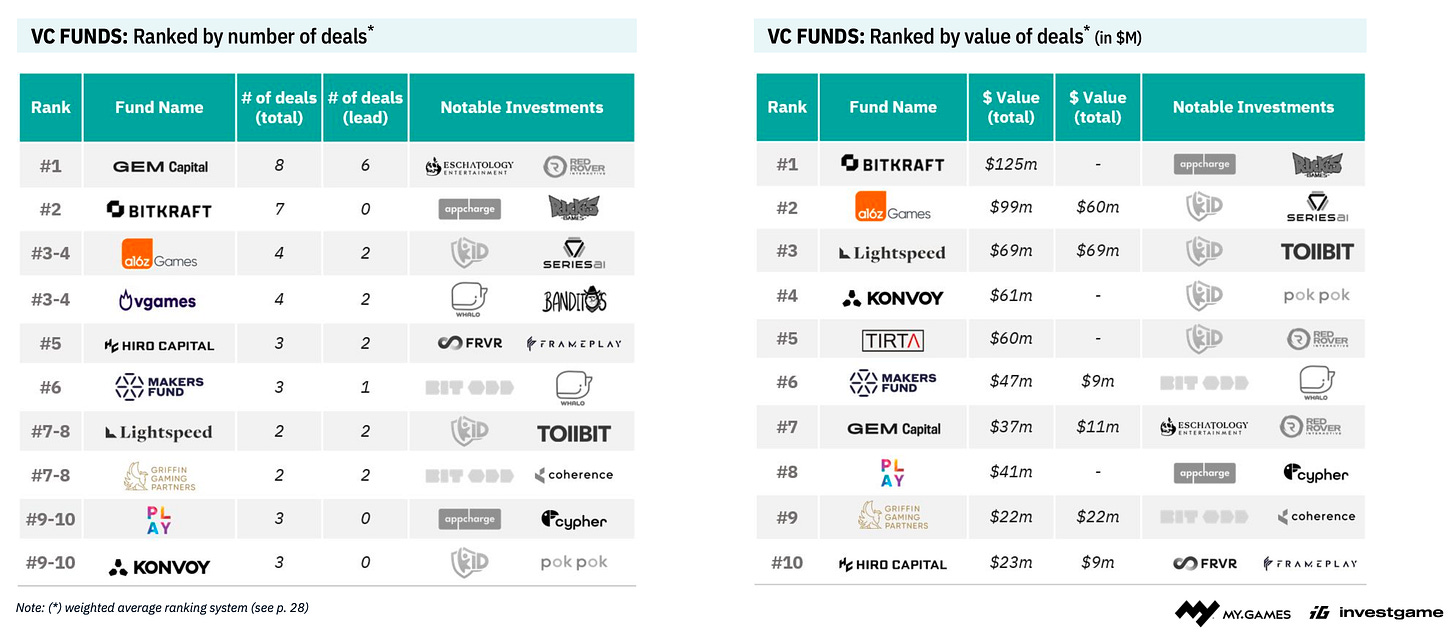
- GEM Capital, Bitkraft, a16zGames, vGames were the most active VC funds in Series A by the number of deals. In terms of deal sizes, Bitkraft, a16z Games, and Lightspeed are in the lead.
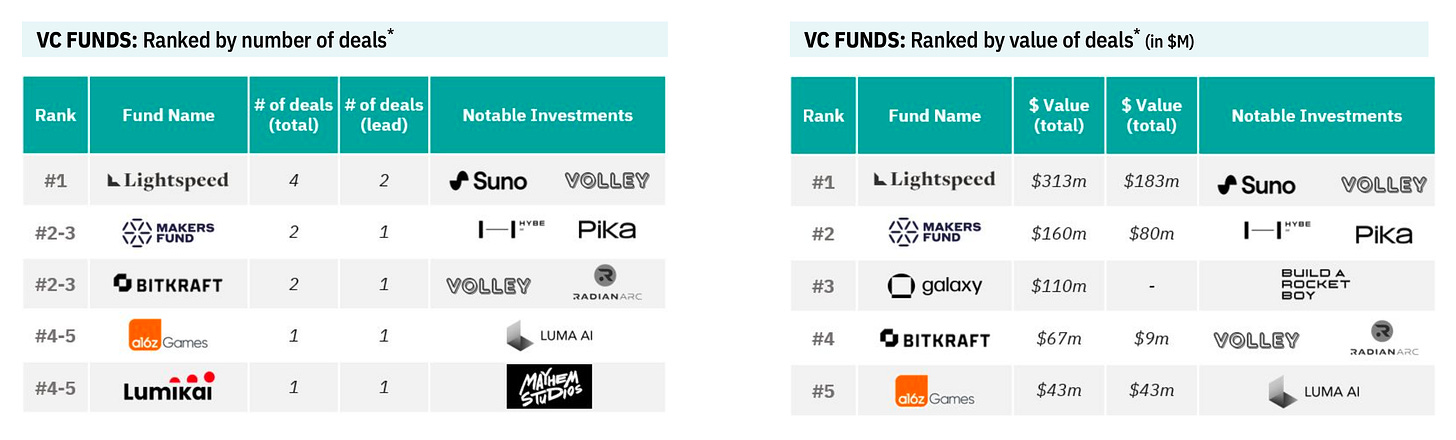
- Regarding later stages, Lightspeed, Makers Fund, Bitkraft, and Galaxy are leaders both in the number of deals and investment volume.
M&A in details
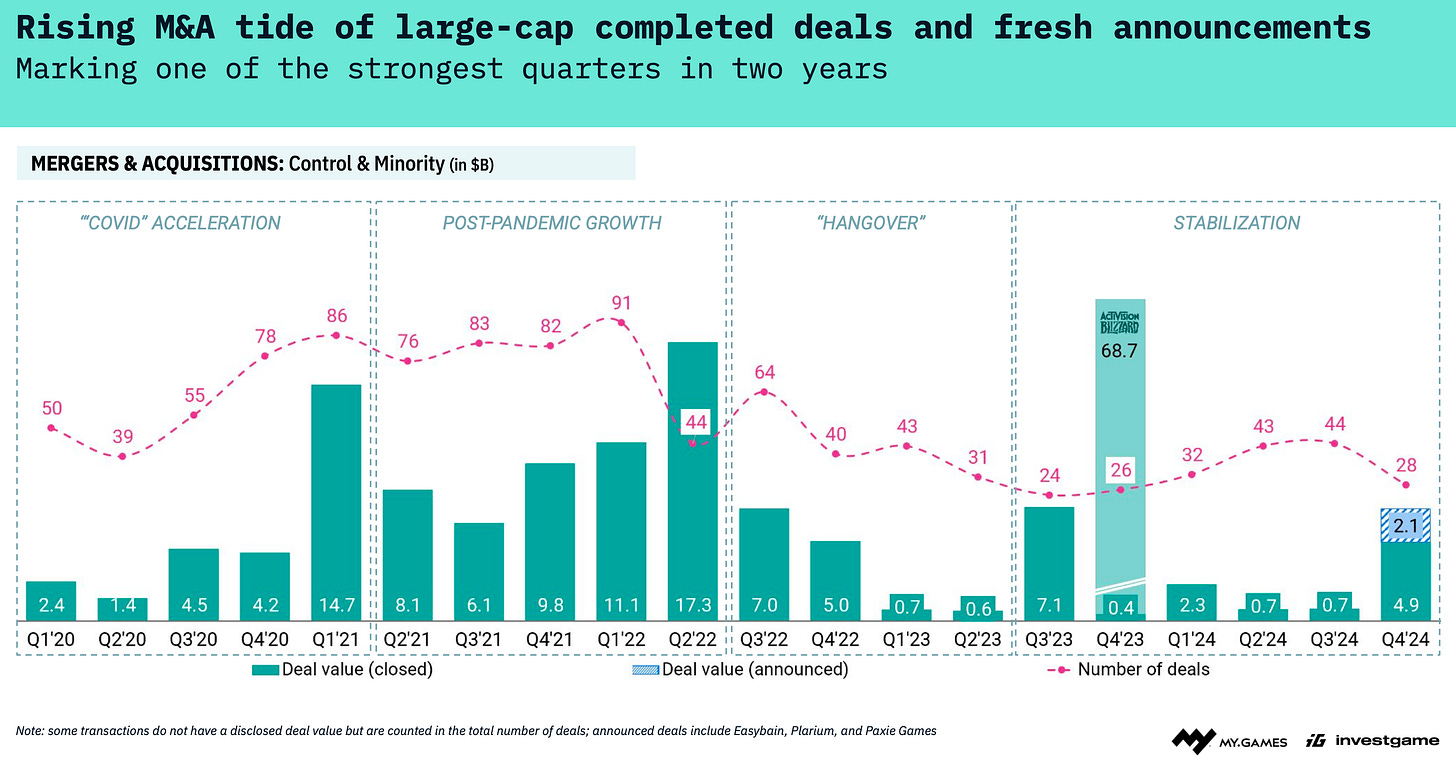
- Q4’24 became one of the most successful quarters in the last two years. There were 28 deals of $4.9 billion in total size. Deals worth $2.1 billion were also announced, which should close in 2025.
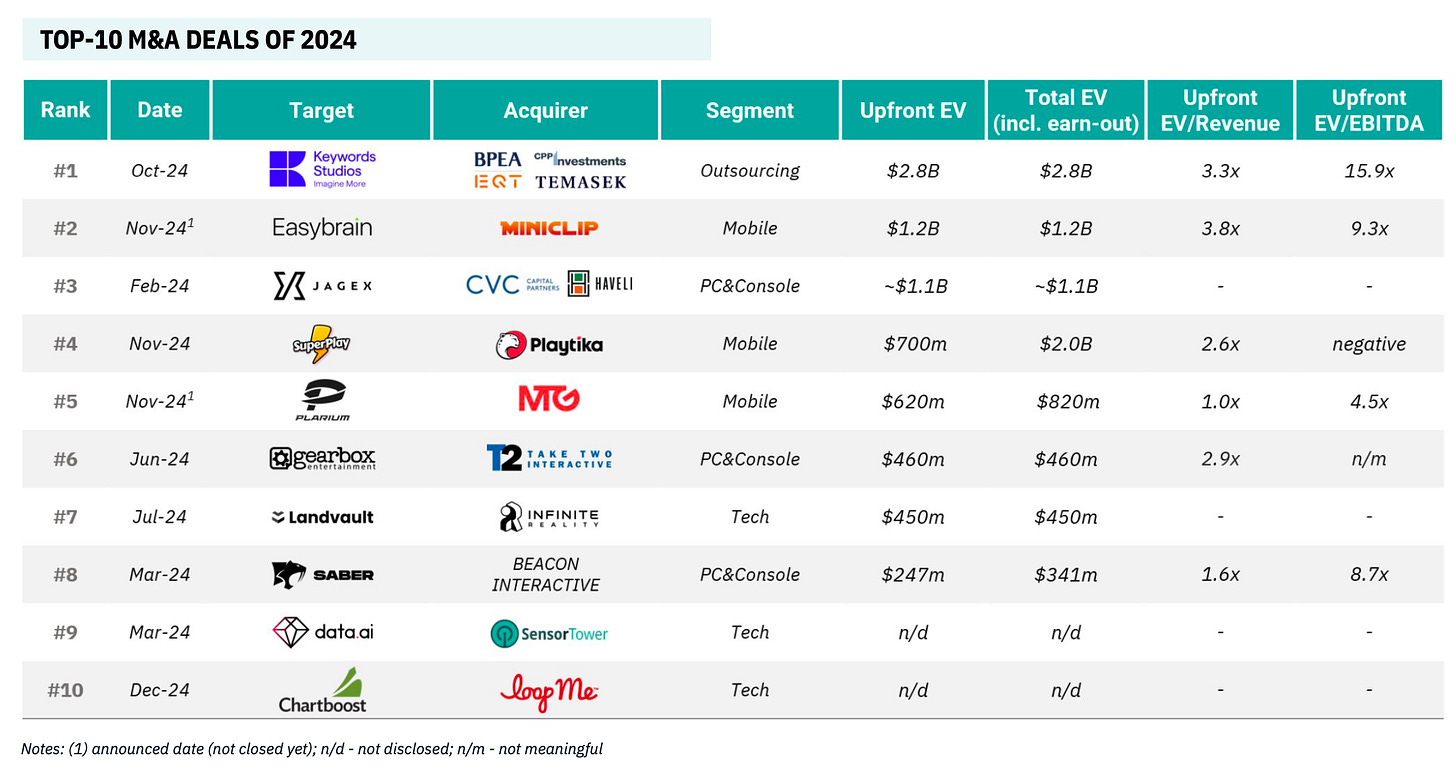
- The most notable deals of 2024 were the acquisition of Keywords Studios by a consortium of investors ($2.8 billion), the purchase of Jagex ($1.1 billion), and the acquisition of SuperPlay ($700 million). Large deals for Easybrain ($1.2 billion) and Plarium ($620 million) were also announced, but they will be closed in 2025.
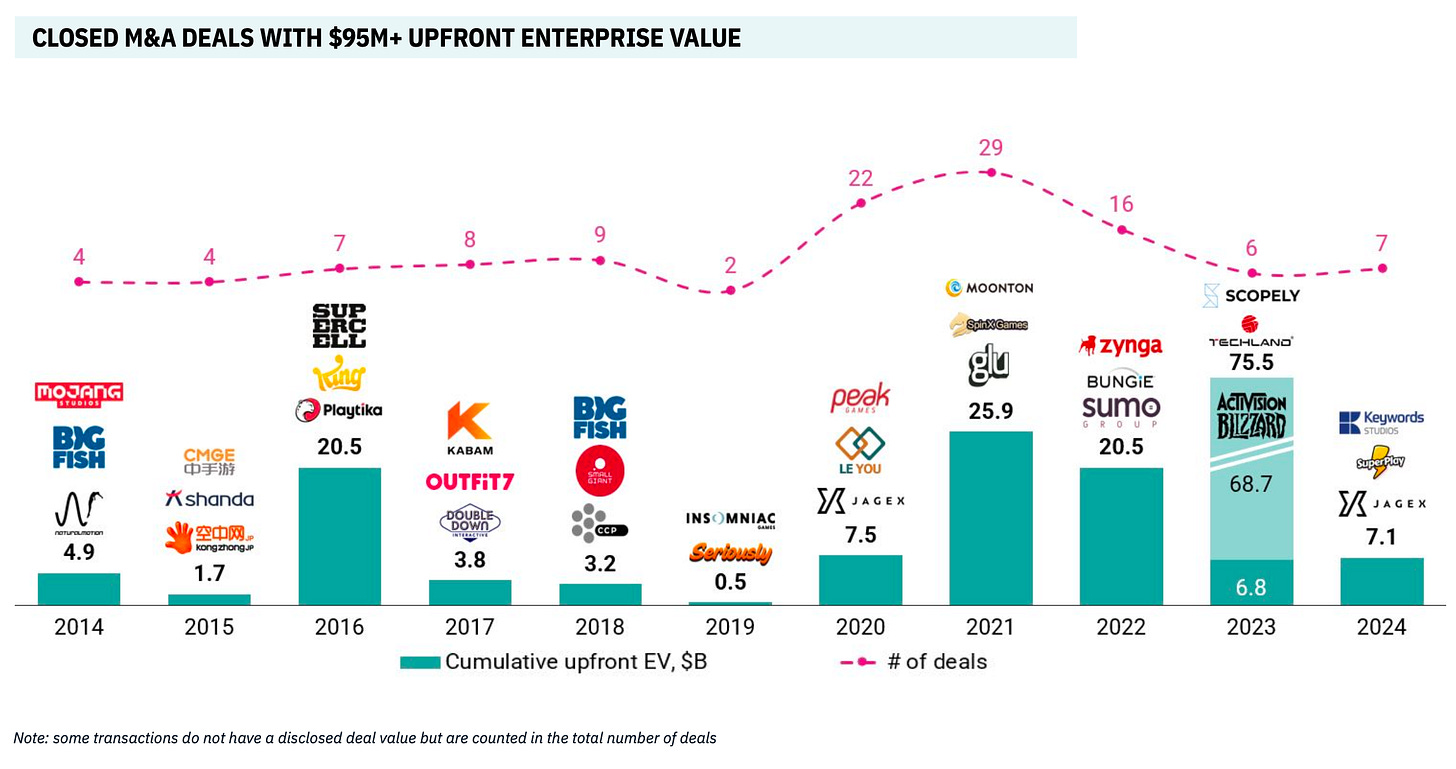
- Looking at the last decade, 2024 ranks 6th in deal volume and 6-7th in the number of deals.
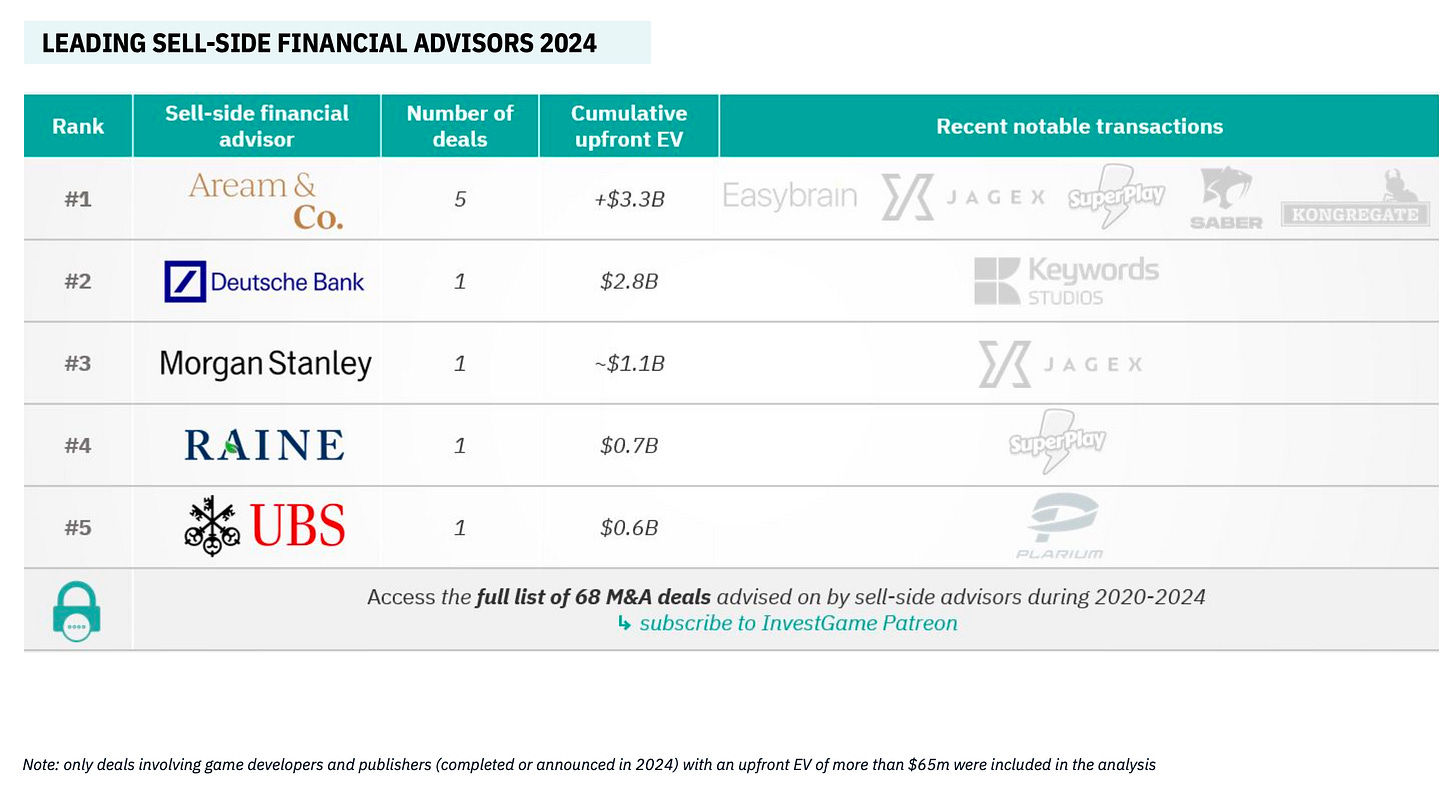
- Aream is the leader by a large margin among investment banks in the number of deals completed in 2024. The company has 5 deals with a total volume of $3.3 billion.
Public offerings in details
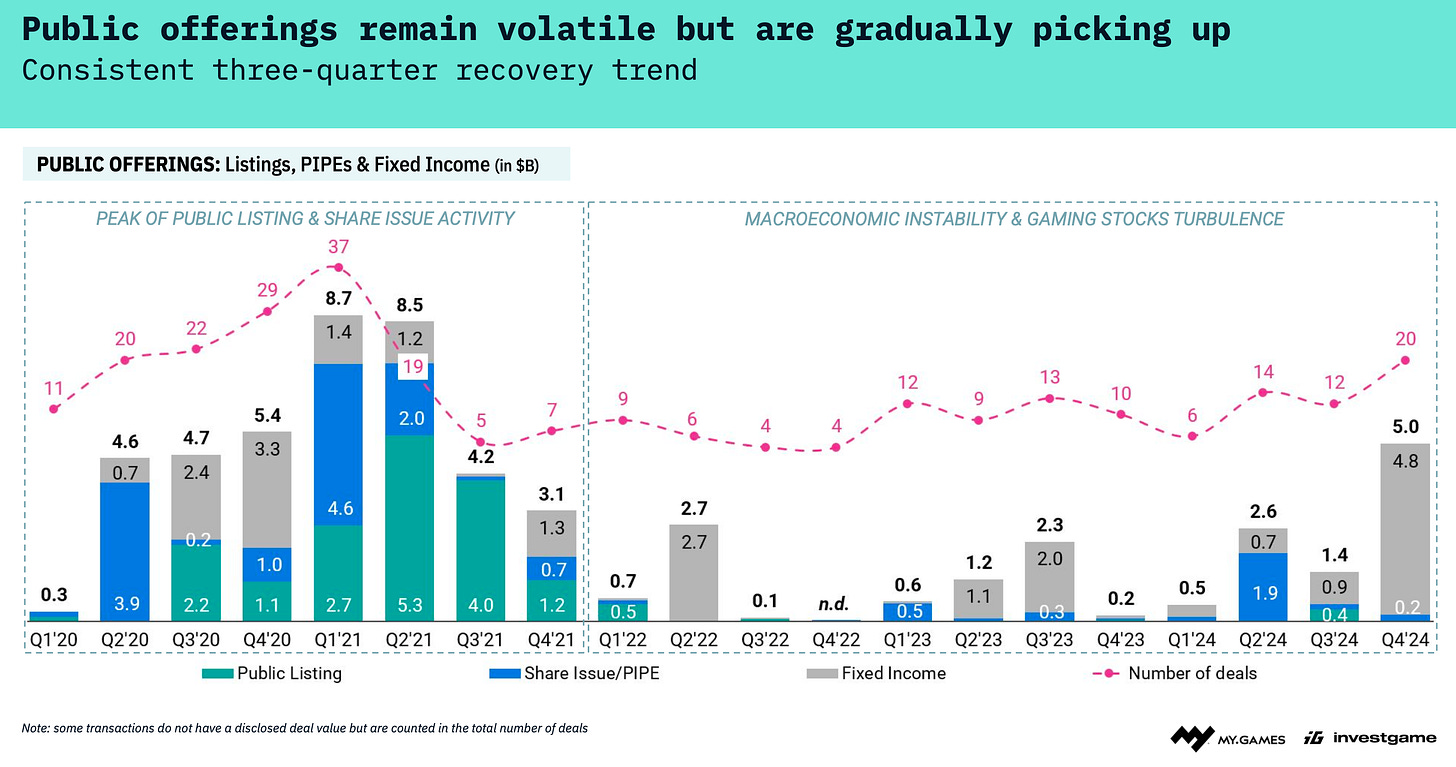
- In Q4’24, there were 20 deals related to public companies, with a total volume of $5 billion. Most of these deals ($4.8 billion) were the issuance of fixed-income debt instruments.
Stay tuned for more updates next month!
Meanwhile, you can check out our free demo to see how devtodev can help your game project succeed.