
Devtodev is helping you keep in touch with what’s happening in the game market. Every month we publish an overview of reports on the most popular games worldwide, top-grossing games, successful releases, favorite video game types, trends, etc. This overview was prepared by Dmitriy Byshonkov, the author of the GameDev Reports by the devtodev Telegram channel. You can also read the December and January reports.
Circana: The US gaming market in December'24 and entire 2024

General market condition
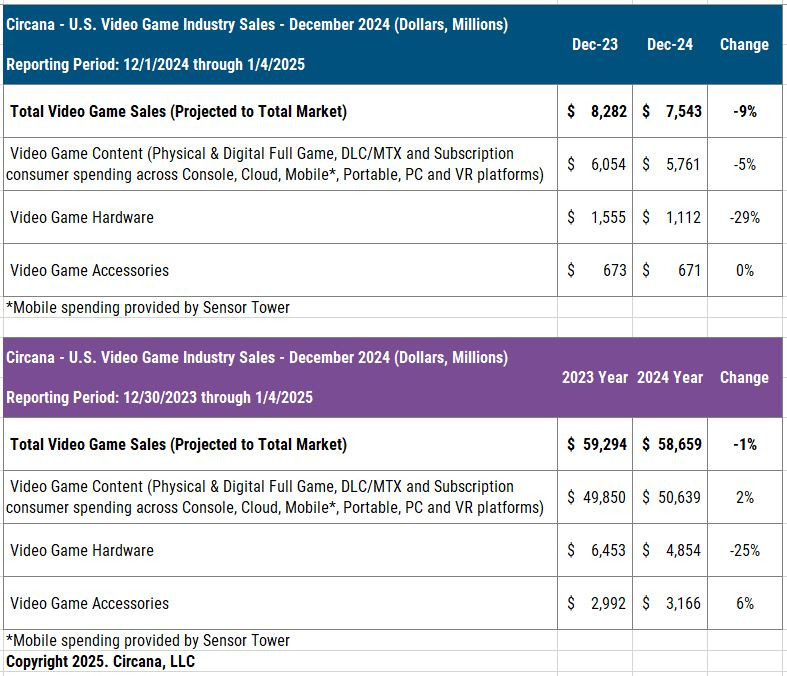
- The American gaming market in December 2024 fell by 8.9% compared to the previous year - to $7.54 billion.
- Gaming hardware sales dropped the most in December - by 29% YoY. Game sales fell by 5% YoY; by segments - console games fell by 21%, mobile games fell by 1%, and PC games grew by 13%. Revenue from subscription services also increased by 11%.
- PlayStation 5 sales in December fell by 18% compared to December 2023. The situation is even worse for Xbox Series S|X and Nintendo Switch - sales decreased by 38%. PlayStation 5 became the most successful console in December and 2024 overall, with Nintendo Switch in second place.
- After the first 50 months on the American market, PlayStation 5 is outpacing PS4 in the number of systems by 7%. And Xbox Series S|X is behind Xbox One by 18%.
- 49% of PlayStation 5 and 43% of Xbox Series S|X sold in December did not have a disc drive. In 2024, 45% of all PS5 purchased were without a disc drive and 44% of all Xbox Series S|X.
- User spending on accessories in December remained almost unchanged - $671 million. PlayStation Portal became the most successful accessory both in December and throughout 2024, in terms of dollar sales. 4% of the PlayStation 5 audience in the US bought the accessory.
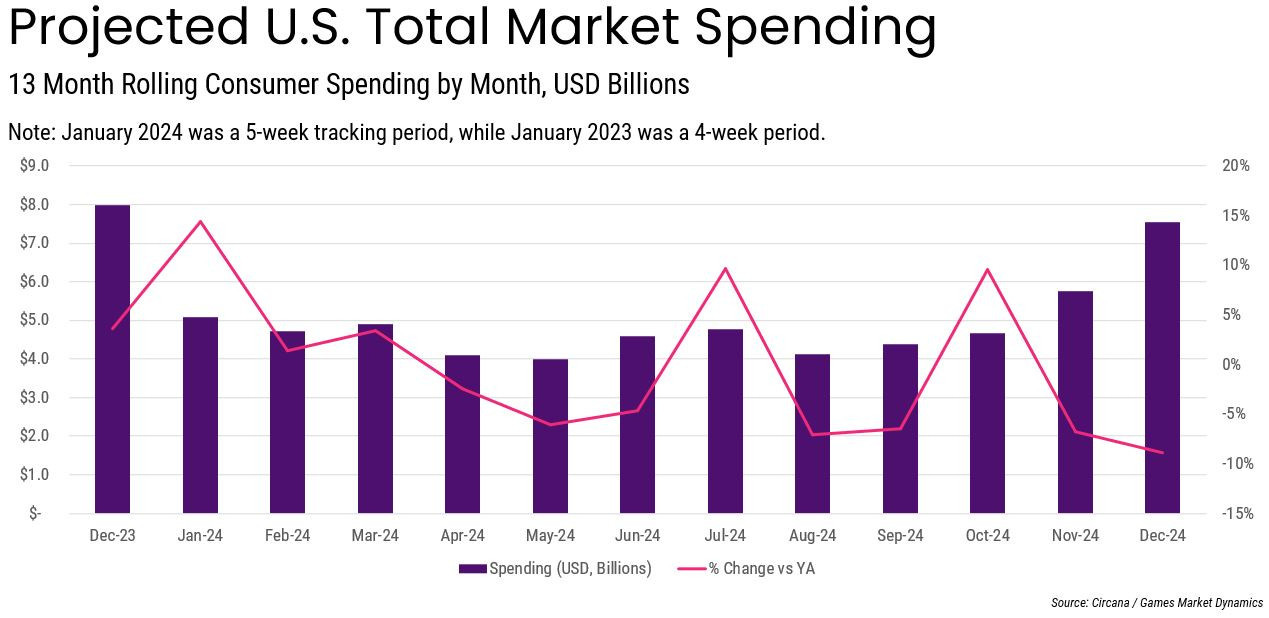
- In 2024, the American gaming market also declined. The decrease was 1.1%, with a total volume of $58.7 billion.
- The volume of spending on gaming content in 2024 increased by 2% compared to 2023 and reached $50.6 billion. It was only higher in 2021 ($52 billion). Growth across all categories, except for console game sales (this segment fell by 11% in 2024).
- In 2024, user spending on gaming subscriptions increased by 4%. Most of the growth, it seems, comes from Game Pass.
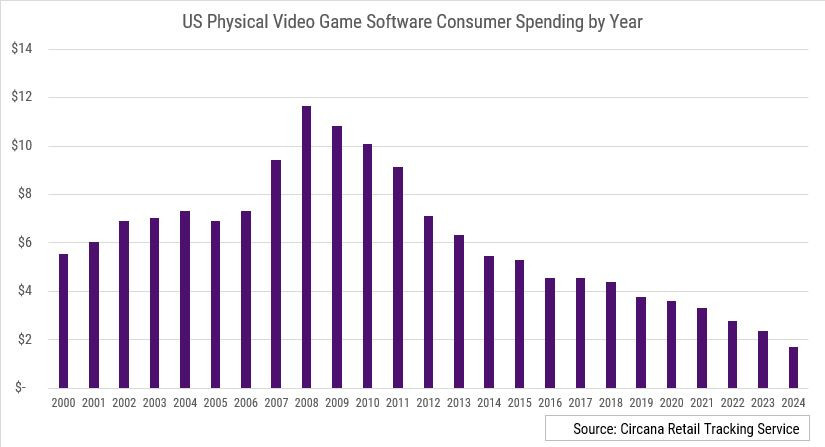
- Spending on physical copies of games in the US is actively declining. The decrease compared to 2008 (peak year) in 2024 is 85%.
- Total spending on gaming hardware by the end of 2024 decreased by 25% - to $4.85 billion.
- PlayStation 5 is now in 3rd place in terms of hardware sales revenue. Only Nintendo Switch and Xbox 360 are ahead. At the same time, in terms of the number of systems sold, the console is in 11th place.
- Spending on gaming accessories in 2024 in the US increased by 6% to $3.16 billion. The best-selling accessory in units is DualSense.
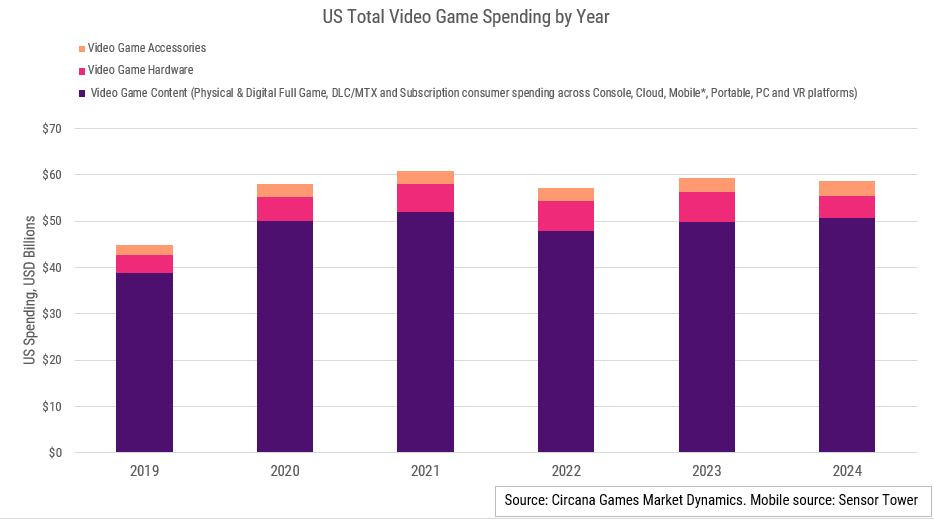
- In fact, the American gaming market has been on a plateau since 2020. However the jump in revenue from 2019 to 2020 outpaced the normal growth by far.
Game Sales
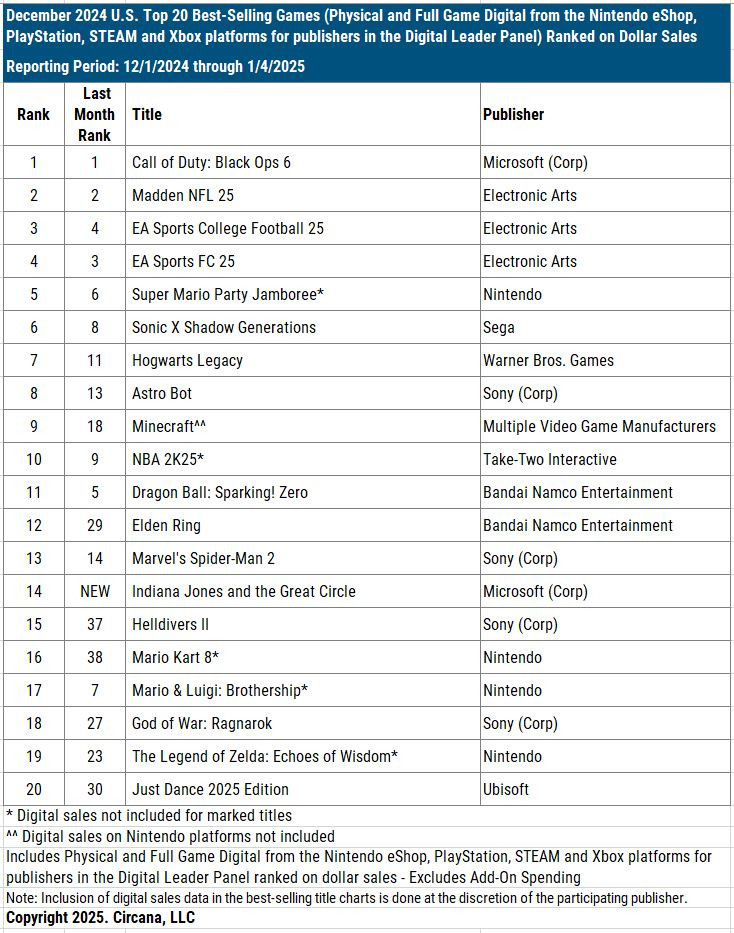
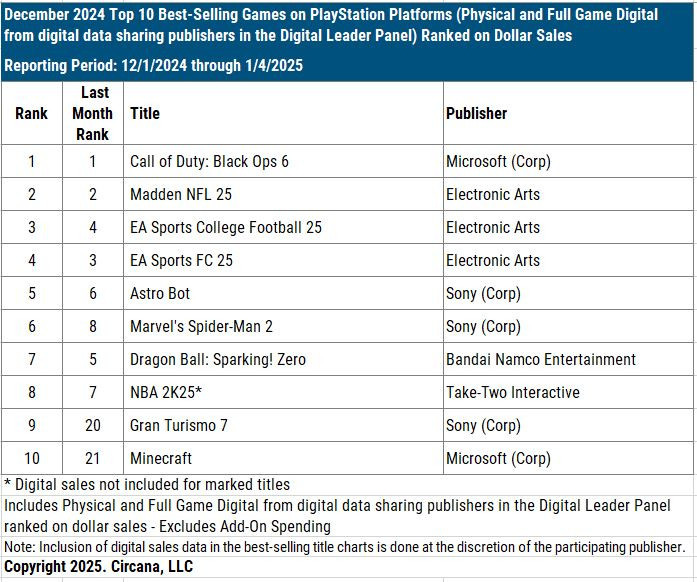
- Call of Duty: Black Ops 6, Madden NFL 25, and EA Sports College Football 25 are the most successful games in December in terms of dollar revenue.
- Indiana Jones and the Great Circle is the only December release that made it into the top 20 in revenue. The game took 14th place. At the same time, despite appearing in Xbox Game Pass at launch, the game is in 4th place in Xbox sales in December.
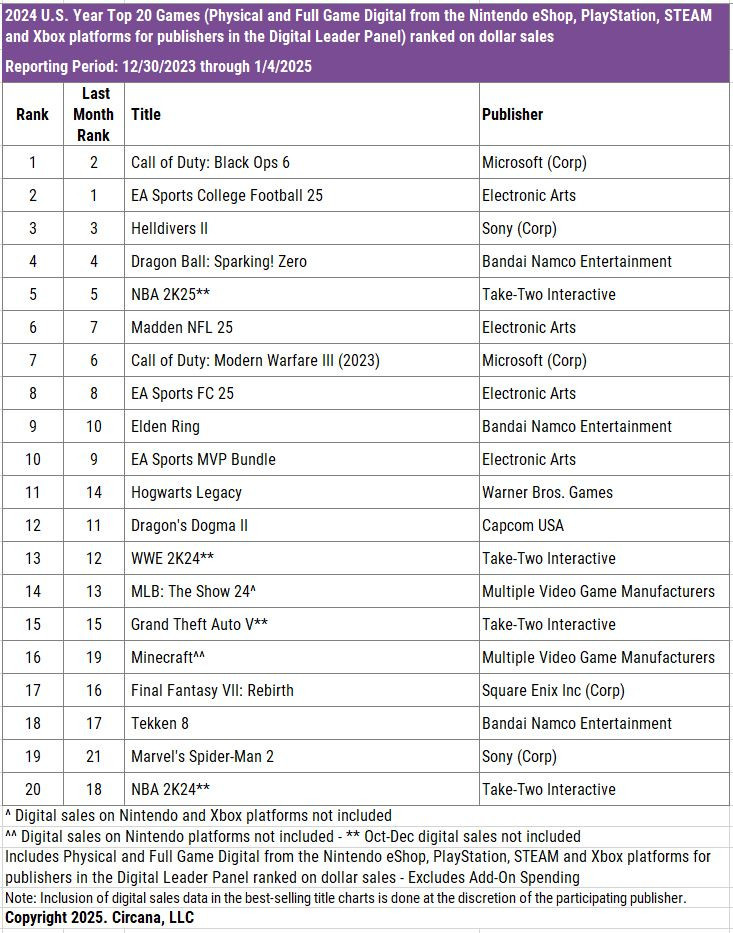
- Call of Duty: Black Ops 6, EA Sports College Football 25, and Helldivers II became the best-selling games of the year. The Call of Duty series remains the revenue leader in the American market for the 16th year in a row. And EA Sports College Football 25 is the best-selling sports game in US history, if measured by dollar revenue.
- MONOPOLY GO!, Roblox, and Royal Match became the highest-earning games in the US in December 2024. The data was shared by Sensor Tower. Roblox (+24% revenue compared to November) and Call of Duty: Mobile (+20% revenue compared to November) showed strong growth.
Platform rankings for 2024
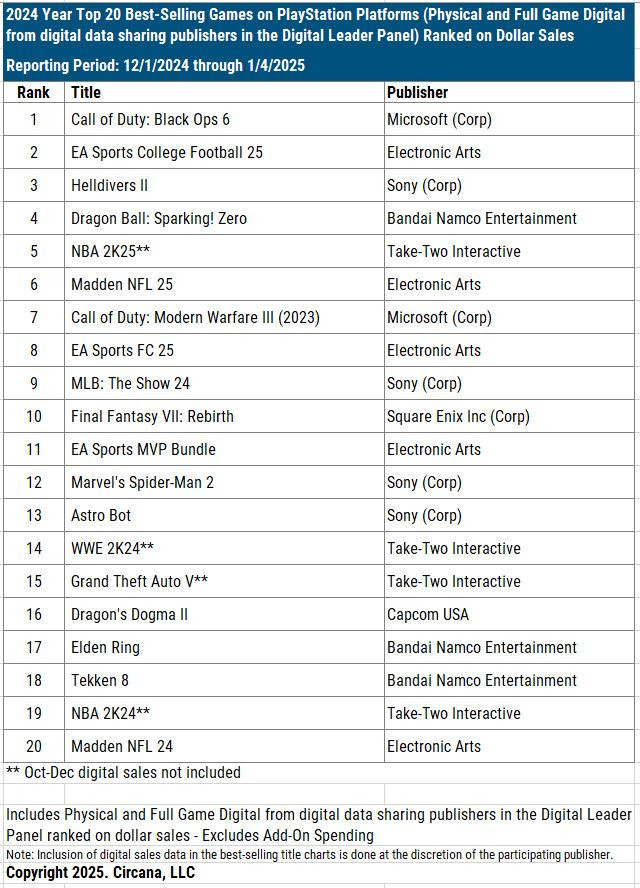
- Top 5 in sales on PlayStation in 2024 - Call of Duty: Black Ops 6, EA Sports College Football 25, Helldivers II, Dragon Ball: Sparking! Zero, and NBA 2K25 (for which digital sales in November-December are not accounted for). The latest hit from PlayStation - Astro Bot - is in 13th position.
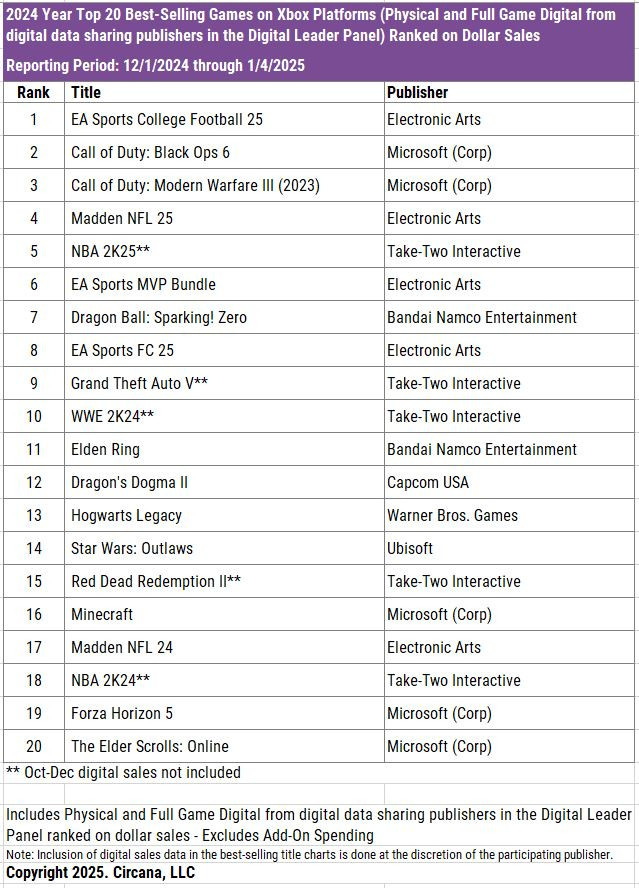
- On Xbox, the leaders are almost similar - EA Sports College Football 25, Call of Duty: Black Ops 6, Call of Duty: Modern Warfare III, Madden NFL 25, and NBA 2K25 (again - without digital sales in November-December).
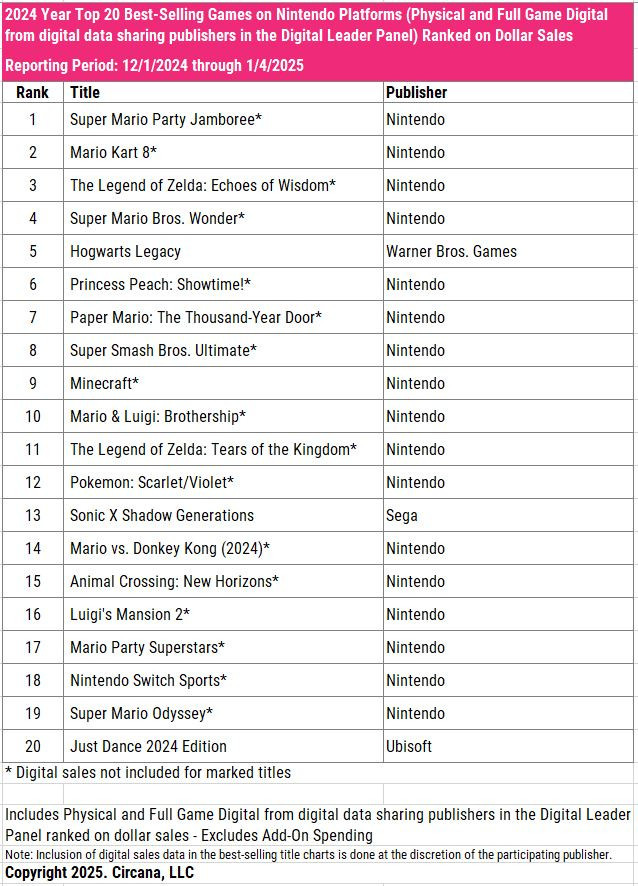
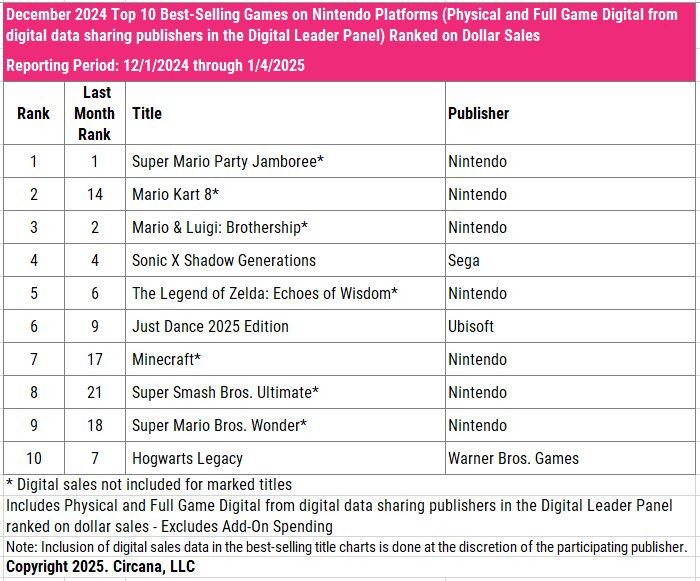
- Super Mario Party Jamboree, Mario Kart 8, The Legend of Zelda: Echoes of Wisdom, Super Mario Bros. Wonder, and Hogwarts Legacy are the best-selling games on Nintendo Switch in 2024 in the US. It's important to note that for all Nintendo games, only physical copy sales are accounted for. And in the top 20 - only 3 games released by third-party developers.
Platform rankings - December 2024
-
The top 3 on PlayStation and Xbox by revenue are the same - Call of Duty: Black Ops 6, Madden NFL 25, and EA Sports College Football 25. On Xbox, a newcomer appeared - Indiana Jones and the Great Circle.
- Marvel Rivals burst into the December PlayStation charts by MAU. The game took 3rd place on both platforms. On Xbox, Indiana Jones and the Great Circle also ranked 4th.
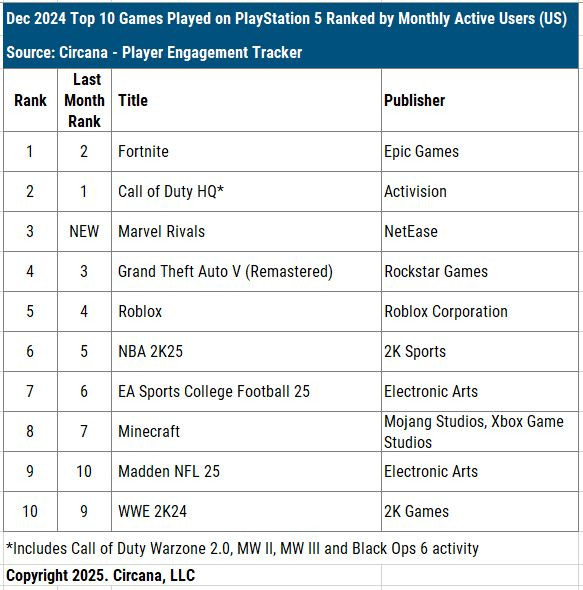
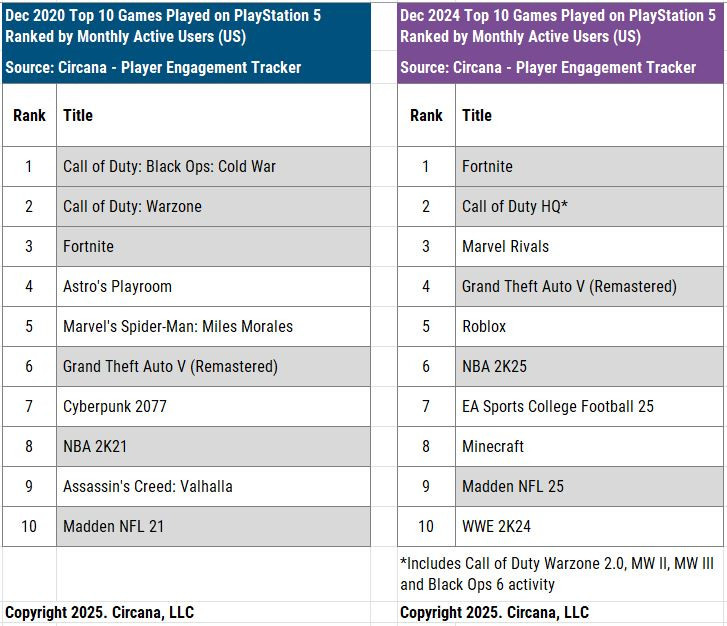
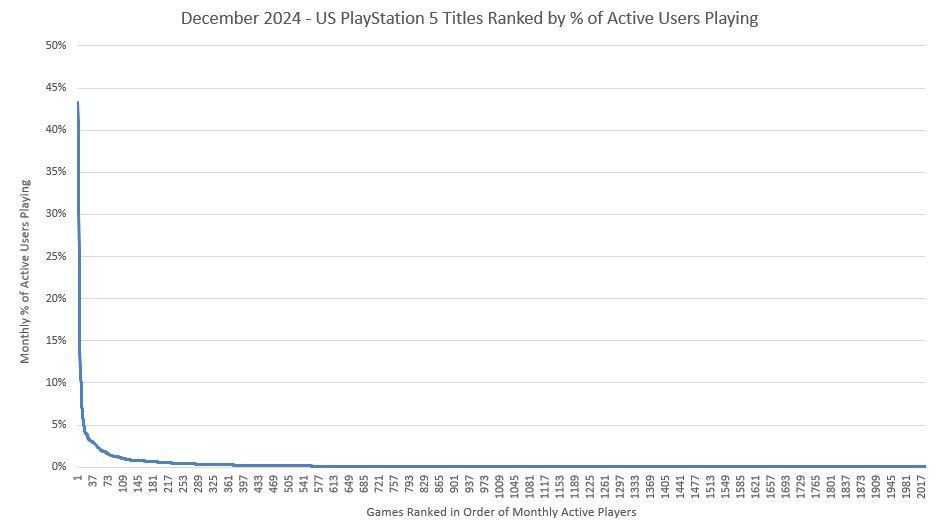
- Mat Piscatella (Circana’s Executive Director, Video Games and segment analyst) showed an interesting comparison of the top MAU chart for December 2020 and 2024 on PlayStation. Look at how many major annual franchises are on the list.
- Mat also showed the distribution by active users on PlayStation in December 2024 to demonstrate how difficult it is for new games to launch. "Your new soda didn't flop because the can was the wrong color or the ads weren't great. Your new soda flopped because Coke and Pepsi suffocated them.". The analyst notes that more than 60% of players in the US buy a new game once every six months - or less frequently.
- The most successful games in December on Nintendo Switch are Super Mario Party Jamboree, Mario Kart 8, and Mario & Luigi: Brothership.
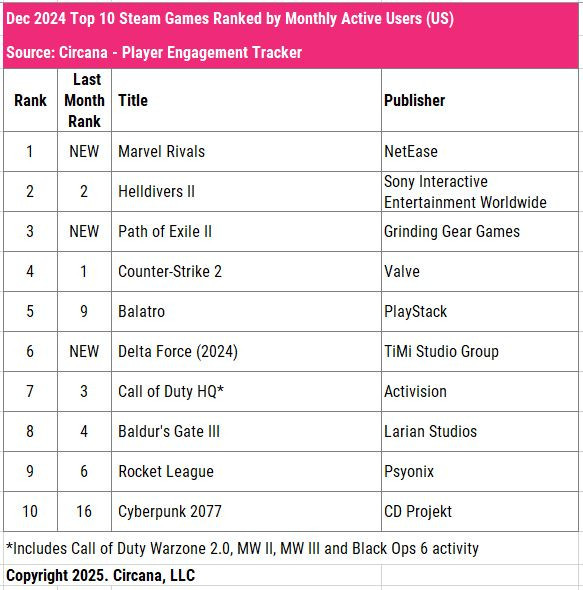
- On Steam, the situation is much more vivid. Marvel Rivals is in 1st place by MAU, Path of Exile II is 3rd, Delta Force is 6th. Three newcomers!
Games & Numbers (January 23 - February 4, 2025)
PC/Console Games
- Capcom reported that sales of the Monster Hunter series have exceeded 100 million copies.
- Human: Fall Flat has been purchased by 55 million people. The game was released in 2016, and the developer is currently working on a sequel.
- The Dying Light series has attracted more than 45 million players. In January 2023, the company reported selling 30 million copies.
- Niko Partners estimates that the global sales of Black Myth: Wukong have already exceeded 25 million copies. The game was released in August 2024.
- Games based on The Walking Dead franchise have earned more than $1 billion. This includes both PC/console and mobile adaptations of the series.
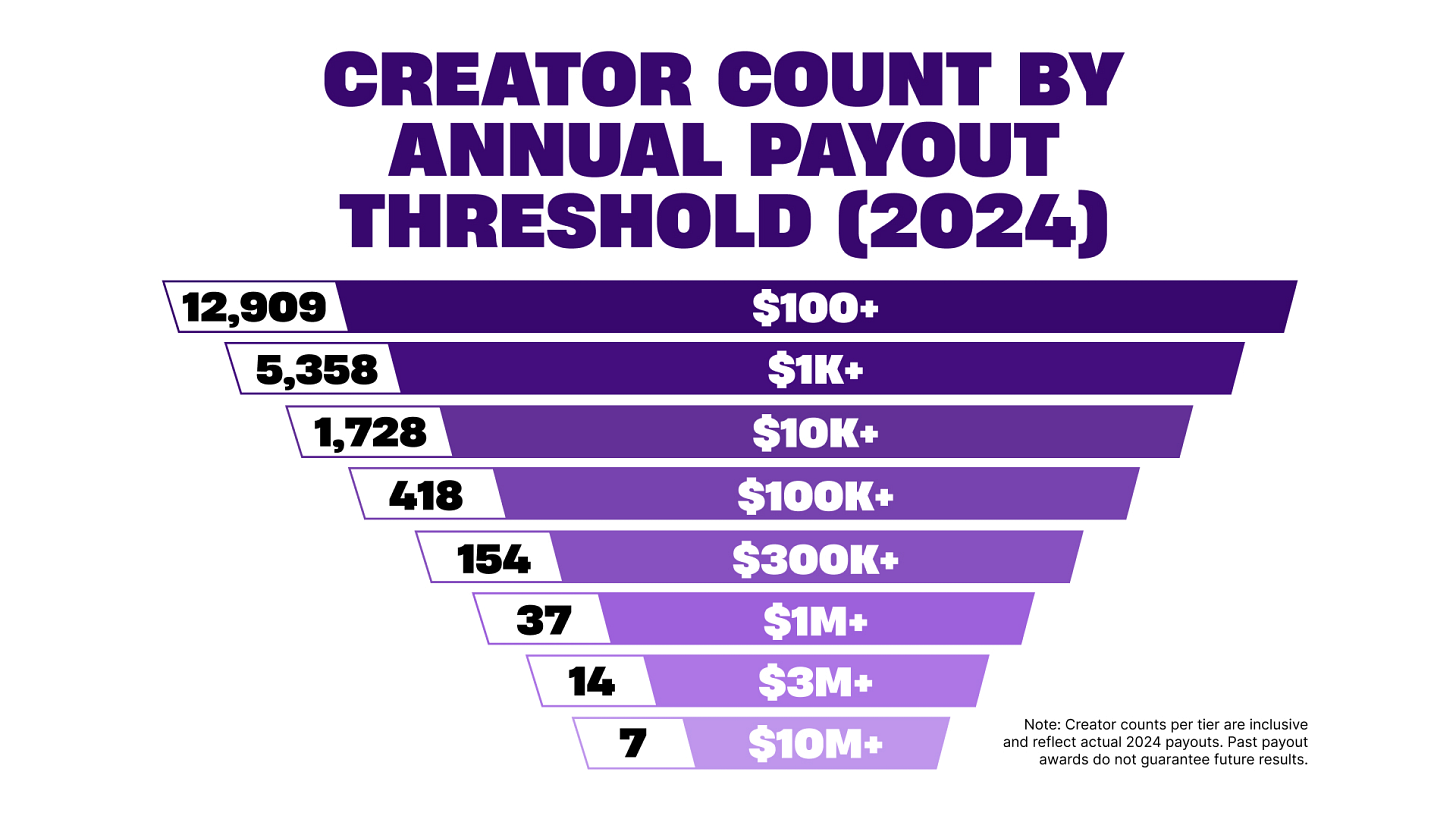
- Fortnite creators received $352 million from Epic Games in 2024. 7 teams received more than $10 million, 14 teams - more than $3 million, 37 - more than $1 million.
- DRAGON BALL: Sparking! ZERO has surpassed 5 million copies sold, which took just under 4 months. This is the best-selling part of the series, with 3 million copies sold in the first 24 hours.
- Mortal Kombat 1 has been purchased more than 5 million times. The studio noted that it will continue to develop the project.
- Satya Nadella reported that more than 4 million people have played Indiana Jones and the Great Circle. This is not about sales, as the game was available on Game Pass from day one.
- Sales of the Silent Hill 2 remake have surpassed 2 million copies.
- Pathfinder: Kingmaker has exceeded 2 million copies sold. The first million was announced in August 2021.
- Prince of Persia: Lost Crown sold 1.3 million copies in its first year. However, the team that worked on the project no longer exists—some people left Ubisoft, and some switched to other projects.
- Konami's eFootball has been downloaded more than 800 million times, including installs on PCs, consoles, and mobile devices.
- The creators of Neopets (a browser game about collecting virtual pets) boasted an achievement of 400,000 MAU and a peak DAU of 250,000 users. An important detail: the first version of the project was launched in 1999. So it's a solid achievement!
- The off-road driving simulator over the hill received more than 100,000 wishlists in the first 5 days of being on Steam. This is not the developers' first game, and they also worked with the audience on Instagram and TikTok before the launch of the Steam page, as well as secured publications in several leading media outlets together with a partner.
Mobile Games
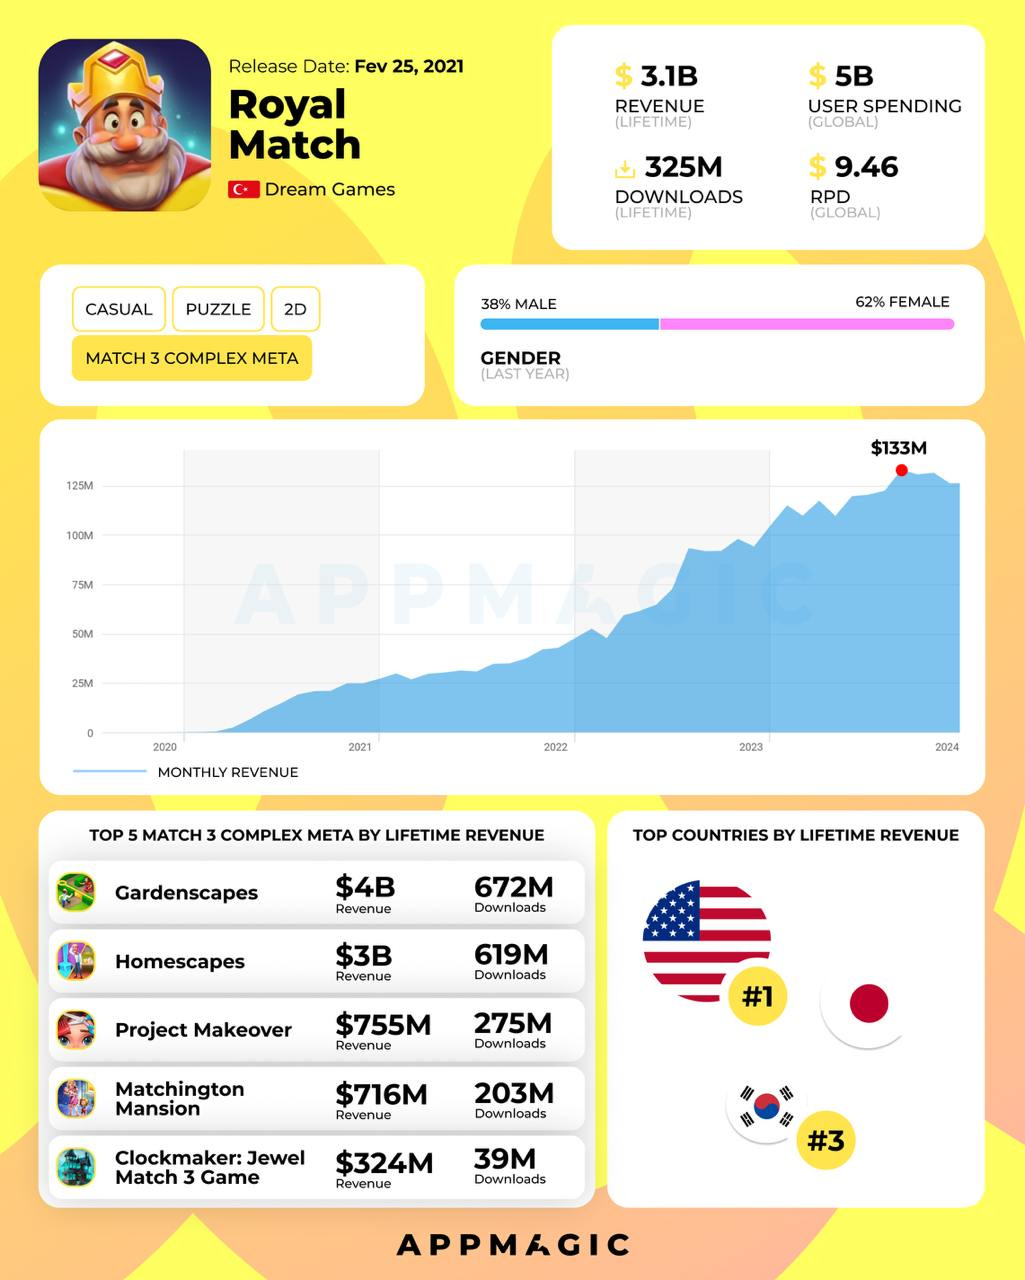
- According to AppMagic, people have spent more than $5 billion on Royal Match throughout its operation. In May 2024, the same AppMagic reported $3 billion in Gross Revenue.
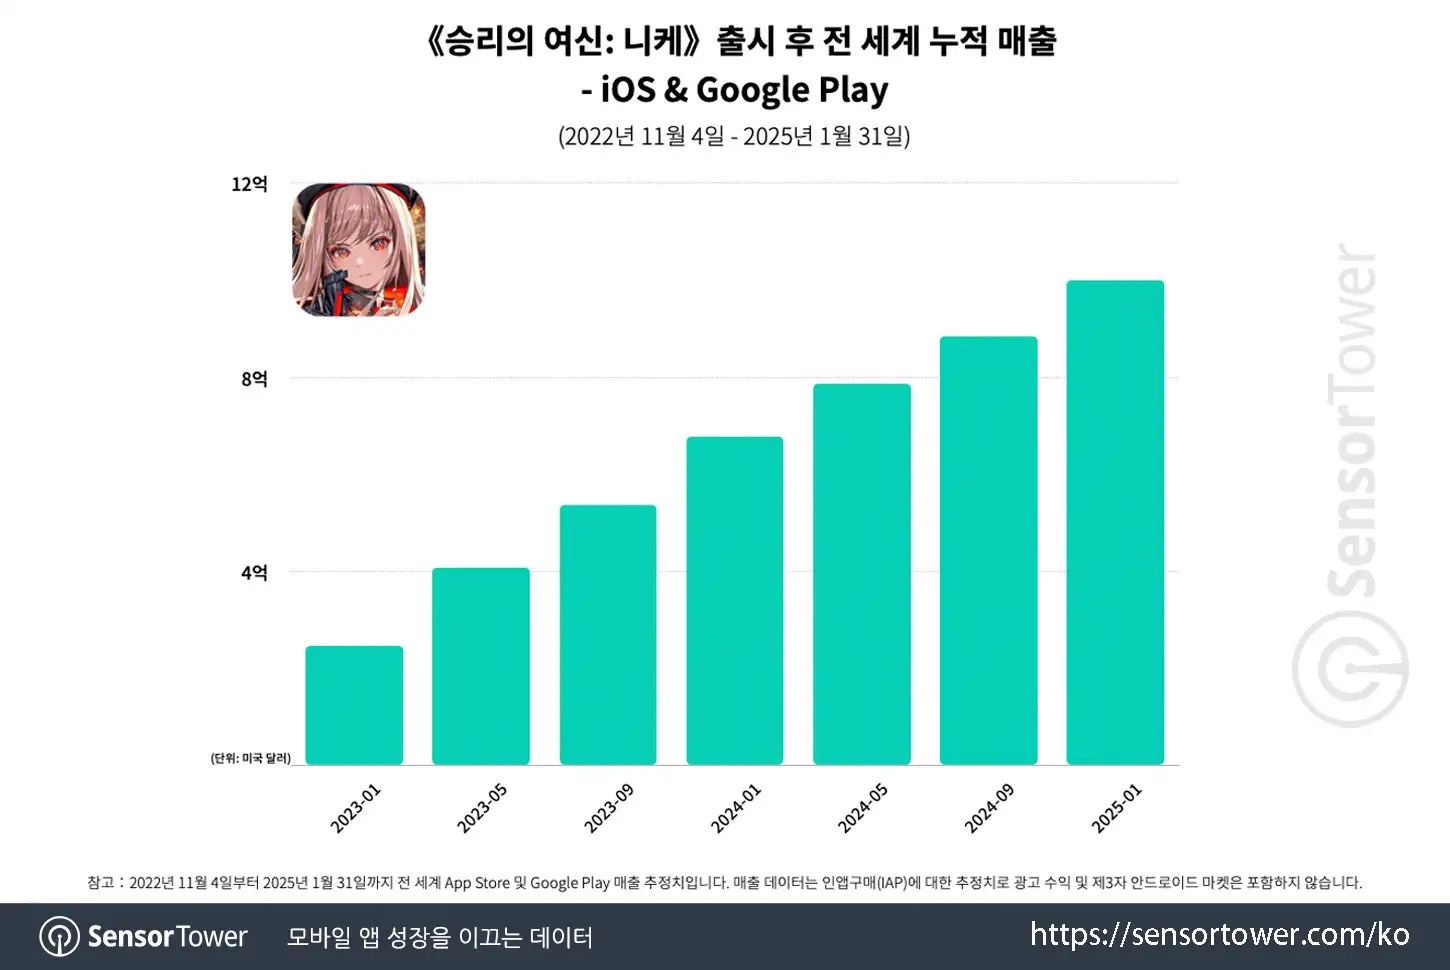
- Goddess of Victory: Nikke has earned more than $1 billion on mobile devices. In Japan, the game collected 54% of revenue, in South Korea - 16.2%, in the USA - 16%. The game is also available on PC.
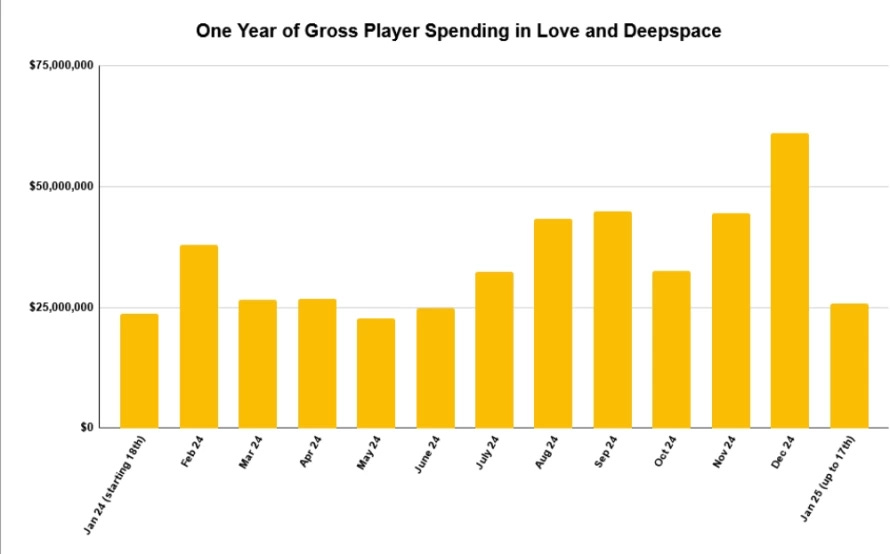
- Love and Deepspace earned $400 million in its first year on mobile devices. Data from AppMagic, means the figures are without taxes and store commissions. In December, the game set a revenue record - $61 million ($10.5 million of this amount was paid by users on December 31). The developers reported in official channels that the game has been downloaded by more than 50 million people.
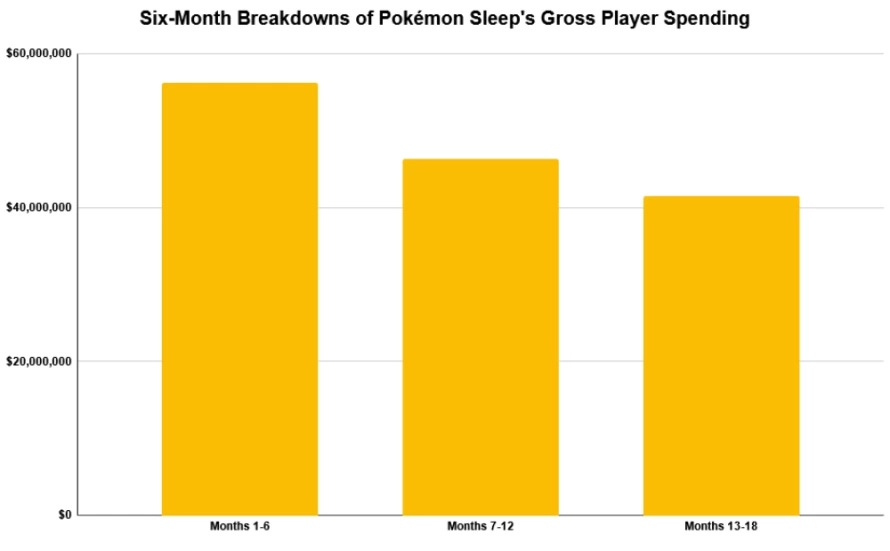
- Pokemon Sleep has earned $140 million in 1.5 years. 73% of all revenue came from Japan. The trend is negative.
- Hypercasual publisher Homa boasted that its games have been downloaded more than 2 billion times. Sky Roller, Merge Master, and Attack Hole account for 21% of all downloads.
AppMagic: Top Mobile Games by Revenue and Downloads in January 2025
AppMagic provides revenue data after deducting store commissions and taxes. Revenue from Android stores in China is not included.
Revenue
- Honor of Kings reclaimed the top revenue spot, earning $193.19 million in January. The game also reached a milestone by earning its first million dollars net in the US market.
- Last War: Survival ($148.3 million) and Royal Match ($144.8 million) took the 2nd and 3rd positions in the chart.
- PUBG Mobile saw significant revenue growth, earning $135.1 million, its highest in the last two years.
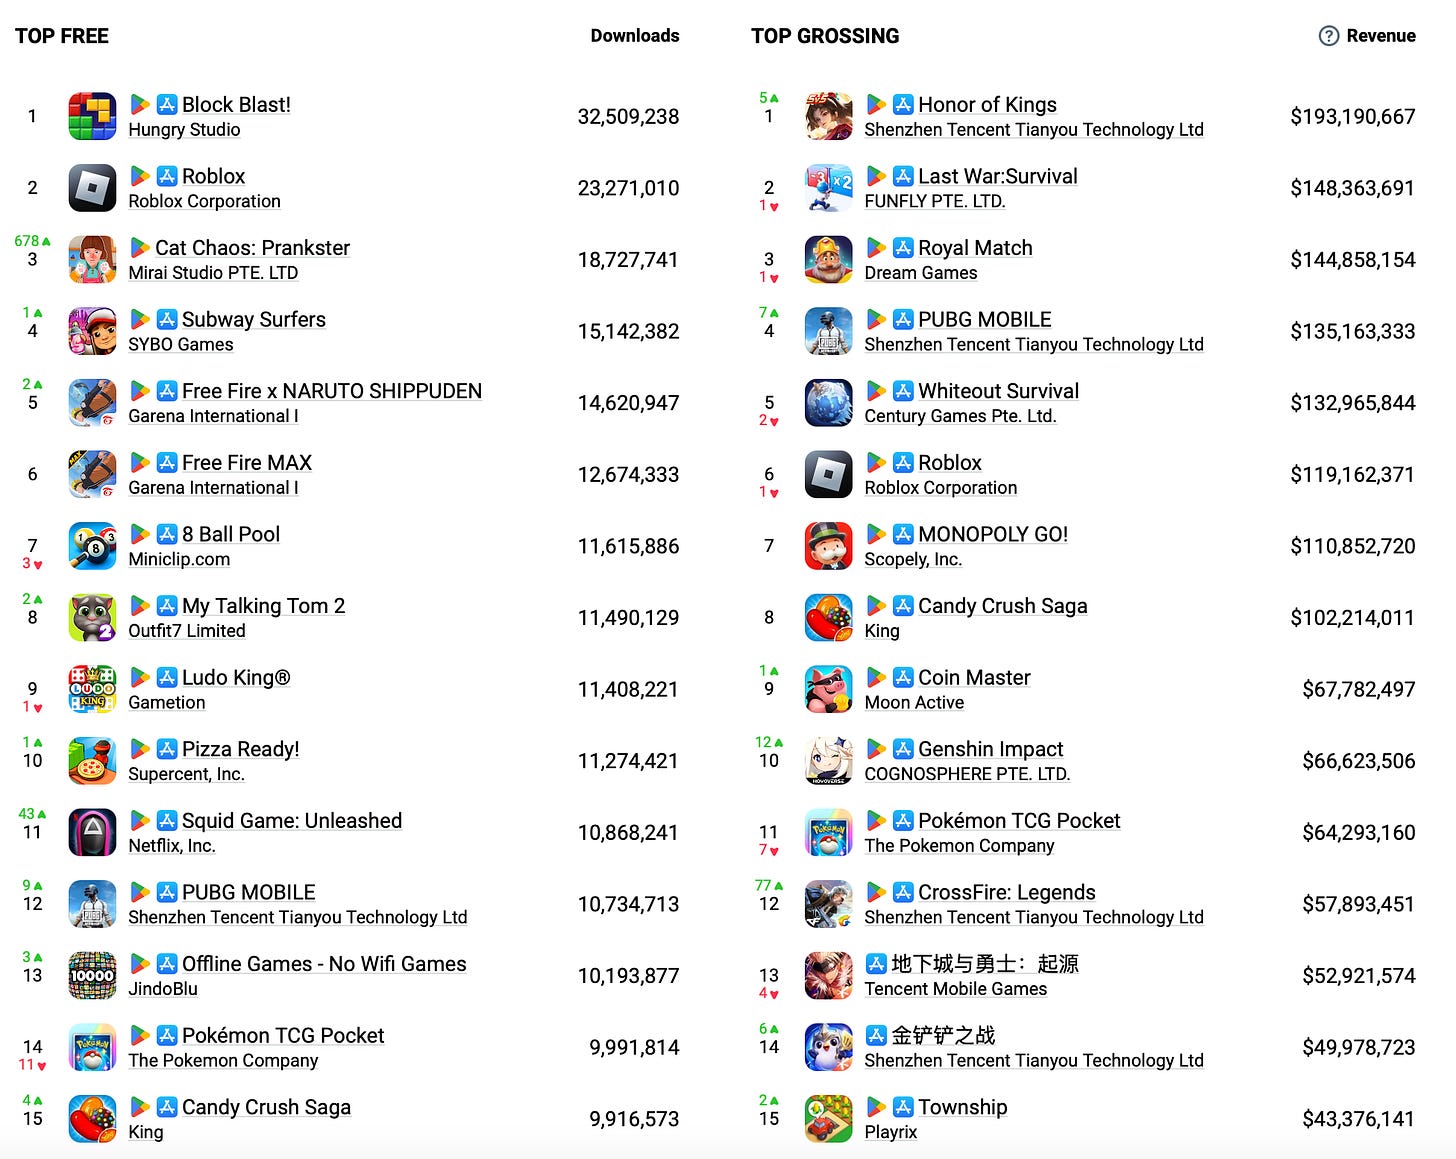
- Genshin Impact ($66.6 million) and Teamfight Tactics ($49.9 million) had a good month.
- CrossFire: Legends deserves special mention. The game earned $57.9 million in January, a historic record for the project launched in 2015. All revenue came from China. This year, as in the previous two, revenue peaks coincided with the Chinese New Year celebrations.
Downloads
- A new hit appeared in the download charts - Cat Chaos: Prankster by Vietnamese studio Mirai Studio. In the game, players cause mayhem as a cat, as simple as that. The game was downloaded 18.7 million times in a month.
- The download leaders remain the same - Block Blast! (32.5 million installs) and Roblox (23.3 million).
- Squid Game: Unleashed had a good month of downloads, with 10.8 million installs. However, the trend is discouraging—by the end of January, daily installs dropped to 75-80 thousand, 6-8 times less than at the end of December.
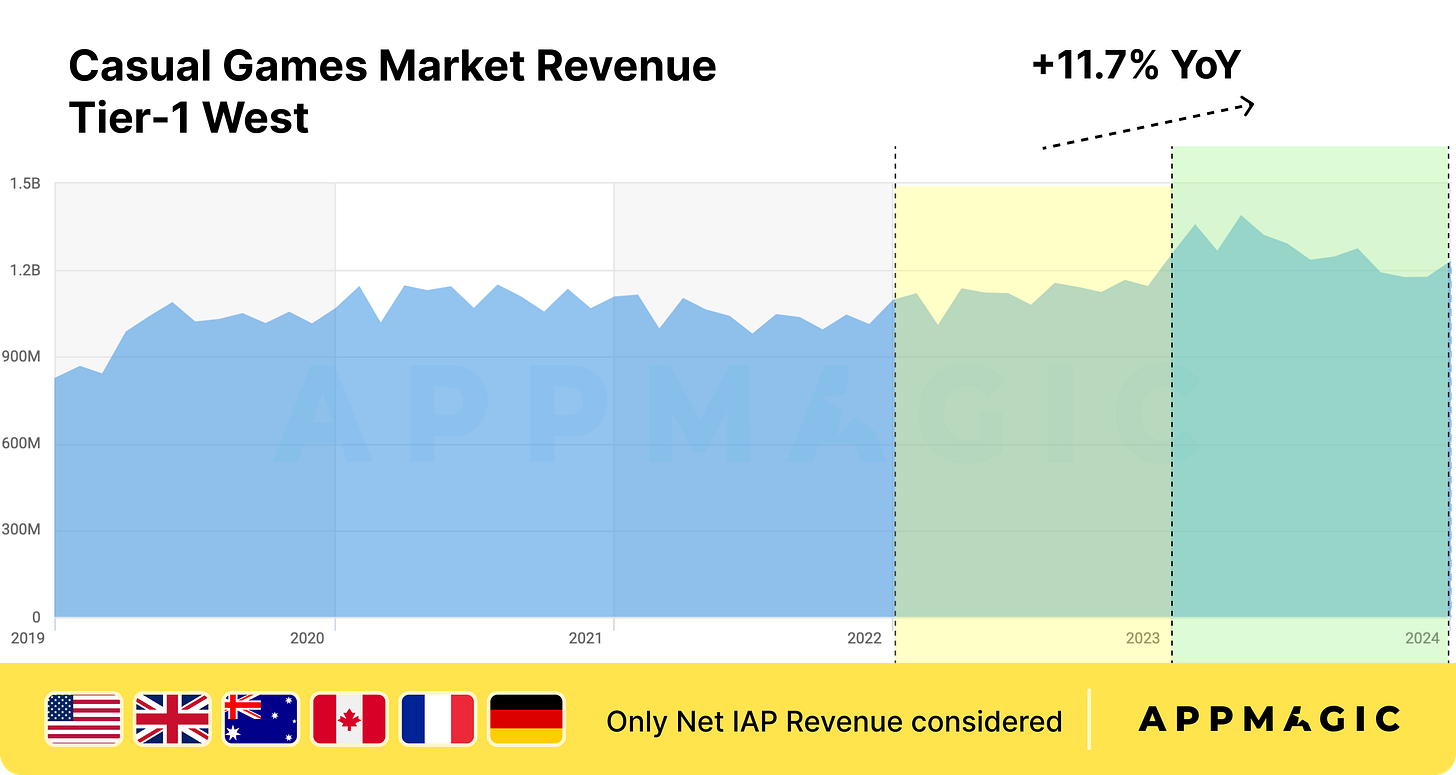
AppMagic: Casual Games Tier-1 West performance in 2024

In the study, AppMagic focuses on Western Tier-1 markets - USA, UK, Australia, Canada, France, and Germany. Five key genres will be examined: Match-3 with complex meta, Merge-2 with complex meta, Match 3D, Sort Puzzle, and Casual Casino.
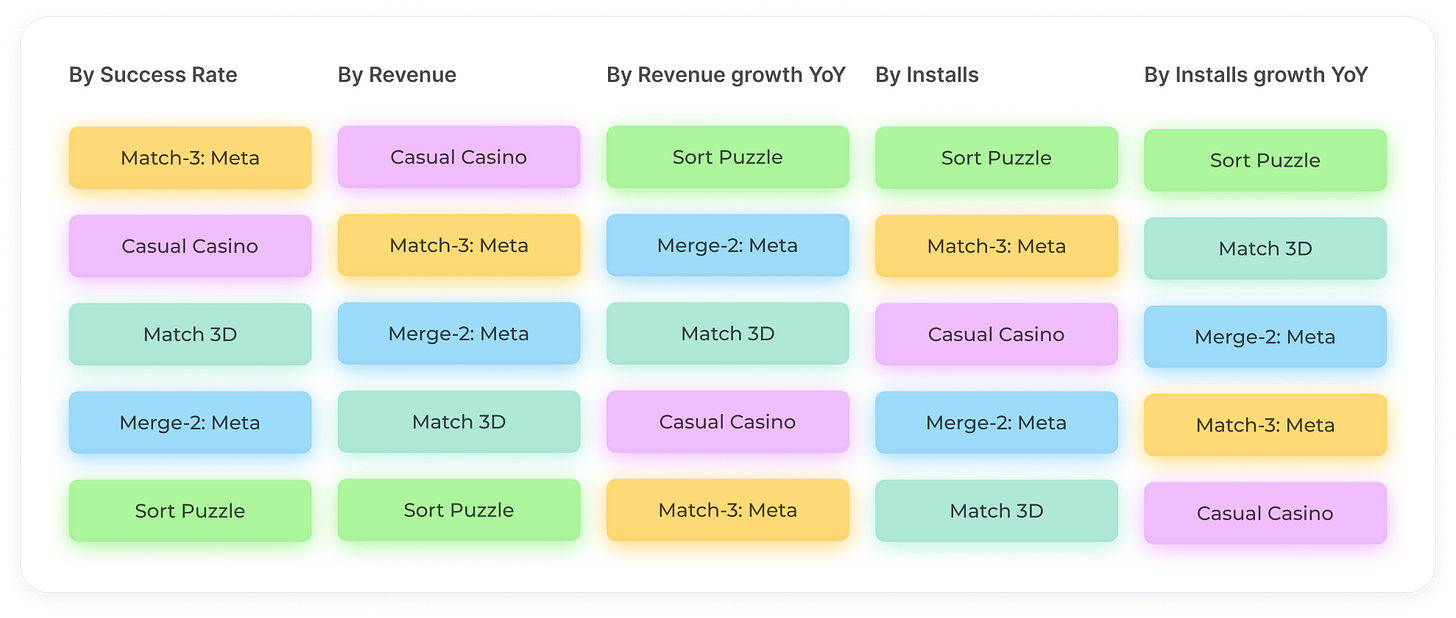
❗️Hereafter, all metrics are only for the 6 countries mentioned above. IAA revenue is not included. Please, consider that some Asian-focused products might not appear in this research.
Market State
- Casual game revenue in Western Tier-1 countries grew by 11.7% to $15.2 billion. Downloads for the same period increased by only 4.1%.
Match-3 with Complex Meta
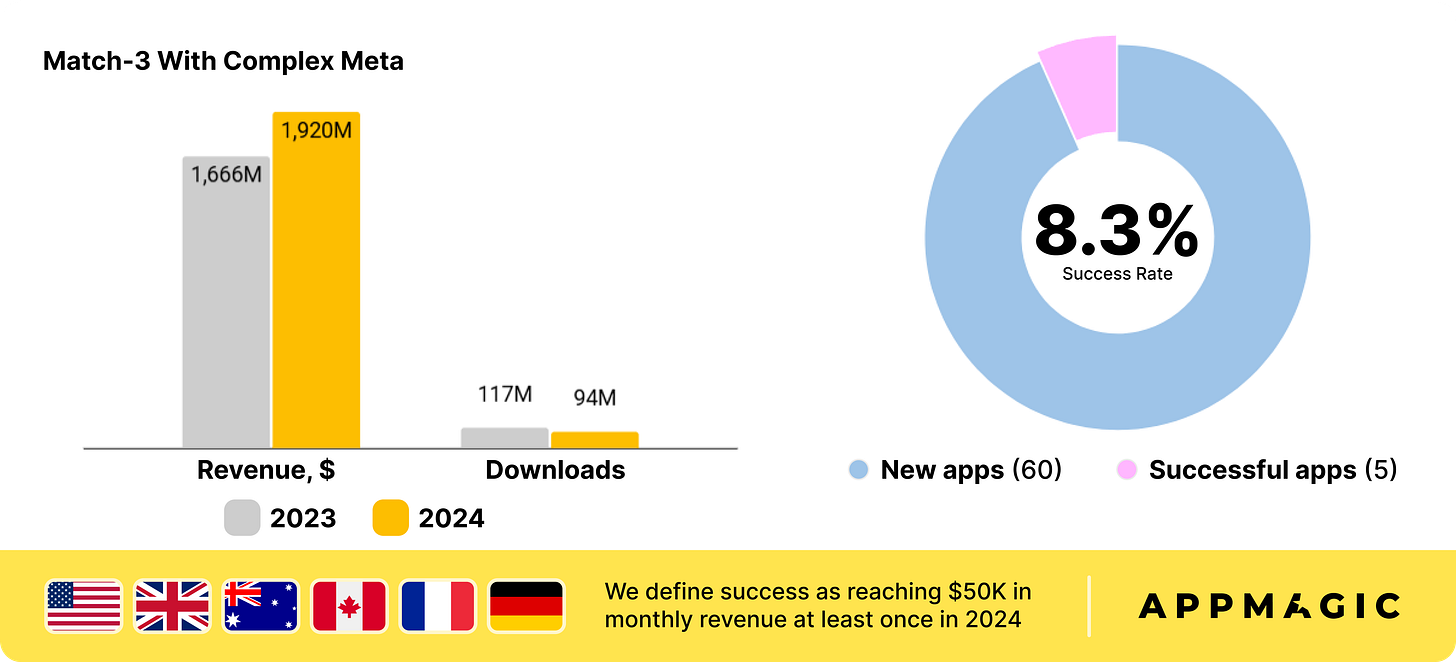
- In 2024, games in this genre earned $1.92 billion in selected markets (13% growth). However, downloads decreased by 21%.
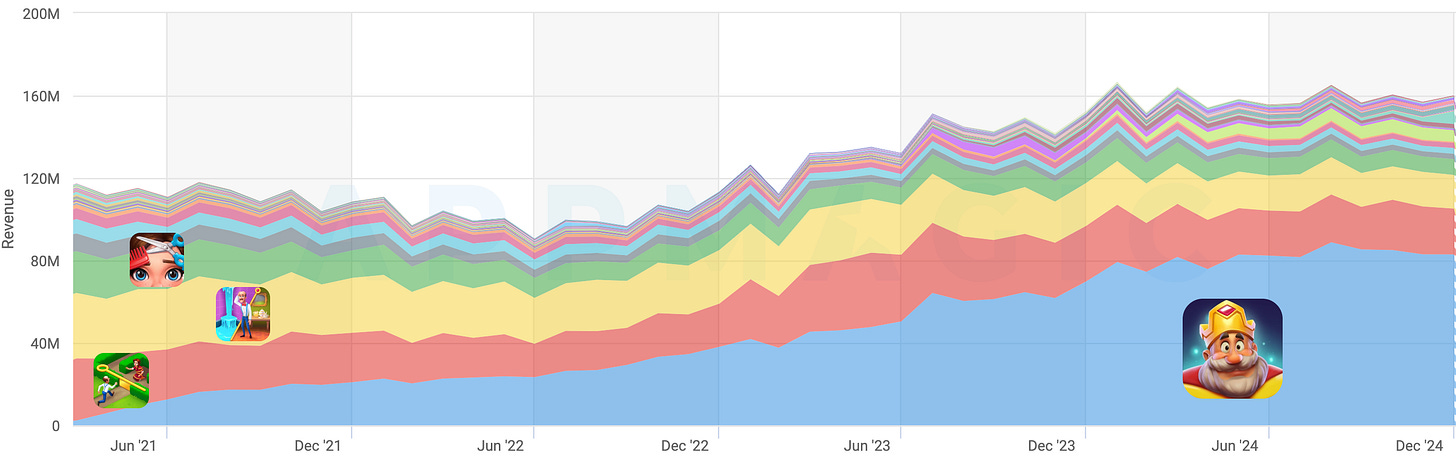
- Royal Match is the genre leader. The game accounts for 51% of all genre revenue in T1 West countries.
- If Royal Match is removed from the overall equation, the genre’s revenue will decline by 8% in 2024.
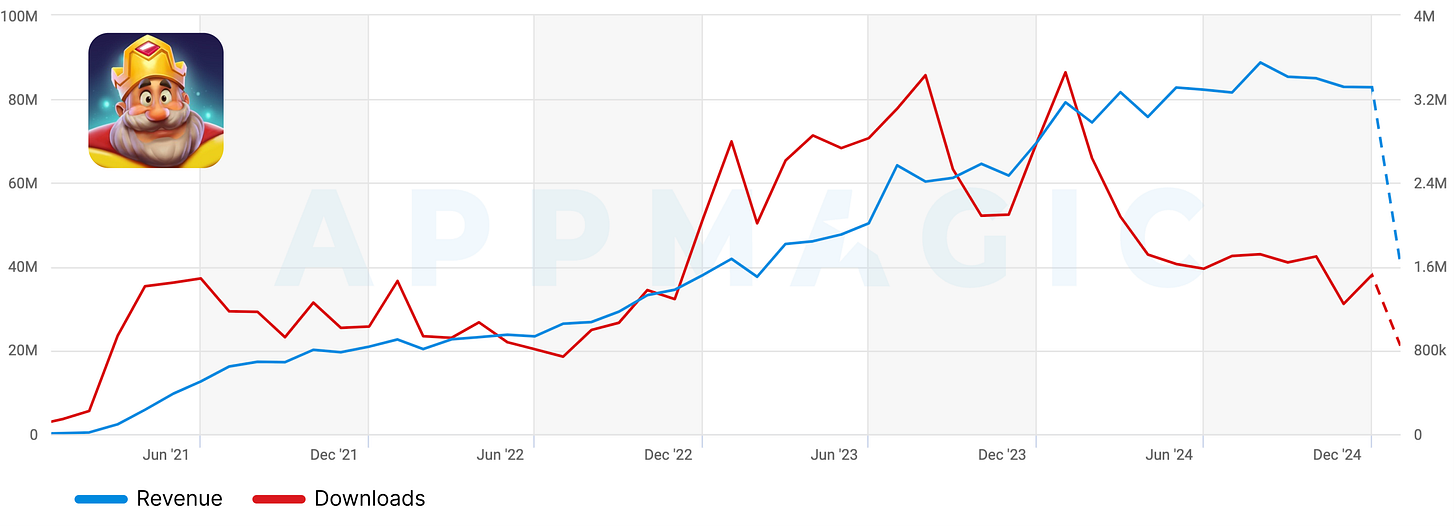
- In 2024, Royal Match's audience growth mainly occurred in the first half of the year. Then, the dynamics slowed down, and the number of installs returned almost to 2022 figures. However, the project's revenue grew - the team actively worked on Live-ops and monetization. AppMagic notes that Dream Games also worked on the social component of the project.
- The 4 largest projects in the genre's top 10 in 2024 remained unchanged - Royal Match, Gardenscapes, Homescapes, and Project Makeover. However, there are two newcomers: Matching Story - Puzzle Games (Vertex) and Mystery Matters (Playrix). Both projects were launched in 2023.
- In total, 60 projects were launched in 2024, 5 of which managed to reach $50,000 in monthly revenue (which AppMagic considers the minimum mark for assessing success). These are Truck Star (Century Games), Hollywood Crush: Match 3 Puzzle (YOTTA Games), Ellen's Garden Restoration (Storm8), Christmas Match: Home Design (Narcade), and Roomscapes (Playrix). Work on the latter is likely suspended. 8.3% of all launched projects can be called somewhat successful.
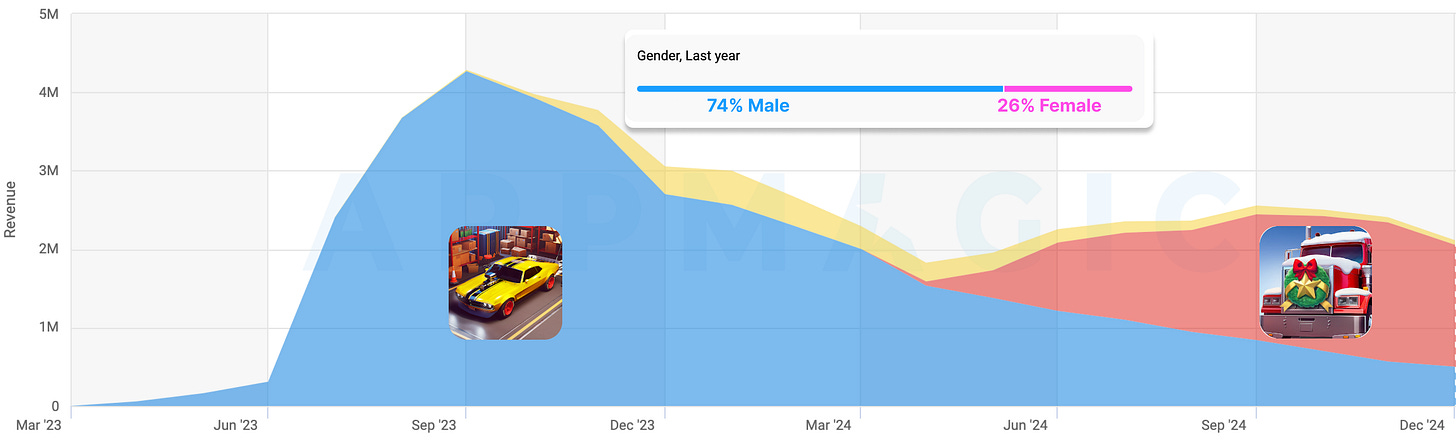
- AppMagic specifically notes Truck Star. The game has an atypical gender distribution for the genre - 74% men versus 26% female audience. Since its release in May 2024, the game has earned more than $10 million.
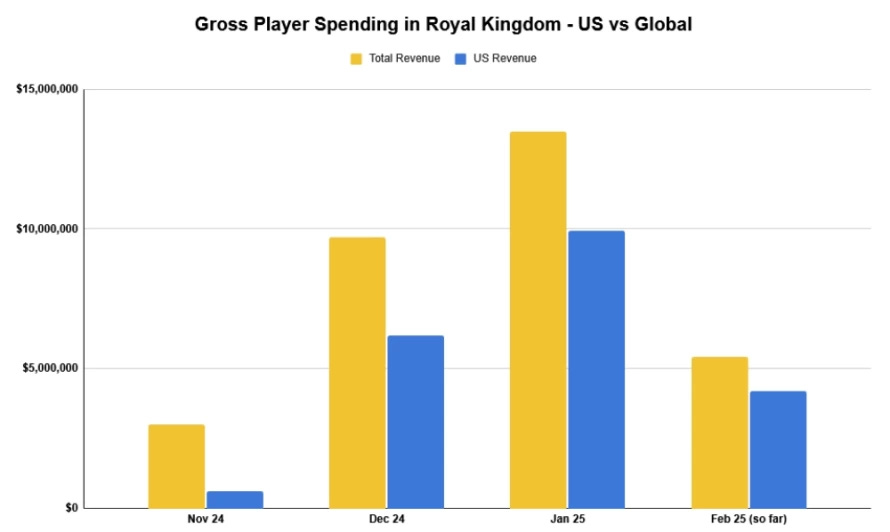
- Formally, the Royal Kingdom can also be added to the list. But the game had been in soft launch since April 2023 and was already earning more than needed to achieve the minimum required "success" assessment.
Merge-2 with Complex Meta
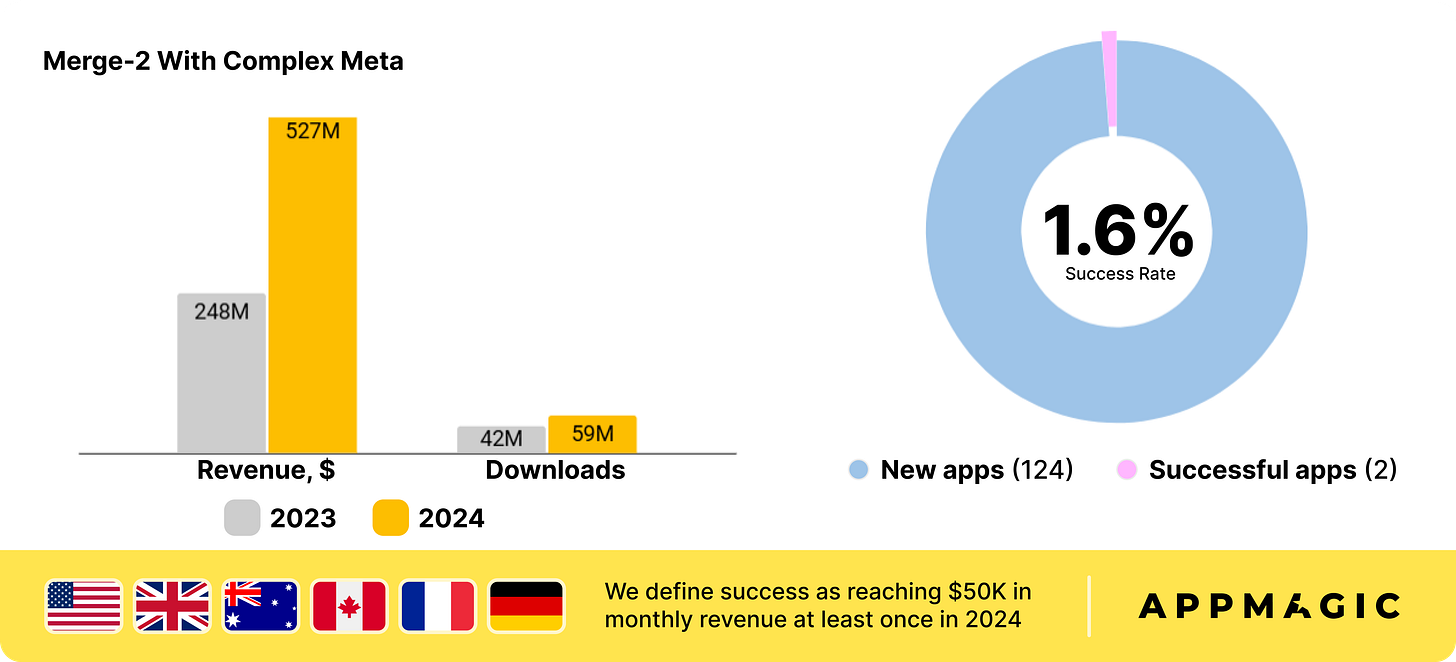
- In 2024, Merge-2 grew in revenue by 106% (to $527 million), and downloads increased by 43%, reaching 60 million.
- Unlike the previous genre, there is no clear leader in Merge-2 with meta. Merge Mansion, Travel Town, Gossip Harbor, and Seaside Escape compete for audience and revenue.
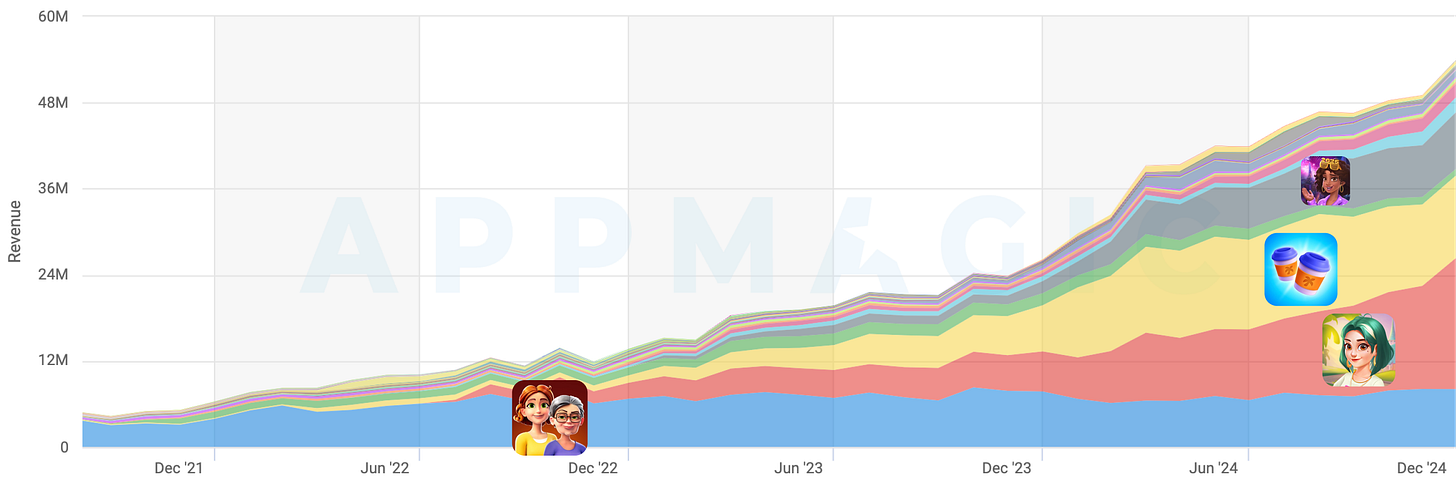
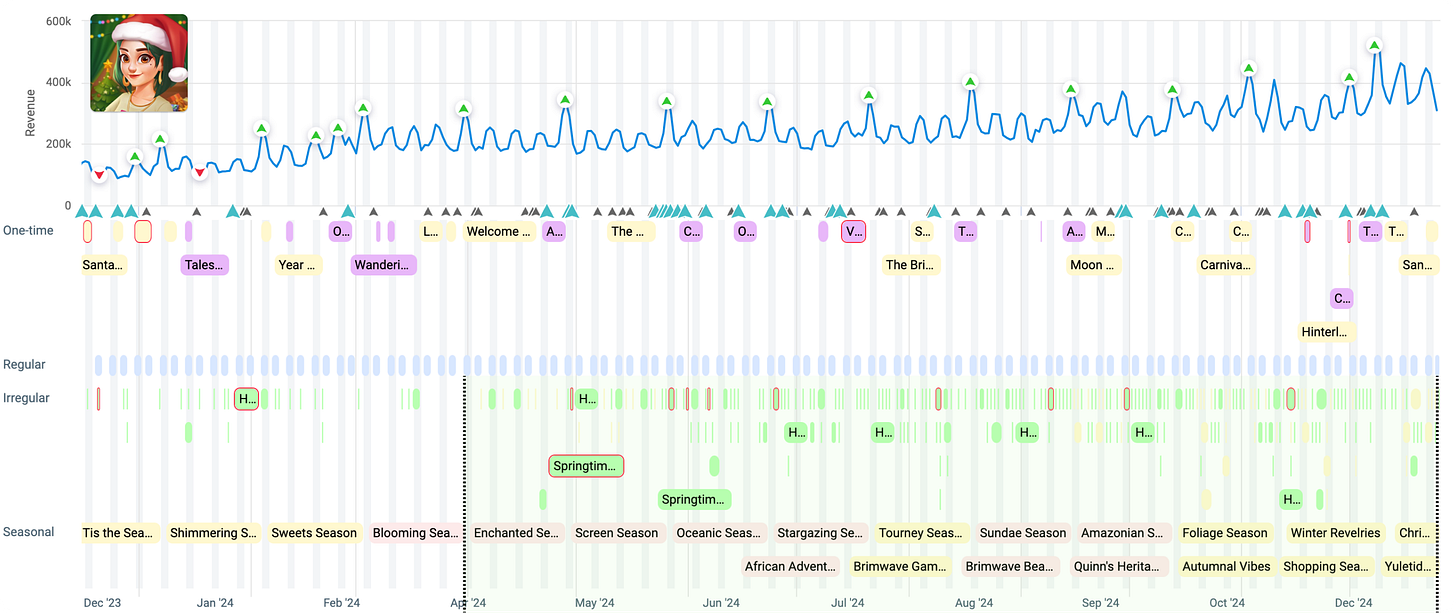
- AppMagic notes that all projects in the genre have increased their expertise in operations. This can be traced, for example, by the frequency of live-ops events in Gossip Harbor.
- Competition in the top 10 in the genre is active. Travel Town broke into first place, and 3 new projects appeared in the chart - Adventure Island Merge (FlyBird), Taylor's Secret: Merge Story (Merge Story), and Road Trip: Royal (Vizor Games).
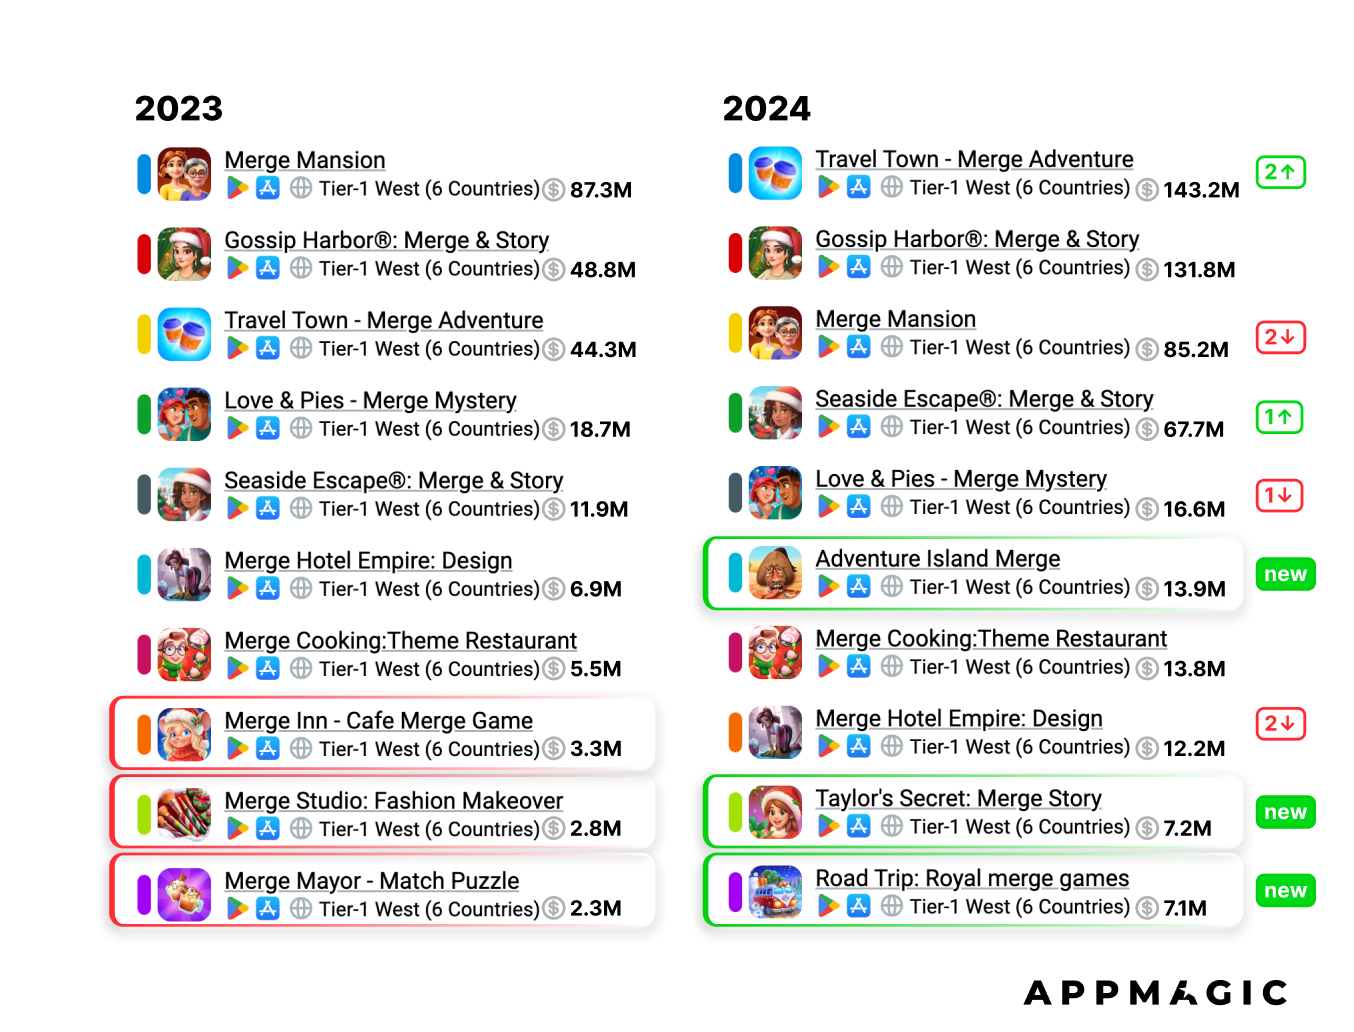
- As AppMagic notes, the authors of Merge Mansion are not ready to accept the loss of the leading position. Throughout 2024, the team actively worked on increasing their revenue against the falling downloads and achieved certain successes.
- This year, 2 out of 64 games released in the genre managed to exceed $50,000 in monthly revenue. These are Merge Prison: Hidden Puzzle (Blue Ultra Game) and Merge Adventure: Merging Games (Green Pixel. The success rate is 1.6%. In 2023, no project managed to cross this mark, so there is a progress.
Match 3D
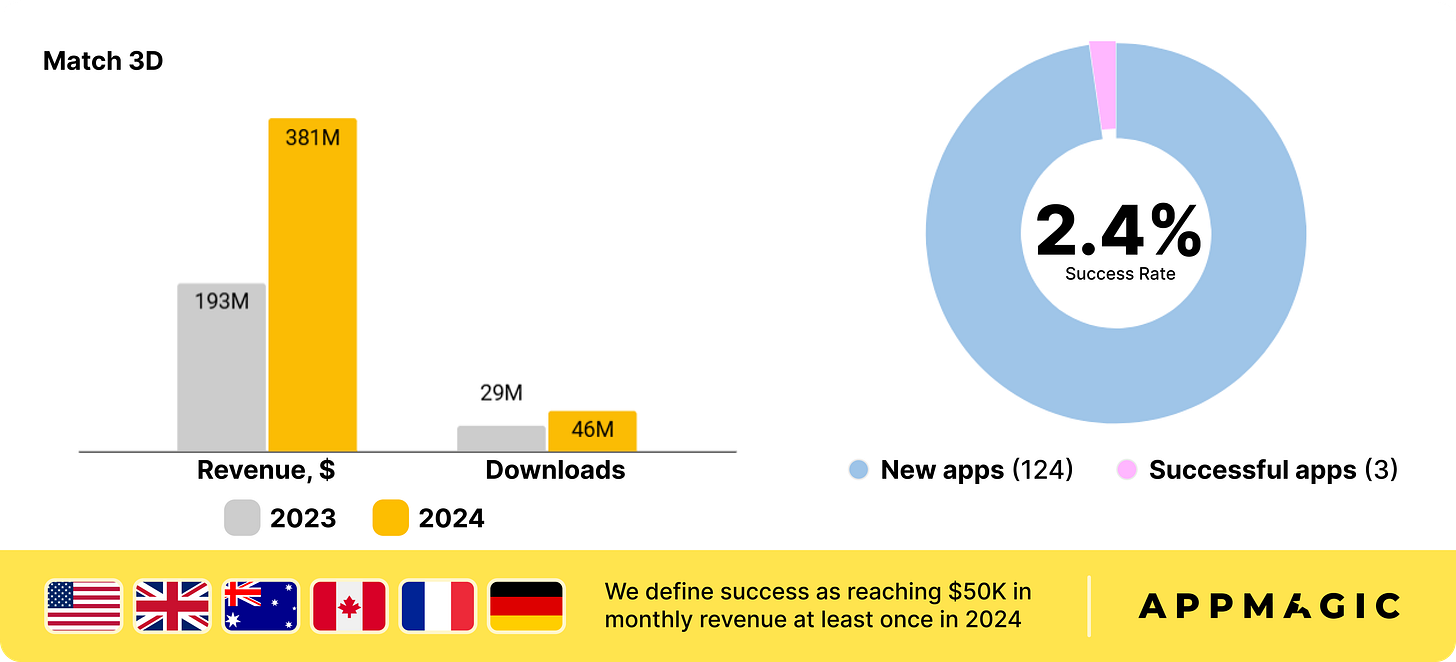
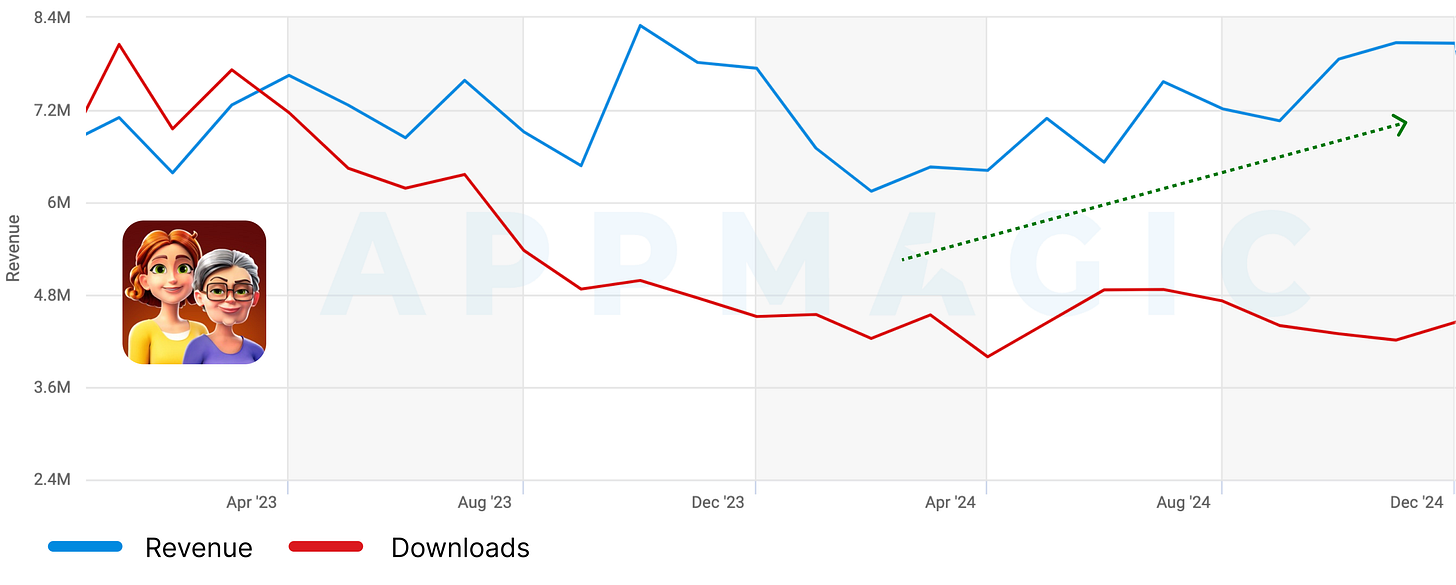
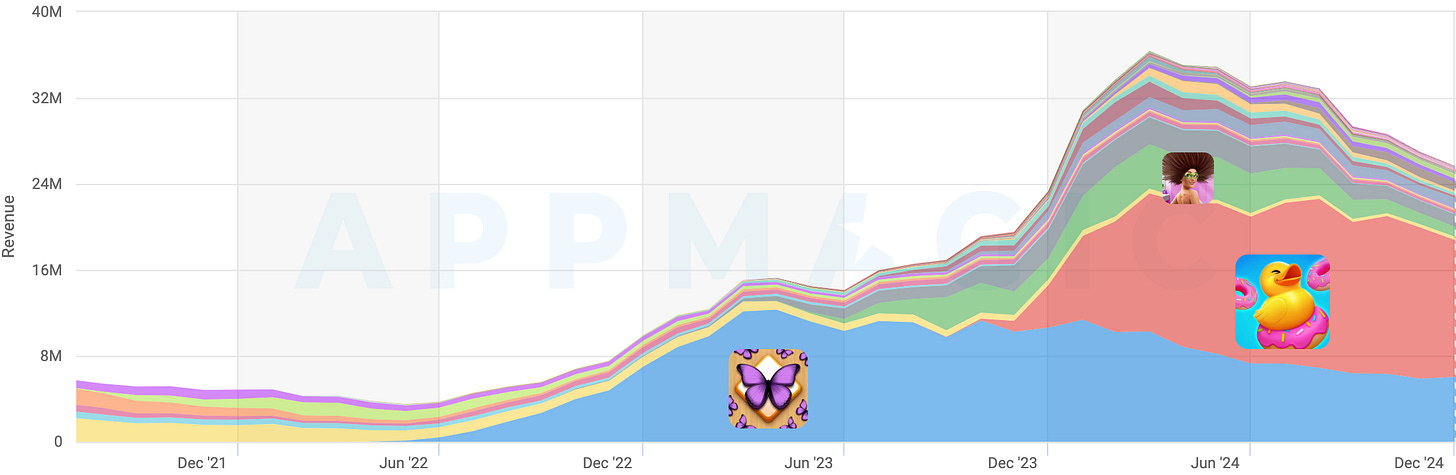
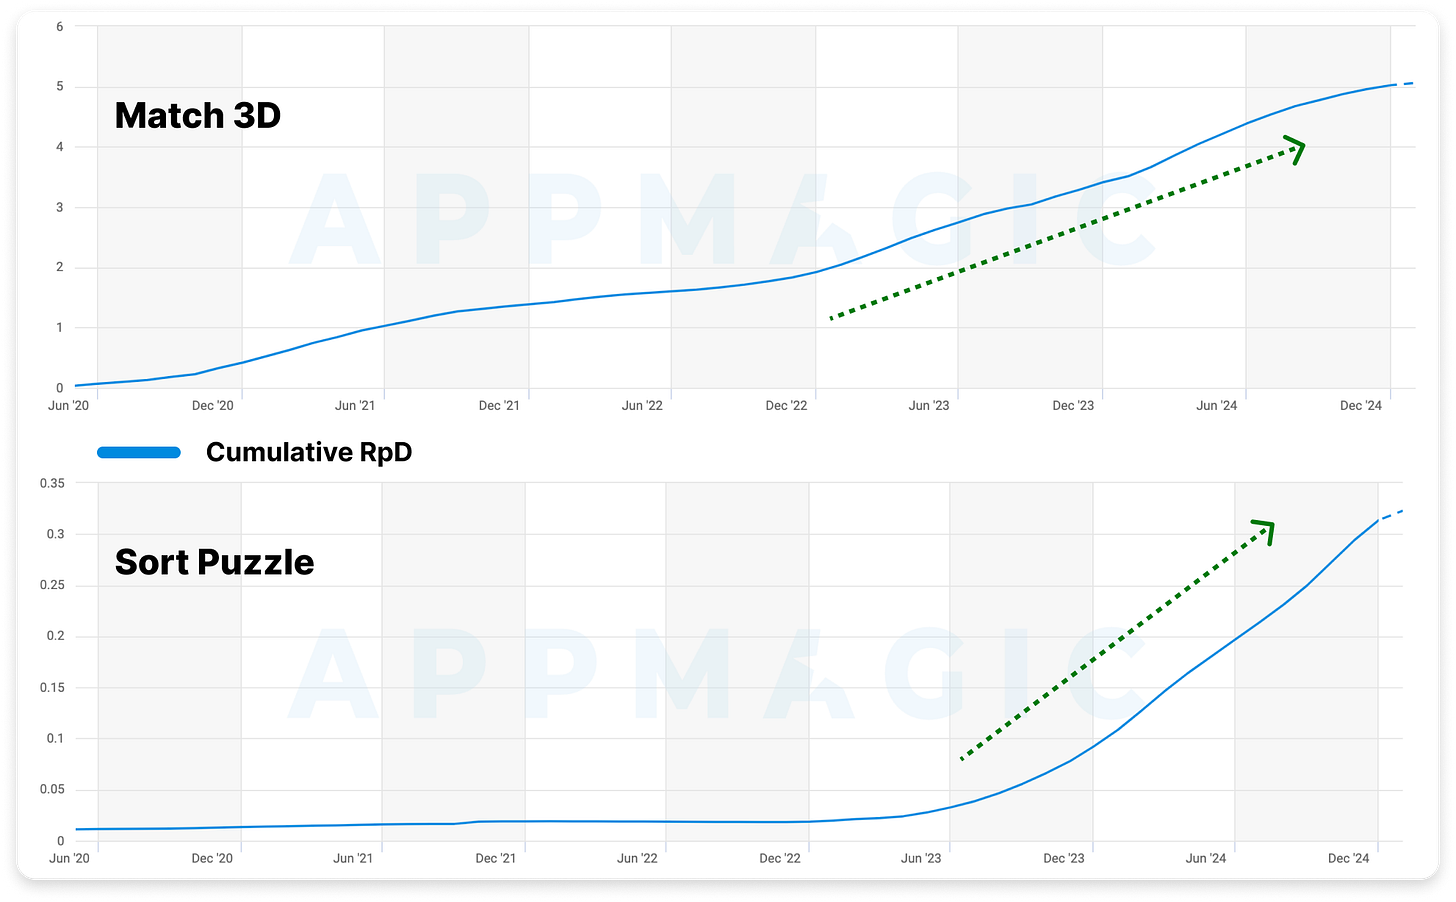
- Match 3D games revenue in the listed countries grew by 97% to $381 million. Downloads also increased by almost 59% - to 46 million.
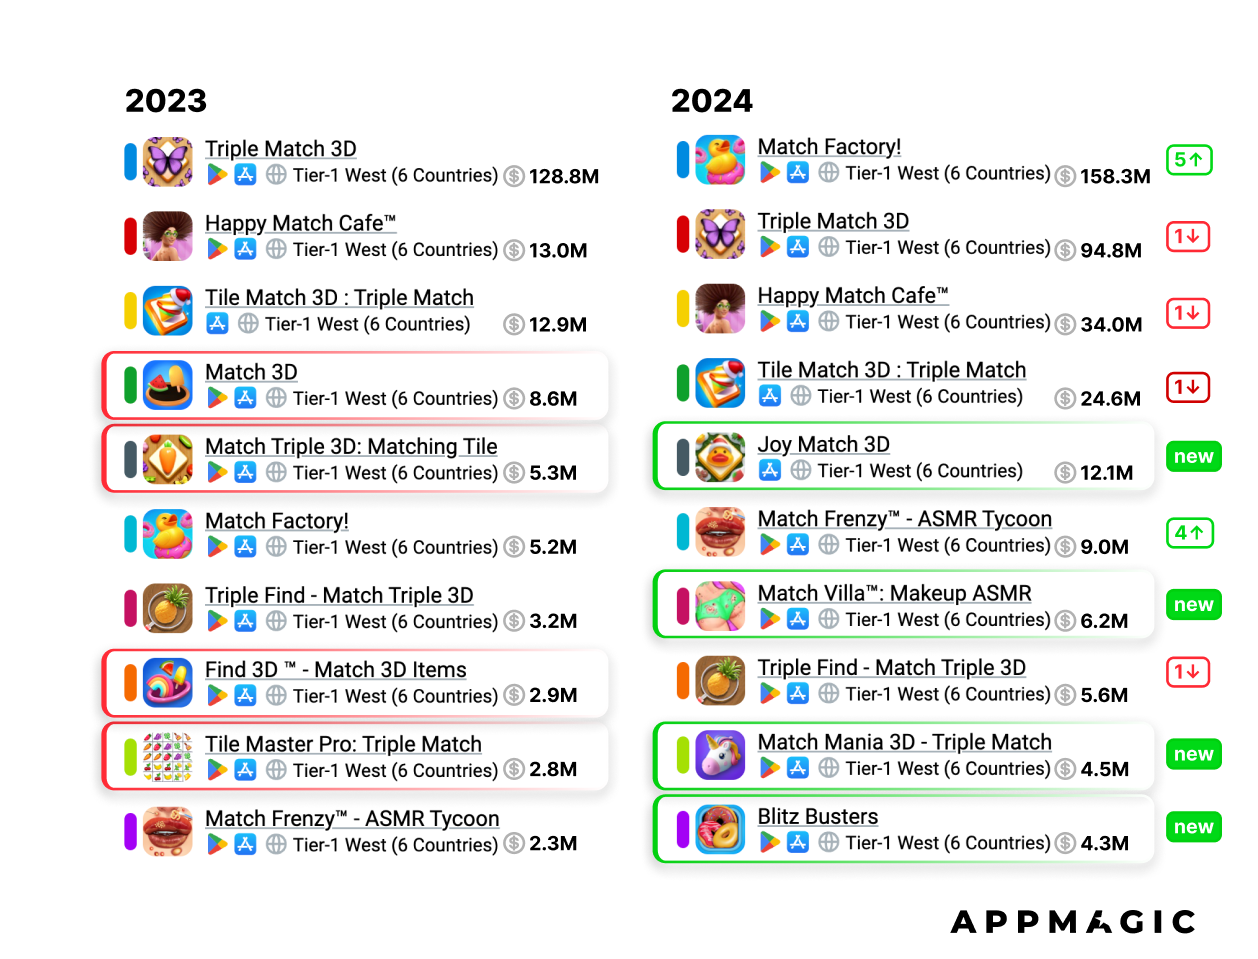
- The genre is actively developing, and most of the revenue is generated by new projects. The veteran - Triple Match 3D - started earning less in 2024. Match Factory! positioned itself as a leader and now generates 42% of the entire genre's revenue.
- The top 10 is very active. Four new projects appeared in 2024 - Joy Match 3D, Match Villa: Makeup ASMR, Match Mania 3D - Triple Match, and Blitz Busters. AppMagic notes that two projects in the genre (Match Frenzy - ASMR Tycoon and Match Villa: Makeup ASMR) use the theme of "gross aesthetics," like popping pimples.
- The same theme is used in one of the successful newcomers of 2024 - Match Rush 3D: ASMR Care (AlphaPlay). In 2024, the game earned $575 thousand. Two other projects that broke through the $50,000 monthly revenue mark are Match Party - Tile 3D and Triple Pile 3D.
Sort Puzzle
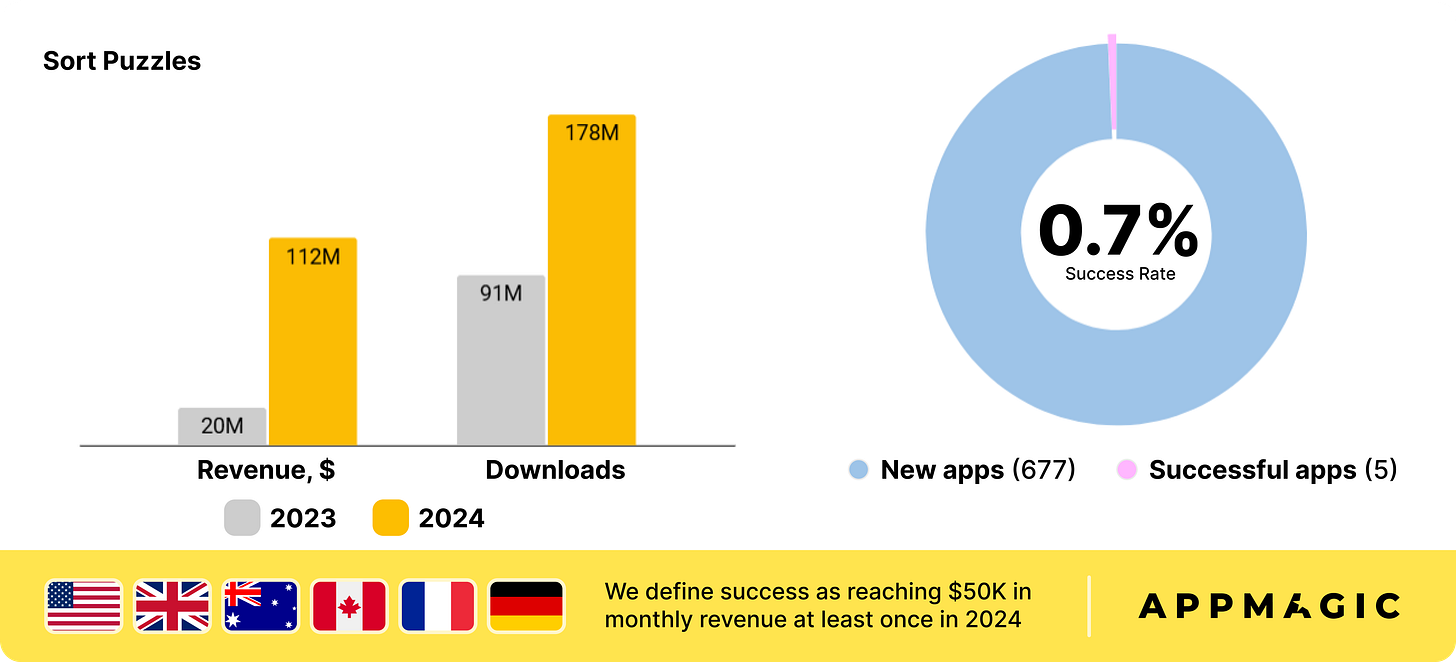
- This is the fastest-growing genre among casual games. In 2024, revenue grew 5.6 times - to $112 million. Installations also almost doubled (178 million installations).
- AppMagic correctly points out that the genre has long attracted an audience in the West, but the breakthrough is related to user monetization.
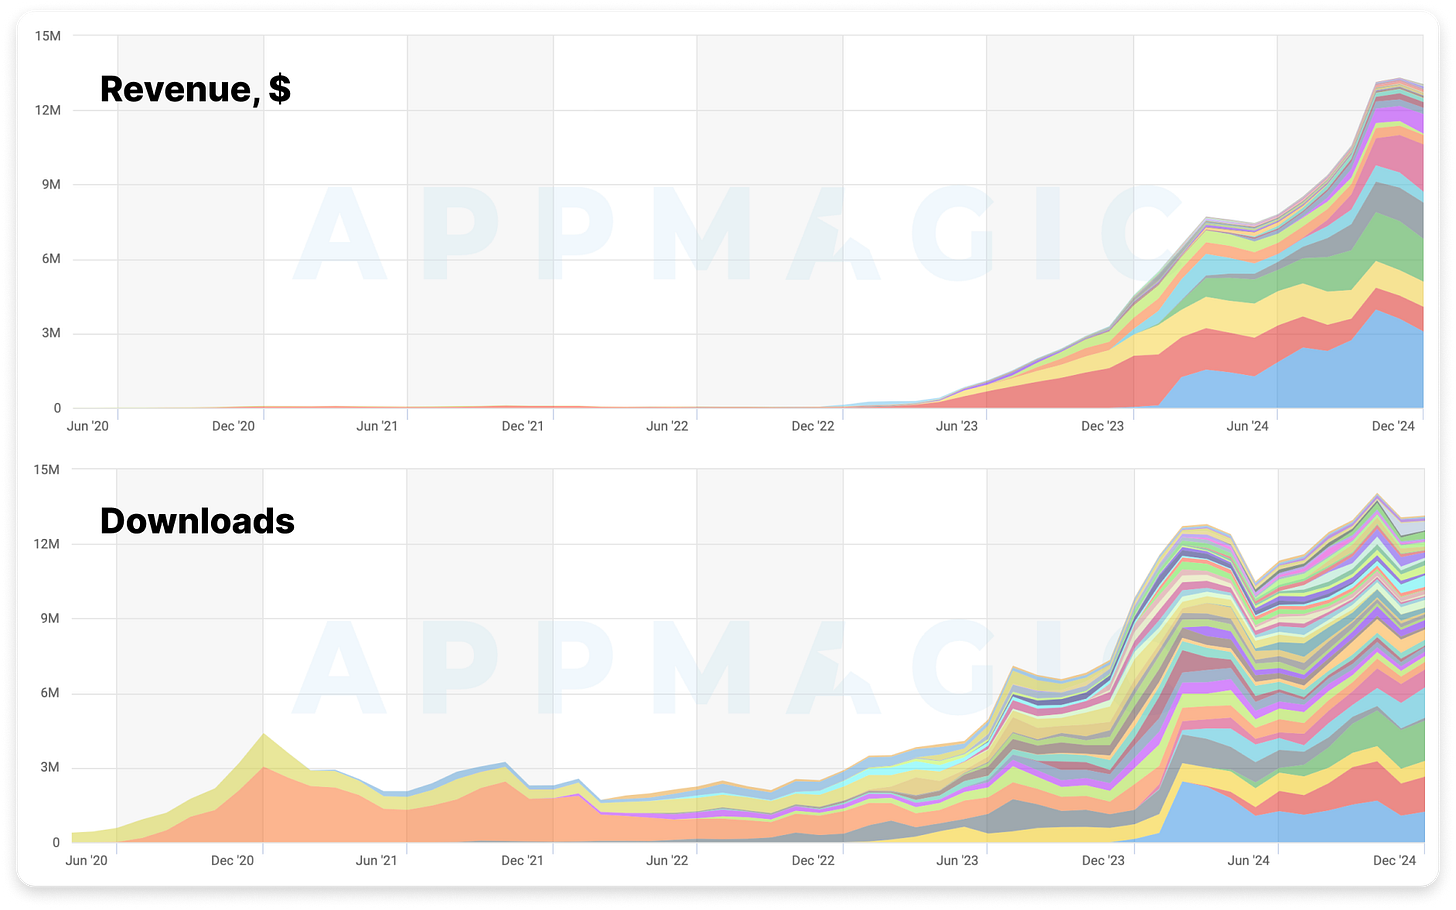
- The revenue development dynamics of the genre resemble what happened with Match 3D.
- The genre is developing. Therefore, in the top 10 by revenue, there are 5 newcomers at once, including the leader - Hexa Sort.
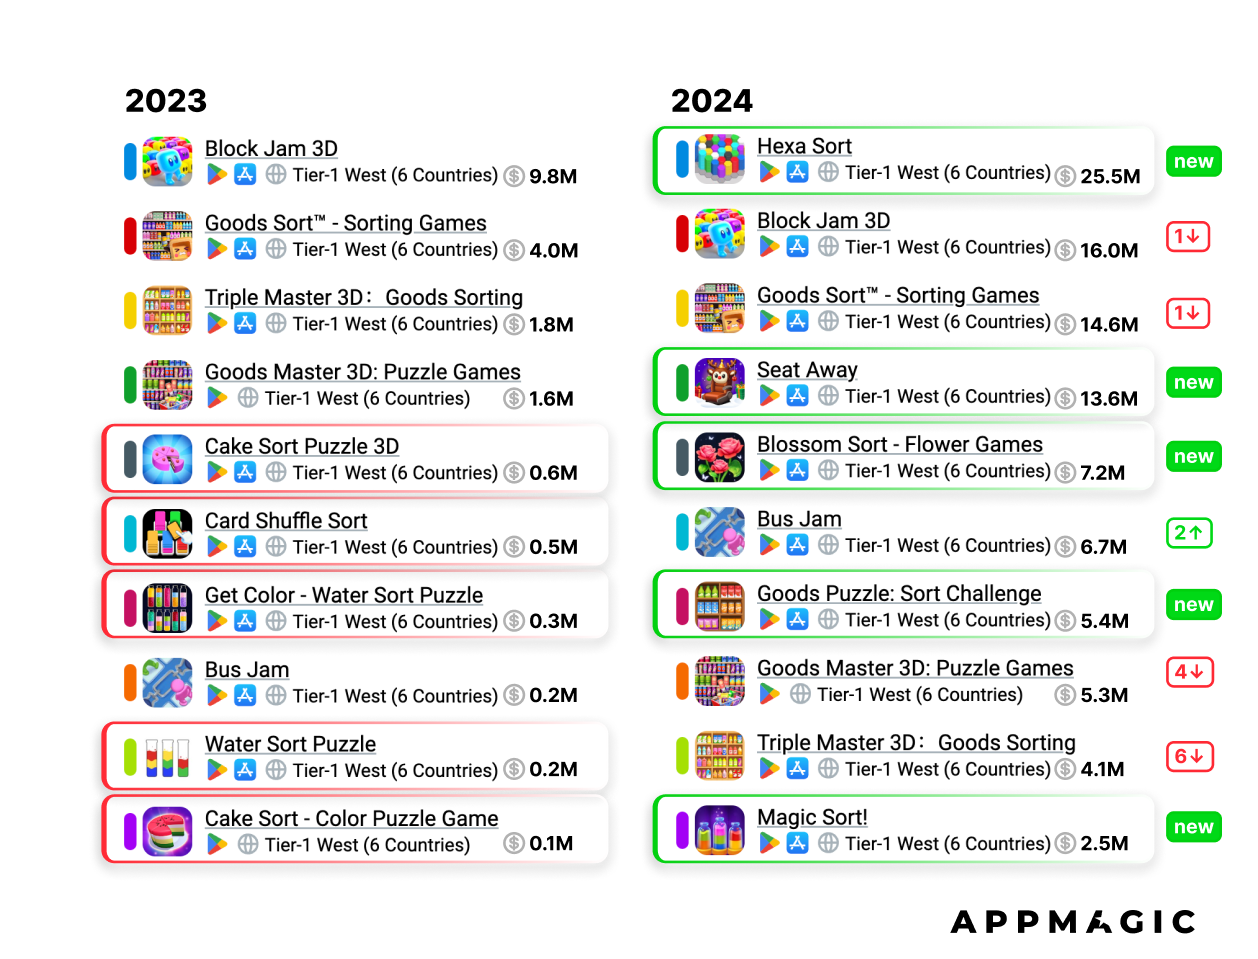
- 4 out of 10 games in the top 10 are dedicated to arranging various household items or products on store shelves. This is the most popular theme in the genre.
- In 2024, 227 projects were released in the genre, 6 of which exceeded the $50,000 monthly revenue mark. 2.6% Success Rate, but it's important to consider that the genre has a large share of advertising monetization. Therefore, part of the revenue (quite substantial) is missed.
Casual Casino
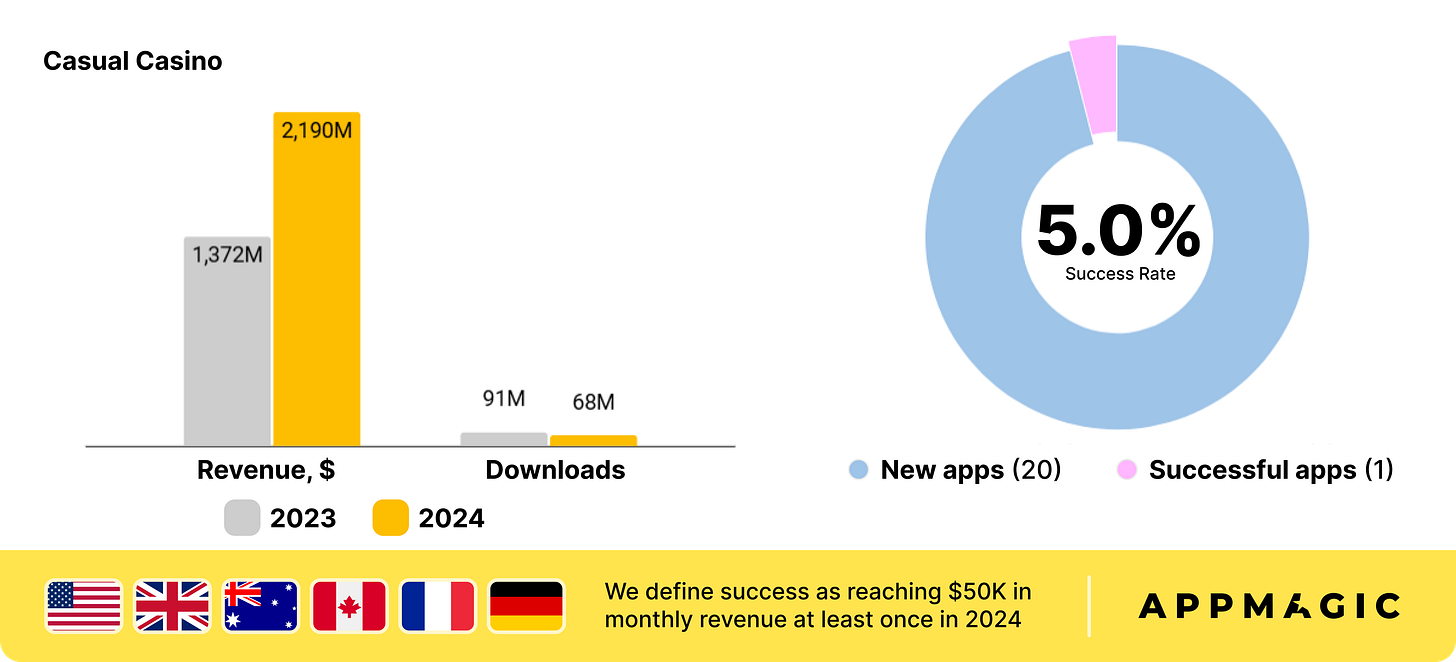
- The genre's revenue grew by 146% compared to the previous year, reaching $2.19 billion. However, downloads fell by 24% to 68 million. At the same time, the level of influence of Monopoly GO! on the genre is so high that when we evaluate the genre's performance, we are largely looking at the game's performance.
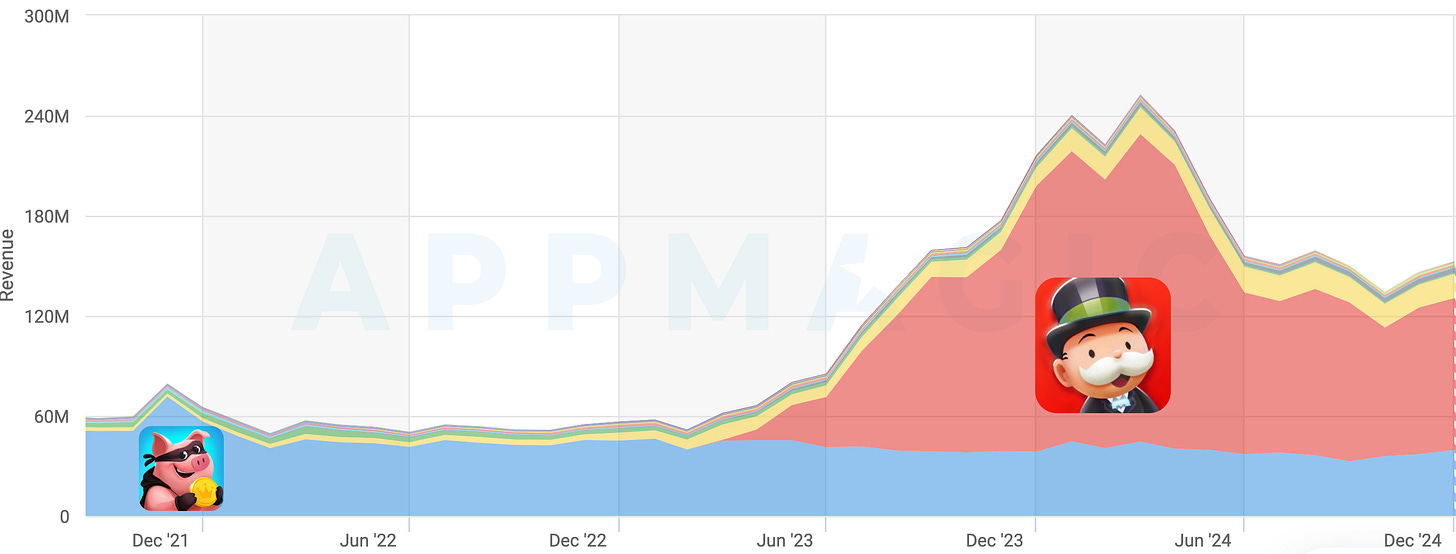
- In 2024, MONOPOLY GO! generated 55% of the entire genre's revenue, Coin Master - 18%, Dice Dreams - 7%. This is one of the most monopolized genres in the industry.
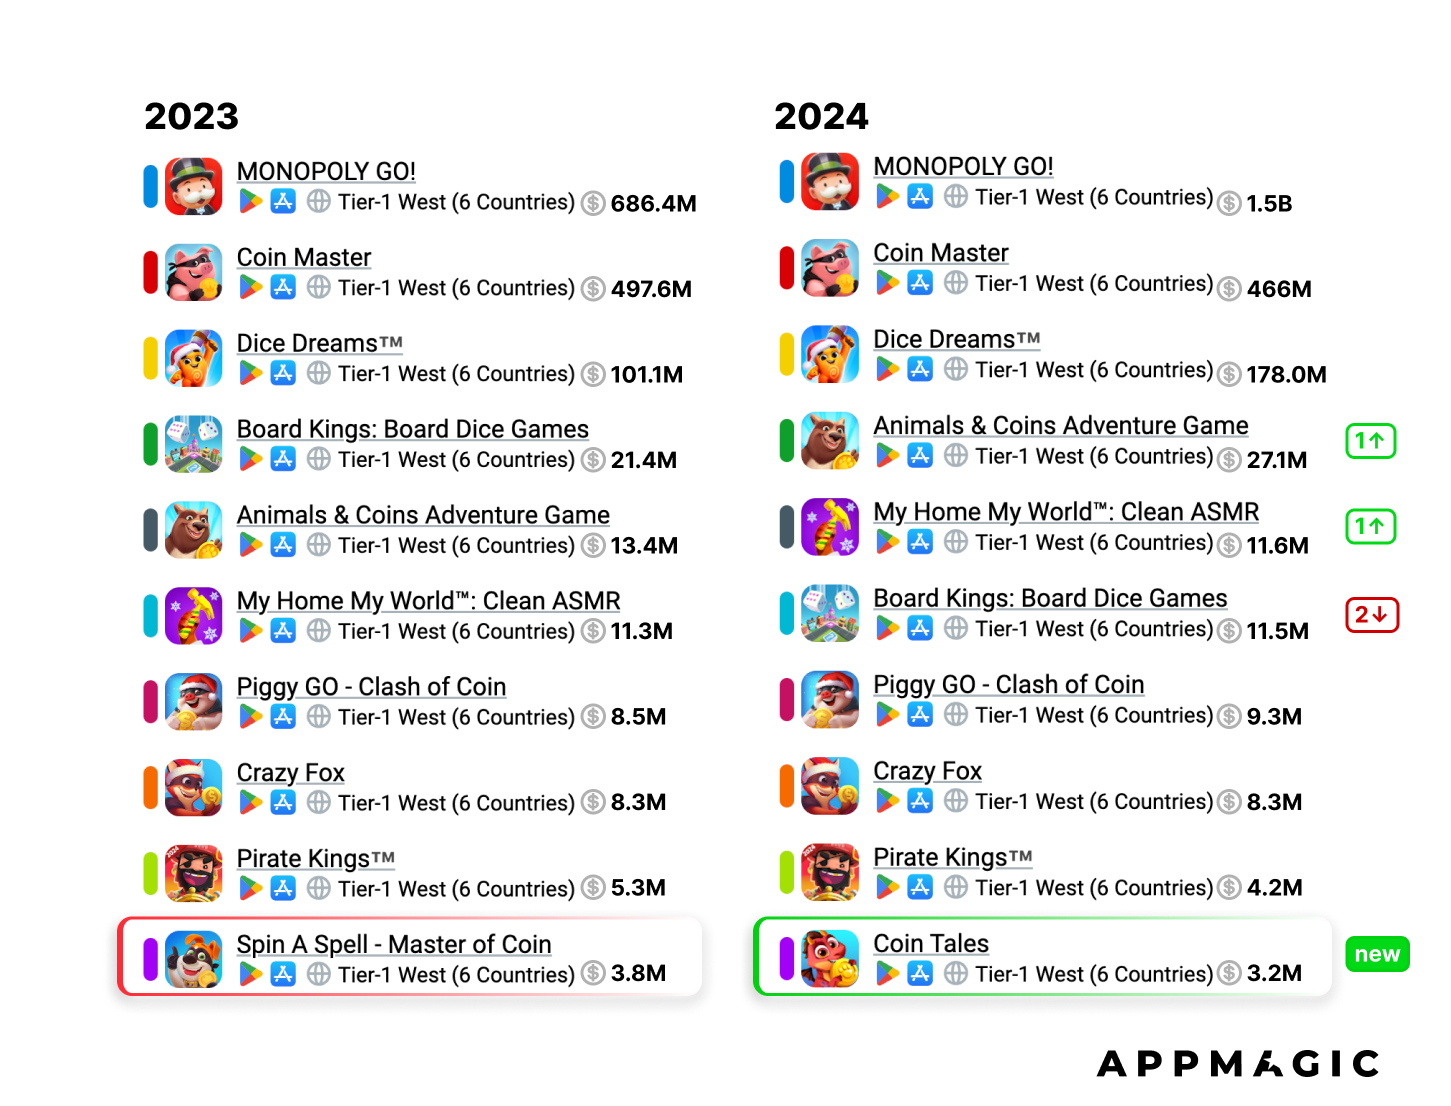
- The situation in the top 10 is stable. The only new project is Coin Tales. And 4 projects belong to Playtika - Coin Master, Dice Dreams, Animals & Coins Adventure Game, and Board Kings: Board Dice Games.
- In 2024, 17 projects were released in the genre, and only 1 of them managed to exceed the $50,000 per month mark. Fishing Travel from Ark Game succeeded.
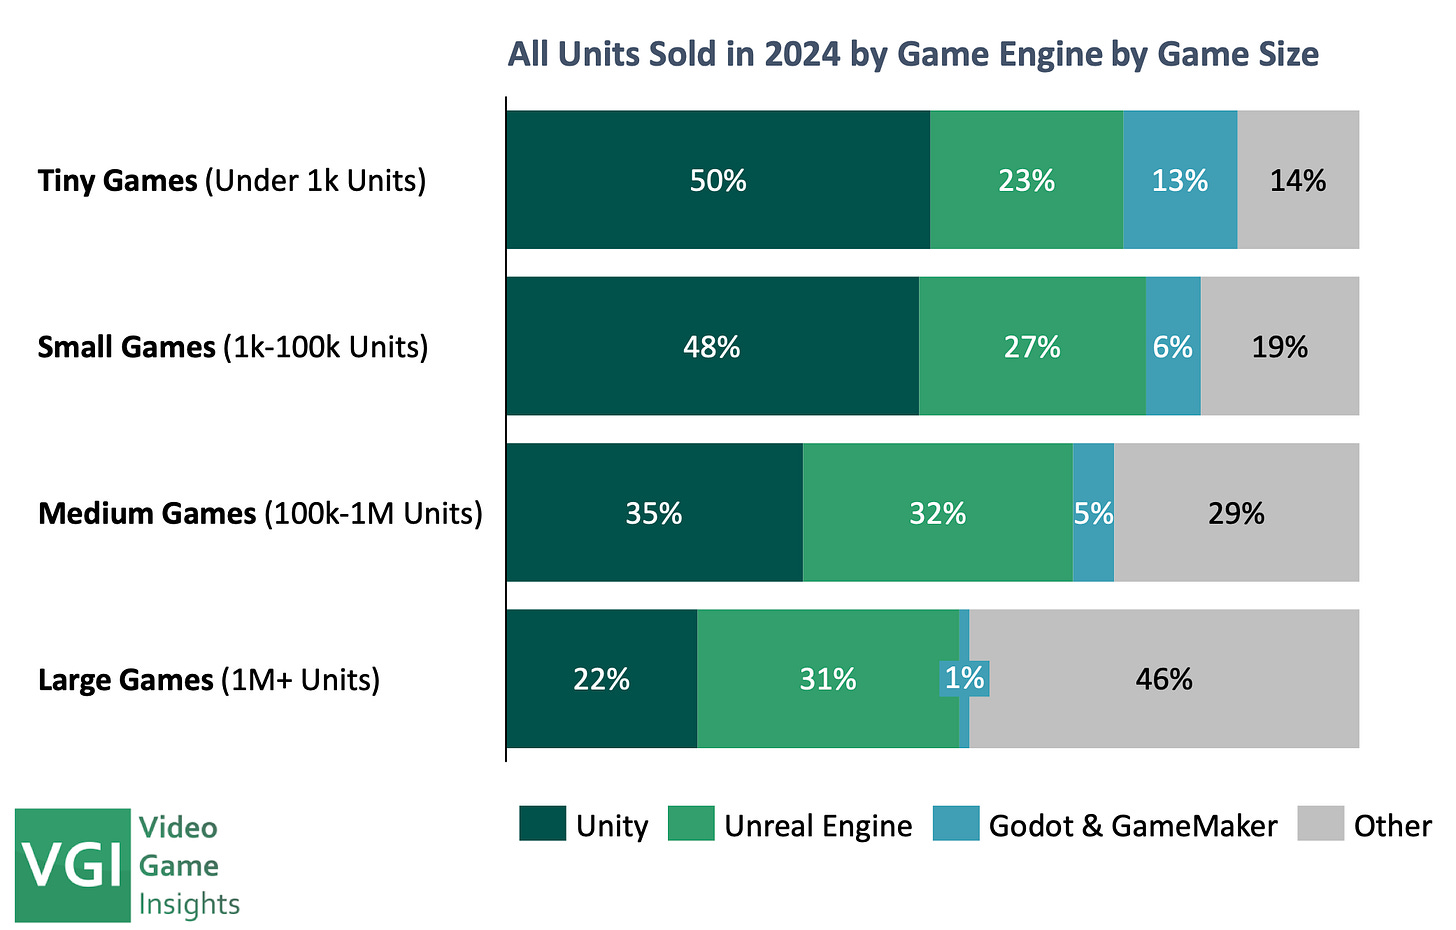
Video Game Insights: Game Engines on Steam in 2025

The sample size is over 13,000 games on Steam.
Overall state of engines in the market
-
51% of all games released on Steam in 2024 were made with Unity. 28% were made with Unreal Engine, 5% - with Godot, 4% - with GameMaker.
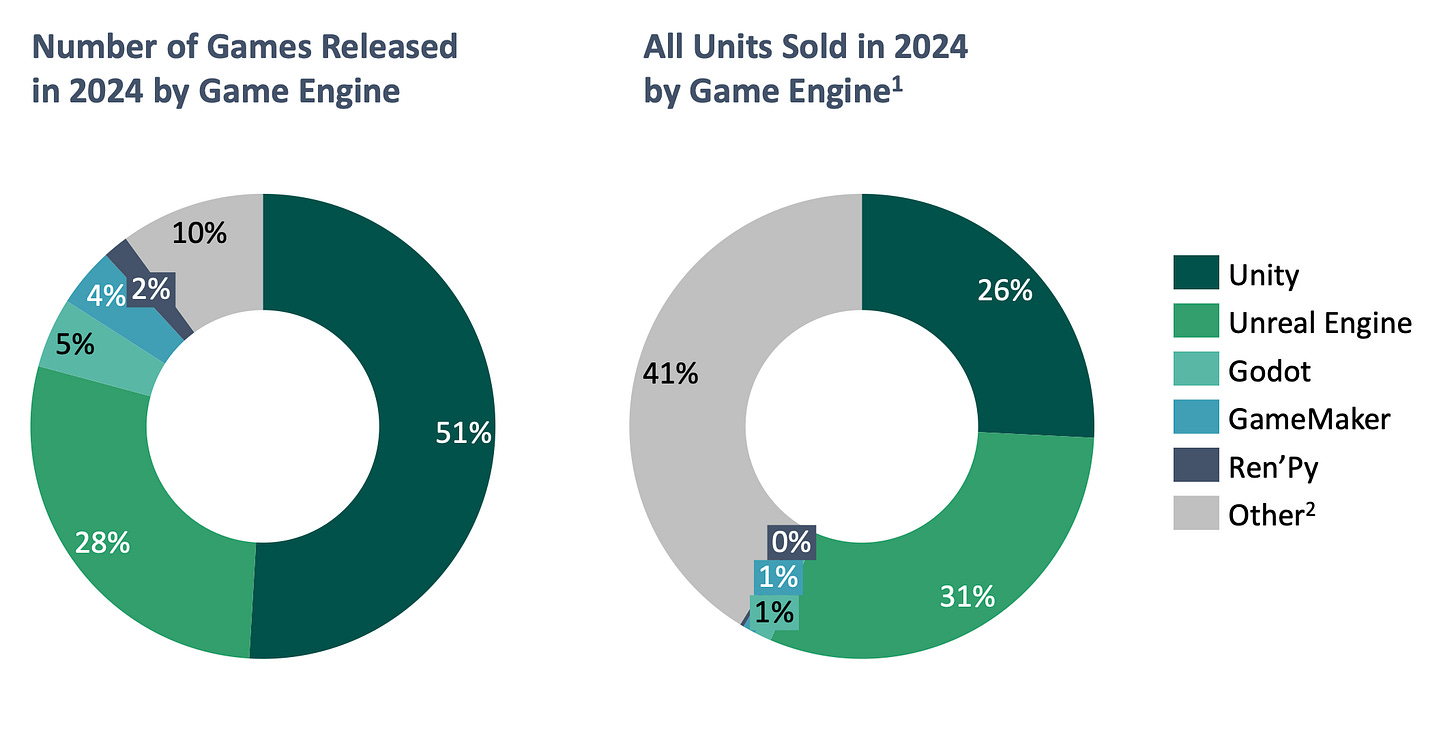
- However, when it comes to revenue, the situation changes dramatically. 41% of all money was earned by games on custom internal engines (mainly AAA projects). Games on Unreal Engine earned 31%, while on Unity - 26%. The shares of other engines in revenue are minimal.
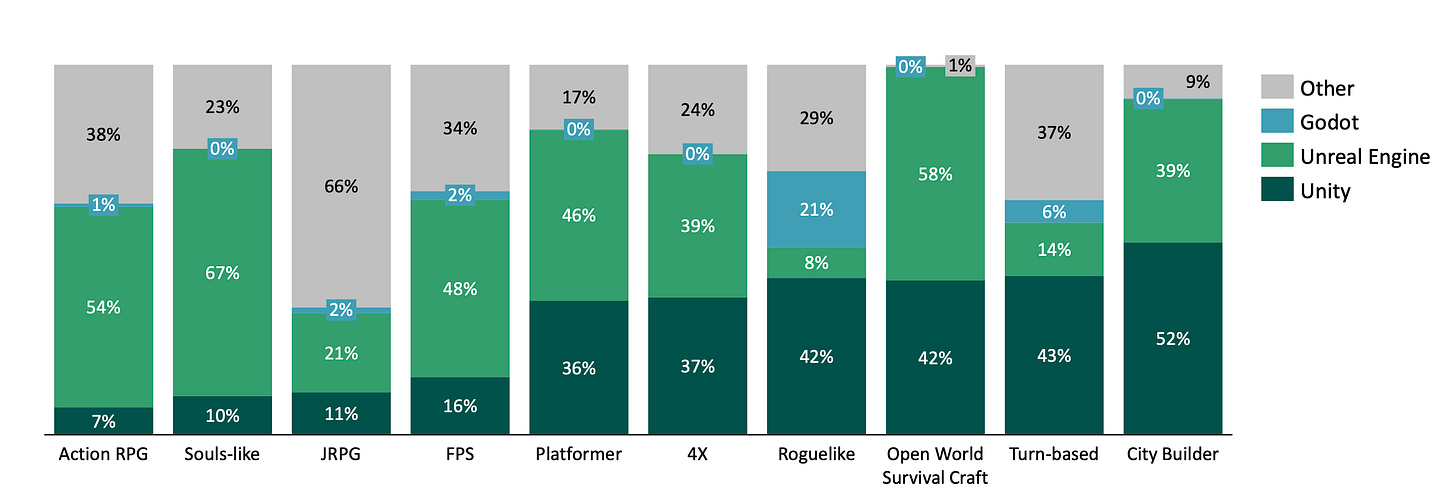
- When looking at projects by category, several dependencies are visible. Smaller projects are most often made with Unity, Godot, and GameMaker. The more successful the project, the more likely it's made with a custom engine. It's also evident that Unreal Engine is more popular among developers working on medium-sized and larger projects.
Trends in engine usage over the past 13 years
-
The popularity of custom engines is decreasing. In 2012, 71% of all games were released on them, while in 2024 - only 13%. This is due to the growth in the number of indie projects, increased accessibility of public engines, as well as high costs of maintaining proprietary engines.
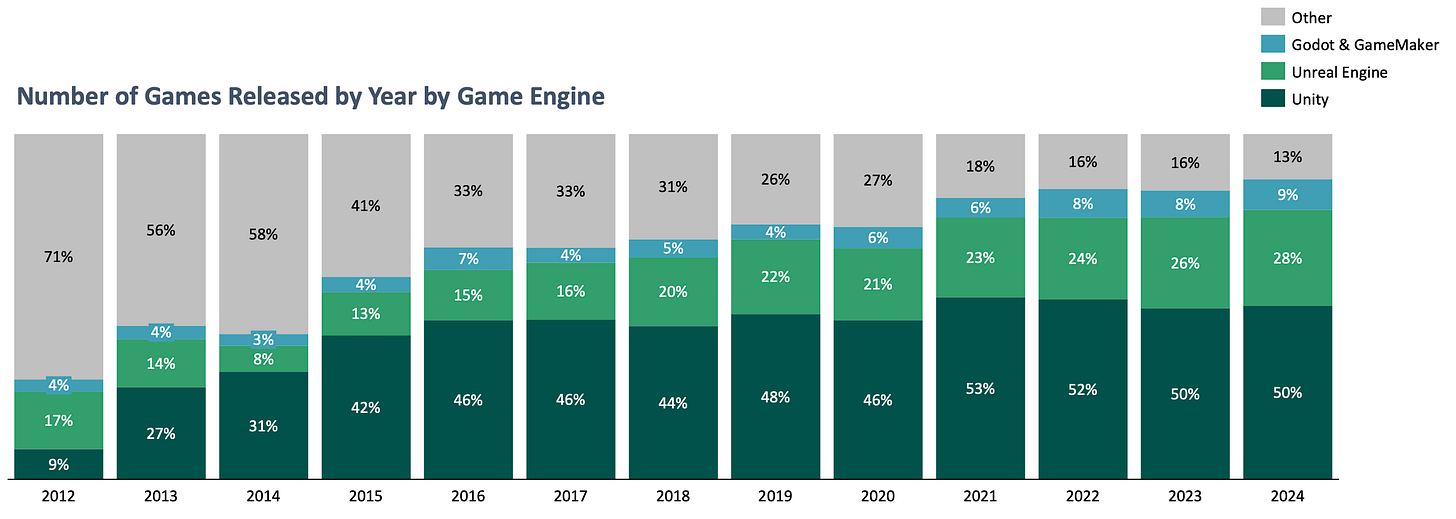
- Unreal Engine has been gradually capturing a larger market share since 2015. Unity, on the other hand, has started to lose some ground since 2021.
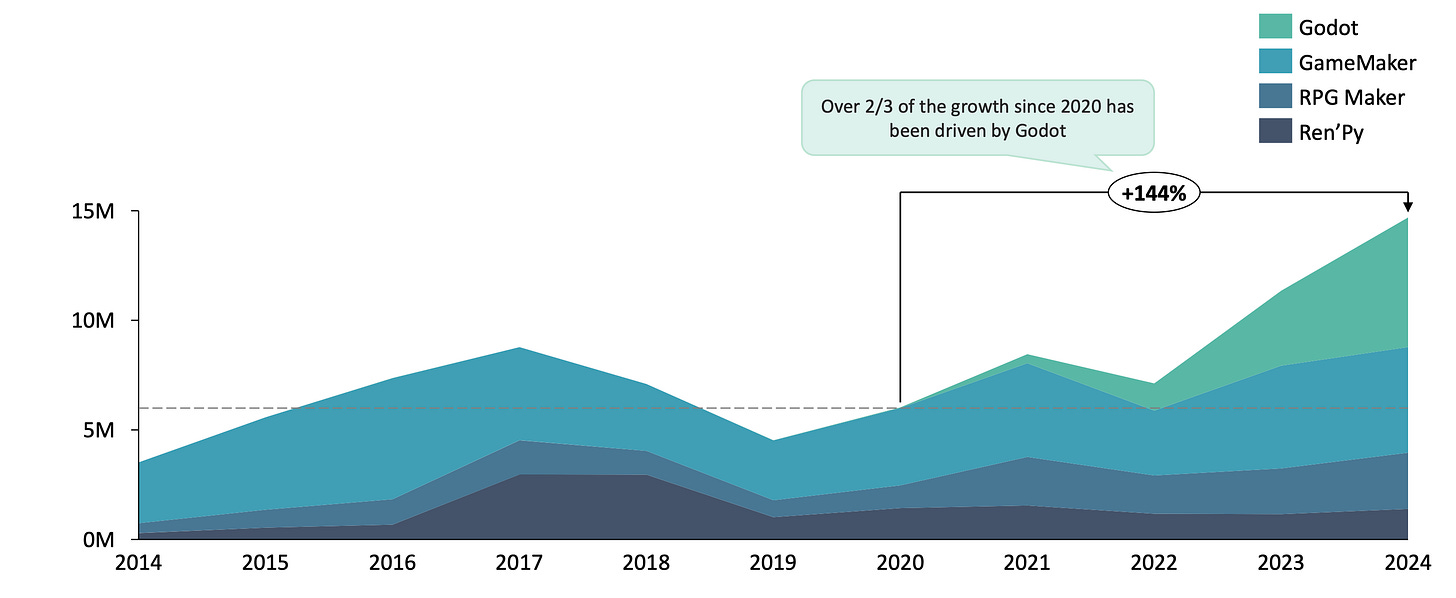
- The popularity of Godot and GameMaker has grown over the past few years, mainly among small teams.
- When looking at engines in the revenue structure, custom engines account for 42% of all money earned. For the first time since 2014, they accounted for less than half of all revenue on Steam.
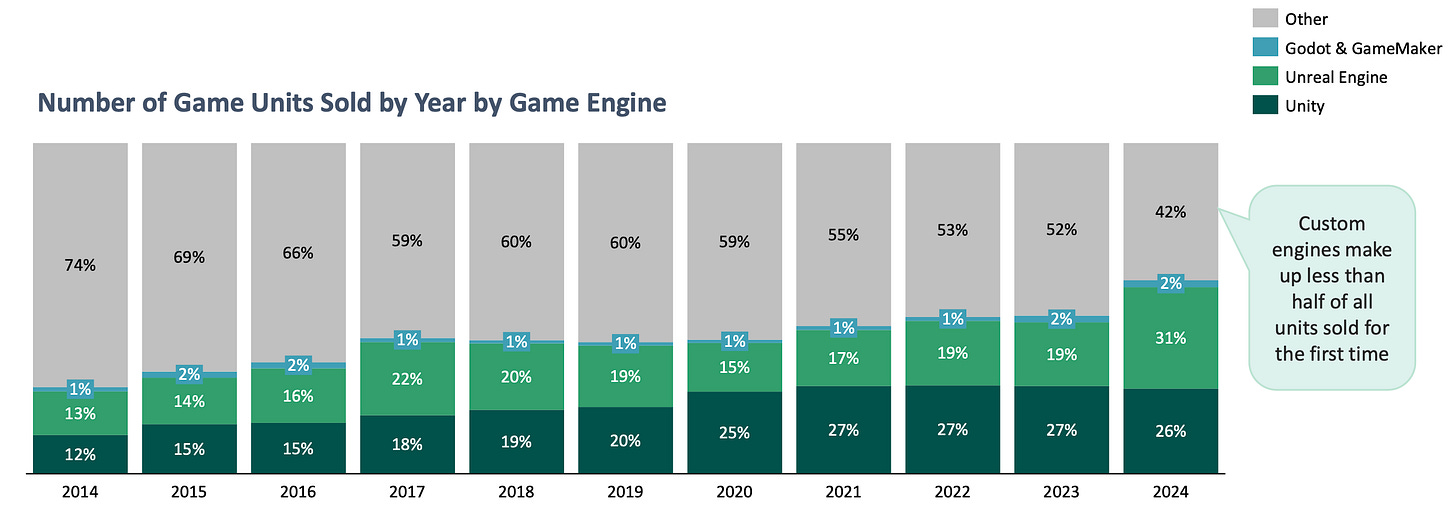
❗️This was likely influenced by two factors: firstly, there are AAA developers who have completely switched to Unreal Engine 5. Secondly, there's pressure from small developers and their financial success on the platform.
- 2024 turned out to be extremely successful for games on Unreal Engine. Projects on this engine account for 31% of all money earned on Steam. For the first time since 2018, more than projects on Unity.
- Video Game Insights predicts that the share of custom engines in the market will continue to fall while the role of Unreal Engine will grow.
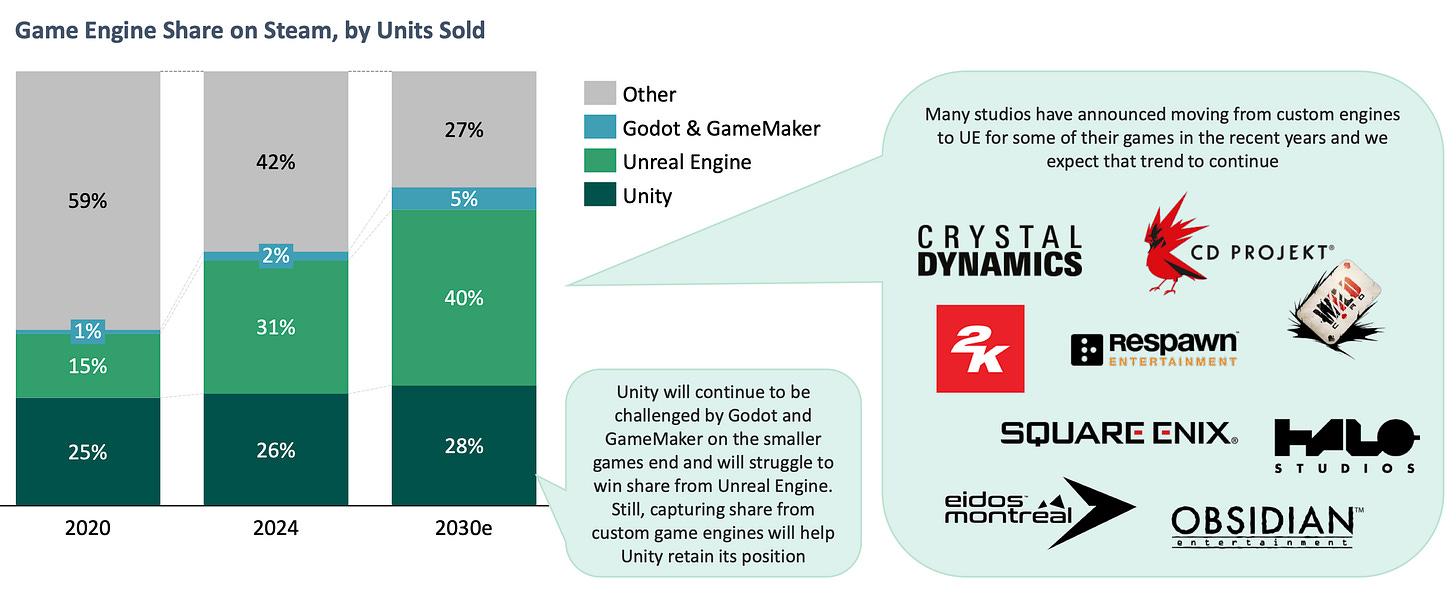
- The transition from a proprietary engine to a public one is associated with many factors - both positive (develops faster; large community; often - turns out cheaper than maintaining an internal team; easier to hire people) and negative (pricing can be unpredictable; the engine needs to be customized for own needs; lack of control; cost of transitioning from one engine to another).
- The share of Unreal Engine 5 reached 72% in 2024. Adaptation is taking a bit longer than with Unreal Engine 4.
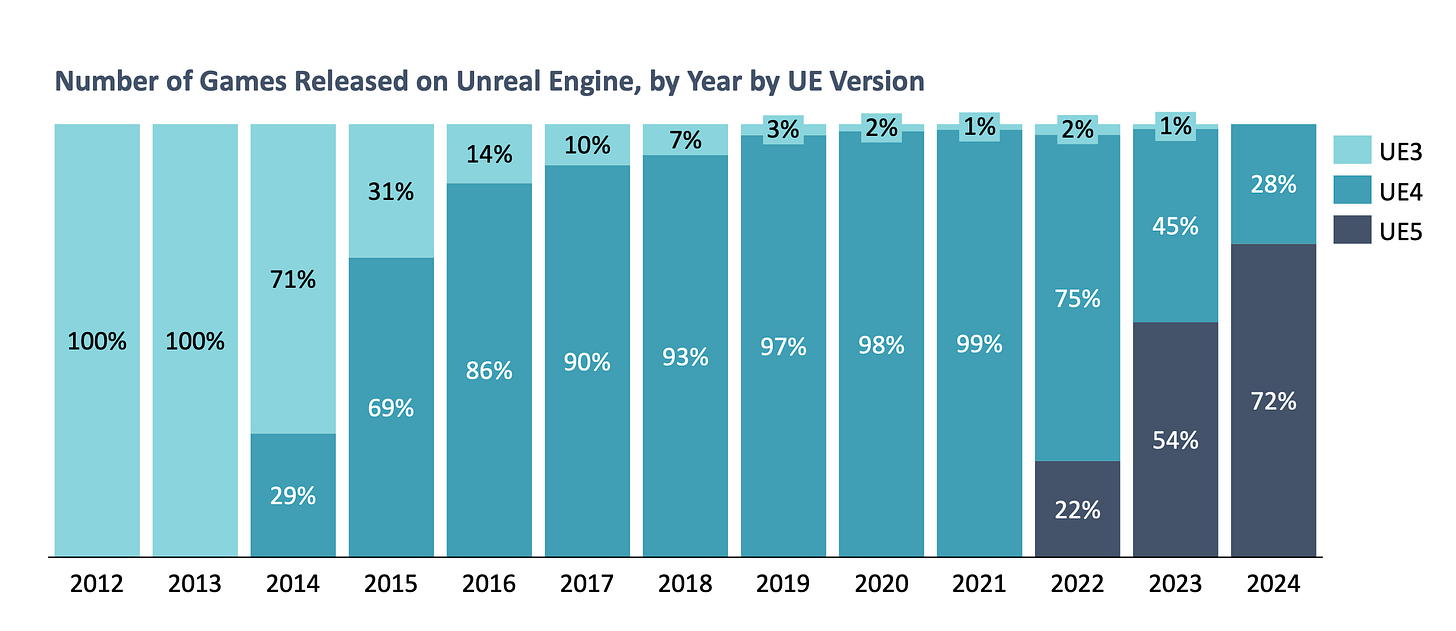
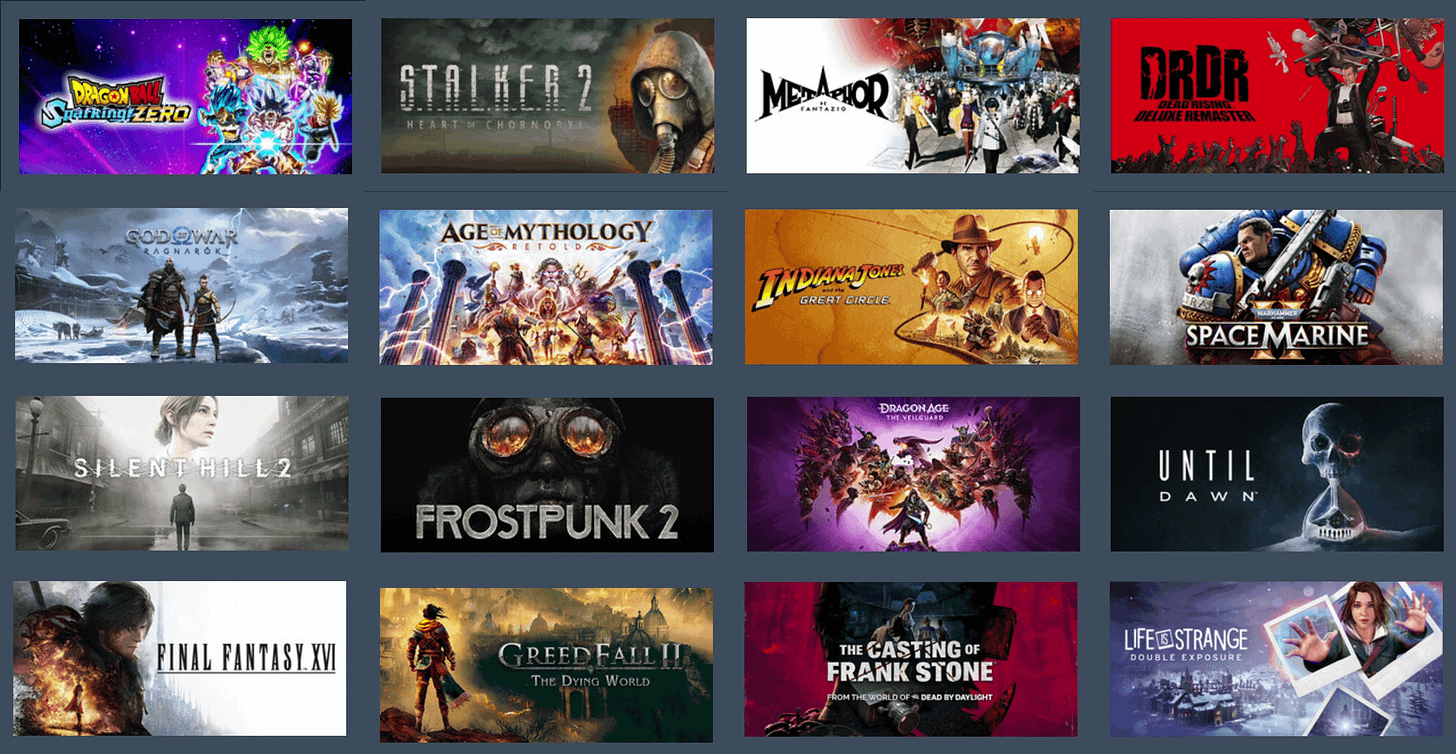
- Some of the biggest games of 2024 were made with Unreal Engine - Black Myth: Wukong, Palworld, Manor Lords, Final Fantasy VII: Rebirth; S.T.A.L.K.E.R. 2.
- Godot is the only small engine that has grown significantly in recent years.
- Statistics show that the choice of game engine heavily depends on the genre. Unity is popular among creators of city builders, turn-based RPGs, Roguelike projects. Unreal Engine's popularity is significantly higher among FPS, Souls-like projects, Action RPGs.
InvestGame: Investment activity in Turkiye in the last 5 years
The InvestGame team studied the state of one of the most active countries for game investments in the world - Turkiye. Data is collected from 2020 until now.
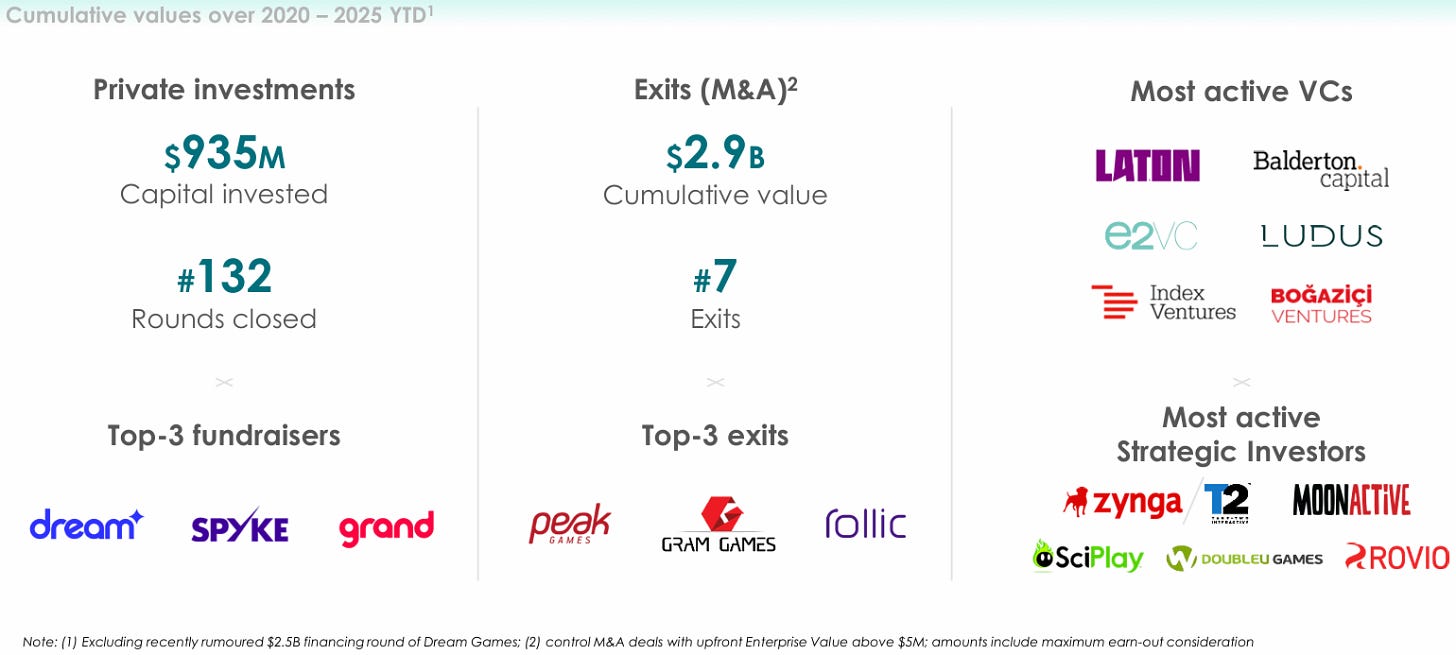
- Since 2020, Turkish companies have raised $935 million through 132 rounds. The leaders in funds raised are Dream Games, Spyke Games, and Grand Games.
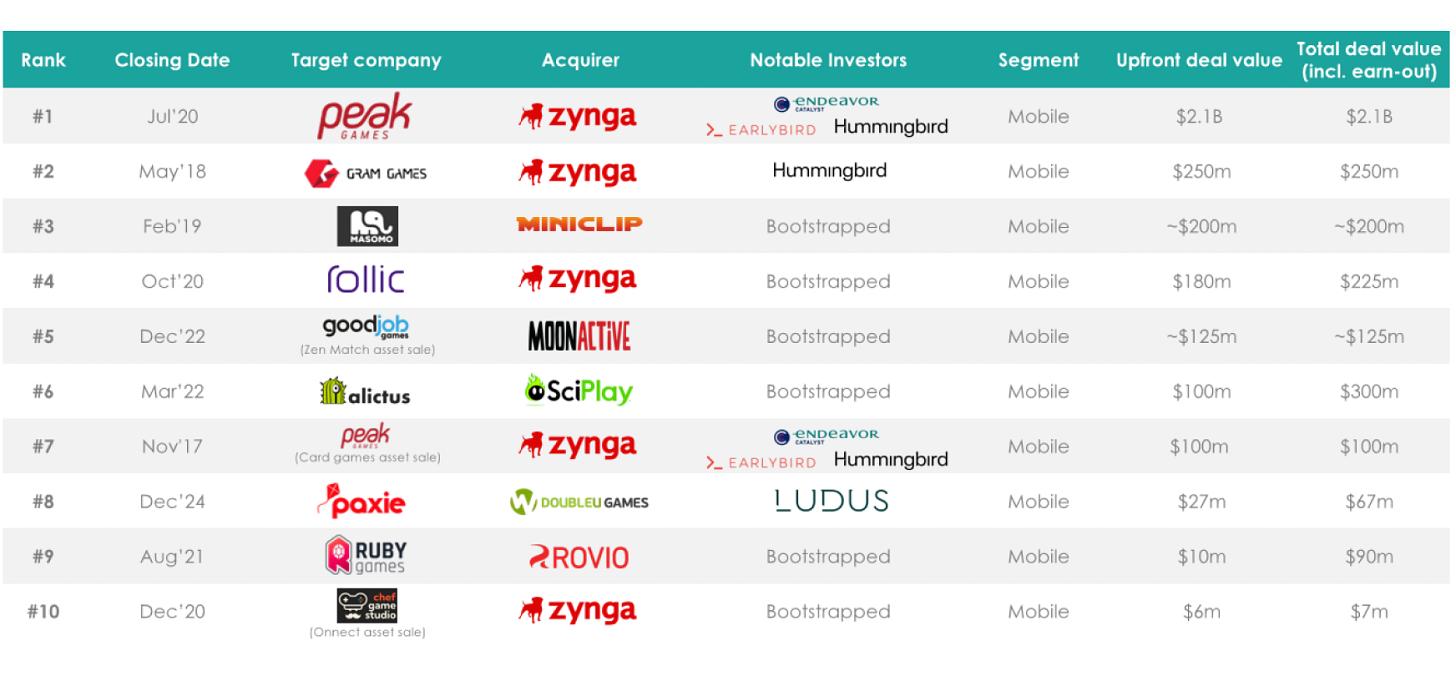
- Since 2020, Turkish companies have made 7 exits totaling $2.9 billion (this figure includes earn-outs). The leaders are Peak Games, Gram Games, and Rollic.
- Laton Ventures, Balderton Capital, e2VC, Ludus Ventures, Index Ventures, and Bogazici Ventures are the most active VC funds in the country. Among strategic investors, the greatest interest in the market is shown by Zynga (Take-Two Interactive), Moon Active, SciPlay, DoubleU Games, and Rovio.
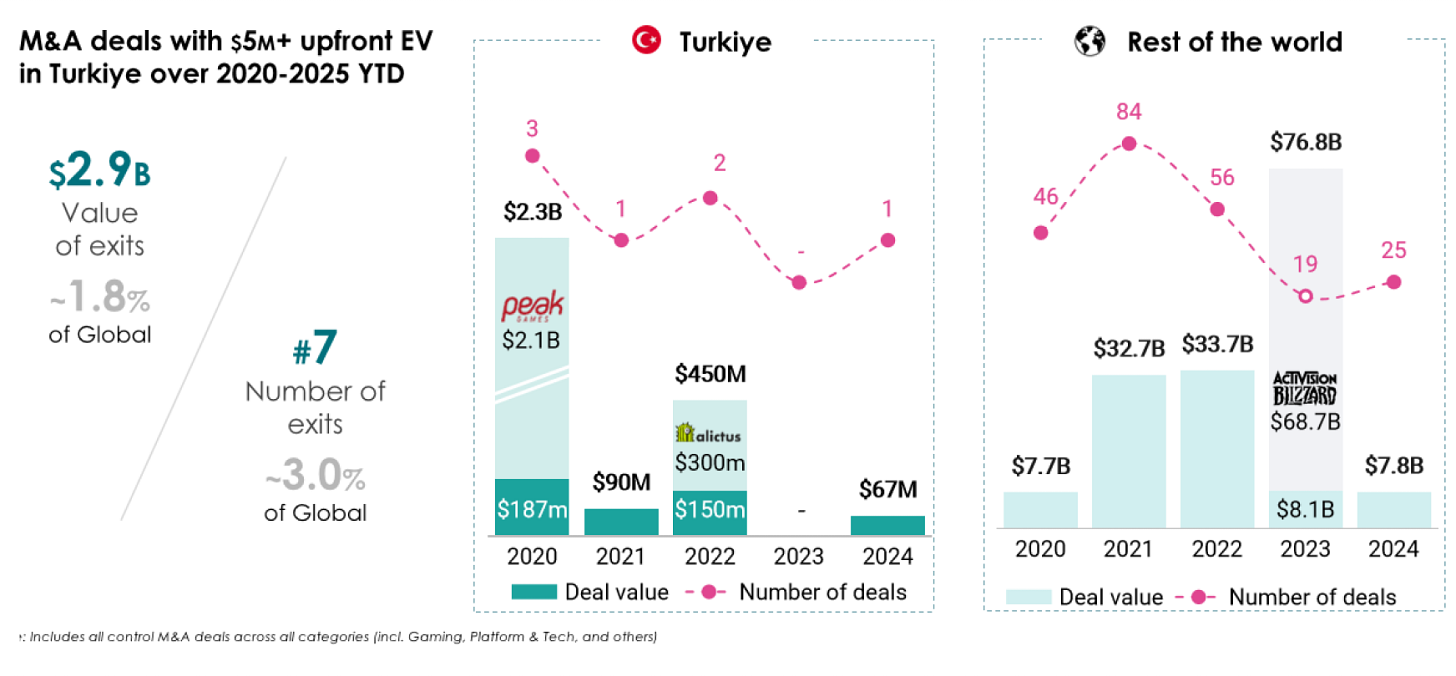
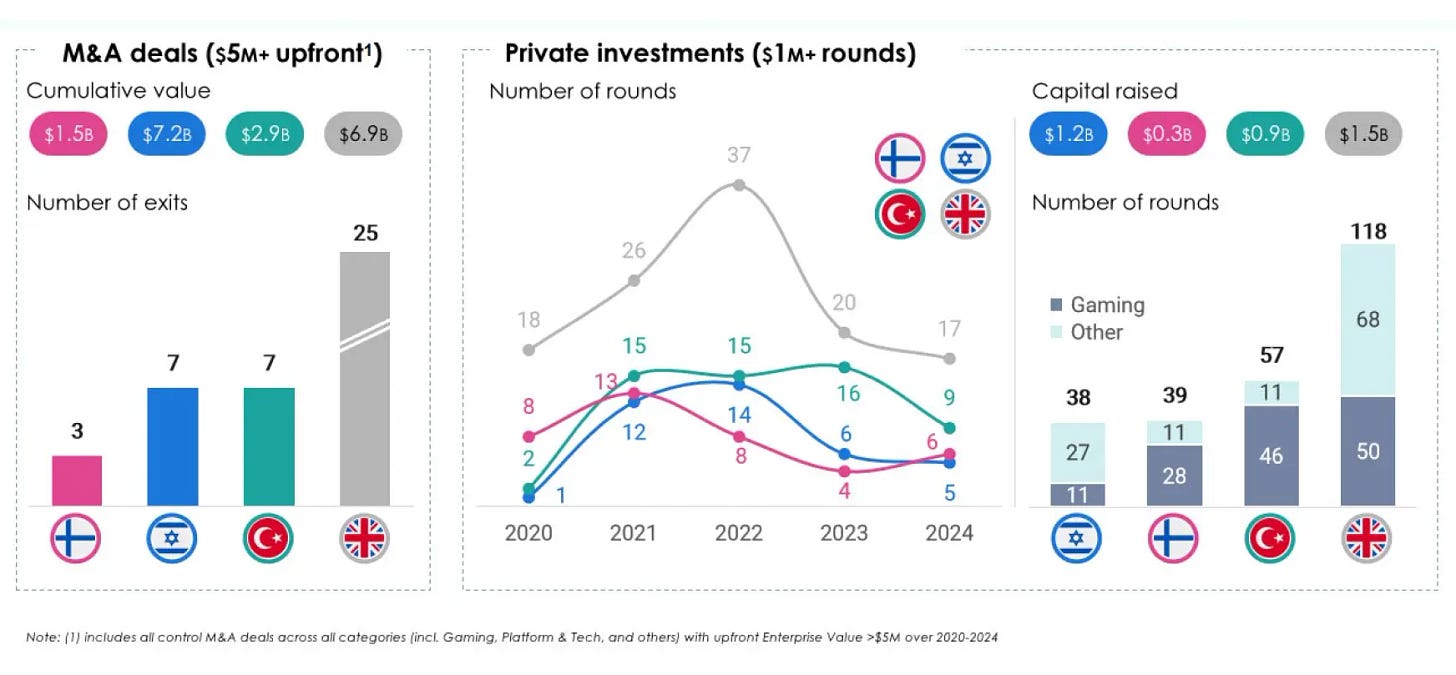
- Since the beginning of 2020, Turkiye has accounted for 1.8% of the total volume of M&A transactions and 3% of all exits.

If you’re in mobile marketing or working with creatives, here’s something worth checking out — a tool built for all marketing operations. It predicts campaign performance (on iOS too), provides full metrics transparency (more than 200 of them), allows you to operate creatives easily, and has many other cool features. Details are available on the website.
All MY.GAMES’ marketing teams have been using it internally for years and are happy with how it simplifies the entire marketing cycle. If you’re interested in making your UA journey easier and more efficient, you can book a demo to see. For a better price, refer to my name!
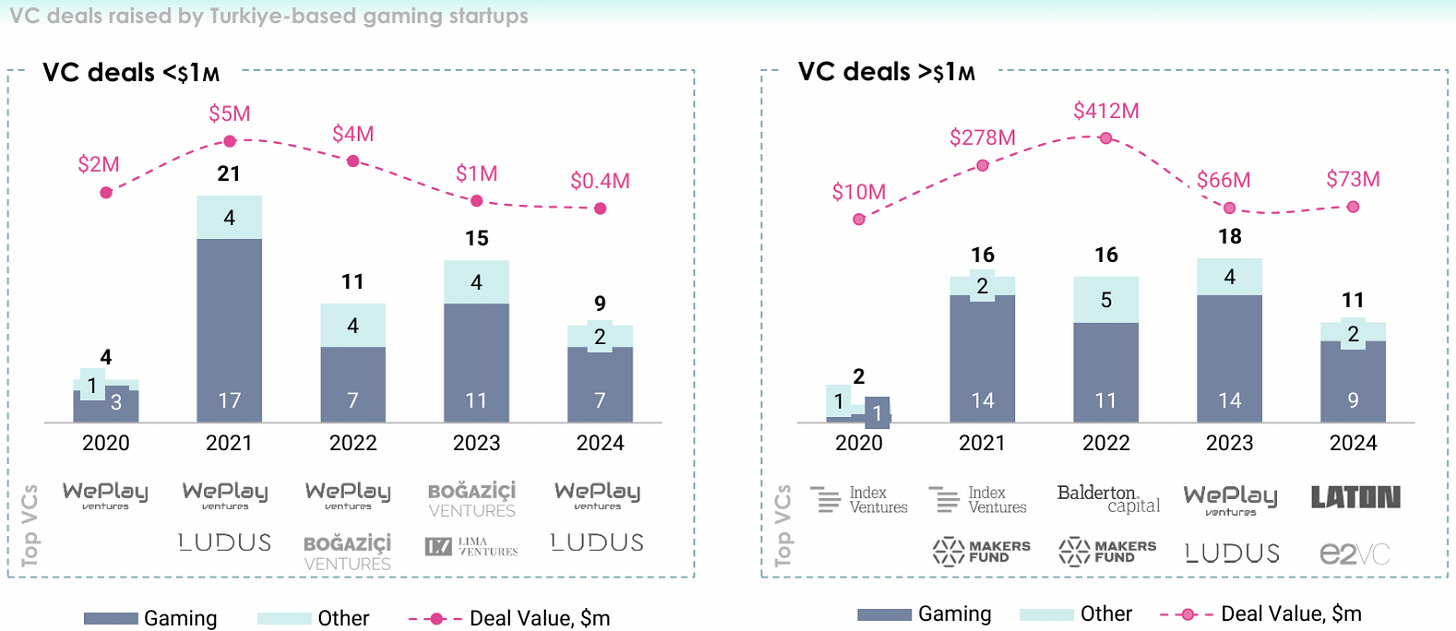
- VC activity in Turkiye is noteworthy. The country has a developed investment infrastructure that allows attracting both small rounds (up to $1M) with the help of specialized investors, accelerators, and business angels and large rounds (more than $1M) with the participation of a large number of VC funds.
- New players are also appearing on the market; for example, Laton Ventures began operations in Turkiye in 2024 and immediately became the leader in the number of deals in which it acted as the lead investor.
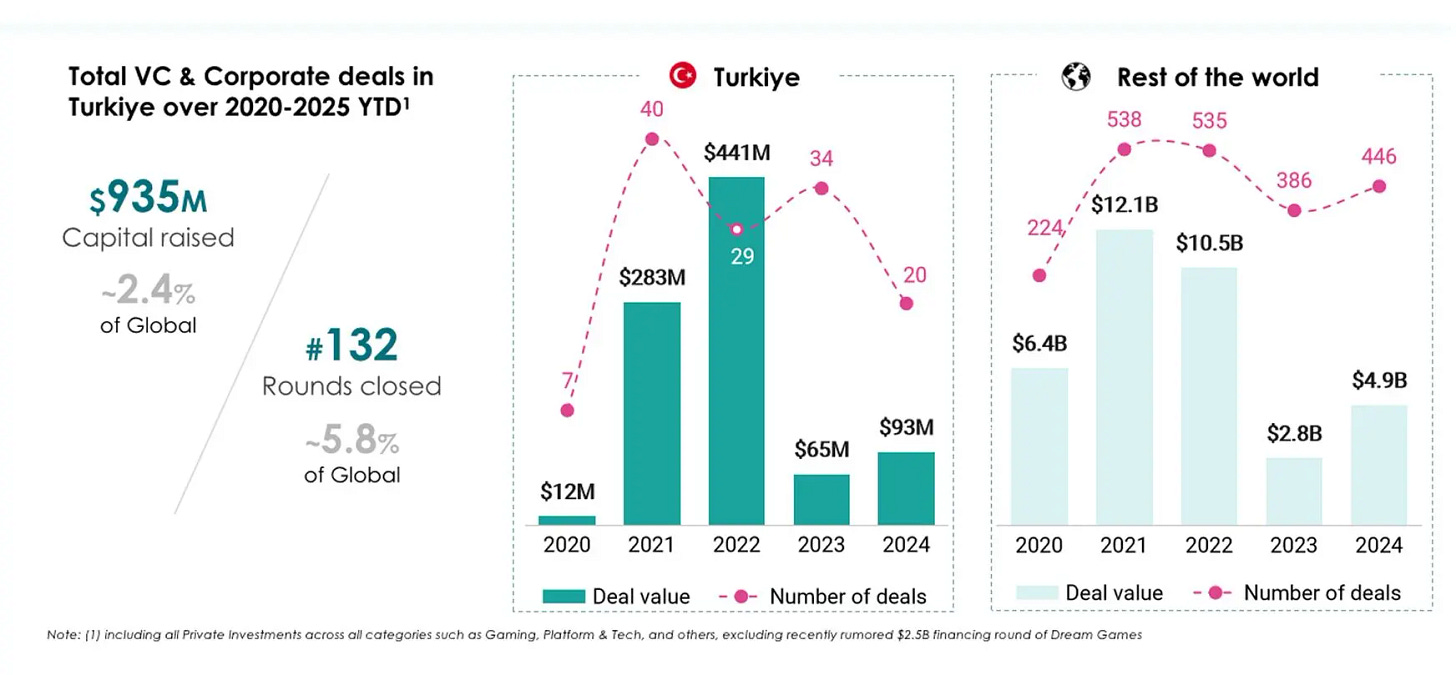
- From the point of view of business activity, since 2020, Turkiye has accounted for 5.8% of all global deals in games and 2.4% of the total volume. It is noteworthy that even after the “big” years of 2021 and 2022, business activity in 2023 did not slow down - 33 early-stage deals were made. The average round size decreased (to $1.9 million per round).
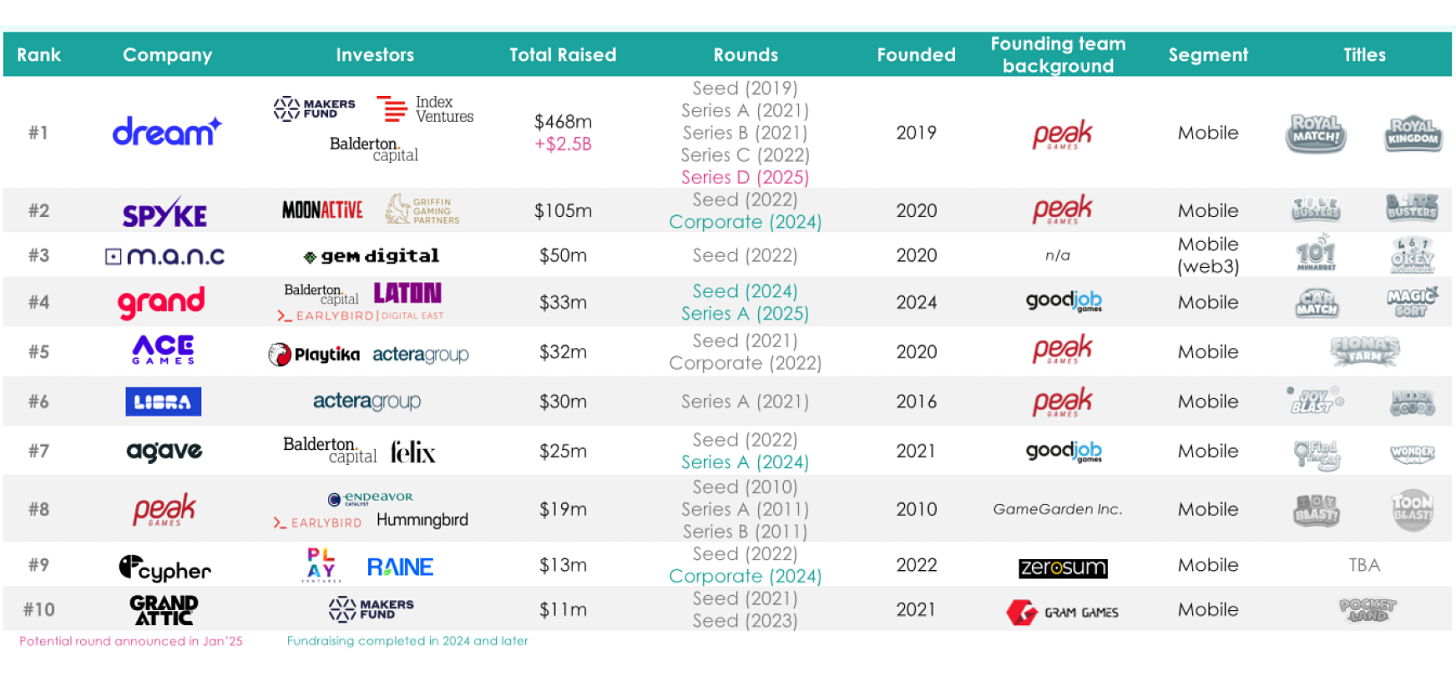
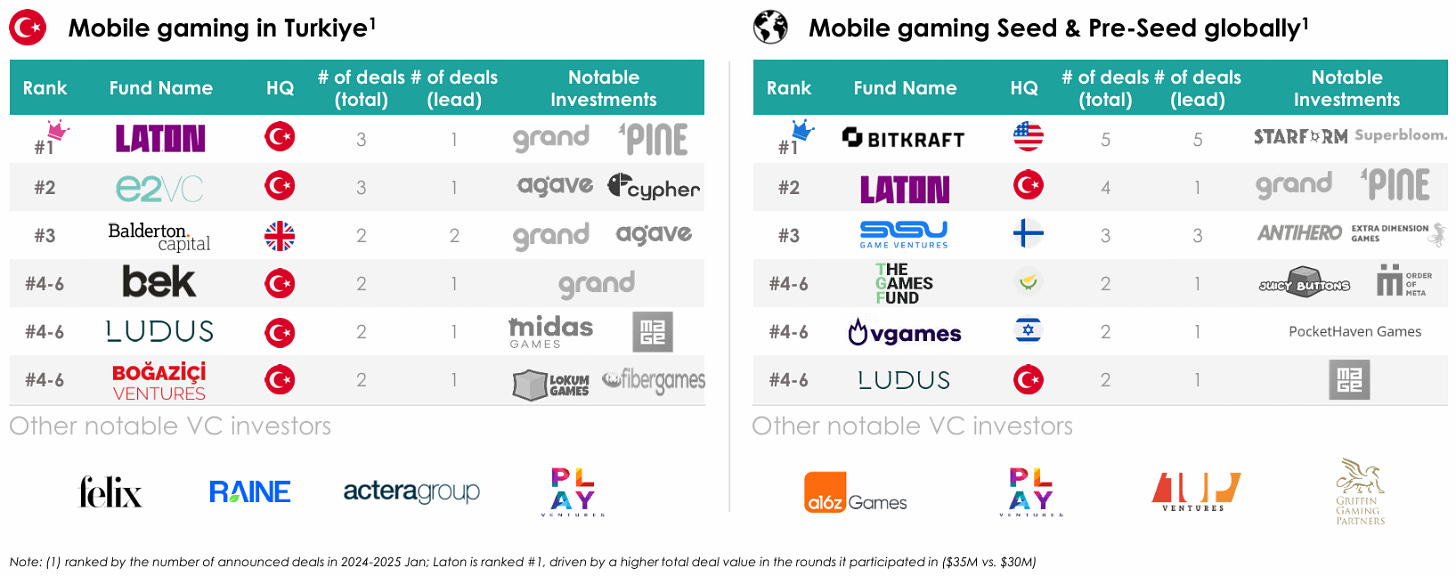
- In the list of the most notable Turkish startups, all are engaged in the development of casual projects. There is not a single midcore project in the top 10.
- Turkiye is one of the leaders among the countries of Europe and the MENA region both in terms of the number of rounds and in terms of the volume of funds raised. Turkiye stands out from other countries in terms of investment activity at an early stage and occupies a leading position in terms of the number of M&A transactions.
GameDiscoverCo: Top PlayStation and Xbox games by DAU in 2024
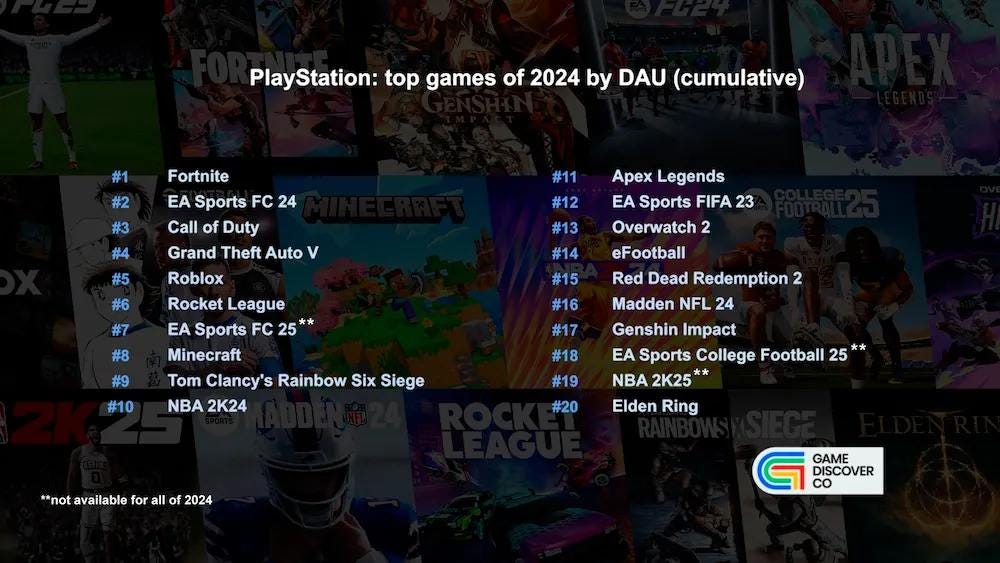
- Fortnite is the clear leader on both platforms. Simon also highlights Rocket League's ability to retain its audience, ranking 6th on PlayStation and 7th on Xbox.
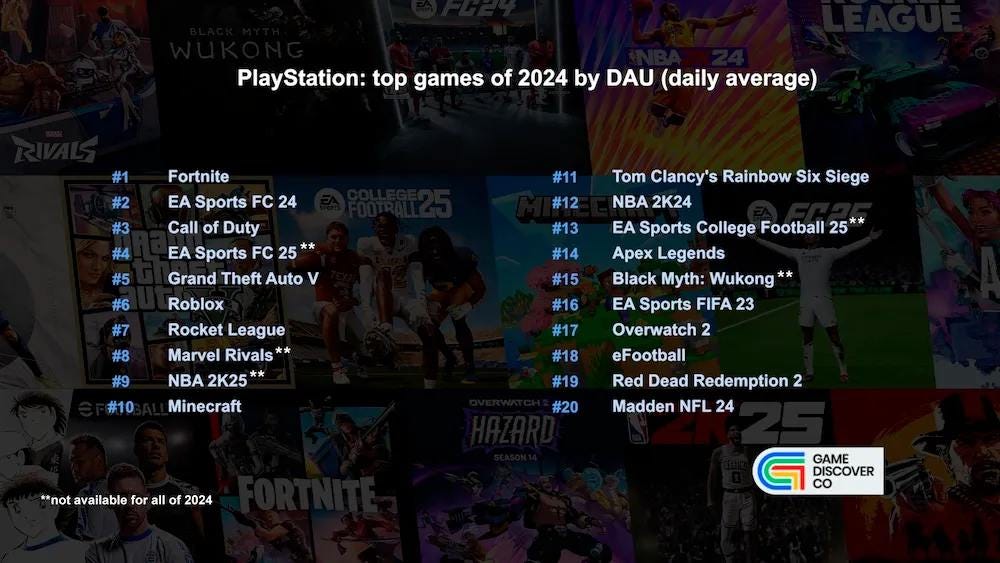
- On PlayStation, free-to-play games eFootball and Genshin Impact made it into the DAU top list.
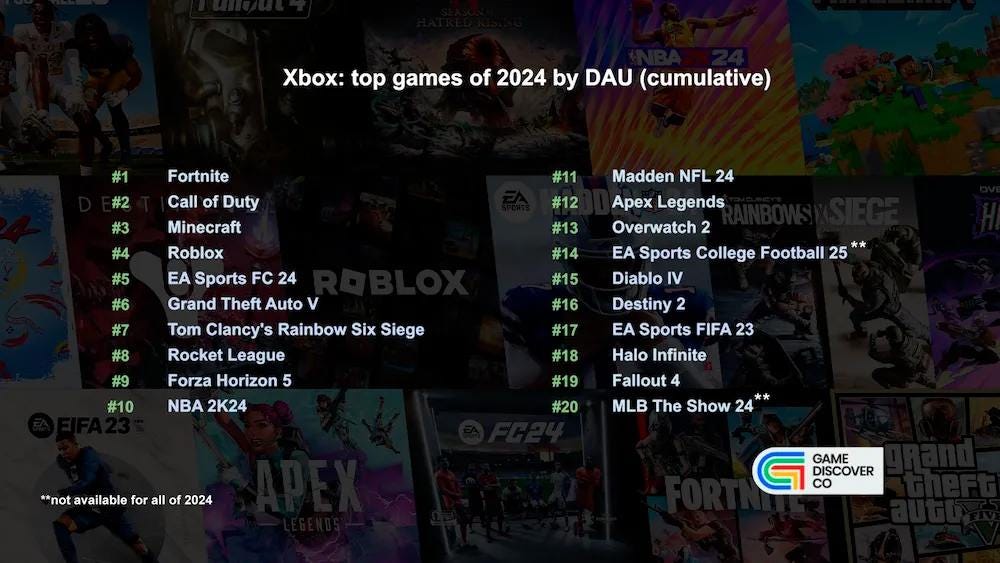
- Sports simulators dominate, with 8 out of the top 20 games on PlayStation and Xbox being from this genre.
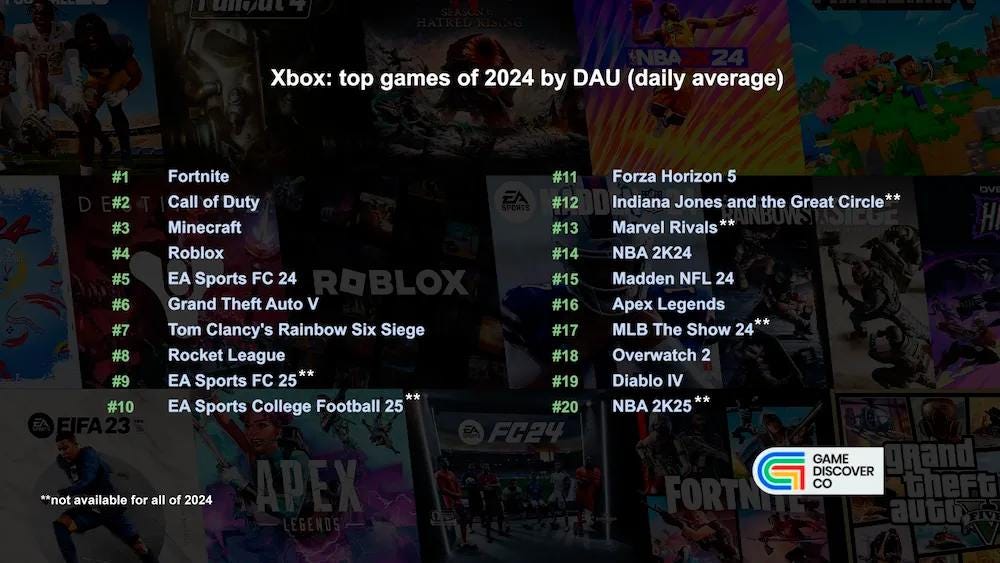
- The list features few new projects. Among the newcomers, Marvel Rivals stands out. On Xbox, Indiana Jones and the Great Circle attracted significant audience attention (but being a single-player game, this is probably a one-time spike). All other titles are either annual releases, major franchises, or well-established games.
How to Market a Game: Steam in 2024
Chris Zukowski examined the state of Steam in 2024.
Figures are provided by VG Insights. Chris removed projects based on major IPs and projects not translated into English. The list includes games classified by VG Insights as AA or indie. Some projects associated with large companies (like Tencent) were manually removed from the list.
Overall market status
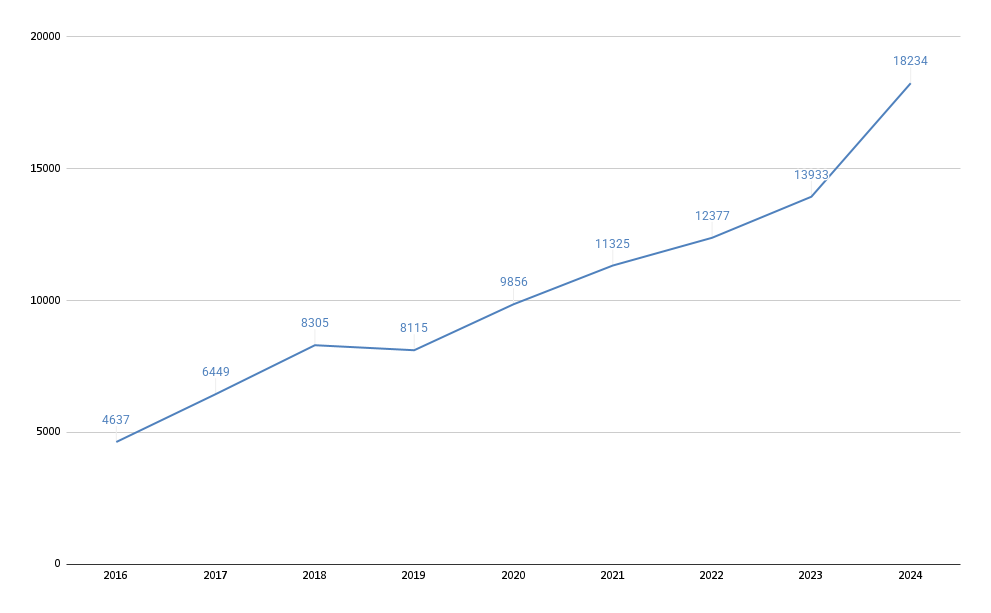
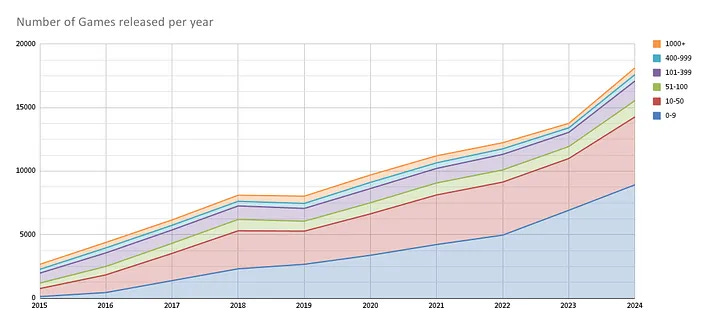
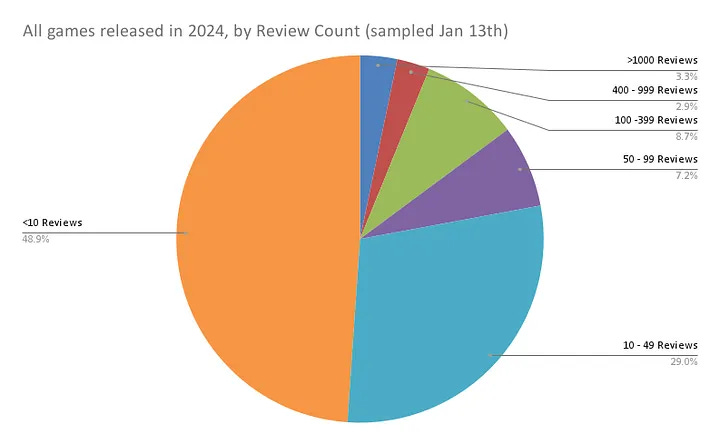
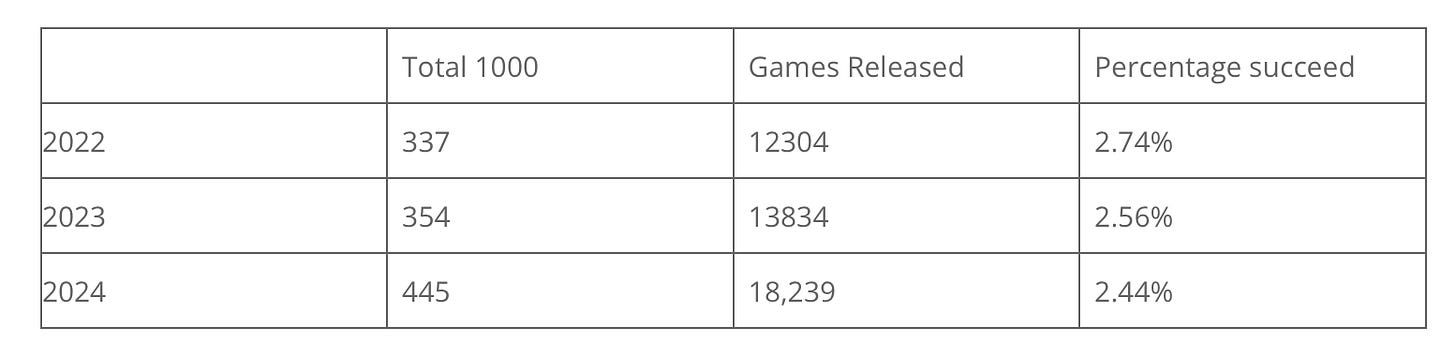
- In 2024, 18,324 games were released on Steam. This is a historical record and 30.8% more than the previous year.
- However, upon closer inspection, 75% of these projects have fewer than 50 reviews. There's a high probability that these are very small projects that never managed to break through the platform's information noise.
- At first glance, the year seems successful for indie developers. In the 2024 calendar year, 445 indie game and AA project developers surpassed the 1,000 review mark. This is 25% more than last year.

❗️In Chris's methodology, 1,000 reviews is the benchmark at which a game can be considered successful. Of course, this is a very conditional figure.
- However, considering the number of projects released to the market, the actual success rate fell to 2.44%.
Genres and Trends
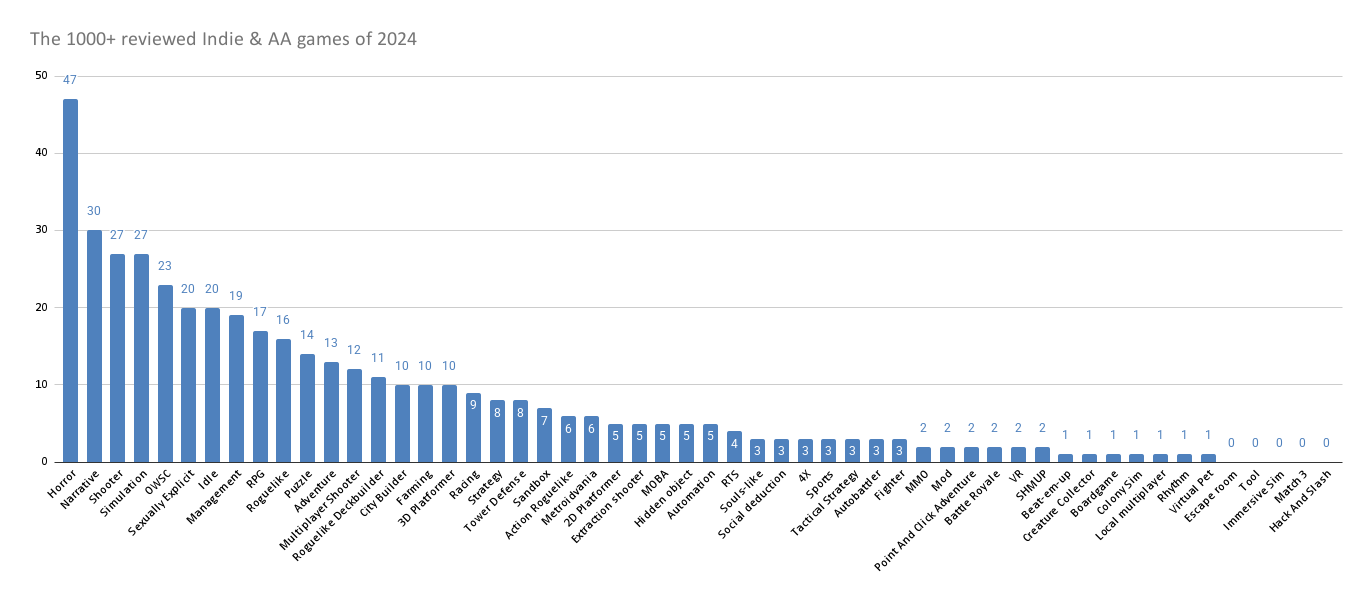
- Chris suggests distinguishing between trends and working genres on the platform. Many genres popular now were also popular 20 years ago. In particular, simulators have been in the top 10 for "success" for the last 3 years.
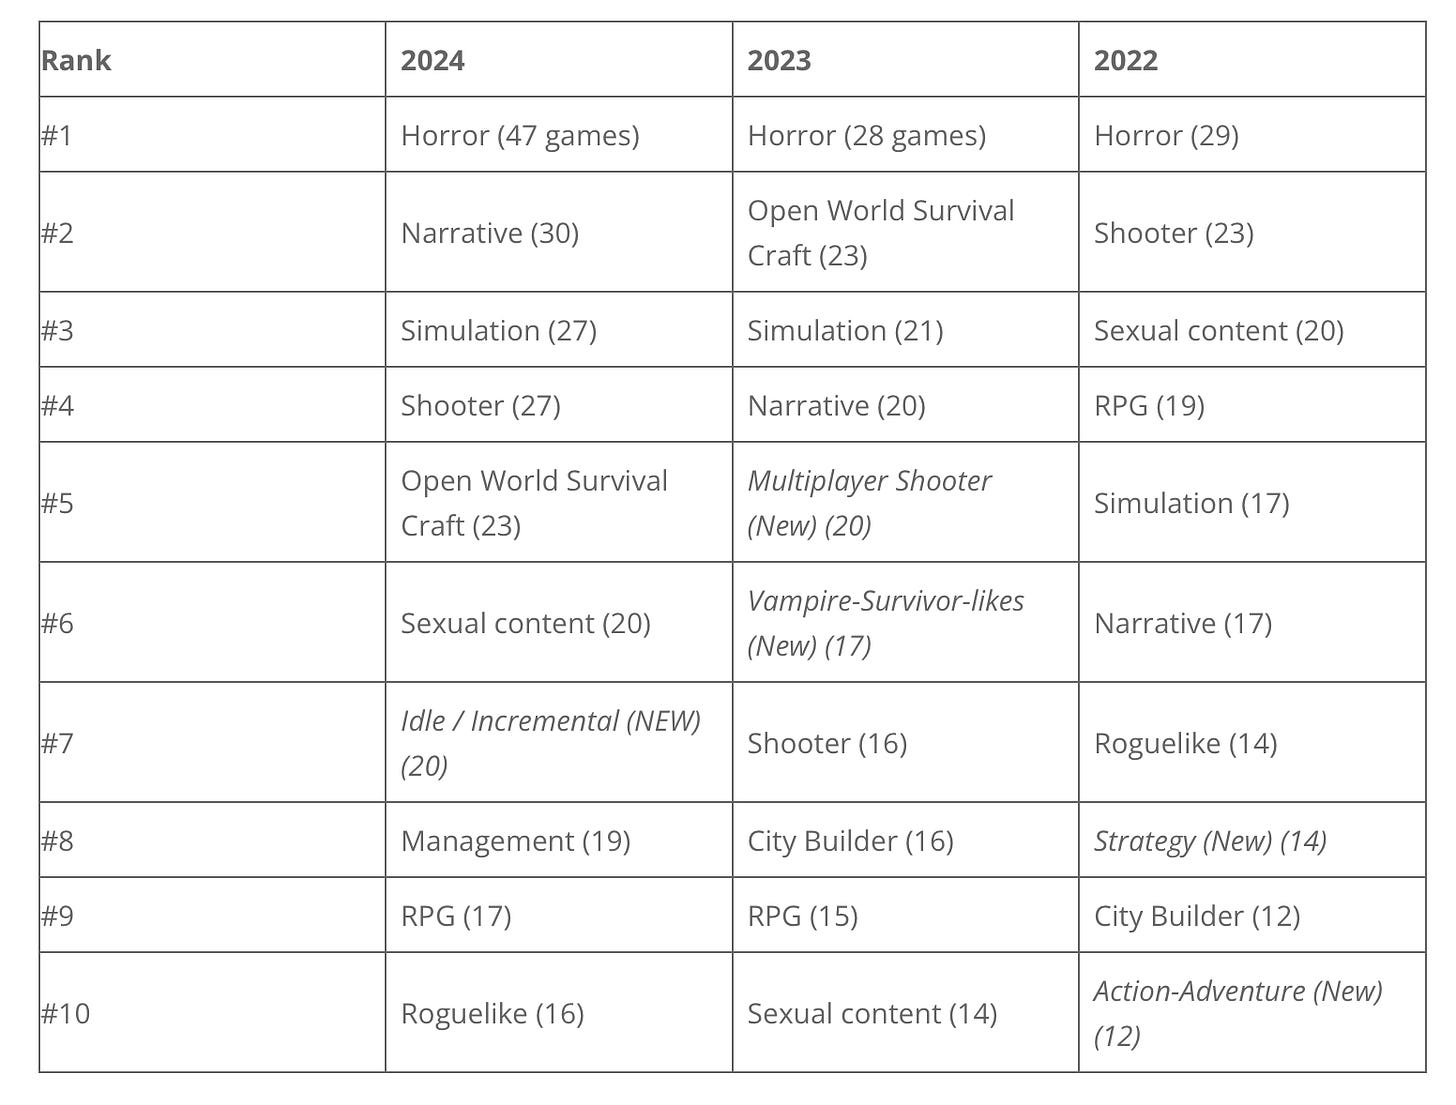
- But a trend example is Vampire-Survivor-like projects. It quickly appeared at the top and just as quickly left it.
- Speaking of interesting genres, horror is the #1 genre on Steam in the last 3 years in terms of "success" (number of projects that exceeded 1,000 reviews) for small developers.
- However, the above refers to absolute numbers. What's important is the probability of success. Here, Open World Survival Craft projects lead by a large margin (24.47% exceeded 1,000 reviews), followed by farming games (20.83% chance of success).
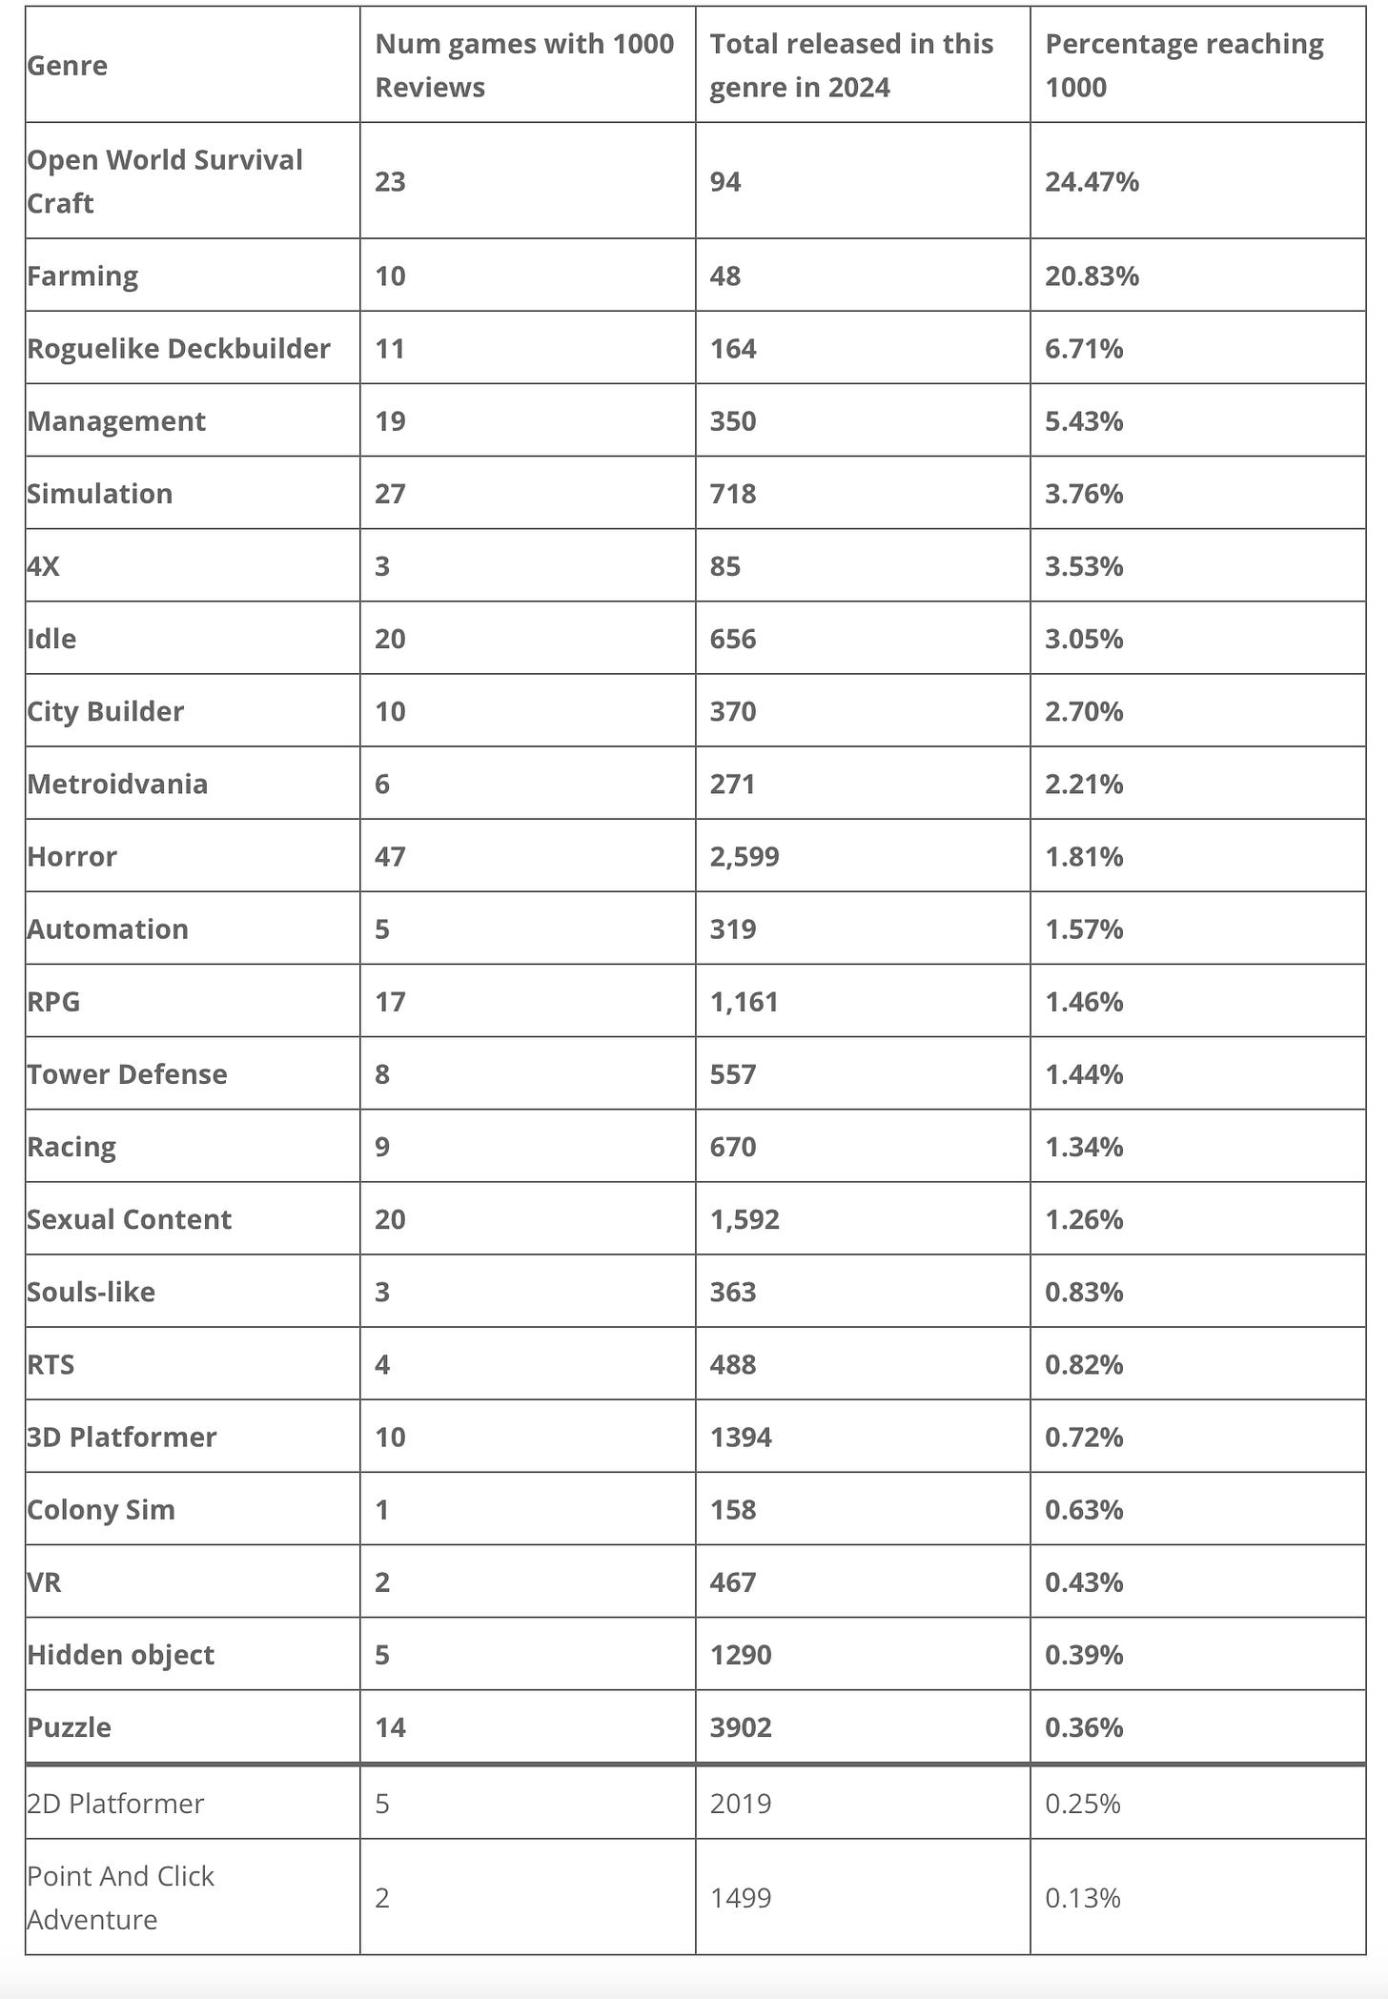
- To better illustrate the picture, Chris removes from the sample all projects with fewer than 700 followers (which, according to statistics, should equal about 7,000 wishlists). In other words, the list below excludes very small projects from the sample.
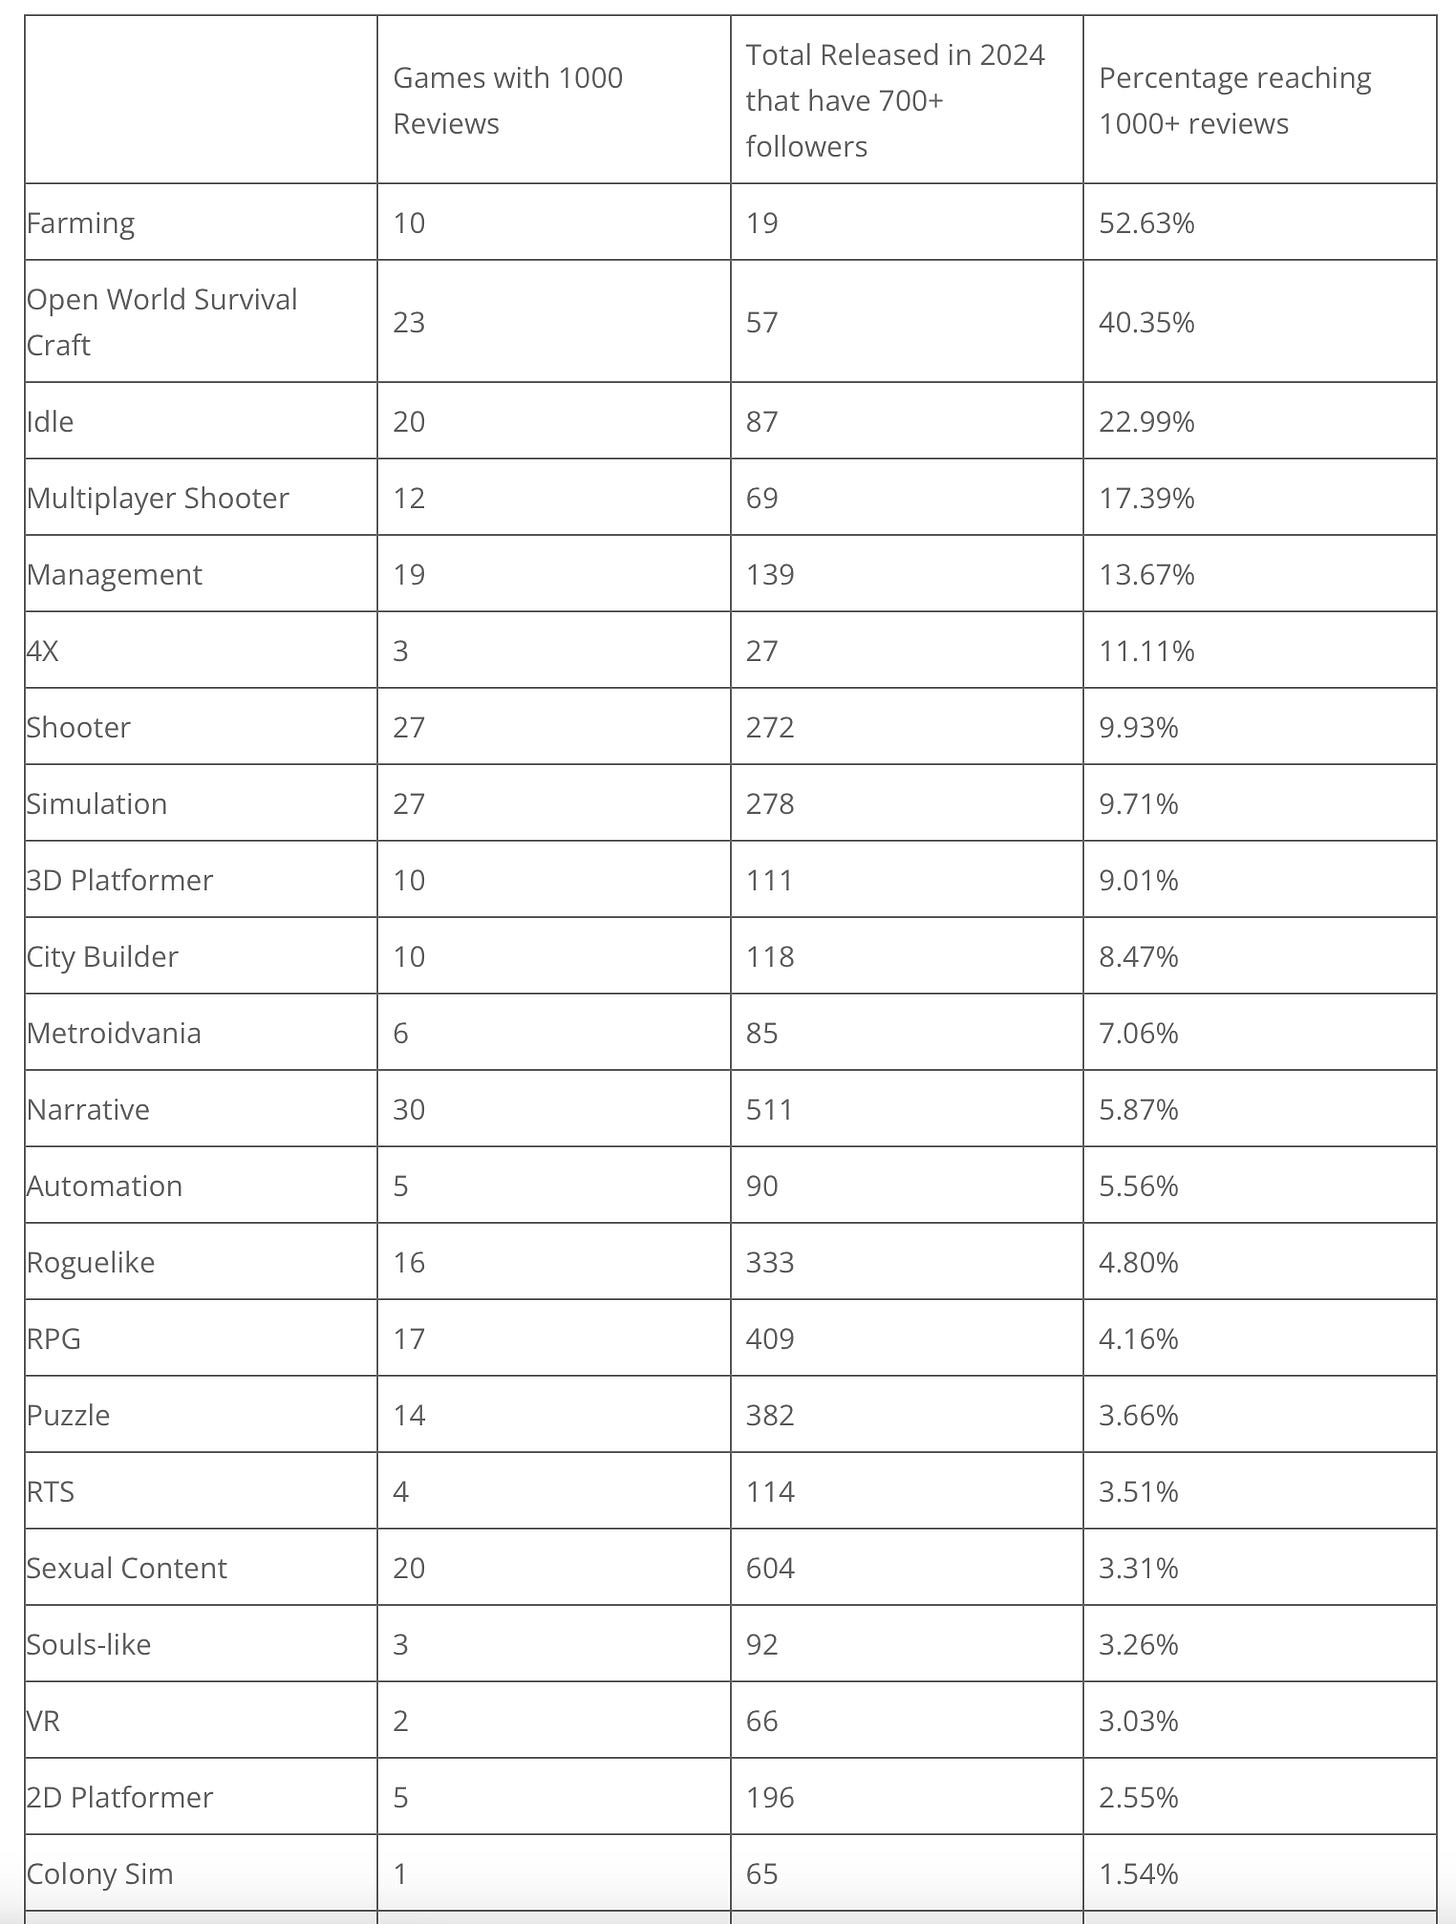
- The ranking, in this case, didn't change much, but it's evident that the Success Rate across all genres increased.
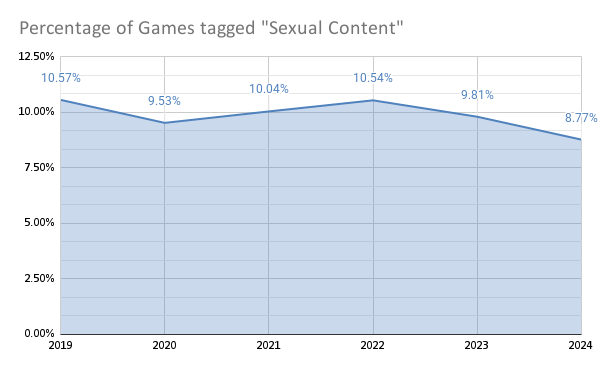
- In 2024, 1,640 games were released on Steam in the 18+ category. Despite the large number of released projects, the share in the total volume is the lowest in the last 6 years - 8.77%.
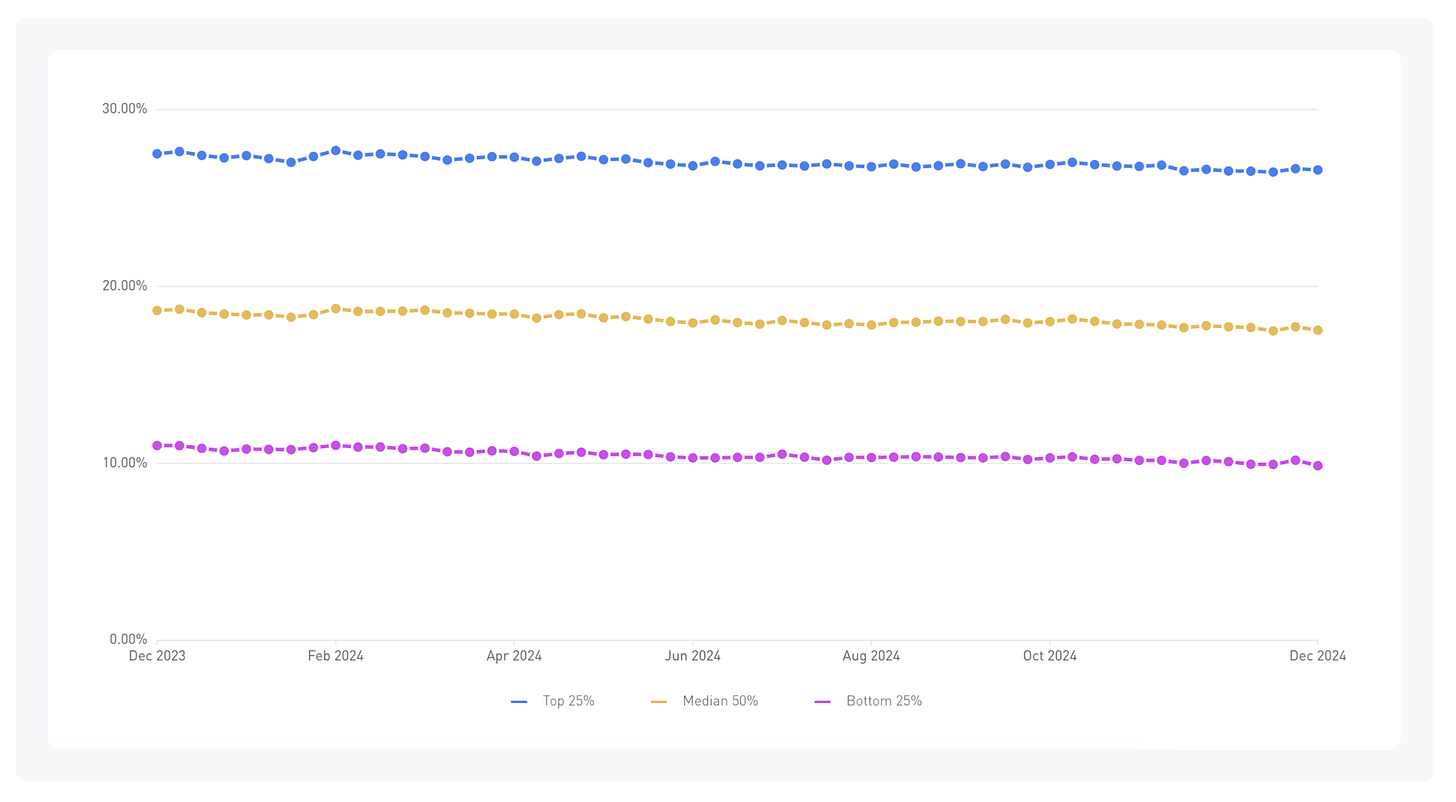
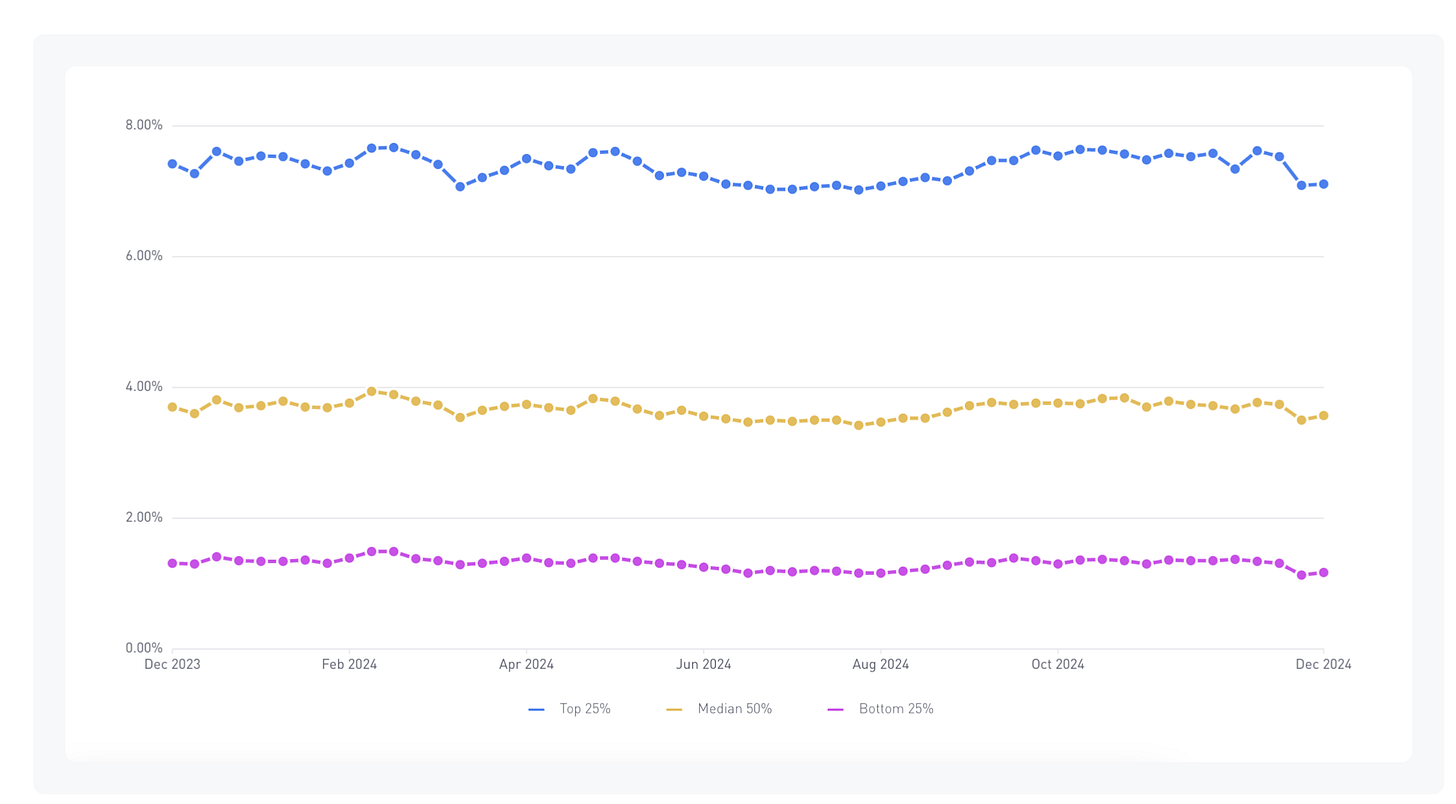
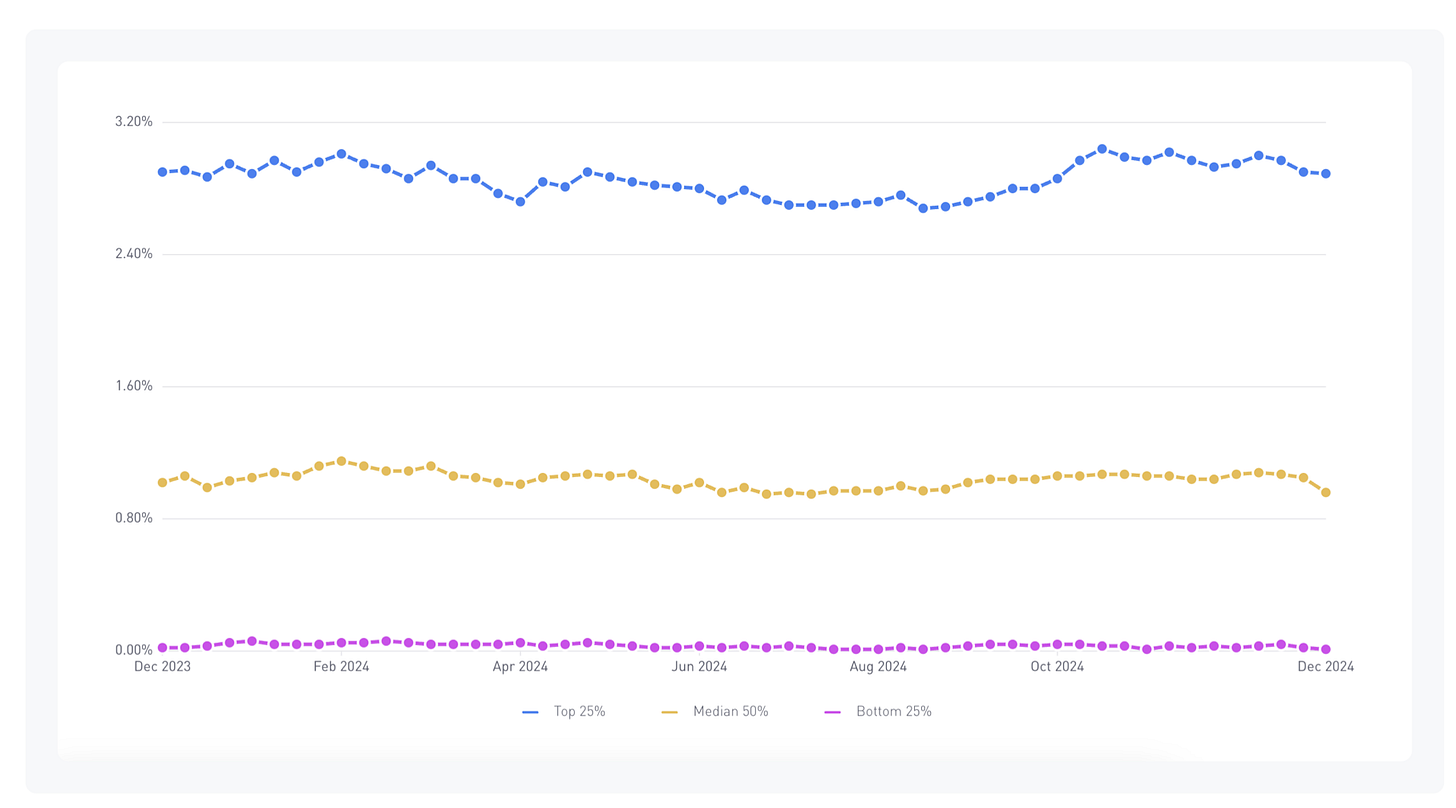
GameAnalytics: Mobile gaming benchmarks in 2025
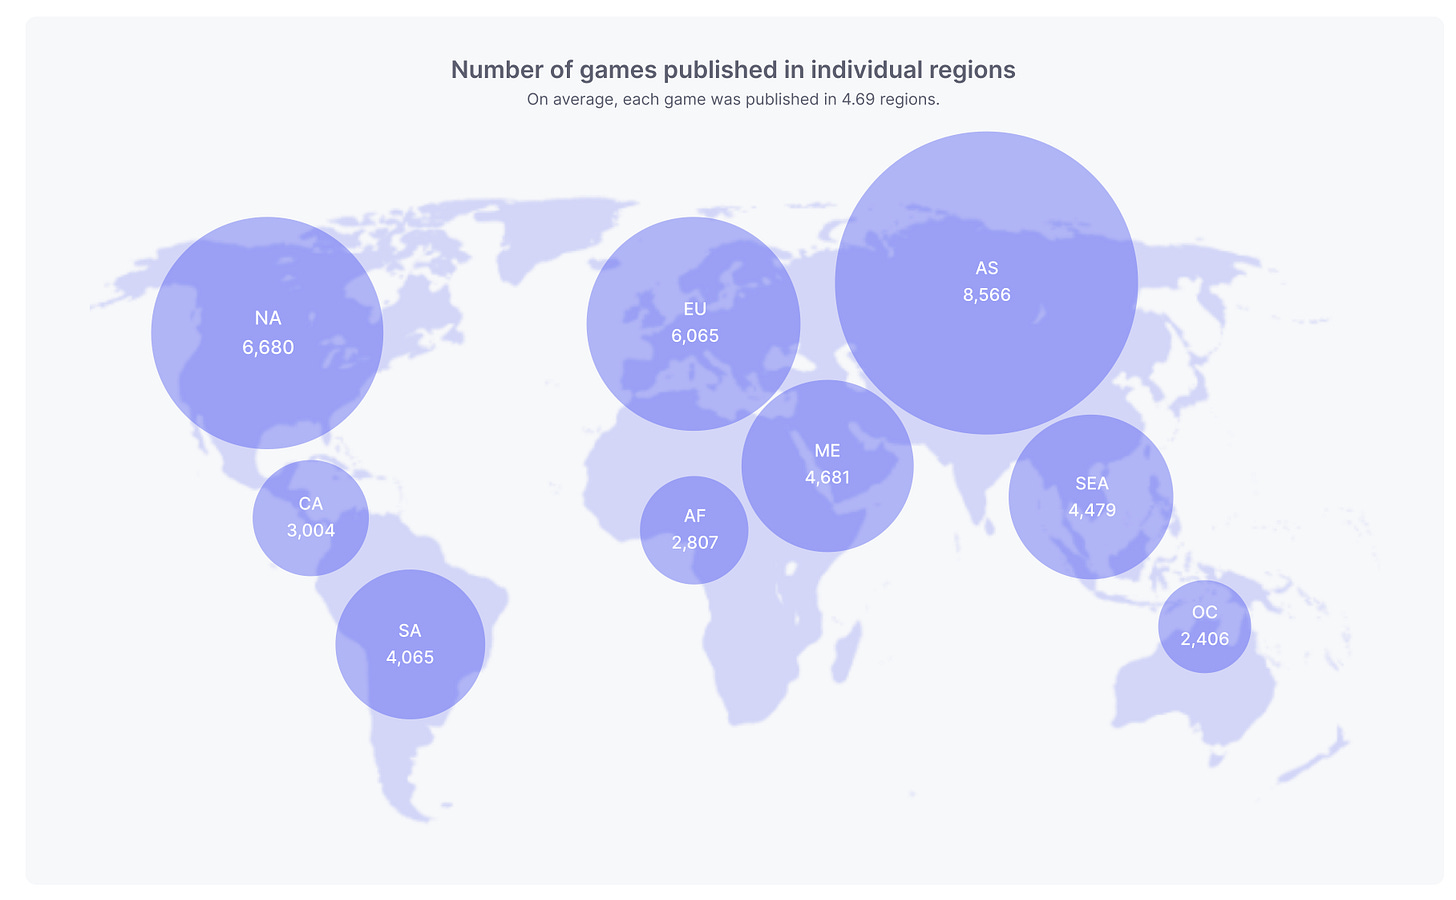
The report is based on data from 11,600 gaming applications across 9 regions on 2 platforms (iOS and Android) in 16 different genres. The MAU of all projects used for the report exceeds 1.48 billion.
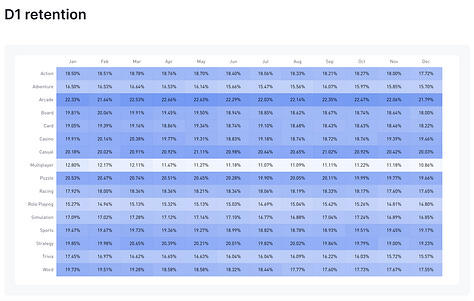
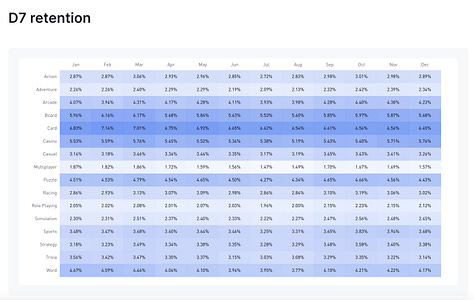
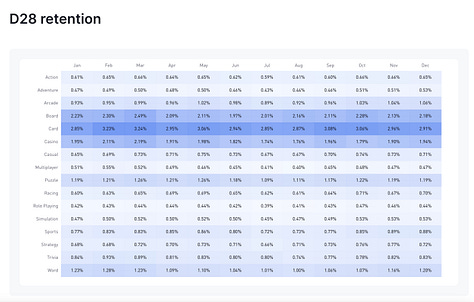
Retention Benchmarks
❗️The report uses classic, not Rolling Retention.
- By the end of 2024, the average D1 Retention for the top 25% of games ranges from 26.48% to 27.69%. This is worse than the 2023 results (28-29%). For the least successful 25% of projects, D1 Retention is at 10-11.5%.
- On iOS, the top 25% of projects have a higher average D1 Retention - 31-33% compared to 25-27% on Android.
- The median D7 Retention across all projects ranges from 3.42% to 3.94%. This is, again, lower than the 2023 results (4-5%). For the top 25% of projects, this indicator is at 7-8%, while for the weakest 25% of projects, it barely reaches 1.5%.
- 75% of projects have a D28 Retention lower than 3%.
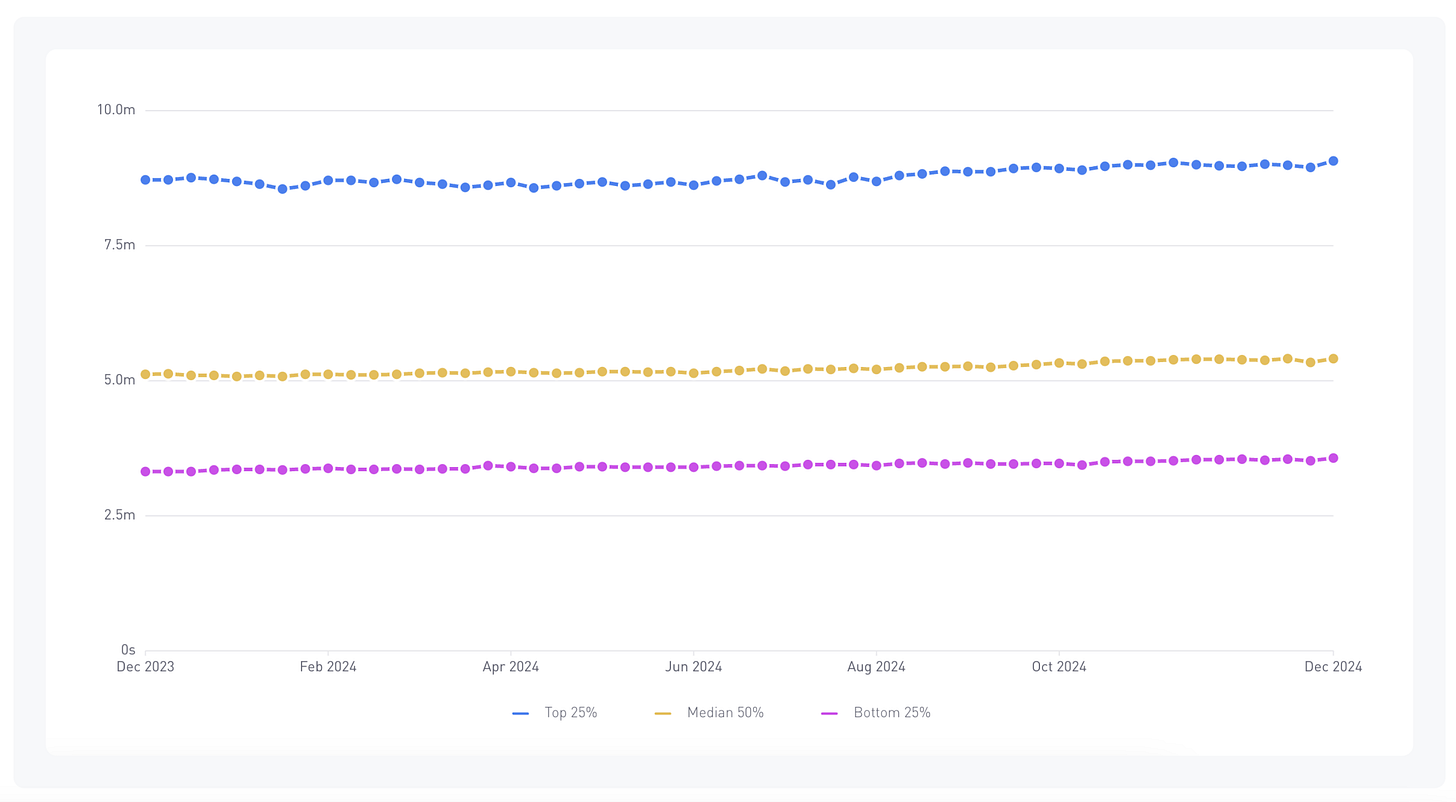
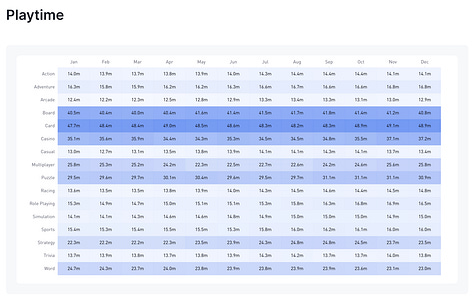
Playtime Benchmarks
-
The median daily playtime across all games in 2024 is 22 minutes. However, for the top 2% of projects, this figure can reach 4 hours.
- Projects like Roblox contribute significantly to the overall playtime. The Guardian notes that Australian children aged 4 to 18 spent an average of 137 minutes per day on Roblox.
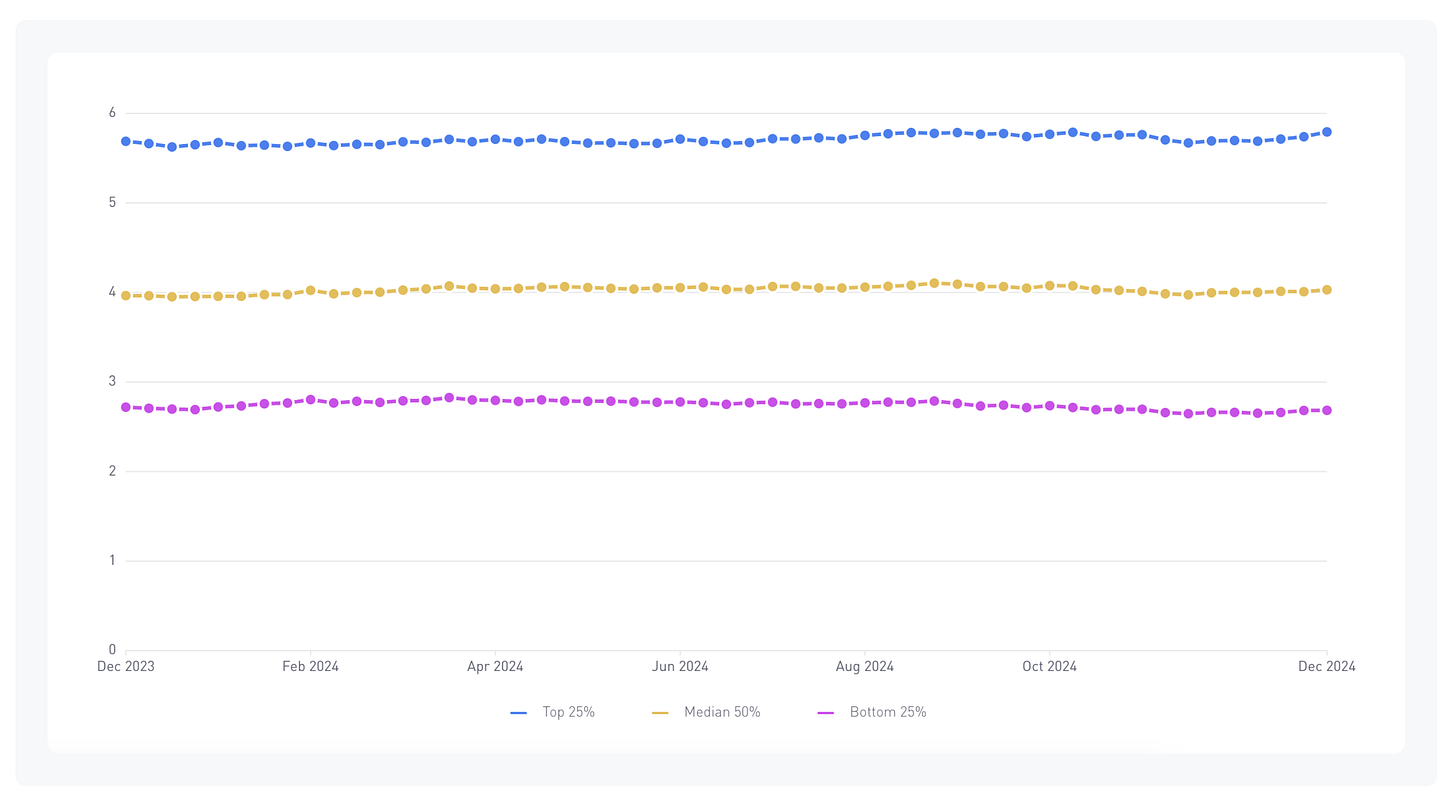
Session Length Benchmarks
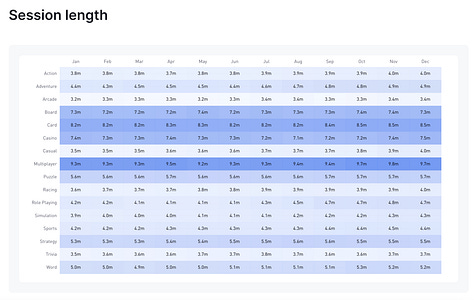
-
In 2024, the average session length for the top 25% of projects in the market was 8-9 minutes. The median is 5-6 minutes.
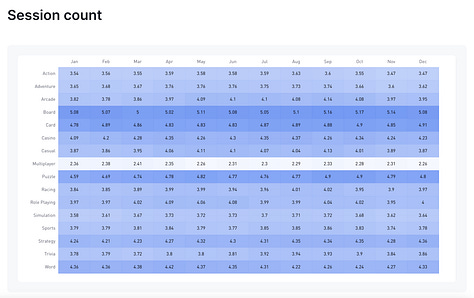
Session Count Benchmarks
- On average, a player has 4 sessions per day. Android players have more sessions than iOS users - the opposite of the Retention figures.
- Midcore projects have the highest number of sessions per day - 6-7.
Regional retention benchmarks
- The highest average D1-D7-D28 Retention indicators are in the Middle East - 22.64%, 4.91%, and 1.49%, respectively. Europe and Oceania also show good figures.
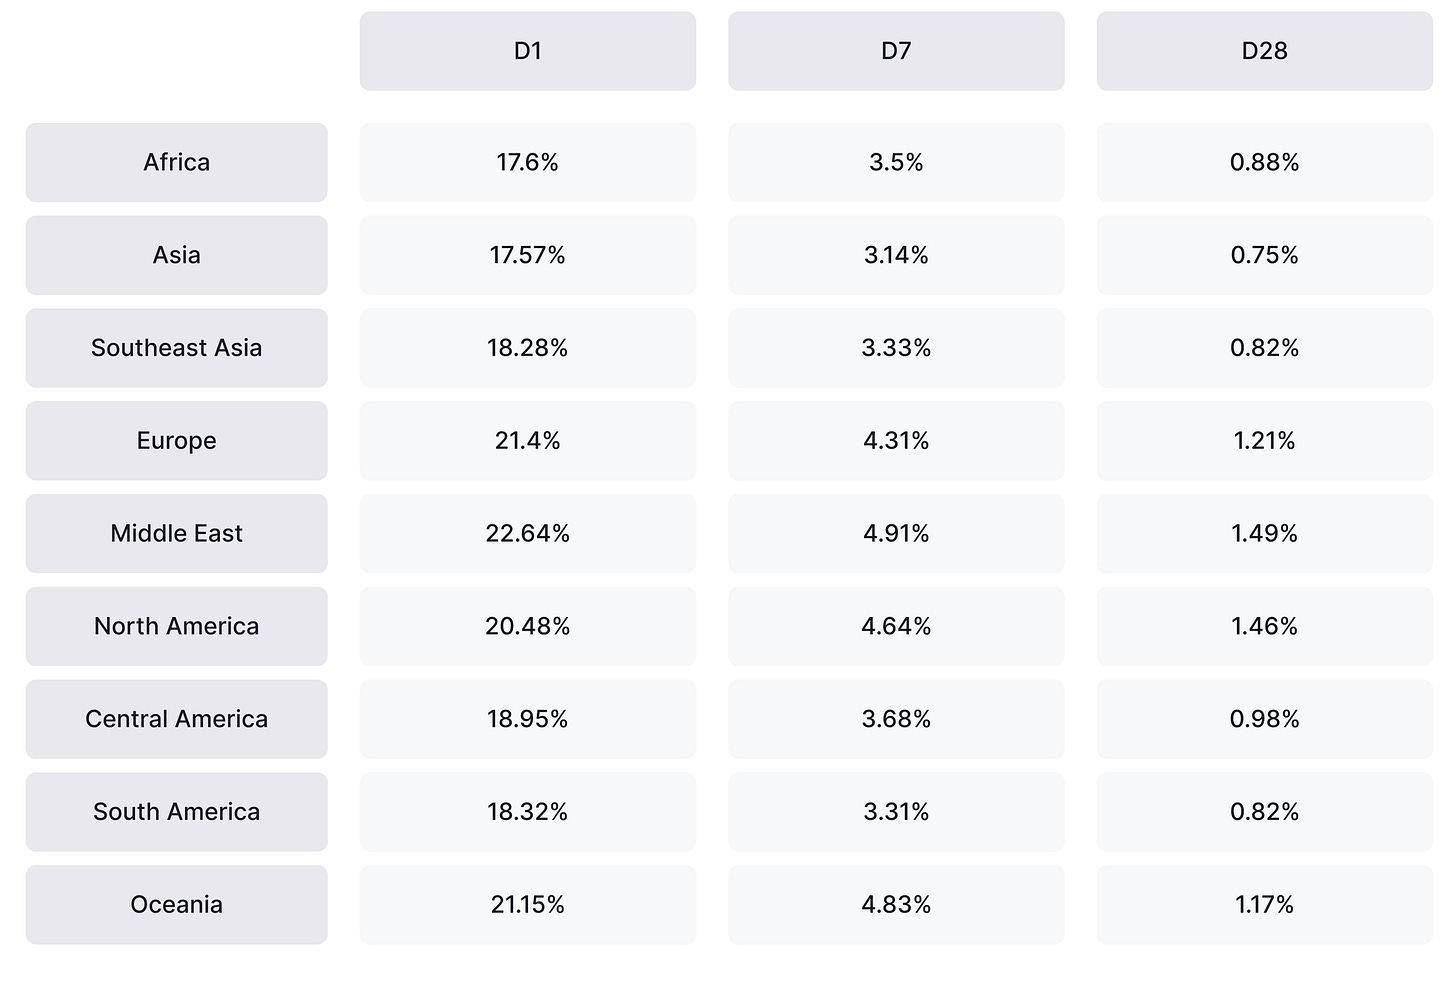
- User retention is worst in Africa and Asia.
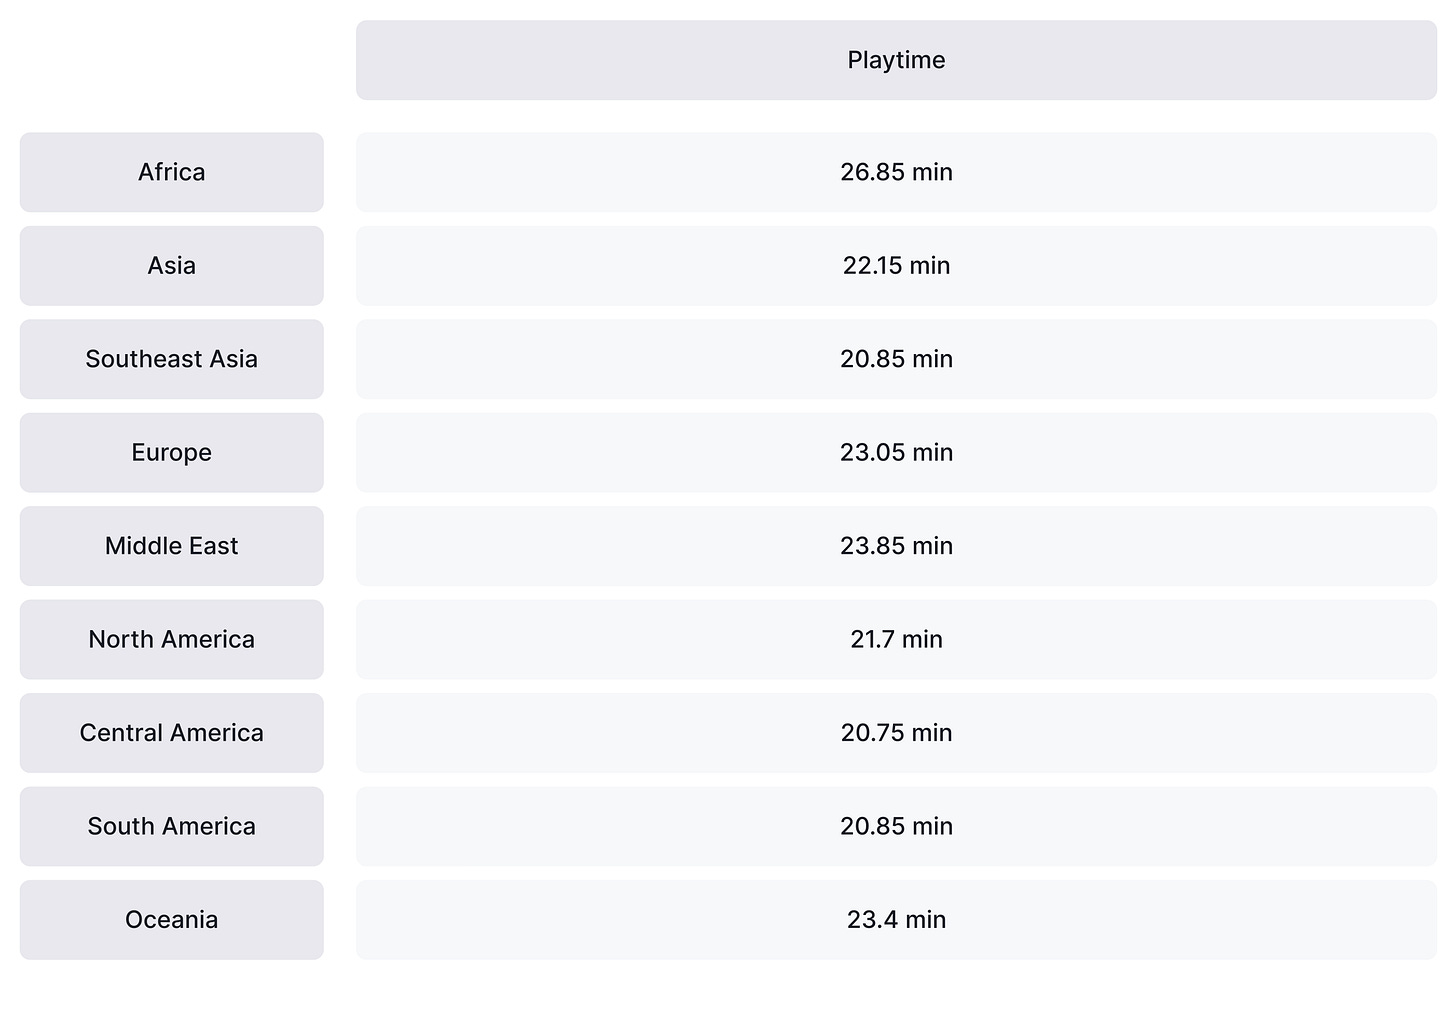
Regional playtime benchmarks
- The highest average playtime - contrary to the Retention figures - is in Africa, at 26.85 minutes. The situation is worst in Asia - from 21-22 minutes.
Regional session length benchmarks
- The longest average session length is in Oceania - 6.85 minutes. The lowest are in Africa and Asia (around 5 minutes).

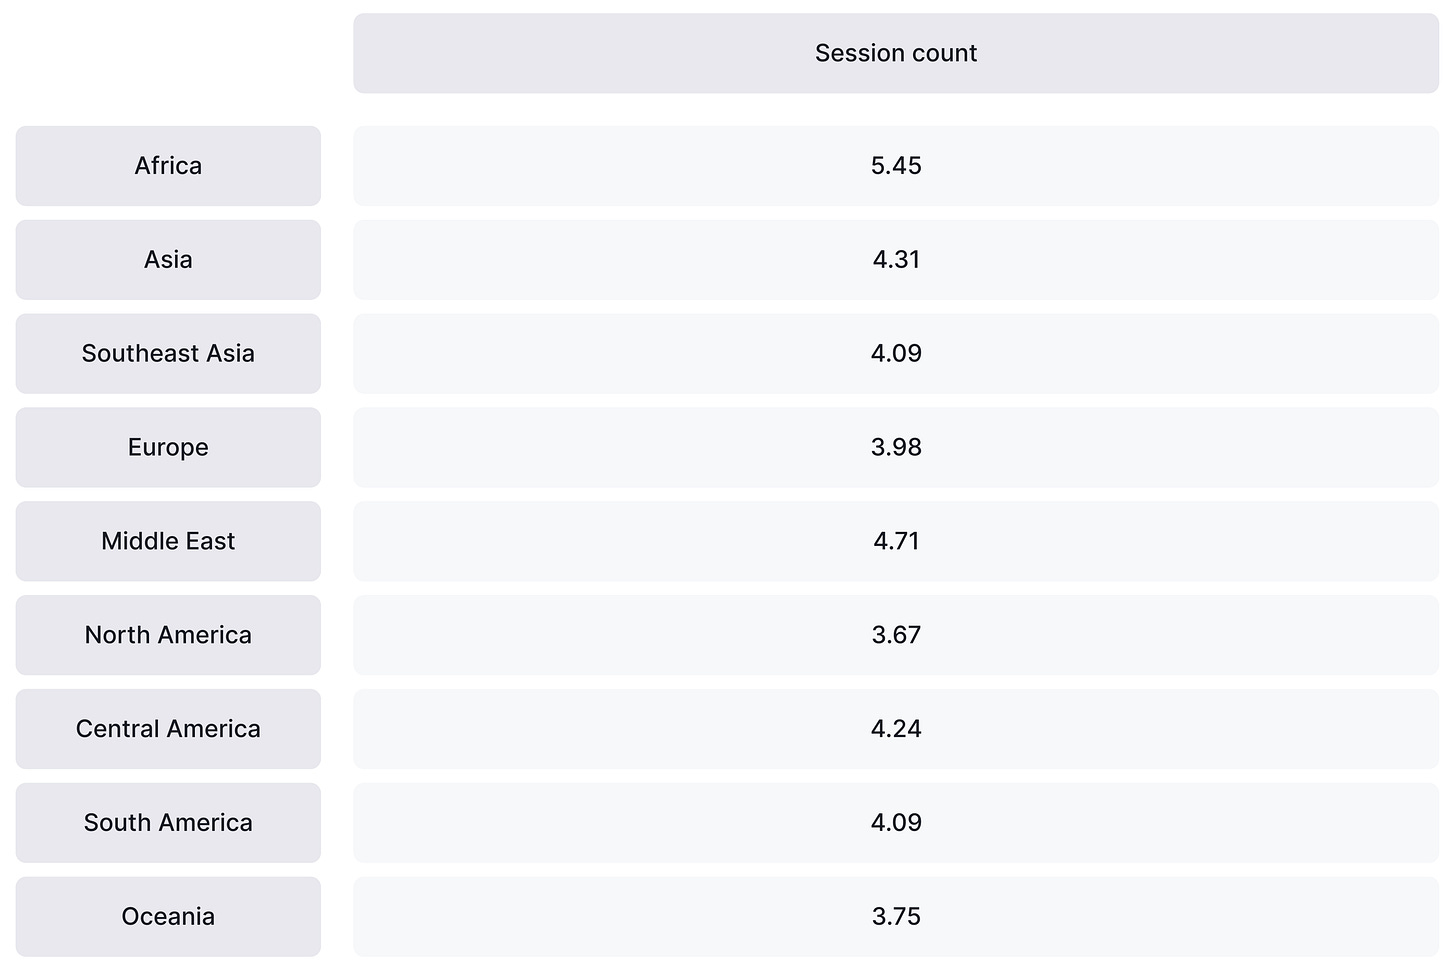
Regional session count benchmarks
- The highest number of sessions is in Africa (5.45 per day) and in Middle Eastern countries (4.71 per day). The lowest is in North America (3.67 sessions per day).
Genre Benchmarks
- Arcade games lead among genres in short-term (D1 Retention) retention. However, they have problems with long-term retention.
- The best genres for medium and long-term retention are board games, card games, puzzles, and casino games.
- Interestingly, multiplayer projects are leaders only in session length. But they are far from the leading genres in both overall playtime and number of sessions.
Games & Numbers (February 5 - February 18, 2025)

PC/Console Games
- Grand Theft Auto V has been purchased 210 million times. Red Dead Redemption II sales stand at 70 million copies. These figures were shared by Take-Two in their latest report.
- Phasmophobia has sold over 2 million copies on consoles. The game's total sales have surpassed 22 million copies.
- One Piece Pirate Warriors 4 has been bought 4 million times.
- Farming Simulator 25 continues to harvest success effectively - the game has already sold over 3 million copies. In total, games in the series have been purchased more than 40 million times.
- Kingdom Come Deliverance II sold 2 million copies in less than 2 weeks. The studio called the release a "triumph". The first million copies were sold in less than 24 hours.
- Alan Wake II sales have exceeded 2 million copies. The project has fully recouped its costs, and the studio has finally started profiting from it.
- Dynasty Warriors: Origins has sold 1 million copies. The game's demo version has been downloaded by over 2 million people.
- A Game About Digging A Hole, where players (guess what?) dig a hole in their garden plot, has been purchased more than 250,000 times in a week. Gameplay videos are garnering millions of views on social media (particularly on TikTok).
Mobile Games
- Pokemon Trading Card revenue has exceeded $500 million. The game is only 22 days behind Pokemon GO in terms of speed to reach this milestone (97 days vs 75). While new updates are receiving mixed reactions from the audience, they are significantly boosting revenue.
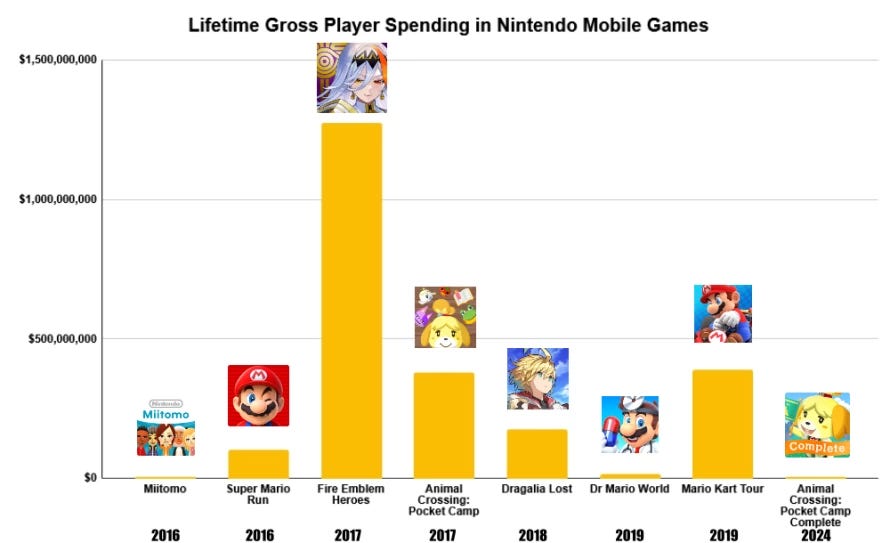
- Fire Emblem Heroes - Nintendo's most successful mobile game - has earned $1.3 billion over 8 years.
- War Robots has earned over $1 billion across all platforms since its release. 94% of all revenue came from mobile devices.
- Capybara Go has surpassed the $100 million revenue mark. It took the game 5 months to achieve this.
- Users have spent over $50 million in Royal Kingdom by Dream Games, according to AppMagic. This figure includes money earned during the soft launch period.
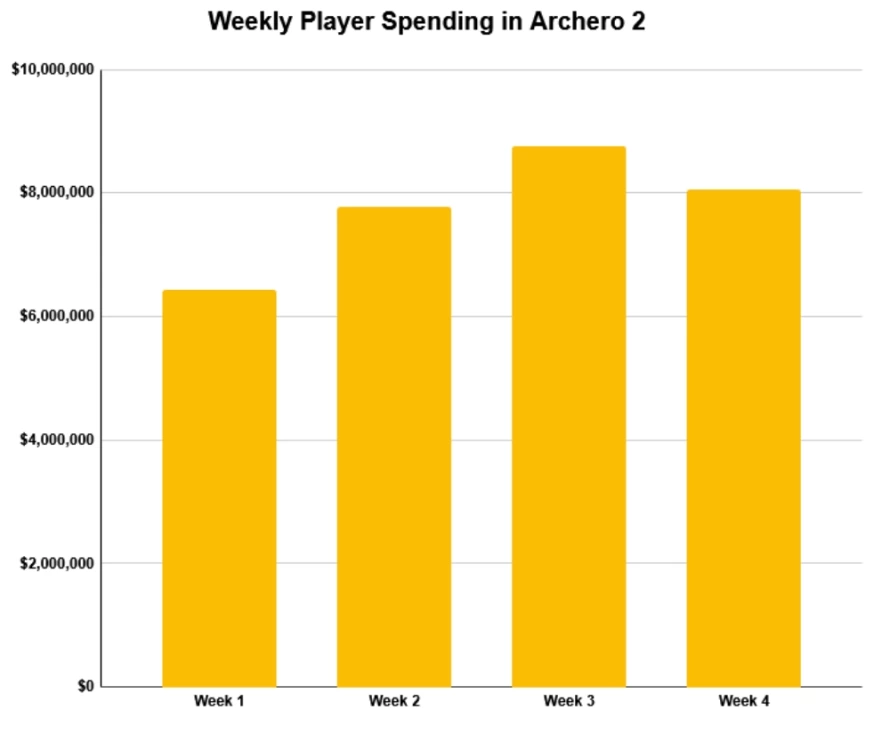
- In the first month after release, Archero II earned $32.8 million from IAPs. This is before taxes and commissions.
Gaming Systems
-
PlayStation 5 has been purchased more than 75 million times - this was officially announced by Sony.
Liftoff: Mobile App marketers survey - 2024 results & 2025 forecast

The Liftoff report uses figures provided by AppsFlyer and Sensor Tower.
Over 700 marketers from different regions participated in the Liftoff survey.
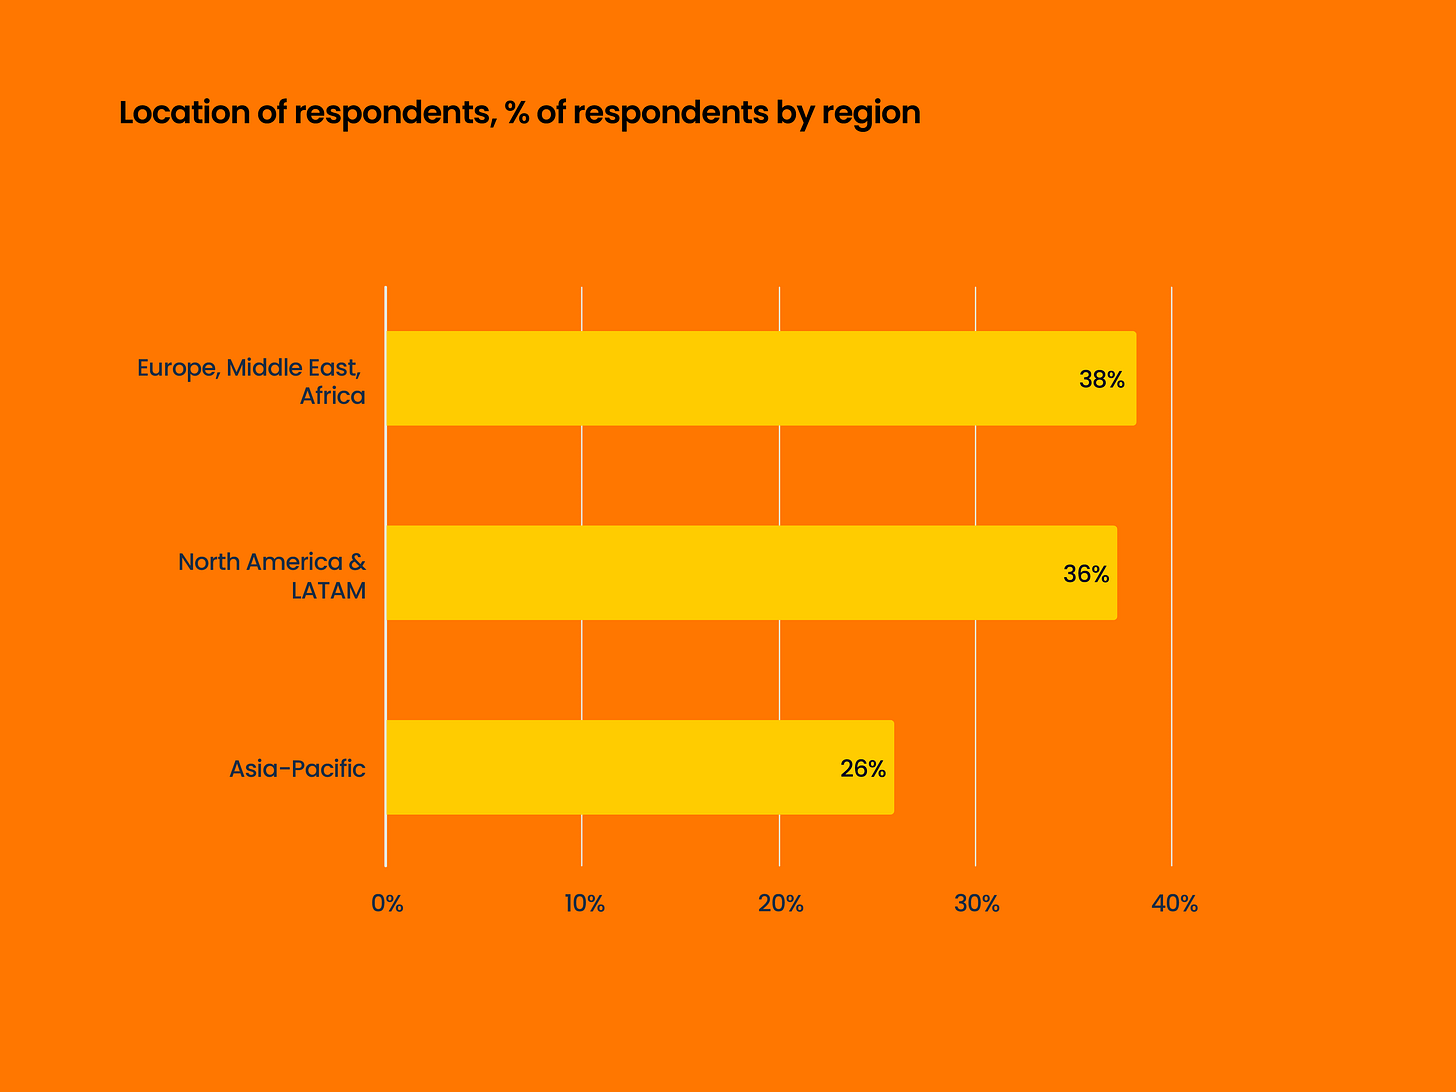
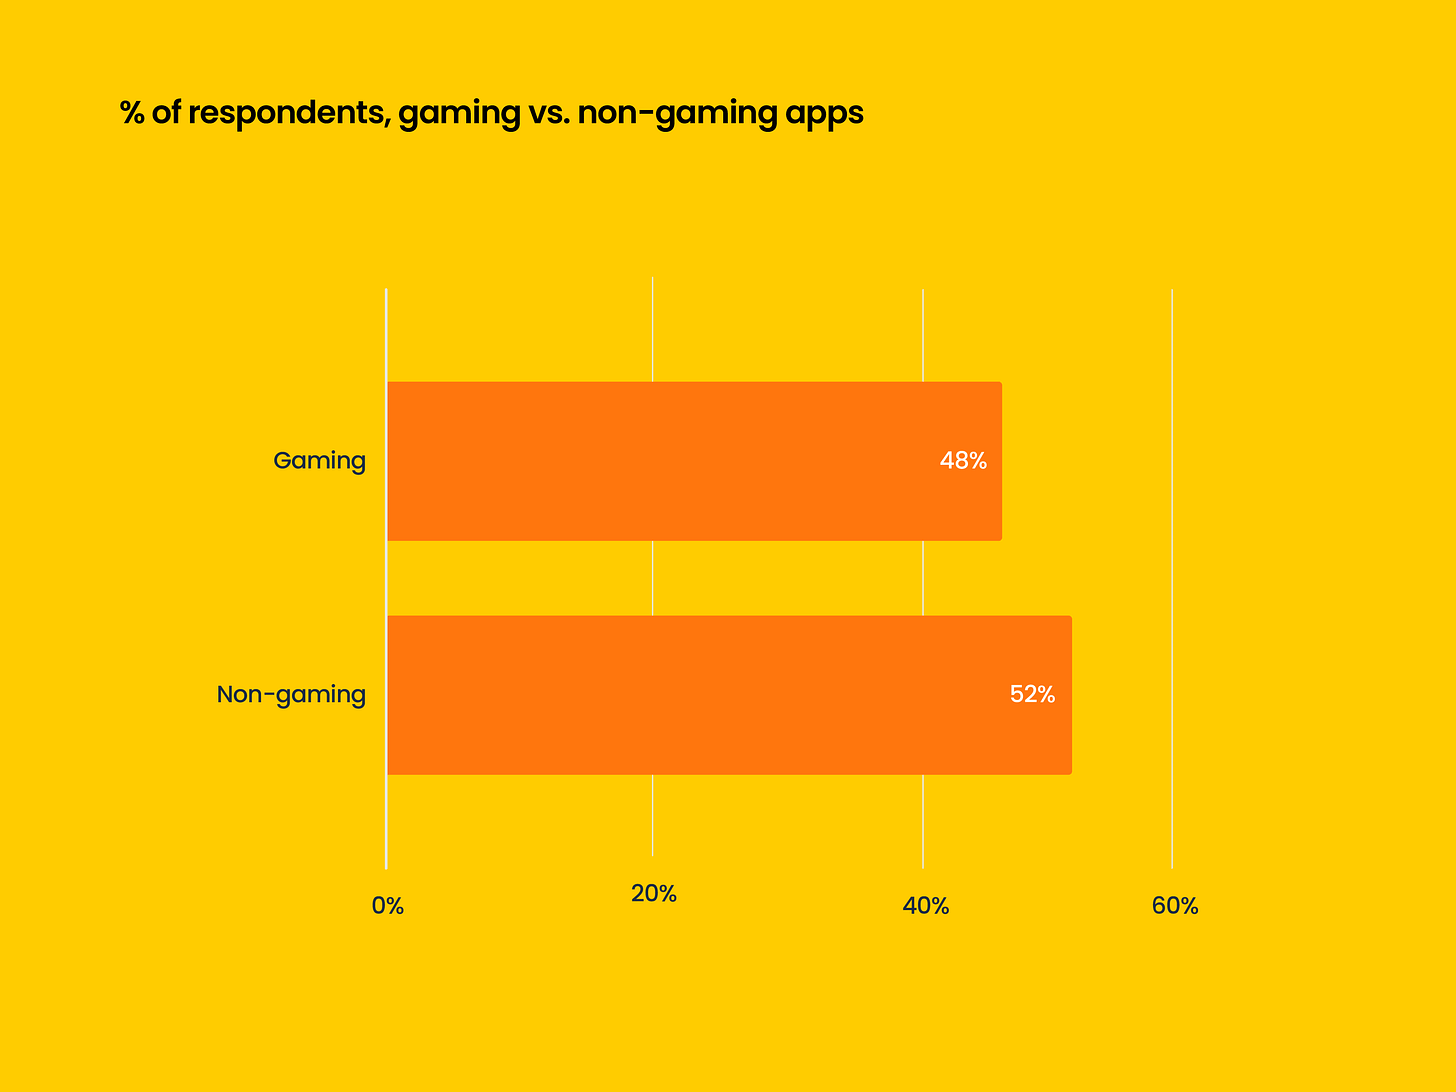
48% of respondents are from the gaming industry, and 52% are from non-gaming segments.
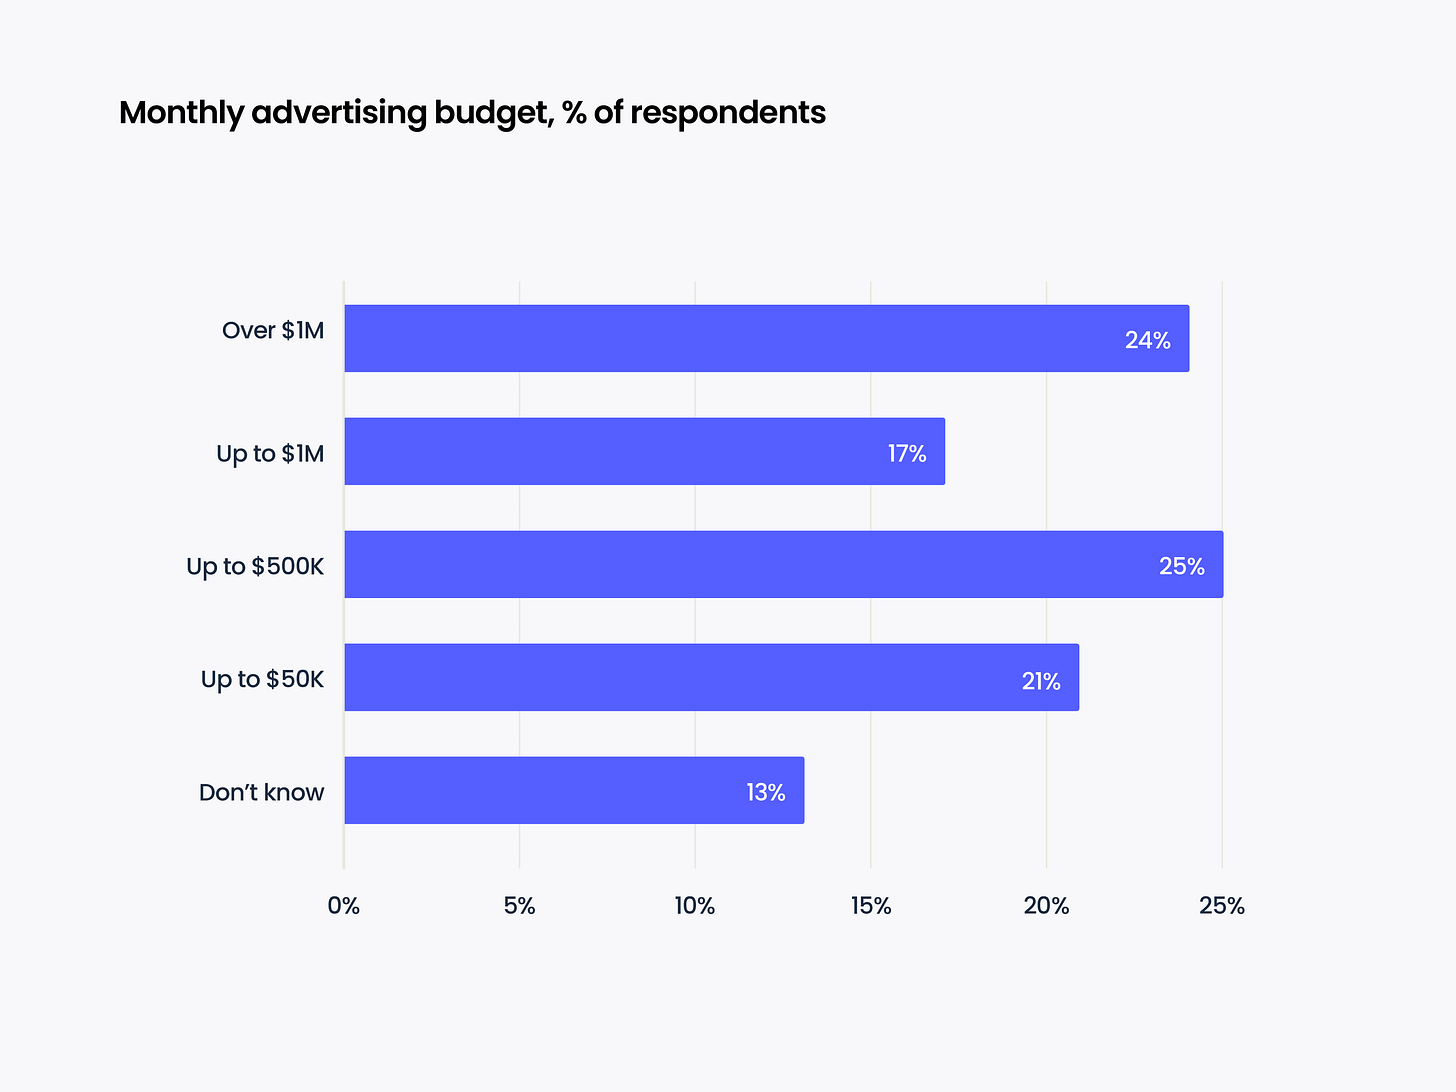
Liftoff surveyed companies of different sizes - 24% of respondents operate marketing budgets of more than $1 million monthly. 63% have a budget less than this amount.
Overall market conditions
-
According to AppsFlyer, app downloads increased by 7% in 2024. Non-gaming app downloads grew by 12%. Time spent by users in apps either increased or remained unchanged.
- According to Sensor Tower, people spent 4.2 trillion hours in apps in 2024. Most of the growth comes from non-gaming apps.
- The increase in time spent by users in apps leads to an increase in spending on them. Again, this mainly applies to non-gaming apps.
- The USA, China, Germany, and the UK are the main beneficiaries of the growth in user spending on non-gaming apps.
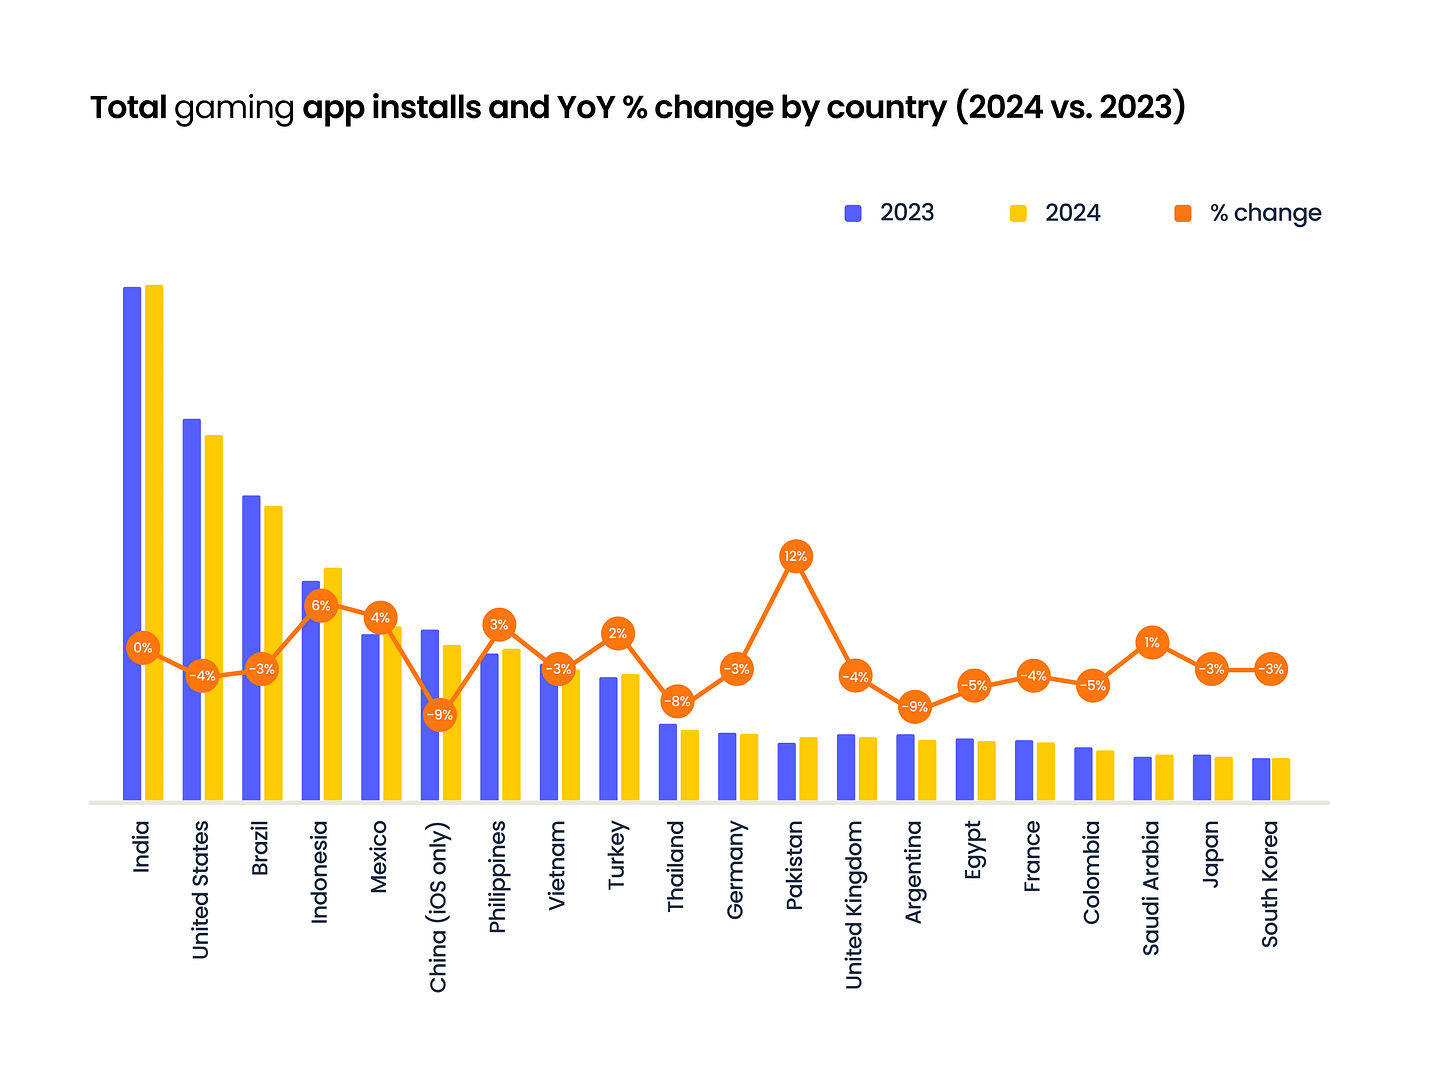
- The situation in the gaming market is not as rosy. After explosive growth in 2020-2021, downloads declined in 2024.
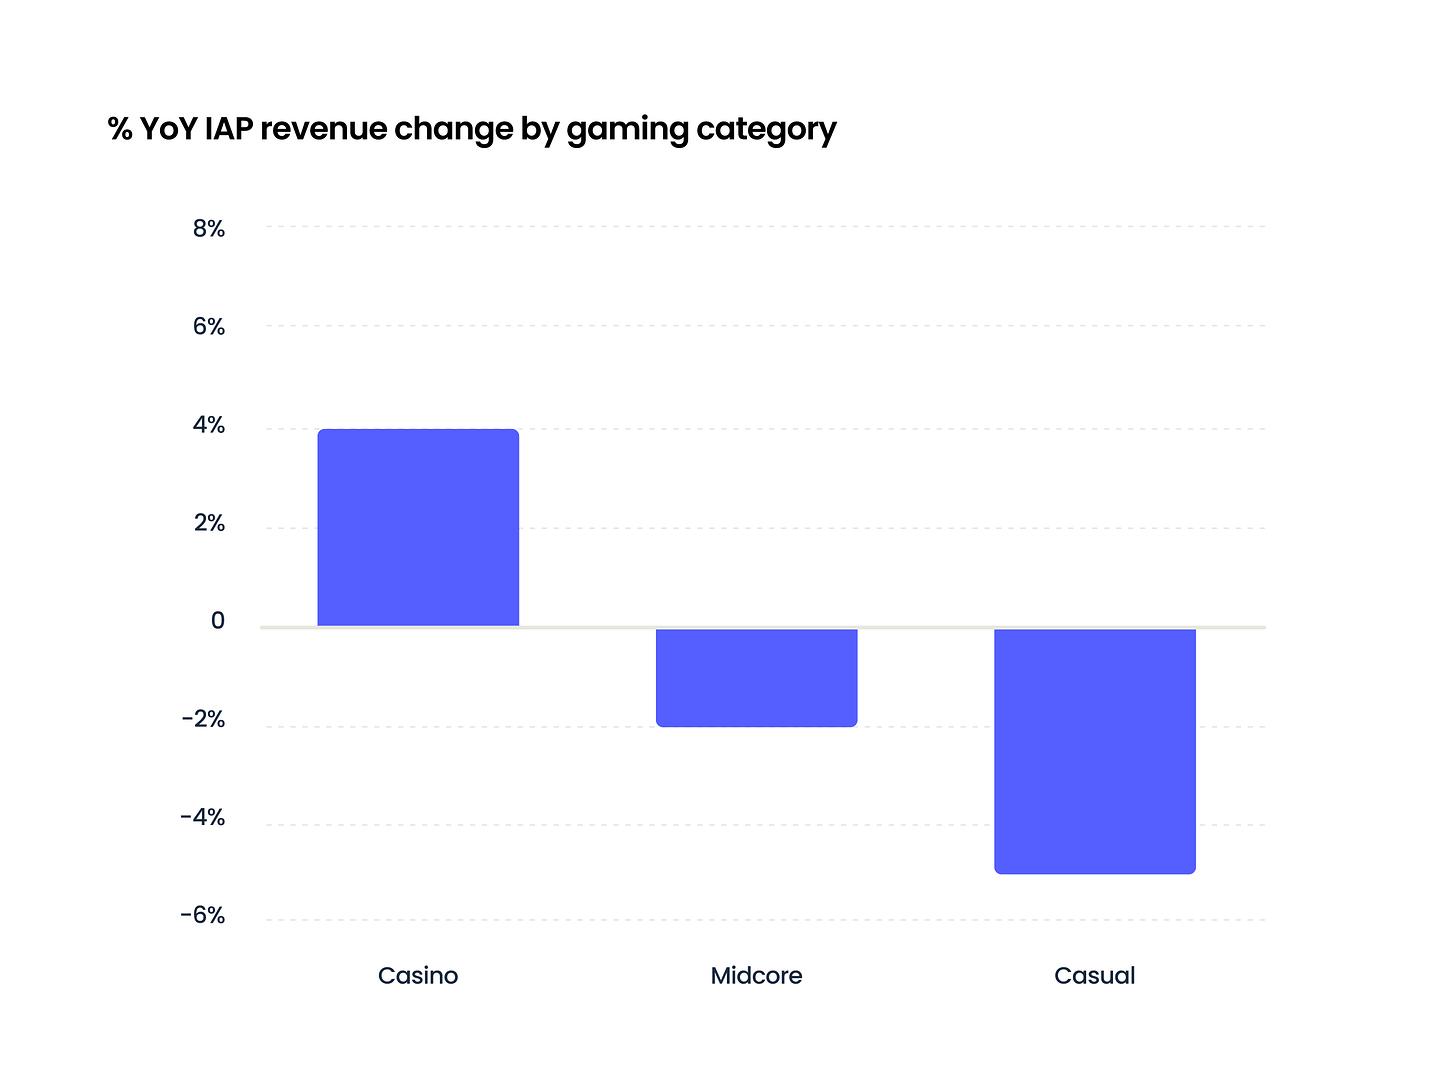
- IAP revenue in games decreased by 1% in the gaming market. Casino games showed growth, while casual and midcore projects were in the negative zone.
Survey results - Industry in 2024 vs 2023
- About 80% of respondents believe that the state of the mobile market is either at the same level or better than in 2023.
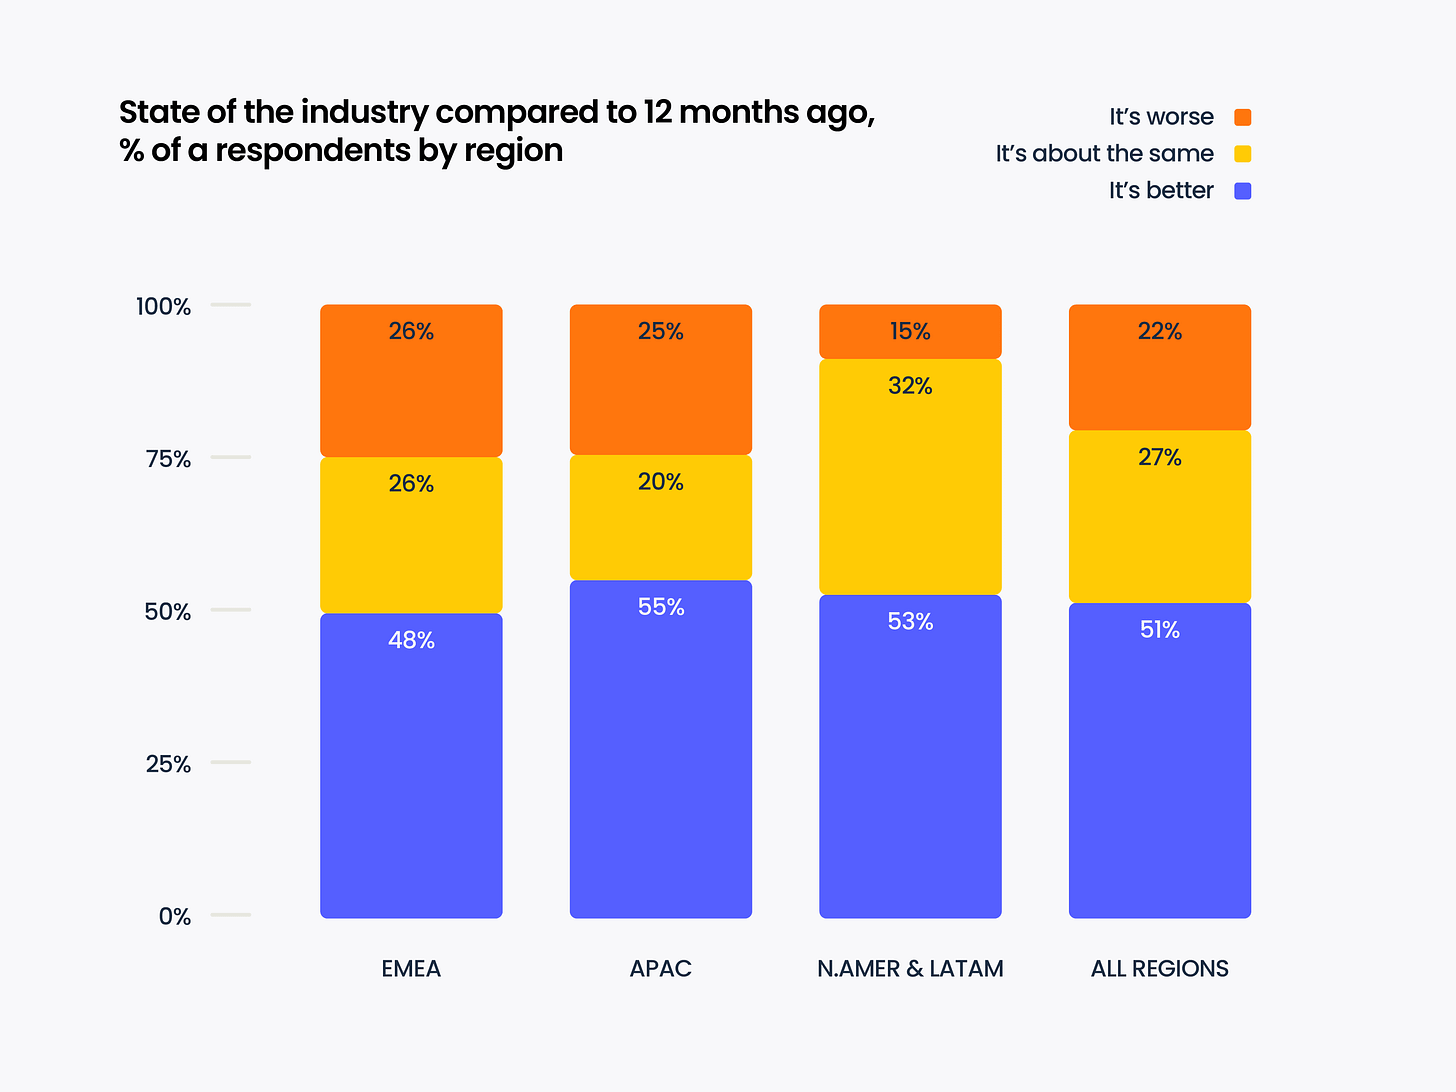
- Respondents from North and Latin America are the most optimistic. Representatives of the EMEA region are less optimistic. Those who started spending more in 2024 are more optimistic about market prospects.
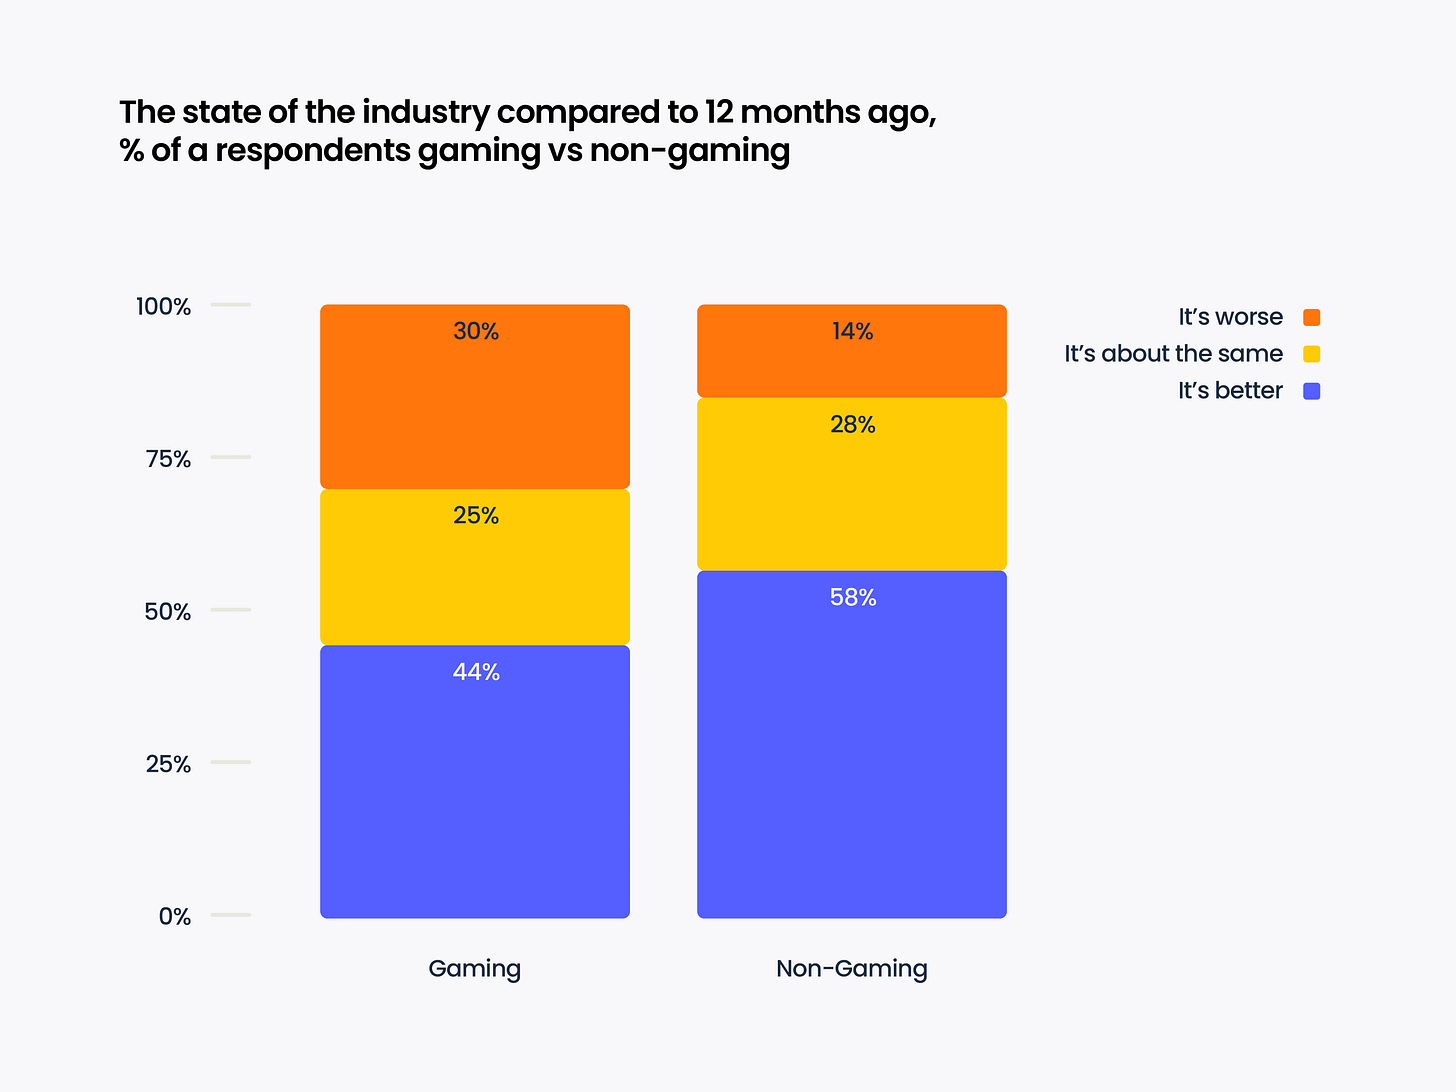
- Gaming market representatives are the most pessimistic. 30% believe the market condition has worsened - compared to 14% in the non-gaming segment.
- However, more than half of the market signals that KPIs have become more aggressive.
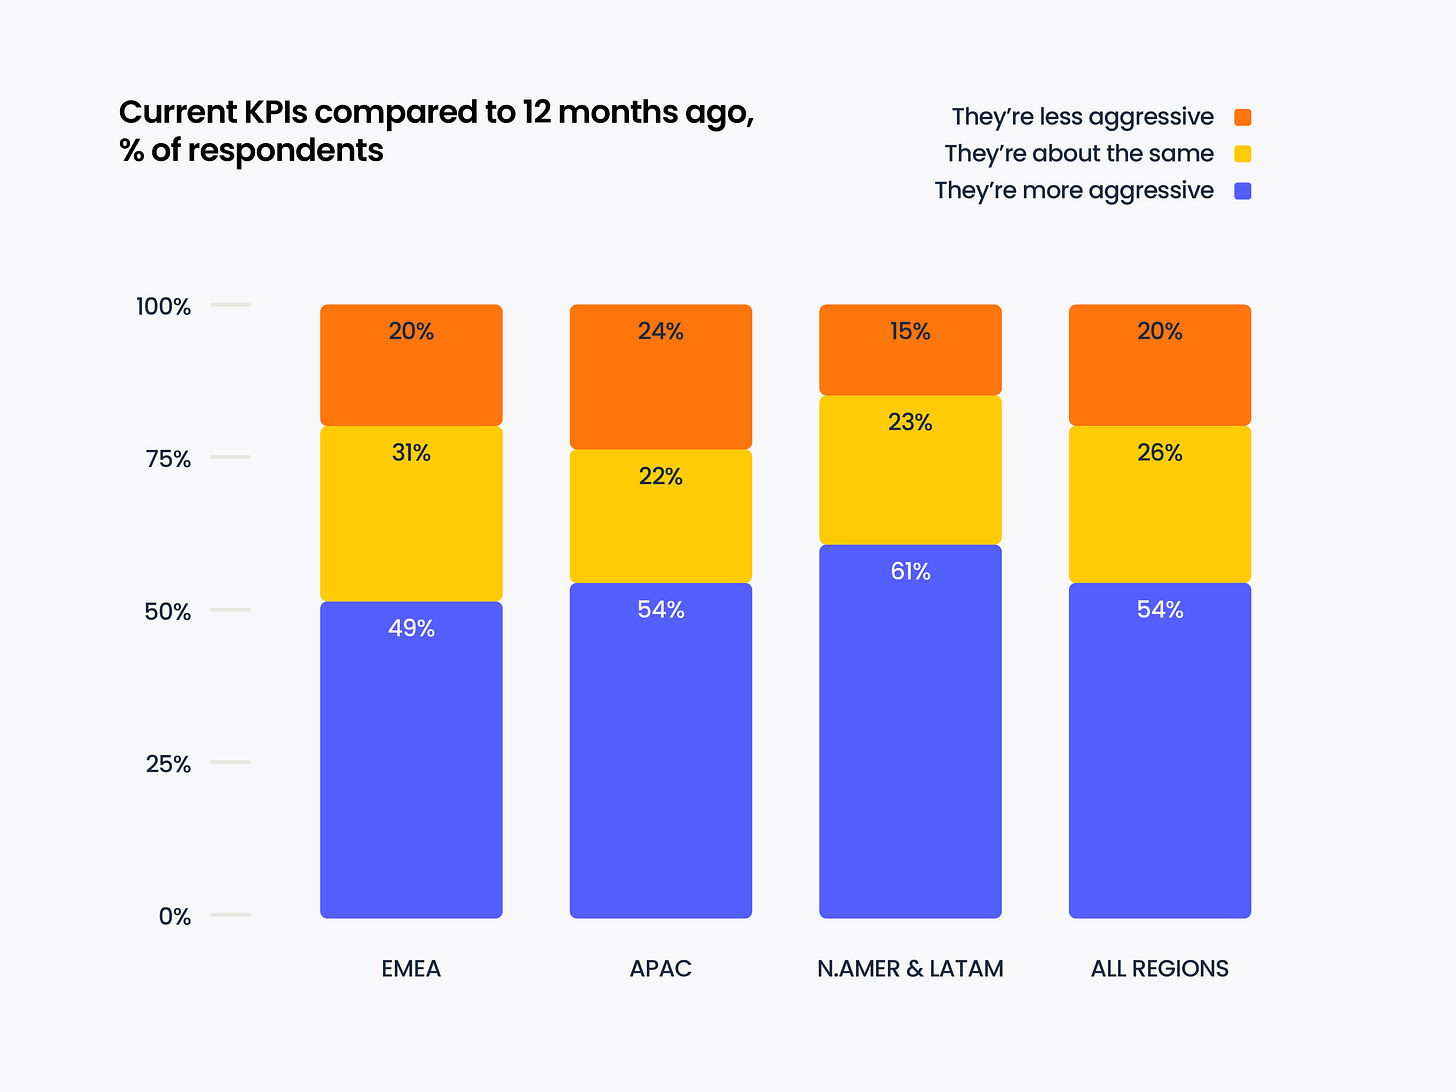
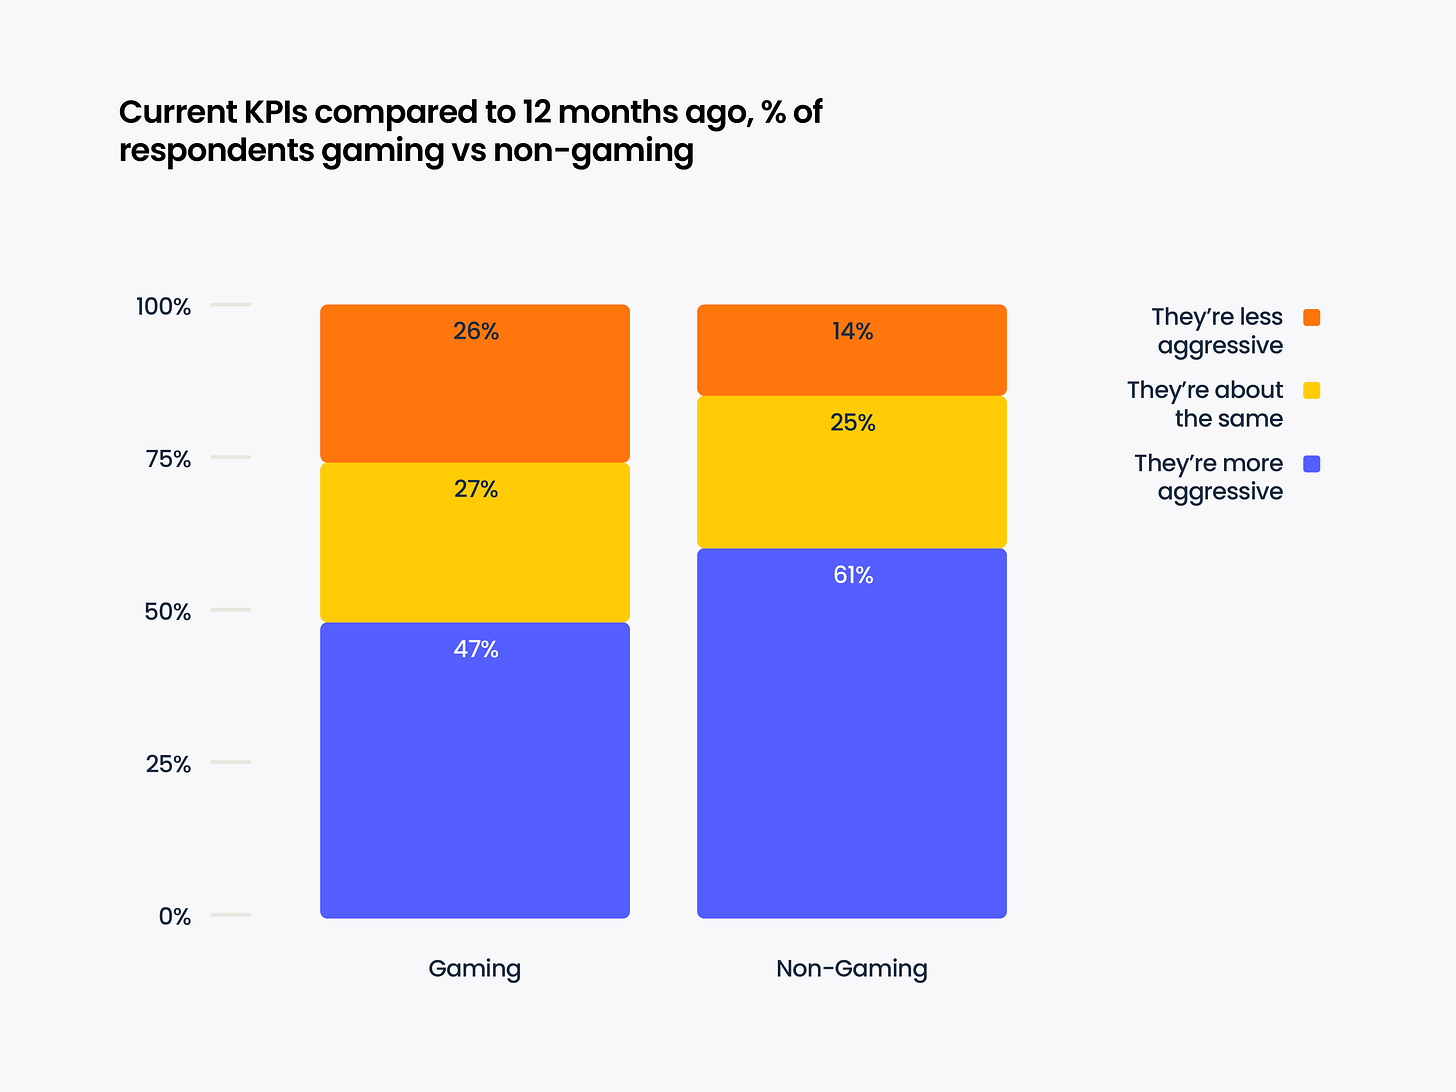
- Interestingly, despite the growth of the non-gaming segment, its representatives more often report stricter KPIs.
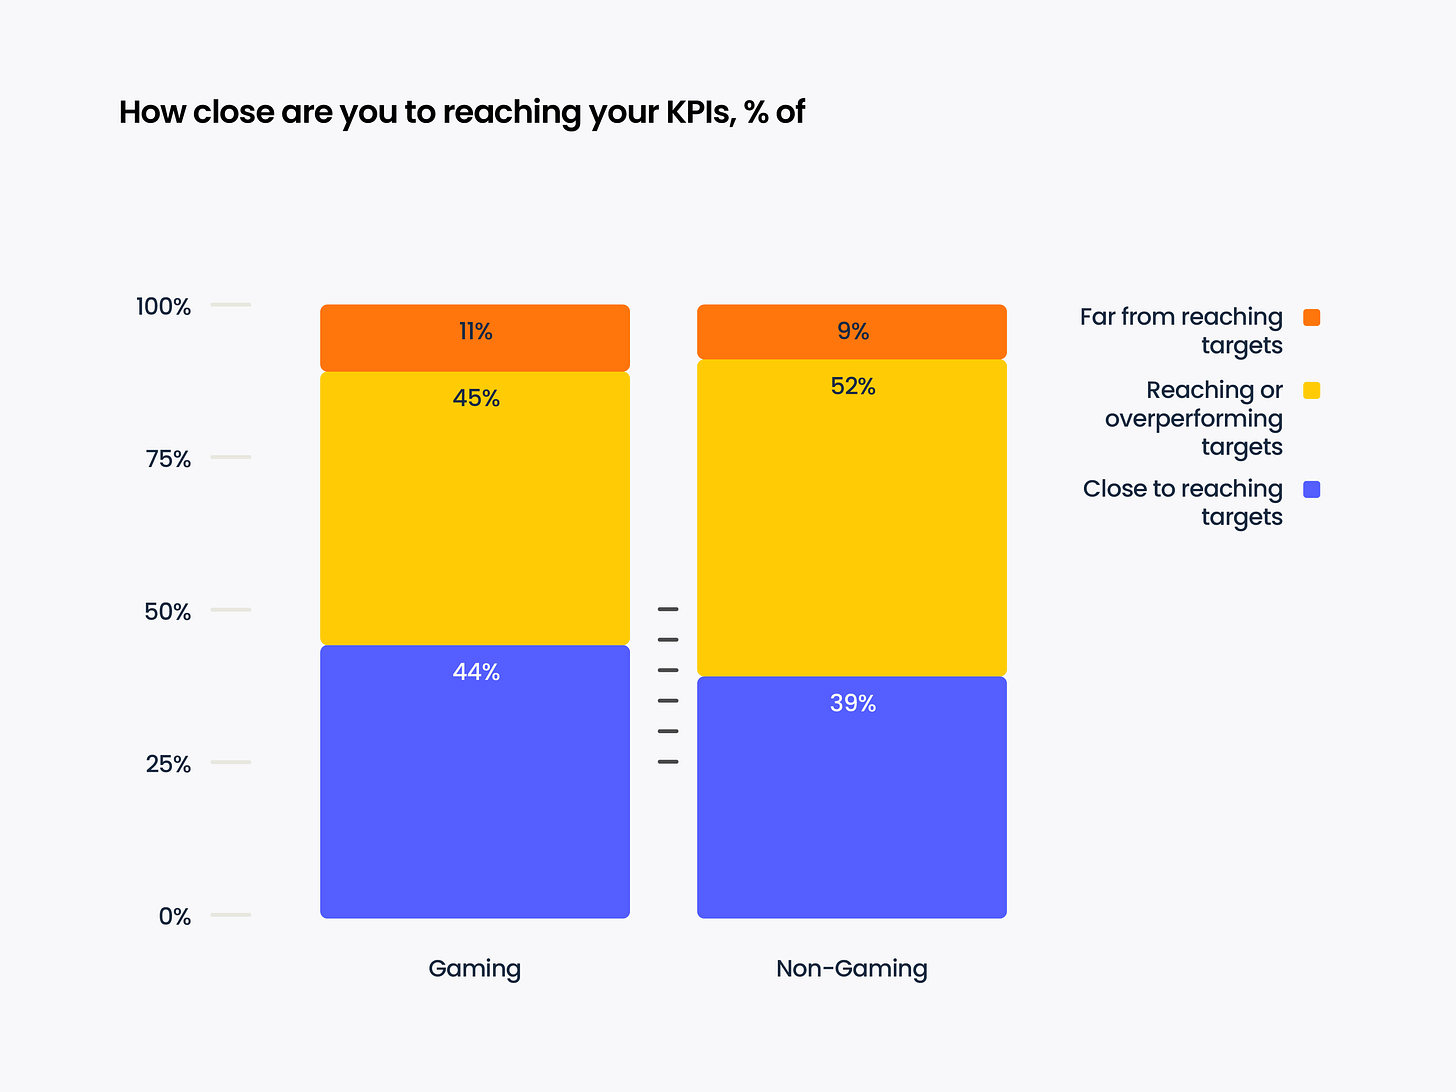
- Despite ambitious goals, non-gaming companies either hit their targets or are close to them. The percentage of those who miss is the same across segments.
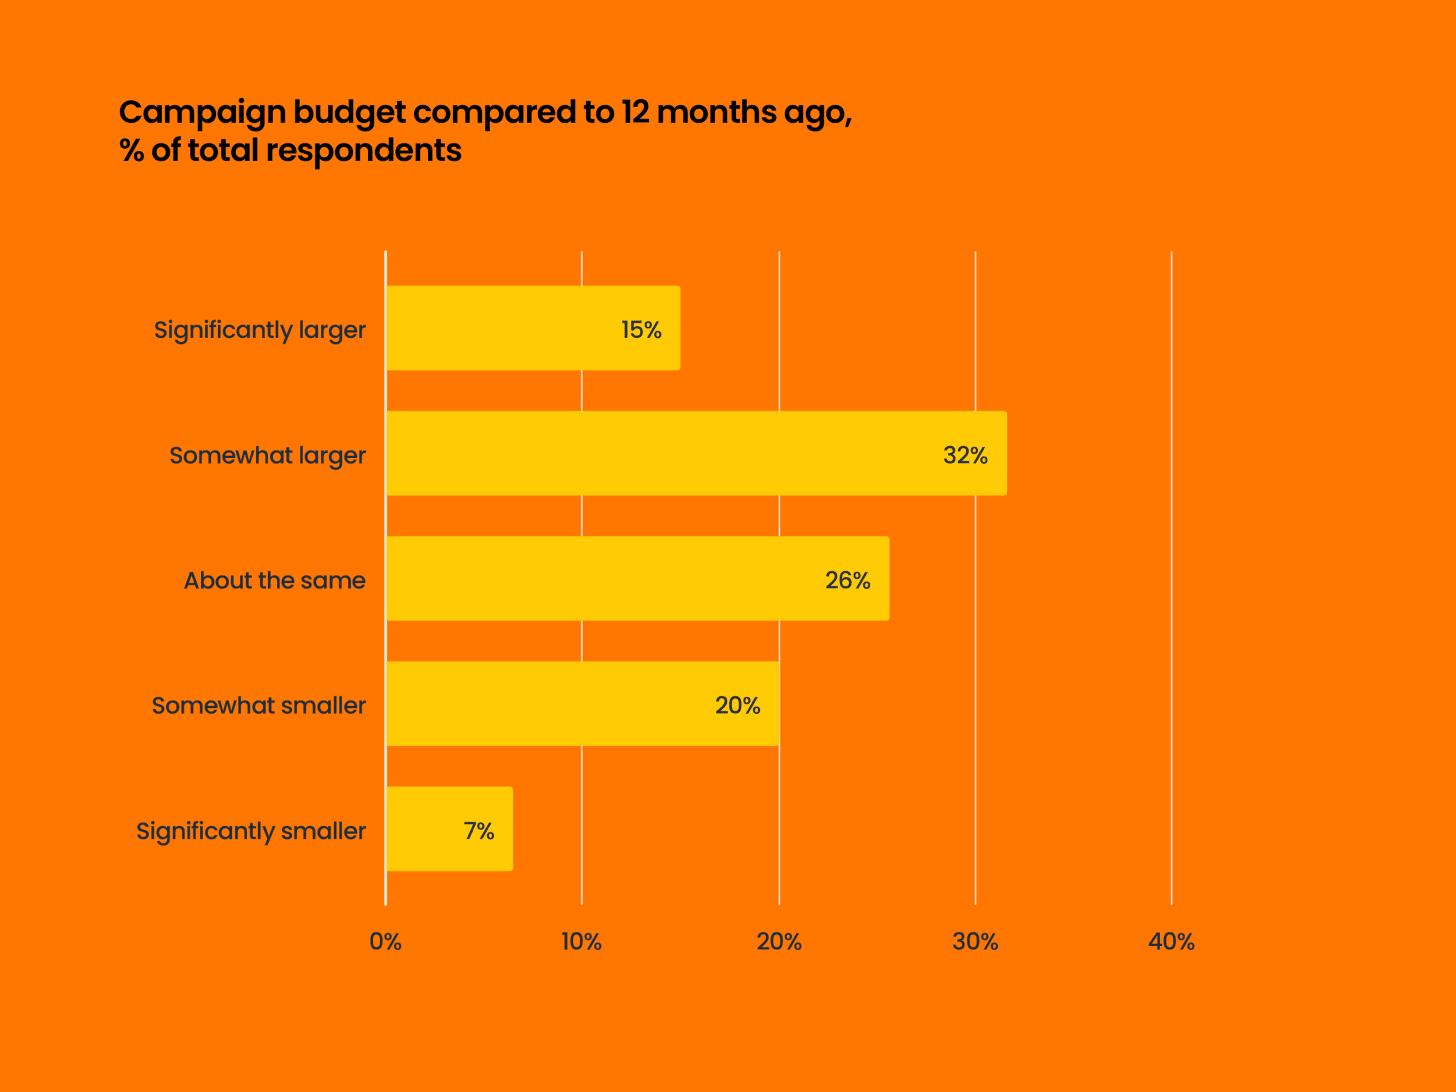
- About half of the respondents noted growing budgets. Those operating budgets of more than $1 million per month more often report growth, which indicates ongoing market consolidation.
Survey results - Innovations and Changes
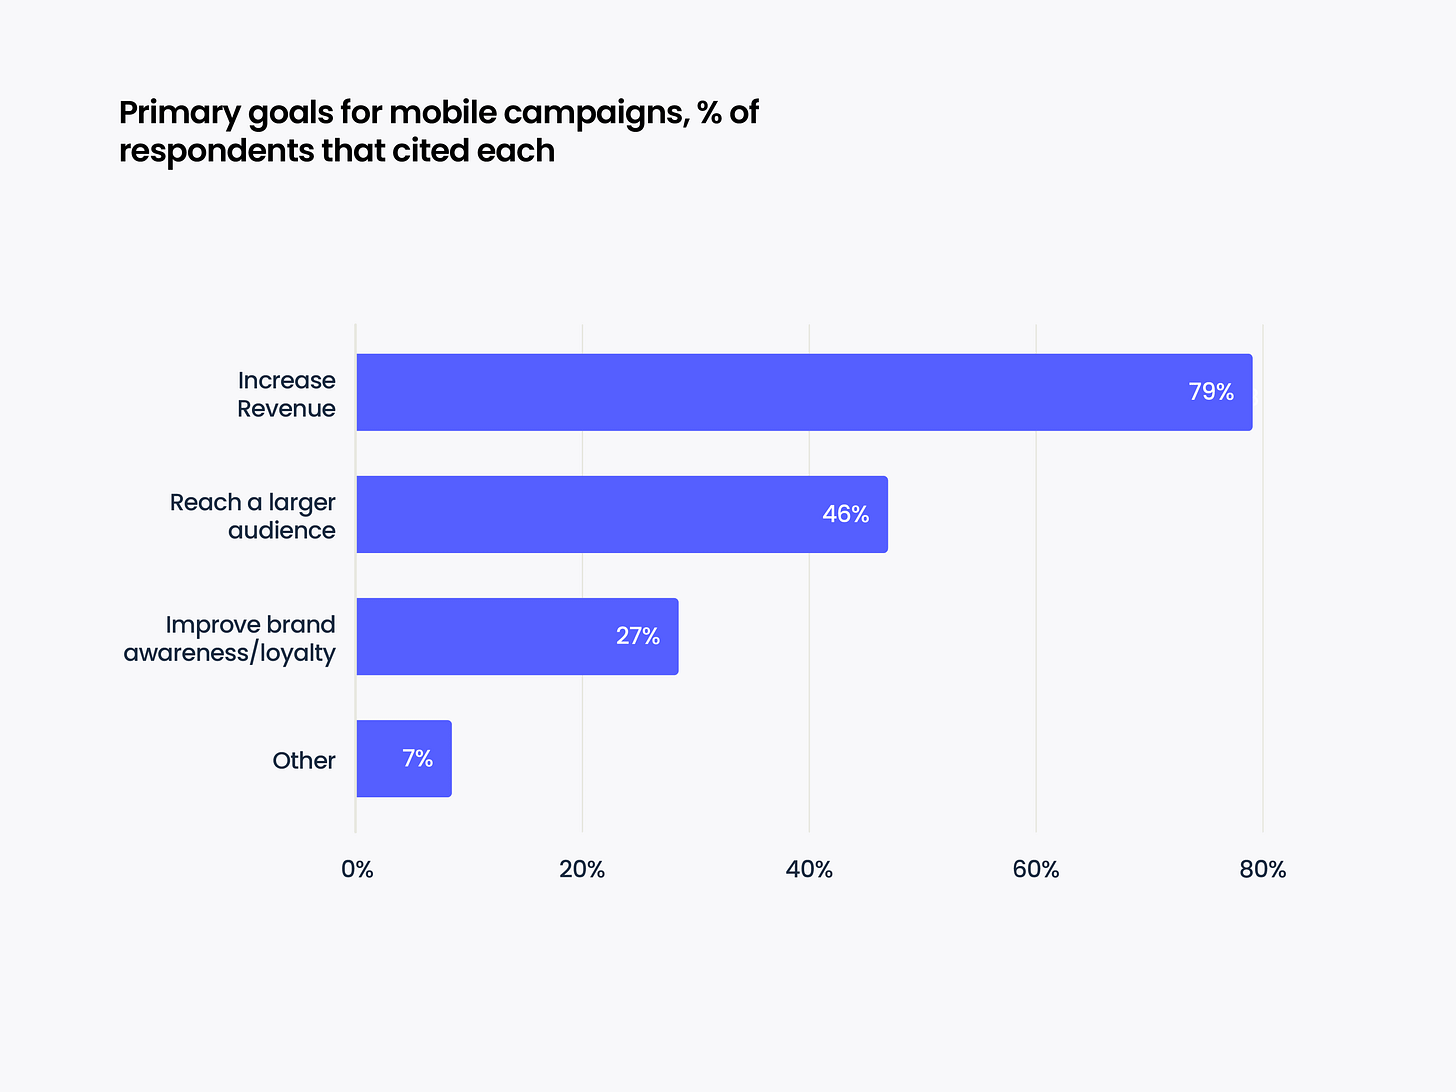
- 79% of respondents noted that growing company revenue is their main goal. 46% noted that they are working on increasing the audience of their projects. 27% are working on improving the brand and its positioning in the market - mainly representatives of the financial and educational segments.
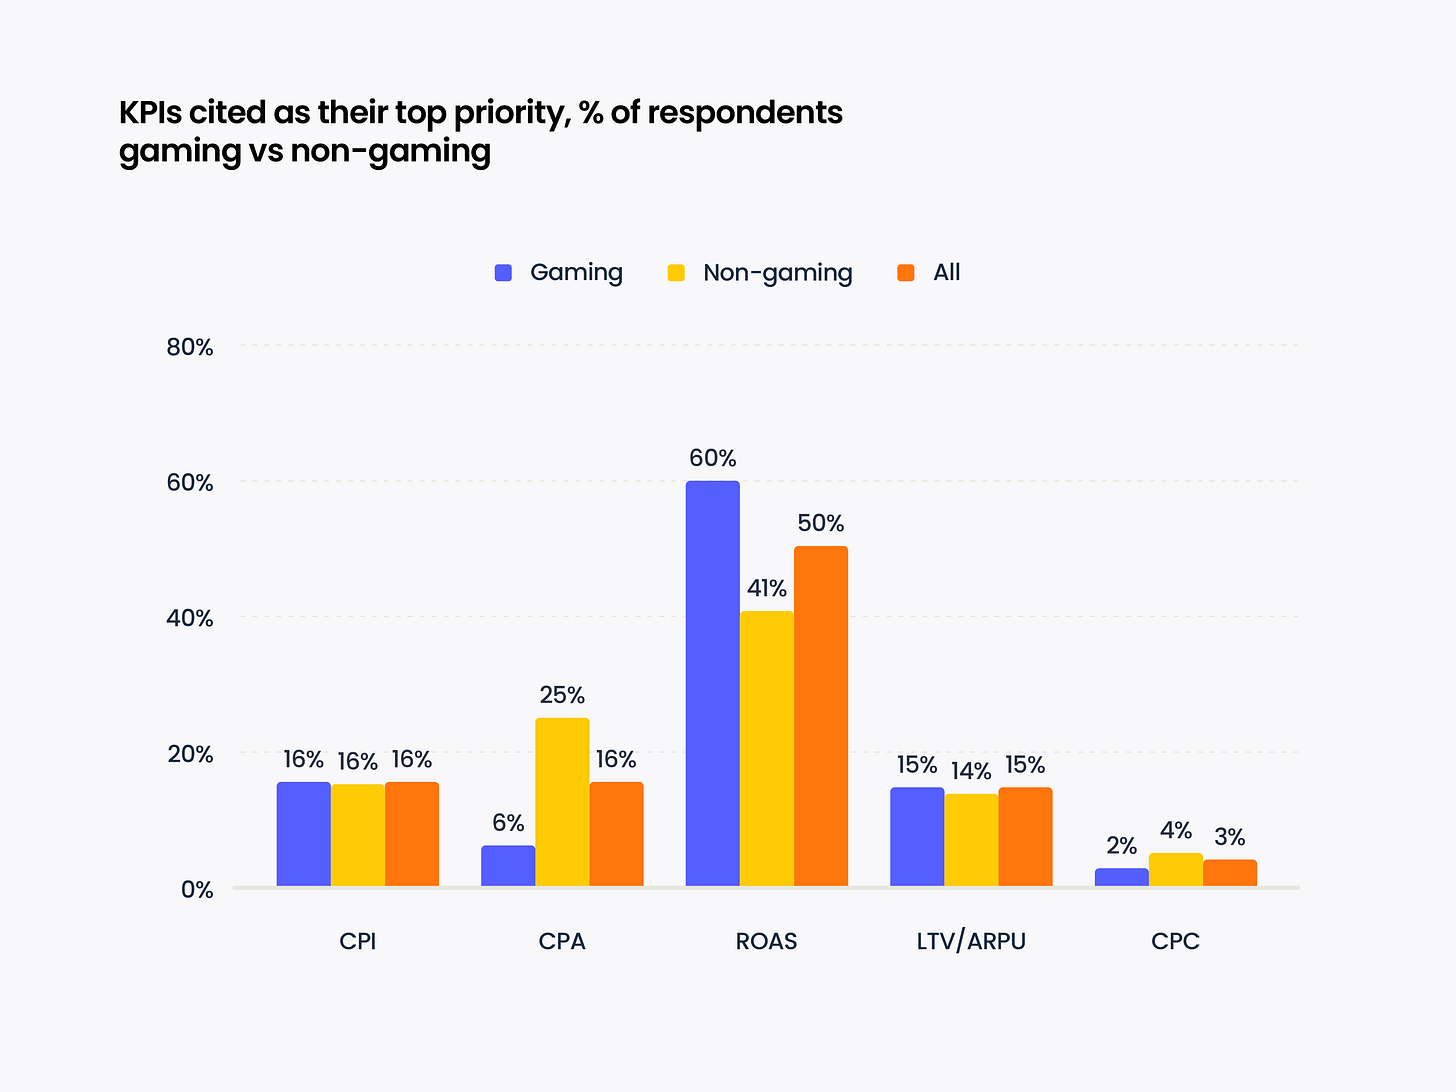
- When it comes to KPIs, most game developers (60%) focus on ROAS. They also set CPI (16%), LTV/ARPU (15%), CPA (6%), and CPC (2%) as KPIs. Among non-gaming marketers, CPA KPIs are set much more often (4 times more often).
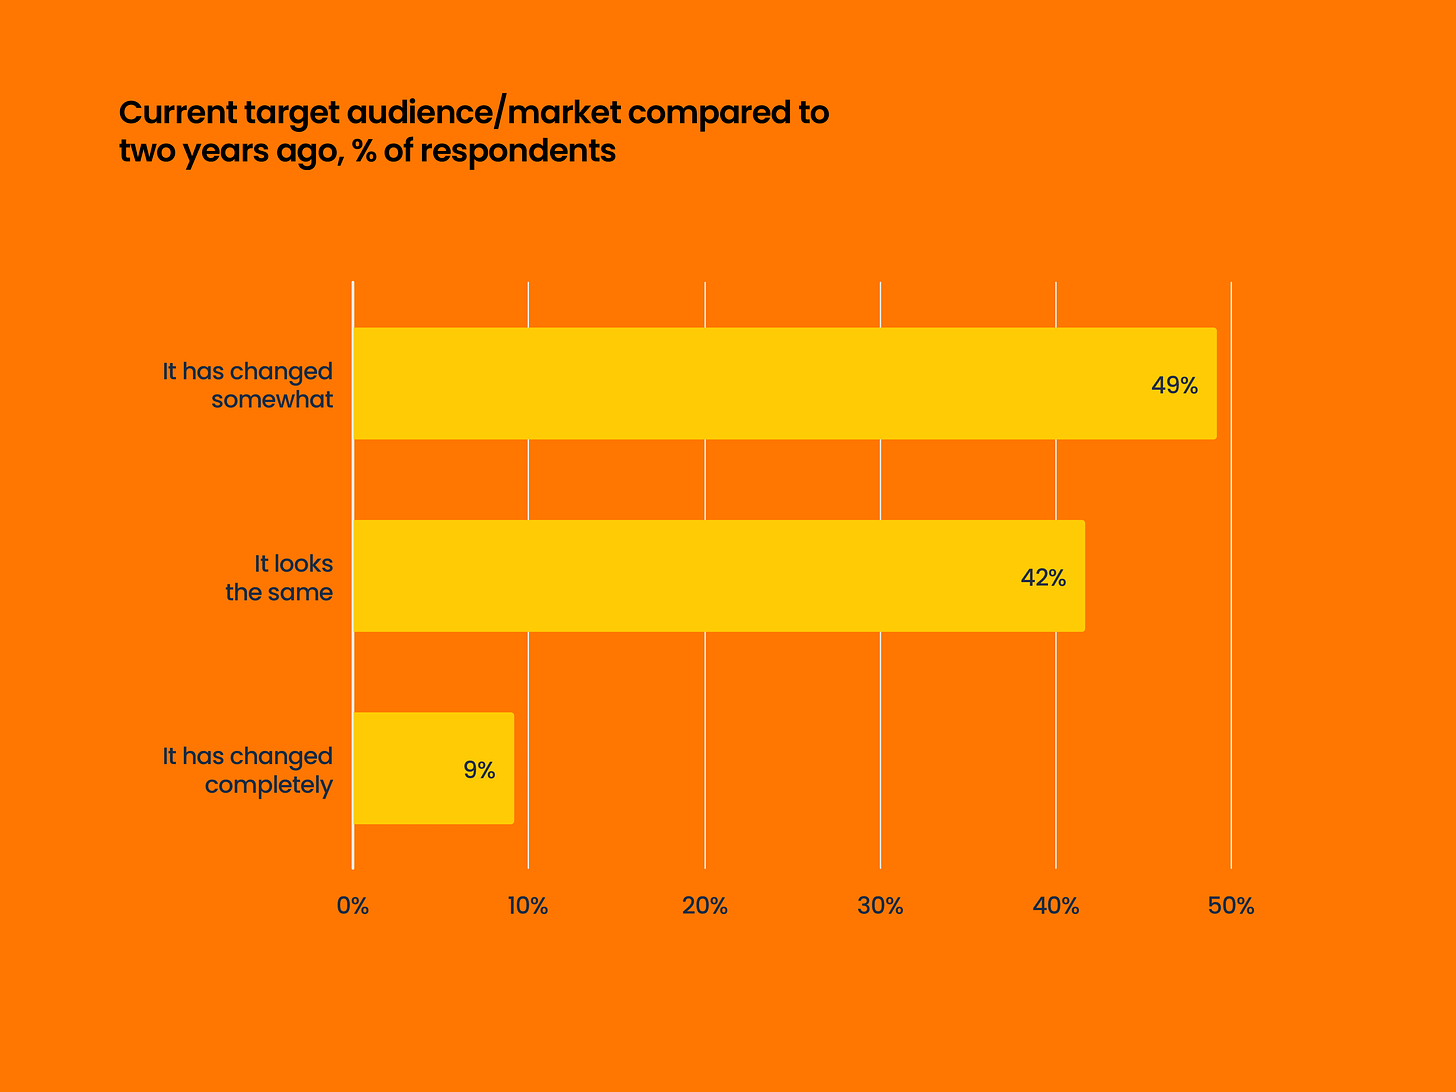
- Most market representatives feel that the mobile app audience has changed. 58% of respondents reported this.
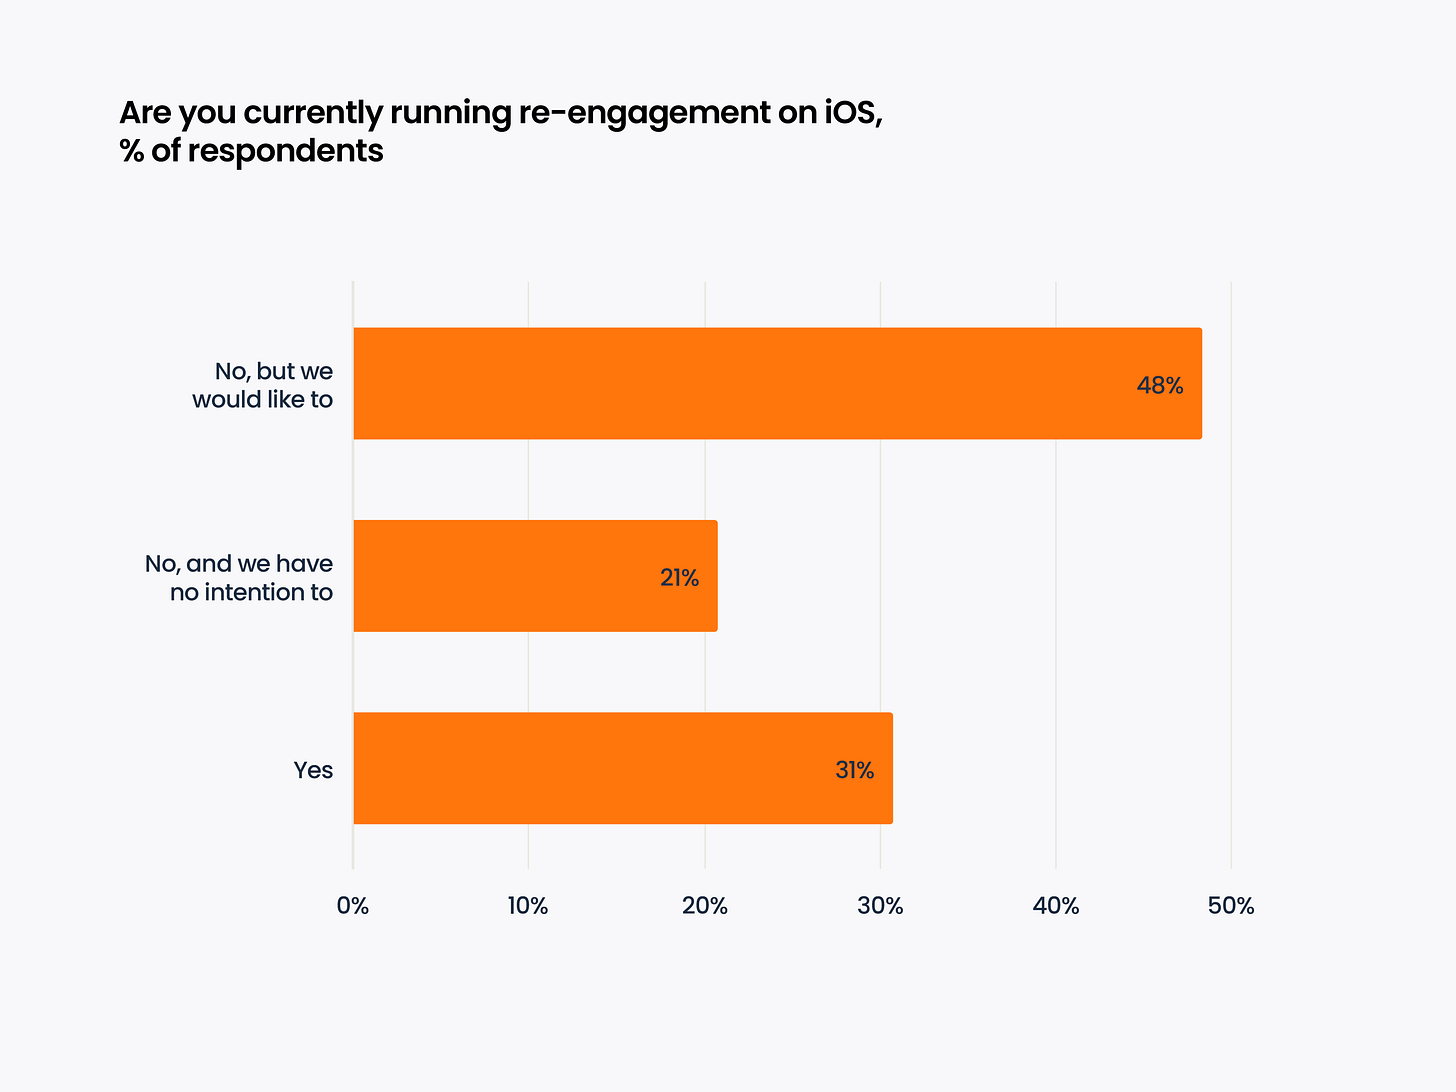
- Only 31% of marketers use re-engagement campaigns on iOS. However, 48% would like to engage in them but for various reasons are not doing so yet.
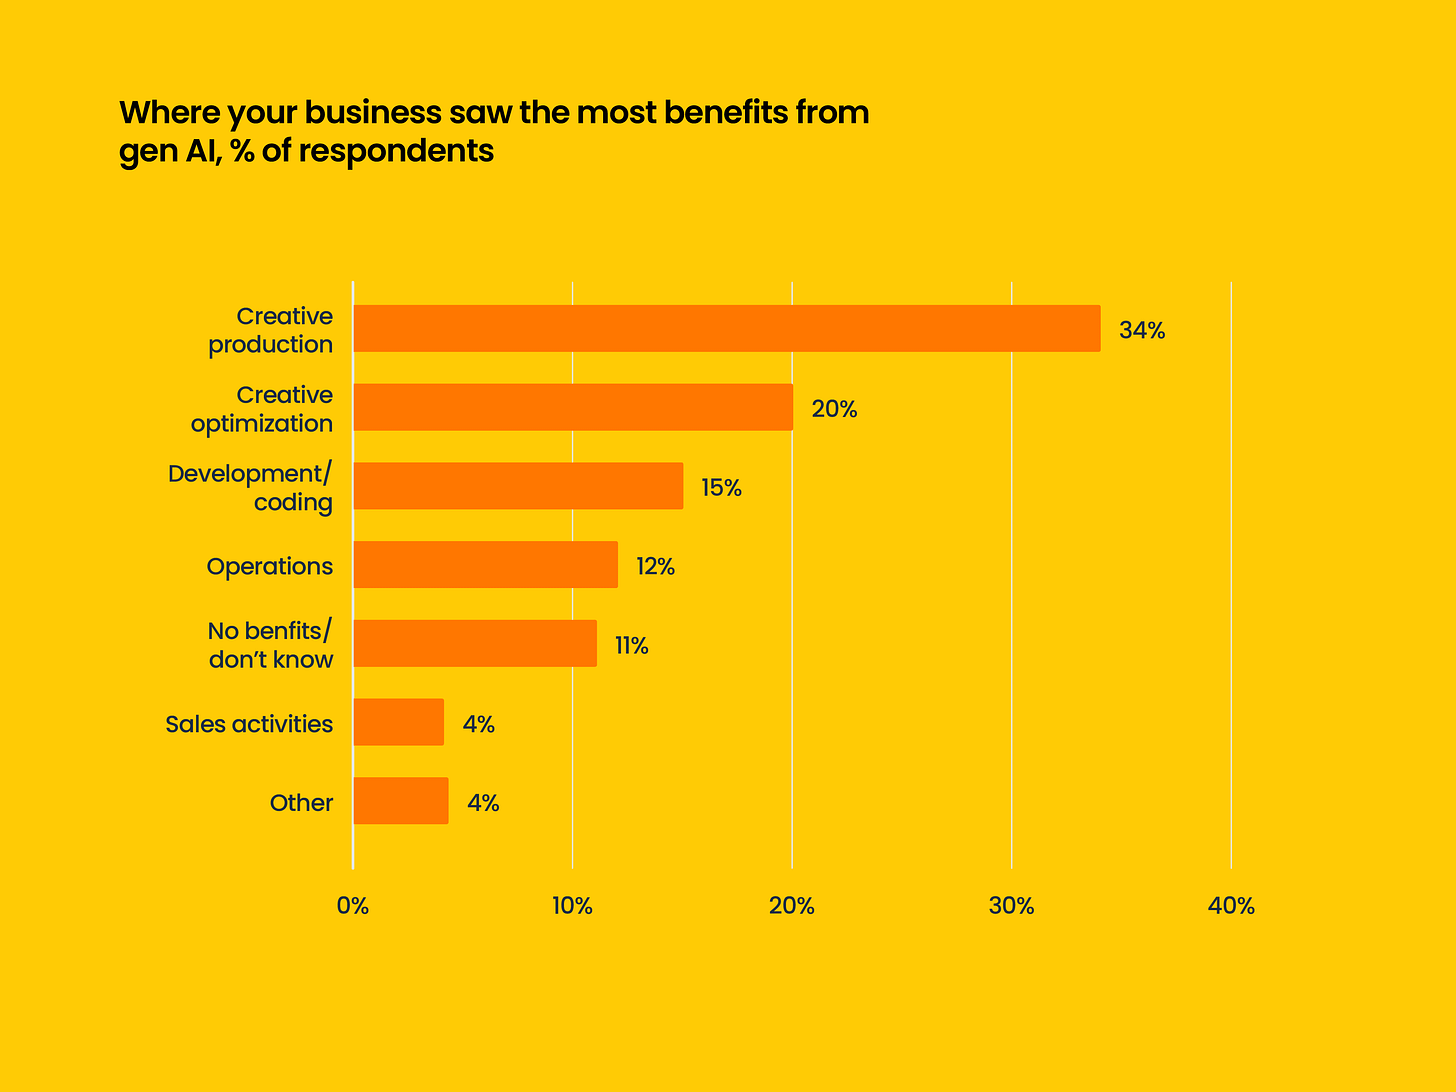
- Most respondents see the benefit of AI in creative production. 34% use AI for creative production, 20% use it for creative optimization. AI is less involved in code writing, operational work, and sales.
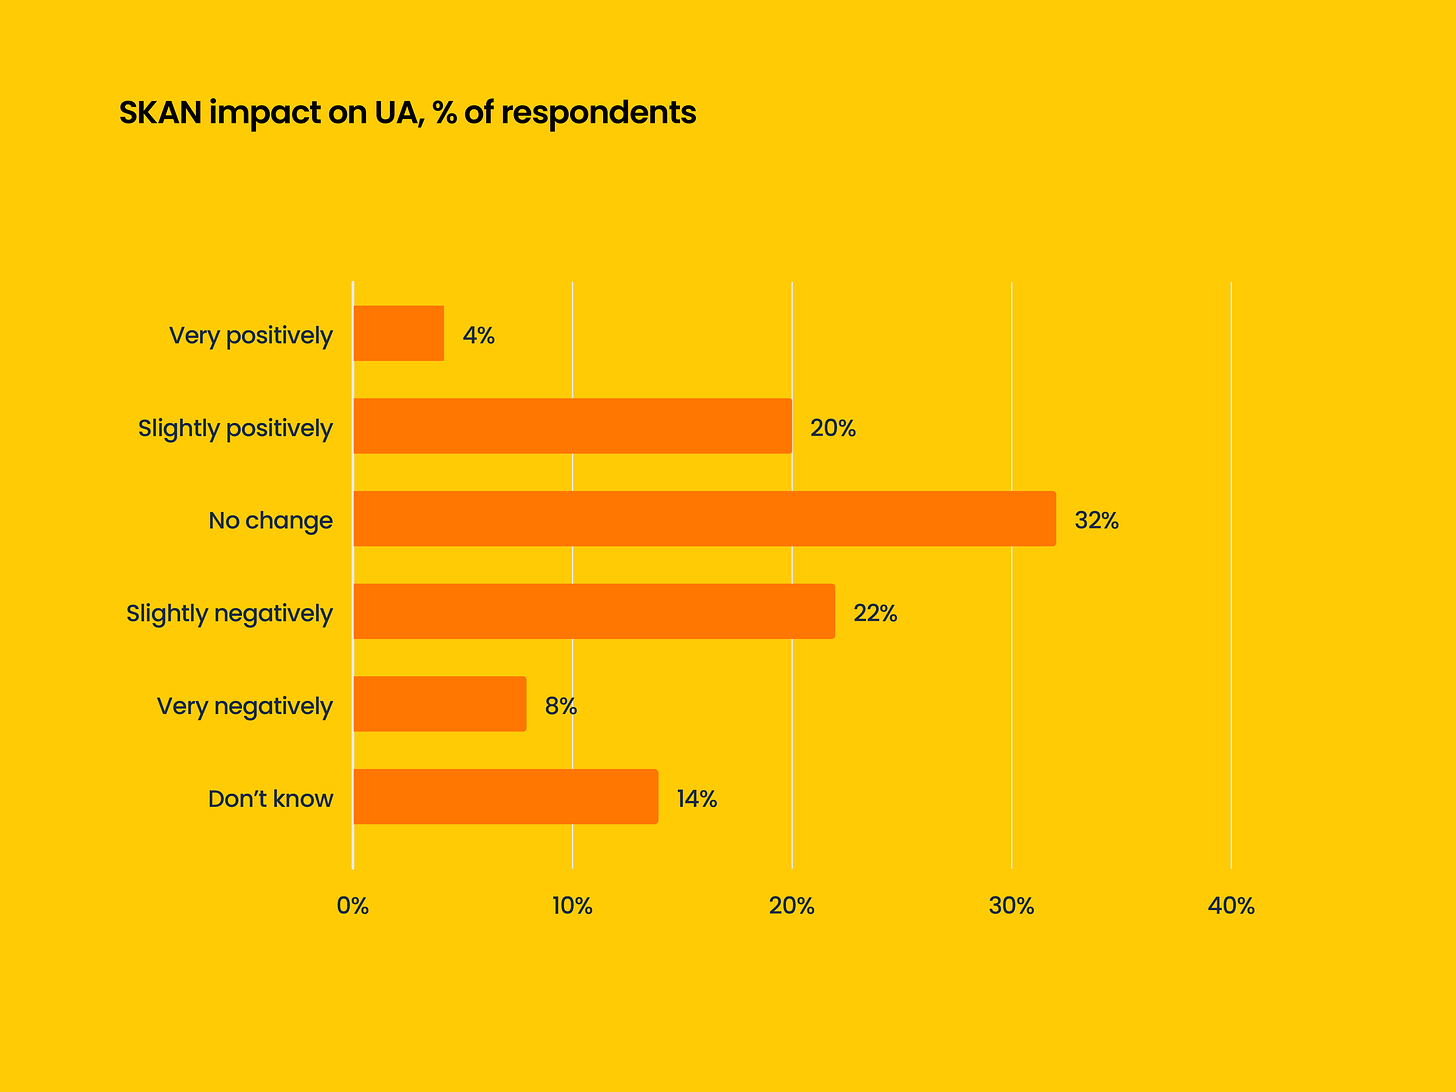
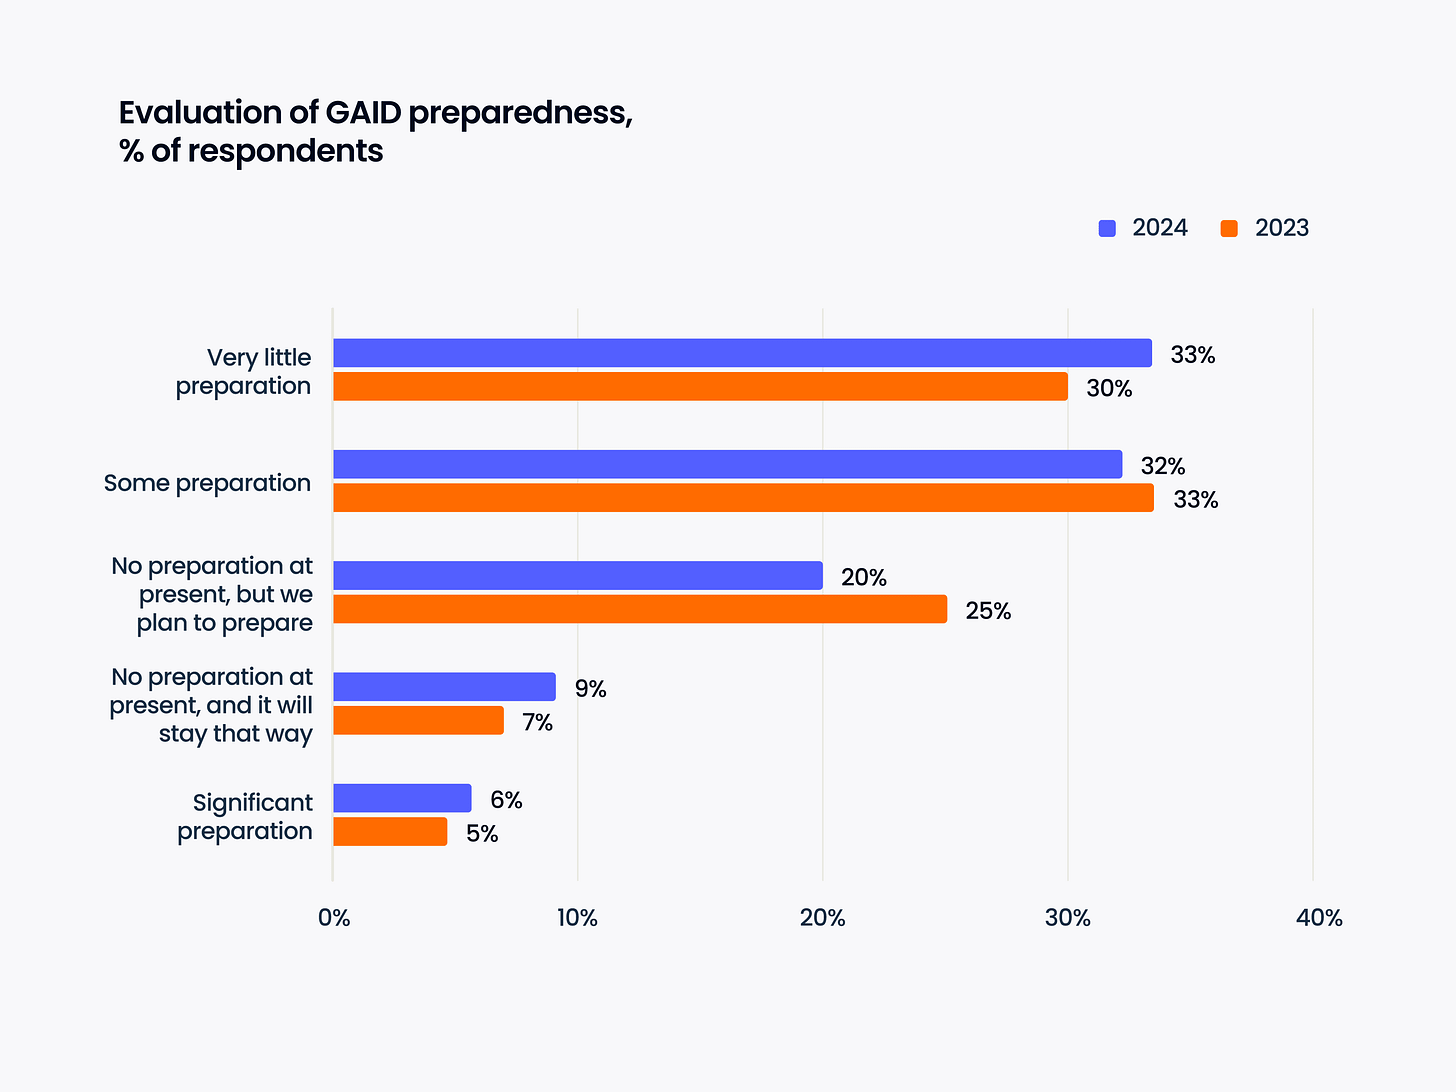
Survey results - SKAN & GAID
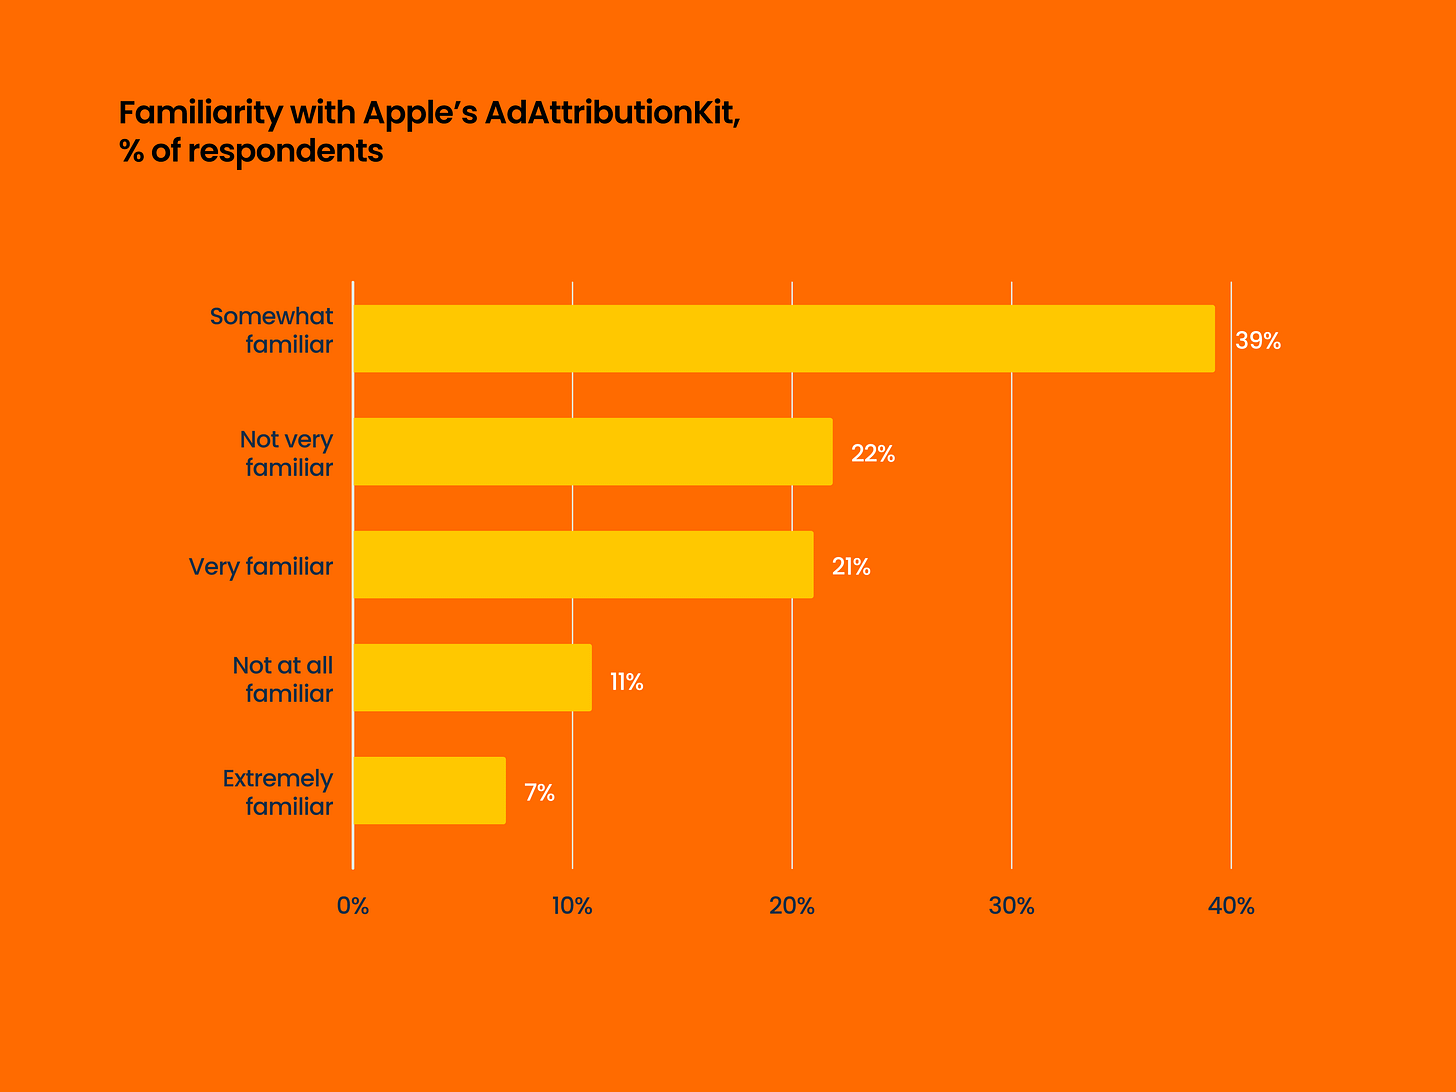
- Only 67% of respondents are familiar with AAK (AdAttributionKit).
- 30% believe that the introduction of SKAN negatively affected their UA activity. 32% saw no changes. And 24% noted positive changes.
- It cannot be said that the market is ready for GAID. Only 6% have prepared, and 32% of the market has done some preparatory work. The majority has not yet prepared for changes from Google. Among the respondents, companies with marketing budgets exceeding $1 million are more prepared for the changes.
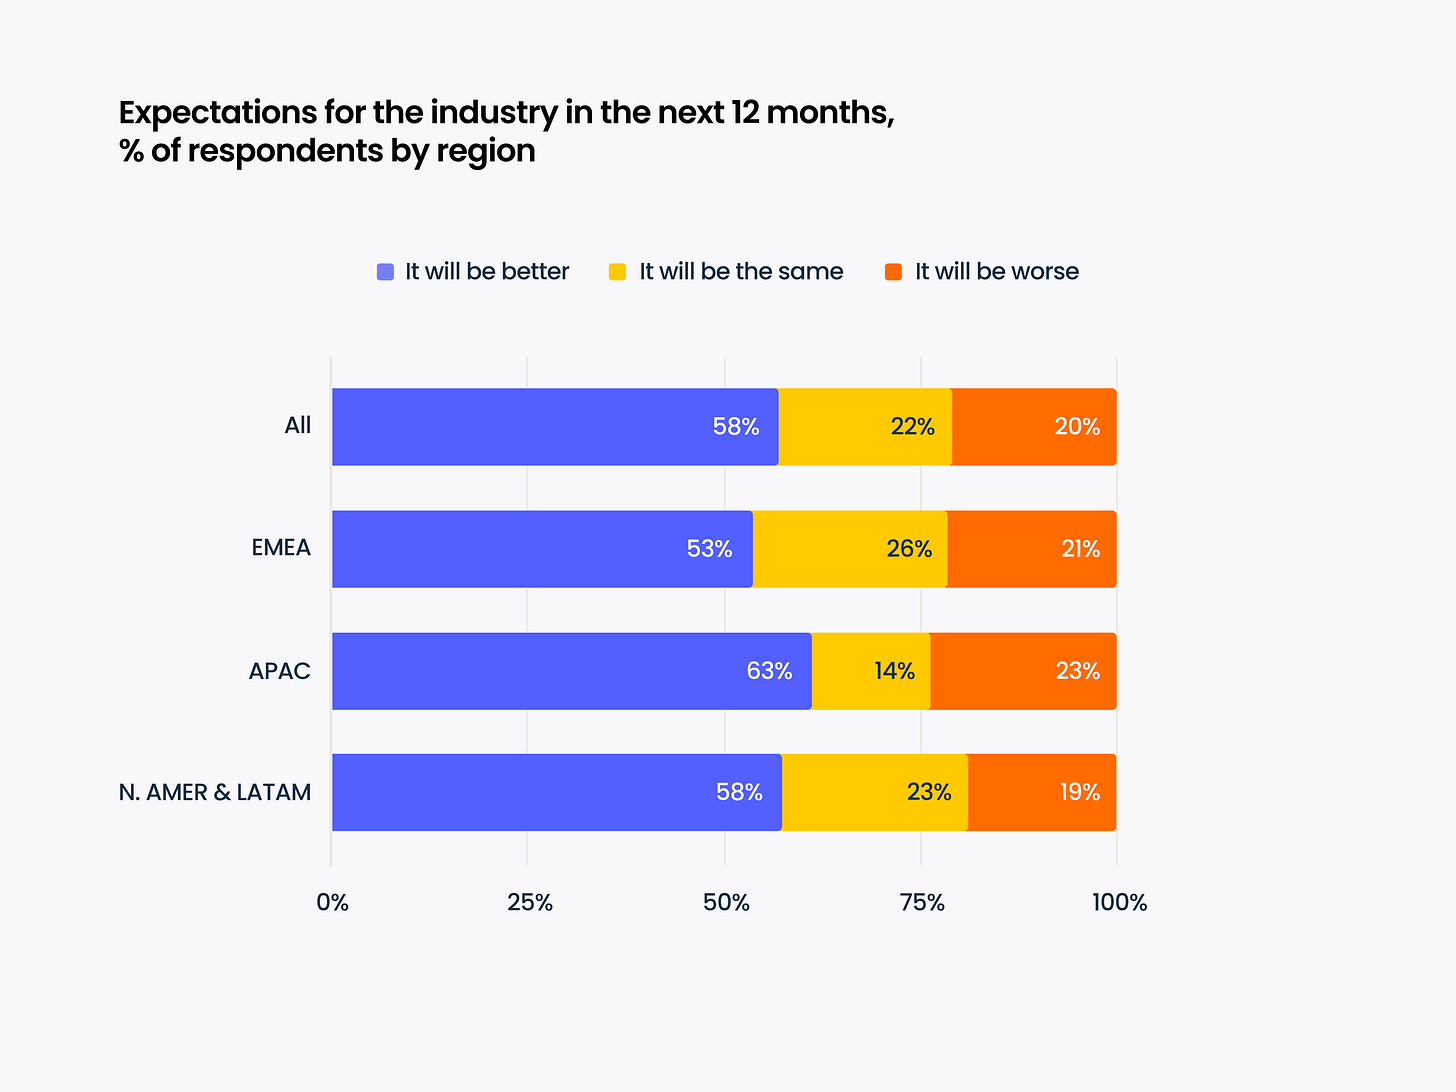
Survey results - Expectations for 2025 and priorities
- Overall, the situation in the mobile market is considered positive. But one-fifth believe that the situation will worsen in 2025.
- In terms of plans, 88% of respondents want to spend either the same or more in 2025 than last year.
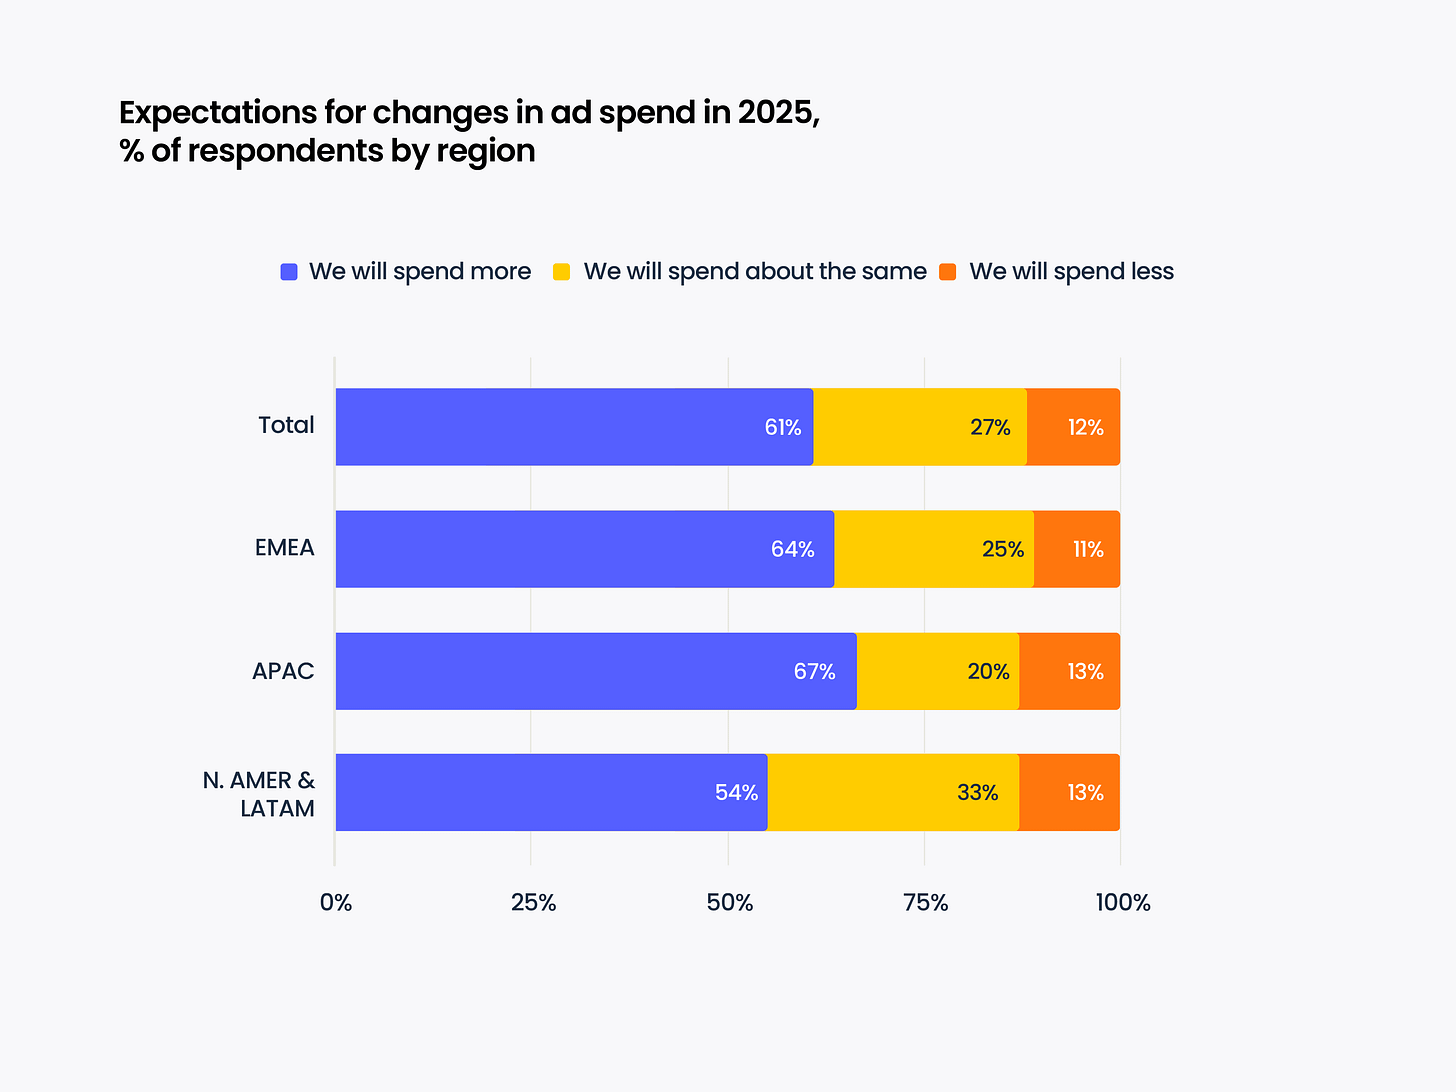
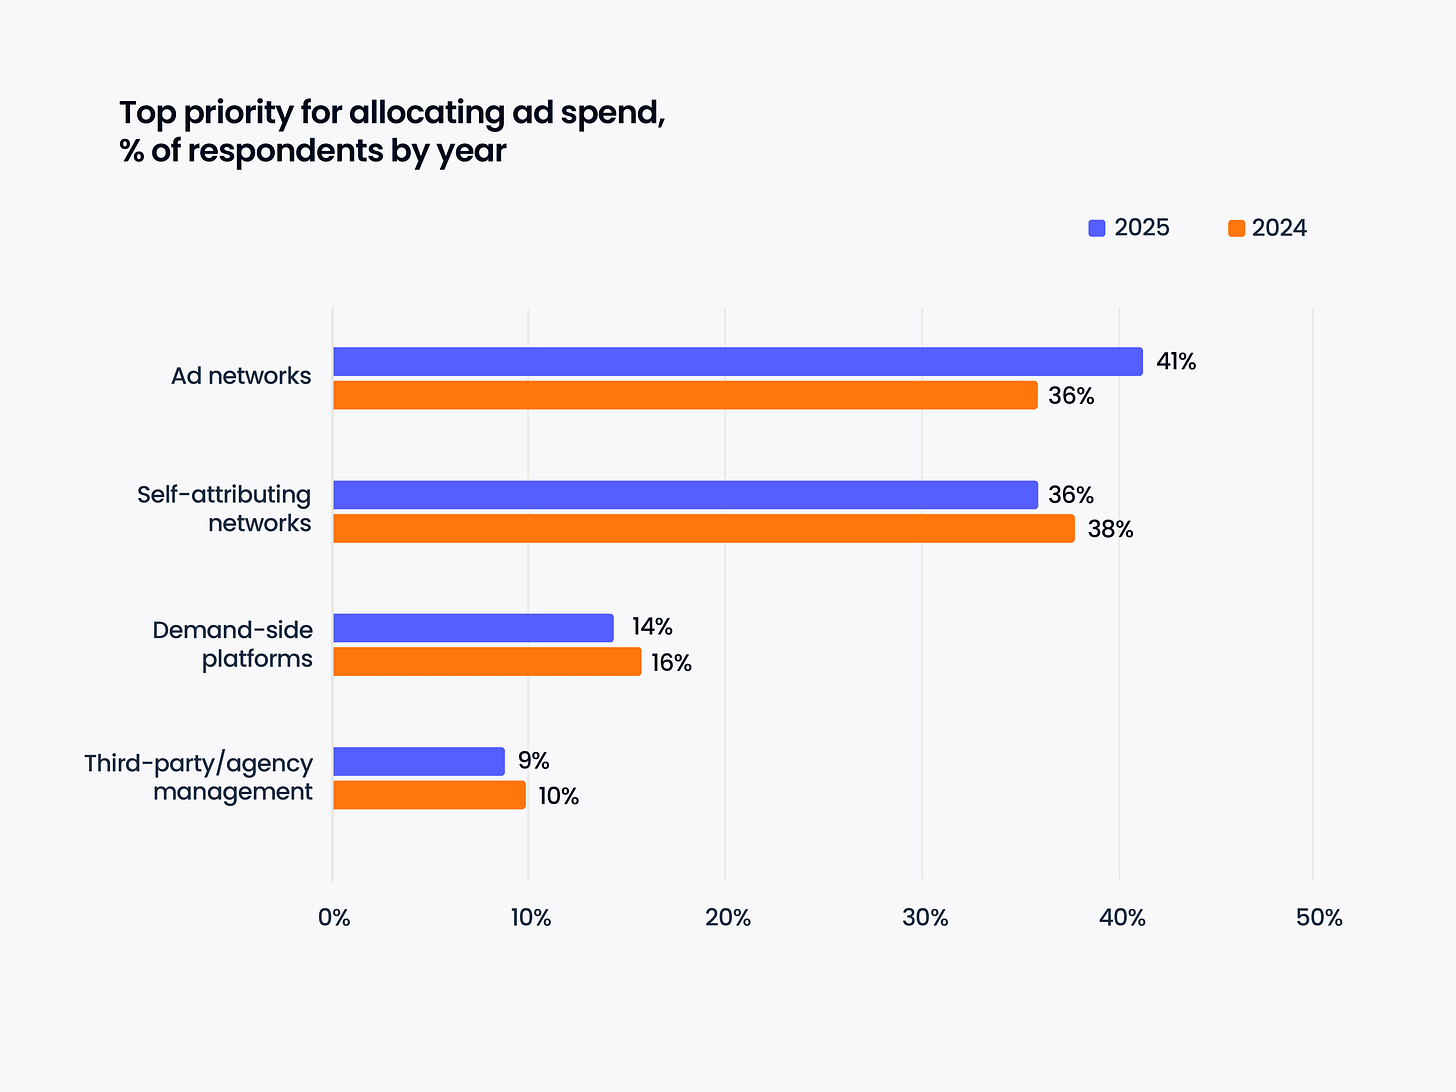
- Most spending is planned in advertising networks (priority for 41% of respondents) and SAN (Self-Attributed Network - such as TikTok, Google Ads and others, priority for 36%).
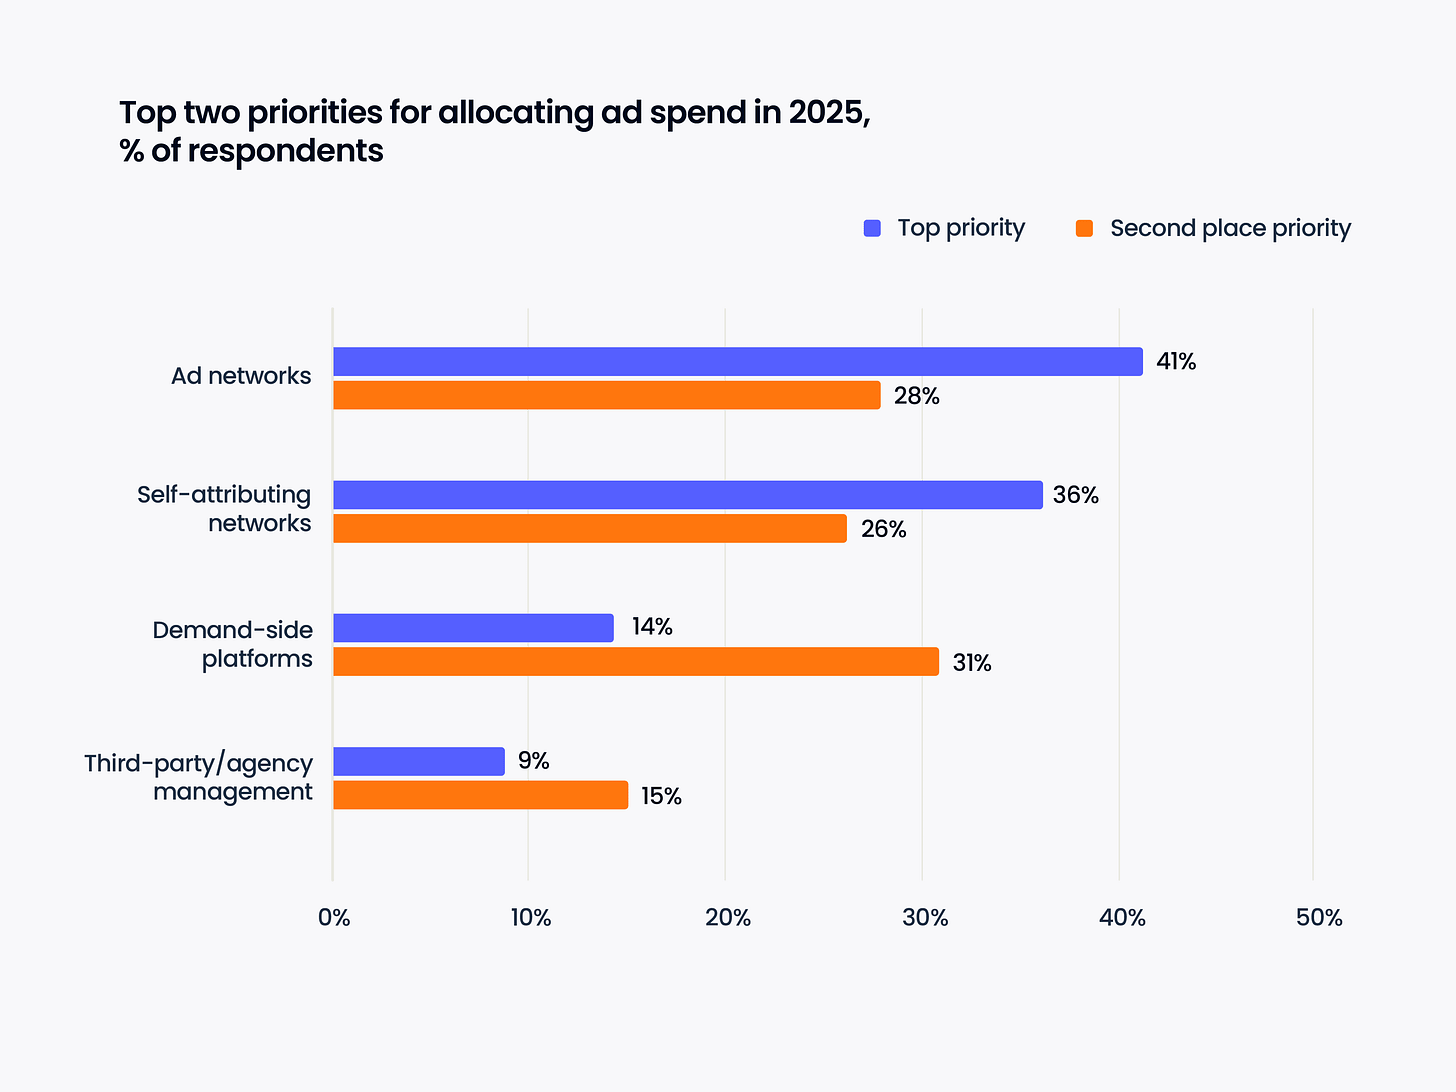
- However, compared to 2024, the popularity of advertising networks has increased, while all other advertising channels have slightly decreased.
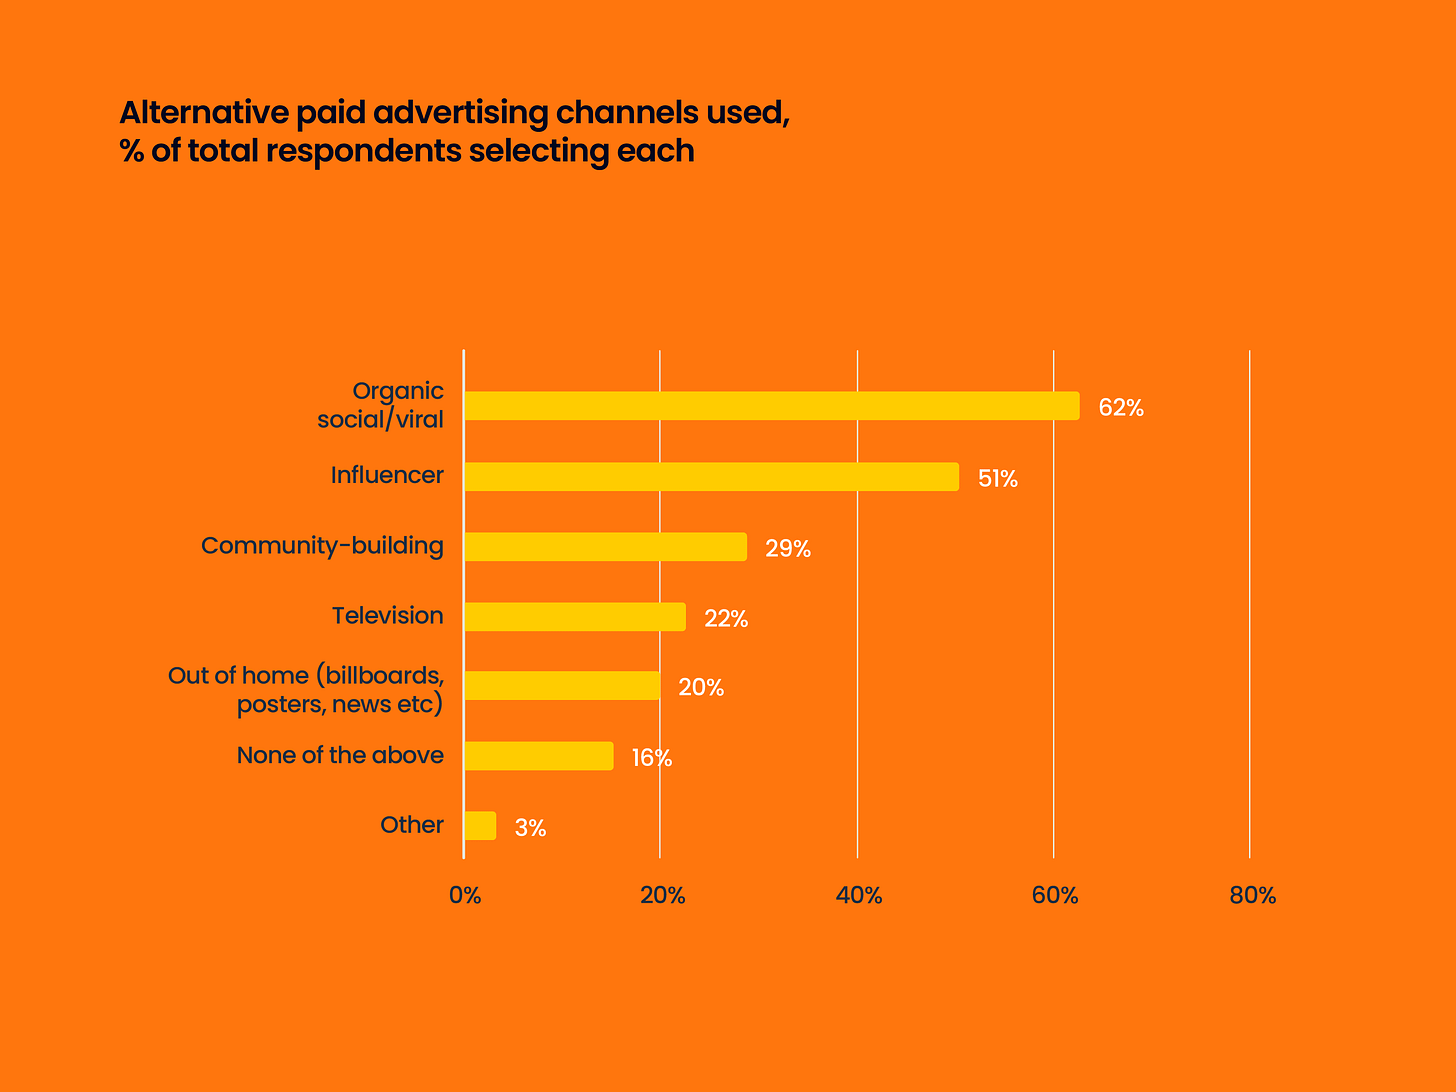
- Companies are also interested in investing in the development of organic/viral traffic (62%), influencer marketing (51%), and community building (29%).
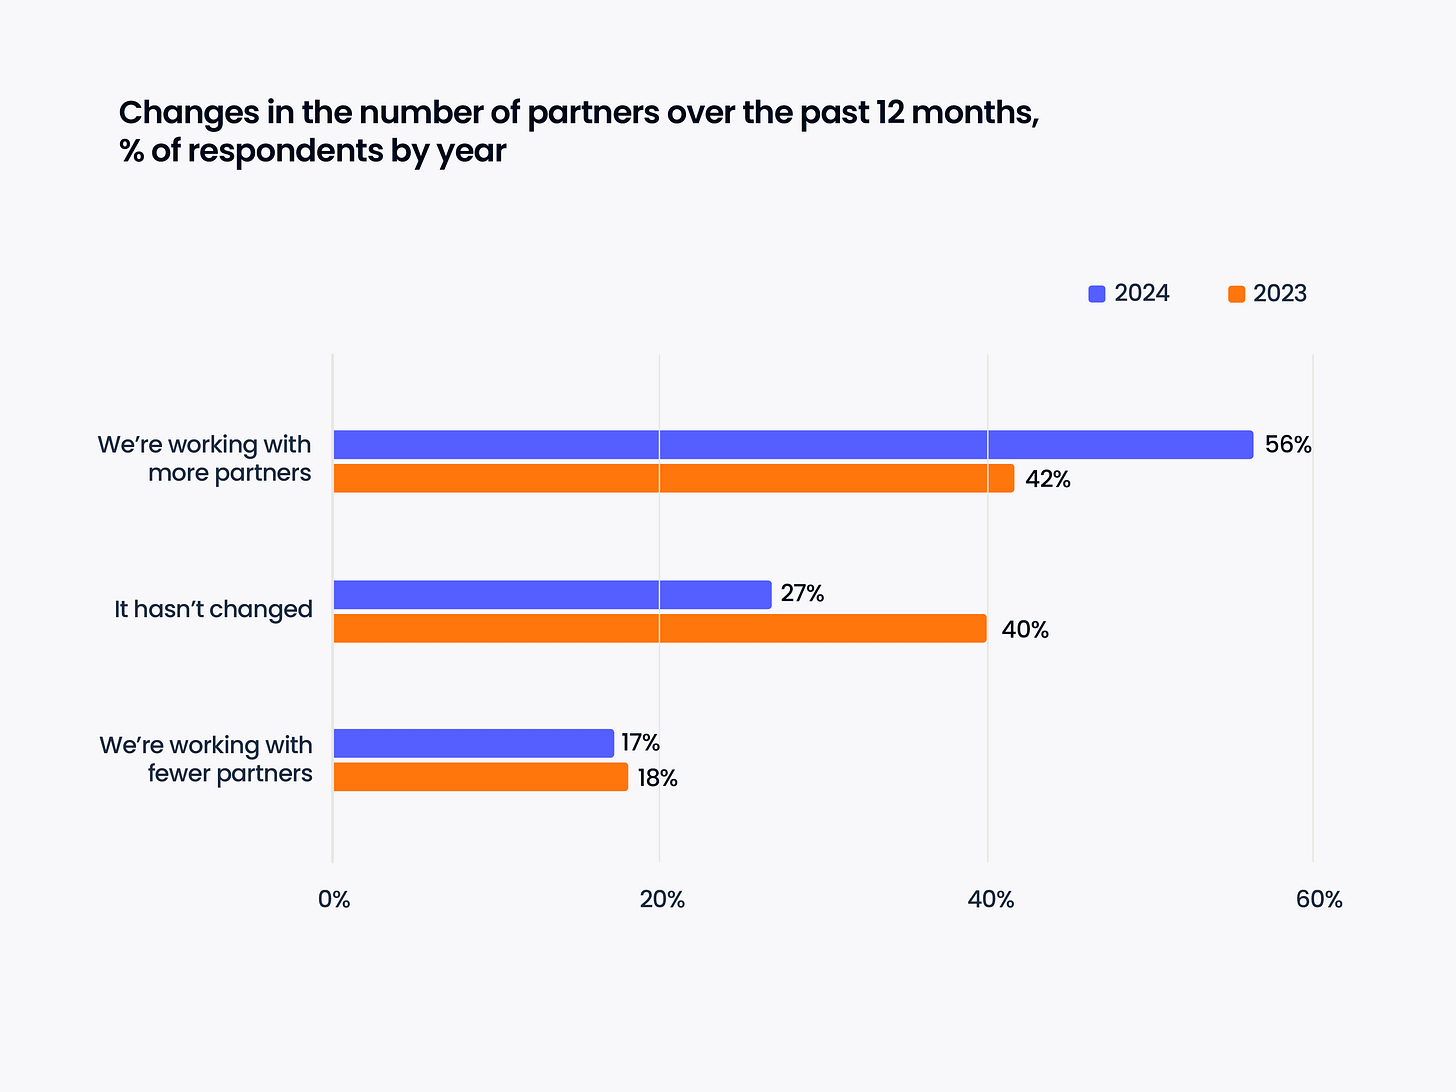
- Most respondents noted that in 2024, they started working with a larger number of partners. This is likely related to market difficulties and the desire to explore alternative opportunities.
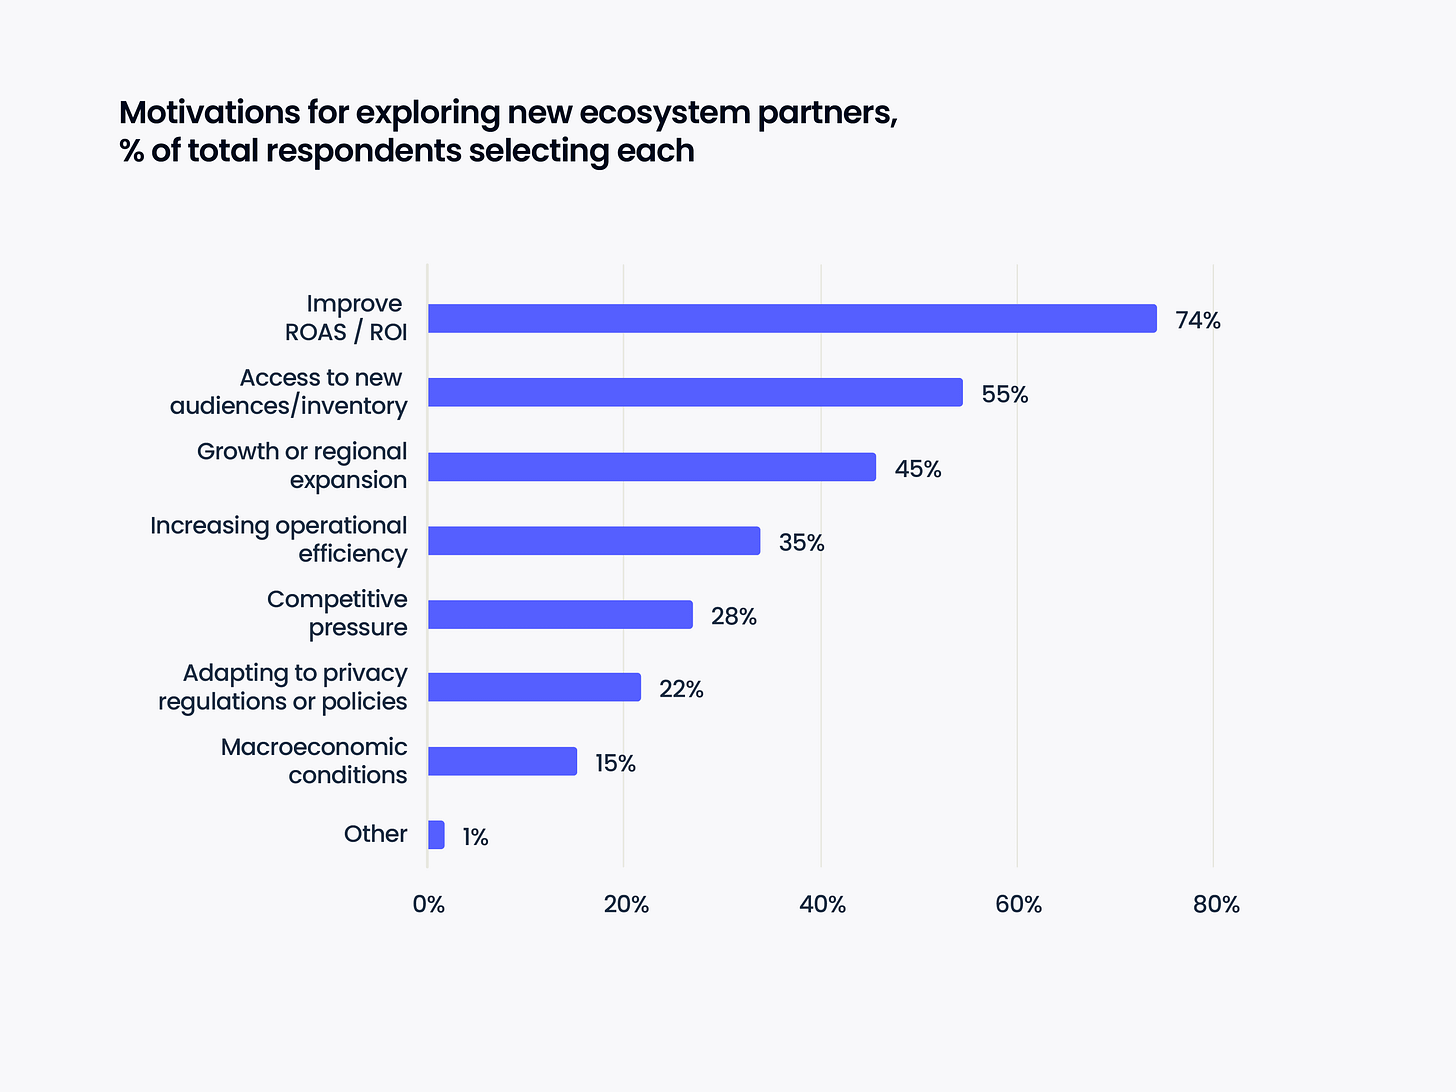
- Improving ROAS/ROI, access to new audiences and inventory, growth in new regions are the main factors when working with new partners.
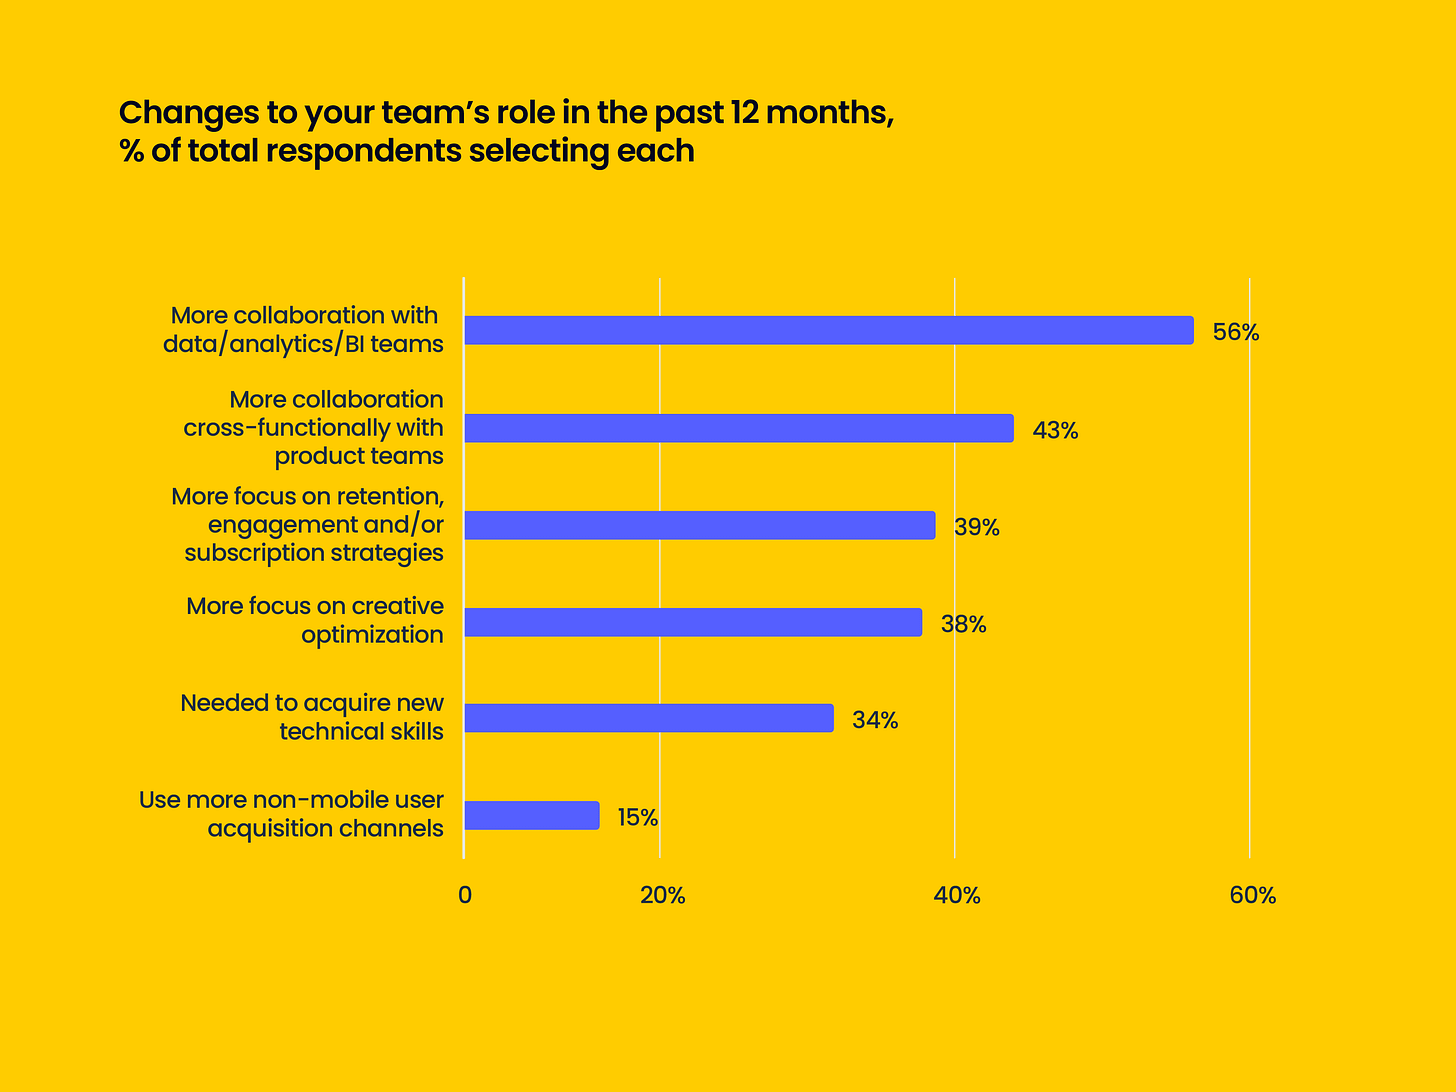
- Survey results show that over the past year, marketers have started working more often with analytics teams and product teams. They have become more focused on metrics and creative optimizations.
Epic Games Store: 2024 in Numbers
- PC users exceeded 295 million, up by 25 million from 2023.
- Total accounts in the Epic Games ecosystem reached 898 million, increasing by 94 million in 2024. This figure includes mobile platforms.
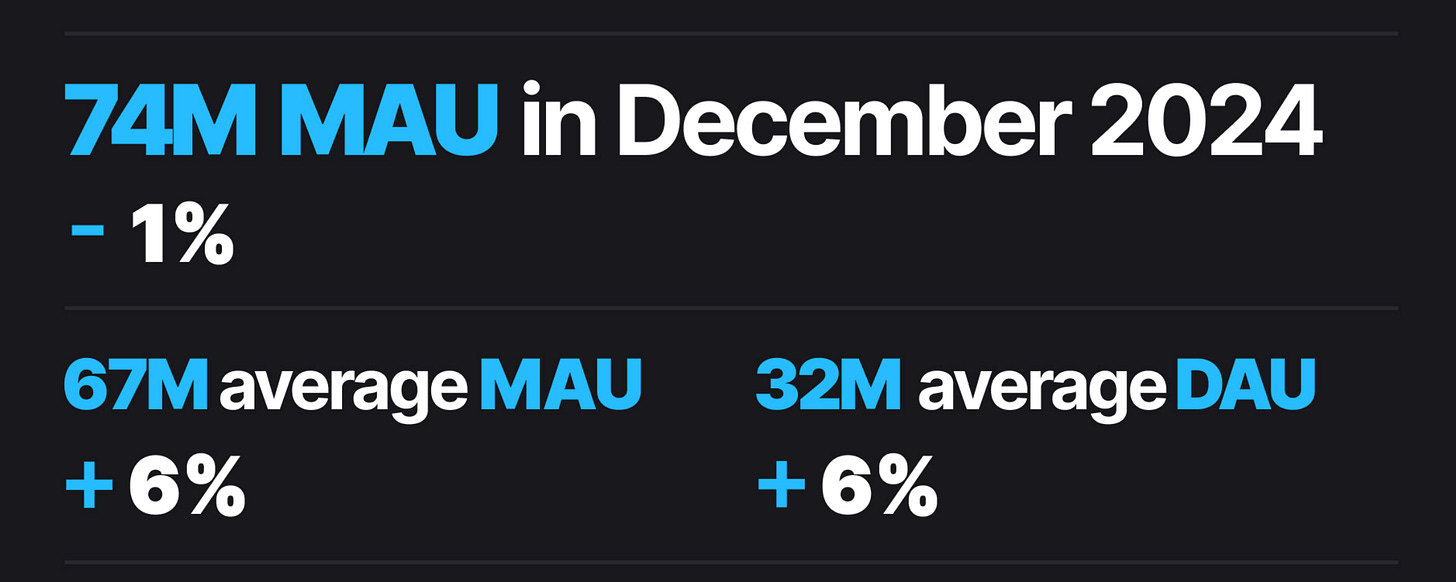
- Peak MAU was 74 million users, 1% less than the previous year. Peak DAU hit 37.2 million users.
- Average MAU in 2024 was 67 million users (+6% YoY).
- Average DAU in 2024 was 32 million users (+6% YoY).
- Users spent a total of 7.72 billion hours in games on EGS (+10% compared to 2023).
- Of this, 2.68 billion hours were spent on third-party games (11% increase from 2023).
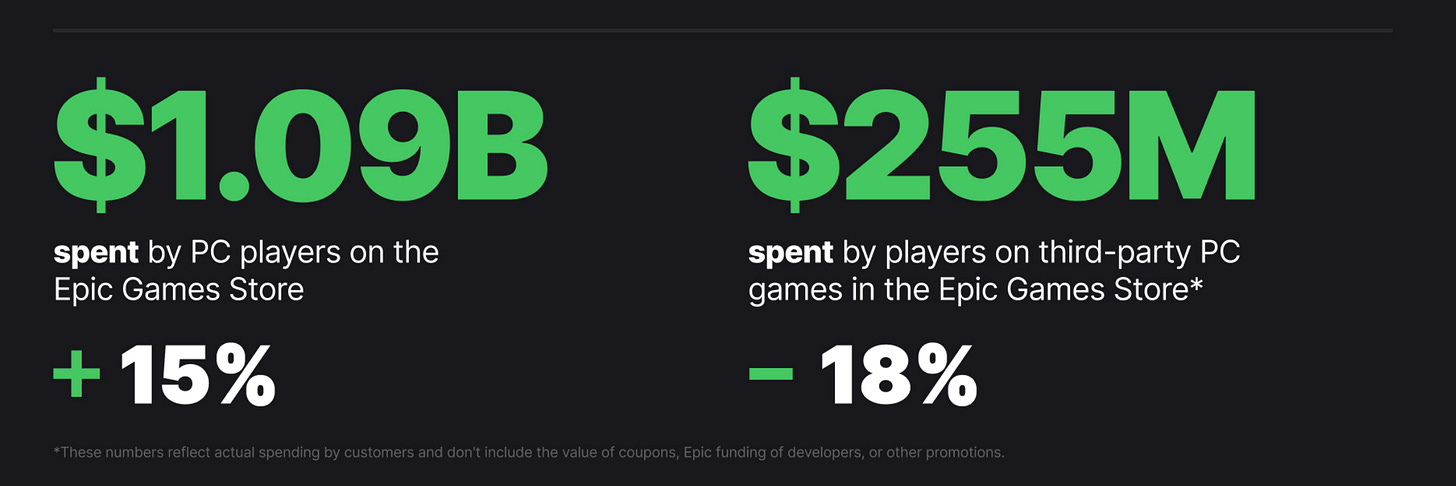
- PC gamers spent $1.09 billion on purchases in EGS, 15% more than last year.
- 1,100 games were released on EGS in 2024, expanding the total catalog to 4,000 projects.
- 3rd-party developers earned $255 million from users on the platform. This figure was 18% higher in 2023.
- EGS allows developers to use third-party payment methods, noting that Marvel Rivals, Valorant, Naraka: Bladepoint, and EA Sports FC 25 use such solutions.
- In 2024, Epic Games gave away 89 games with an average rating of 76%. Users claimed free games 595 million times.
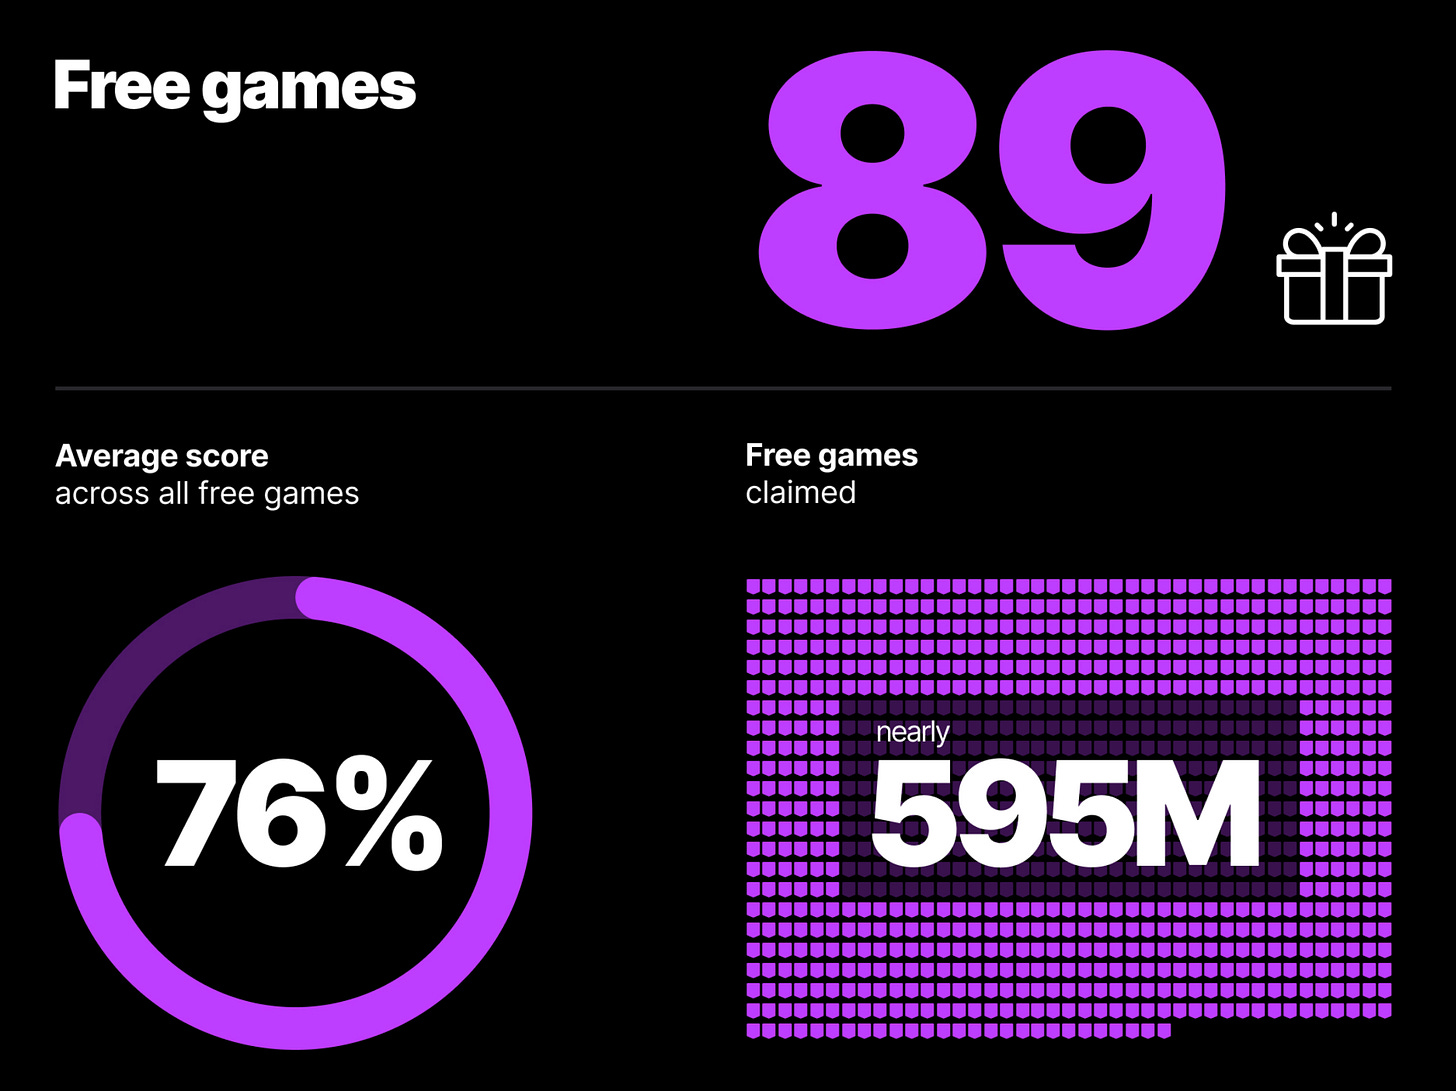
- The total value of free games was $2,229 (based on US market prices).
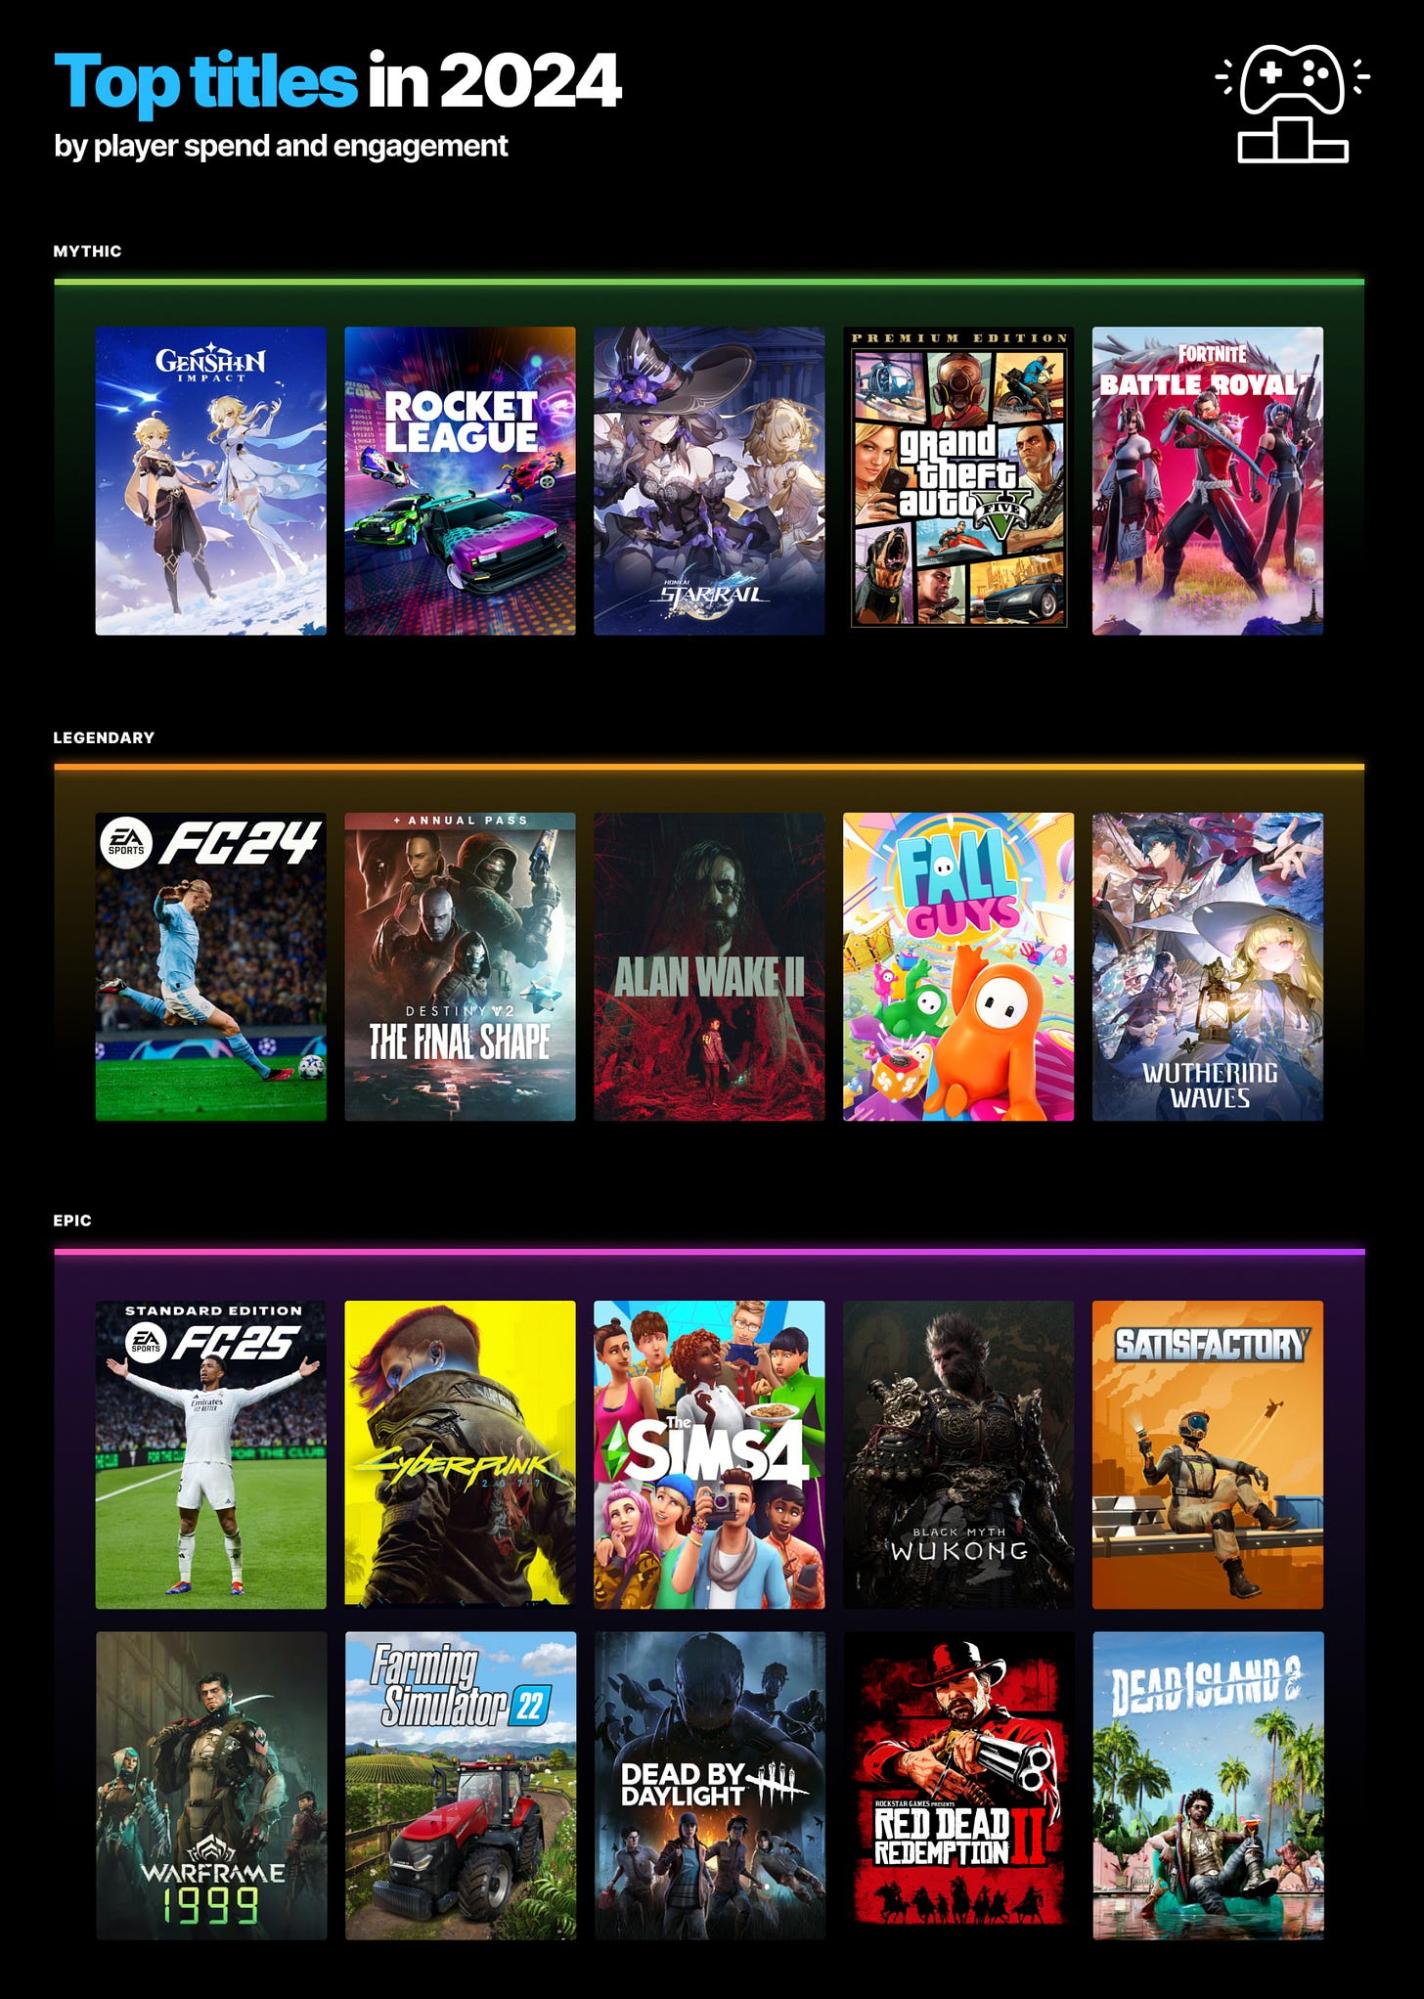
- Genshin Impact, Rocket League, Honkai: Star Rail, Grand Theft Auto V, and Fortnite were the platform's highest-earning projects.
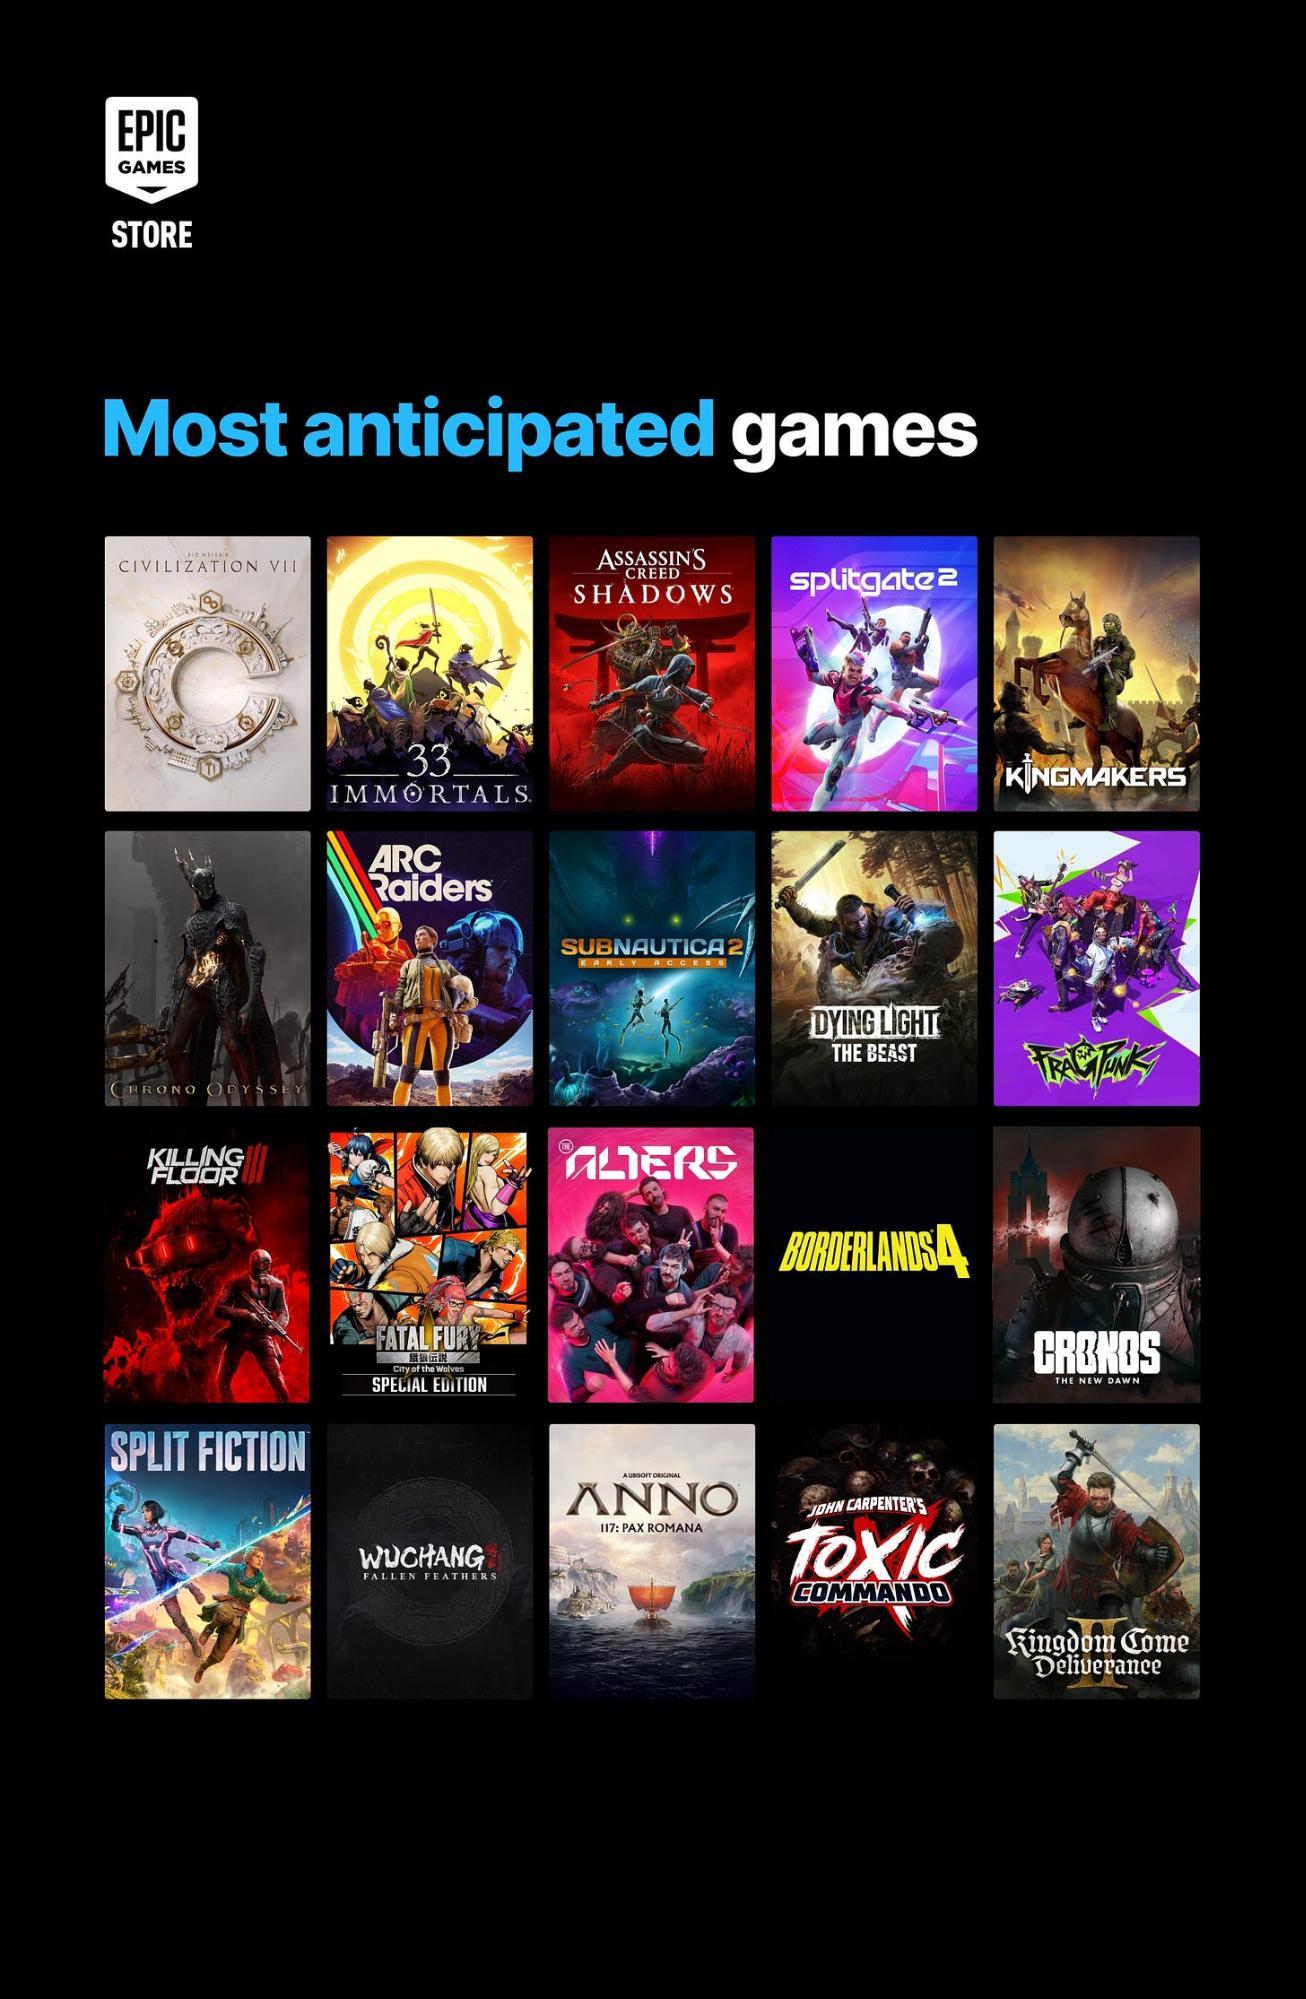
- The company also shared a list of the most anticipated projects.
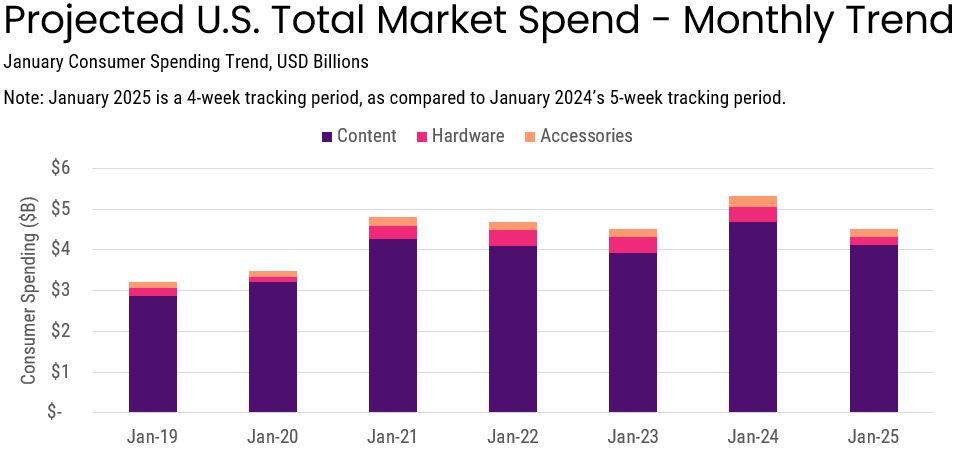
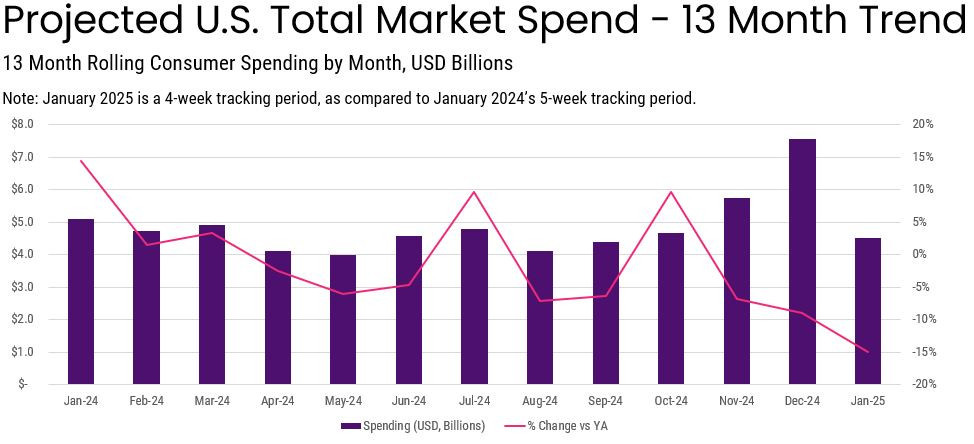
Circana: The US gaming market in January'25

Overall market condition
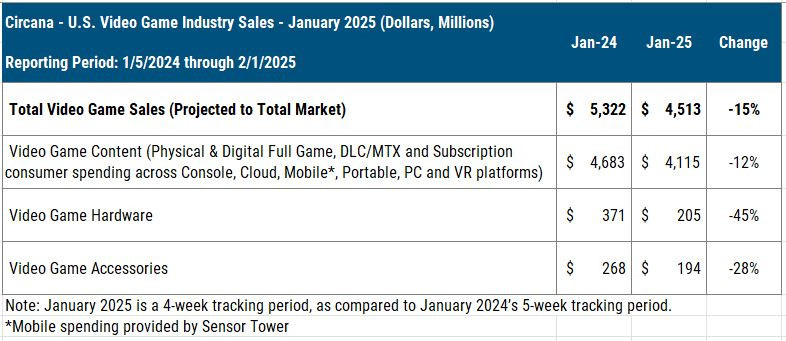
- The market in January 2025 declined by 15% compared to January 2024 - to $4.513 billion.
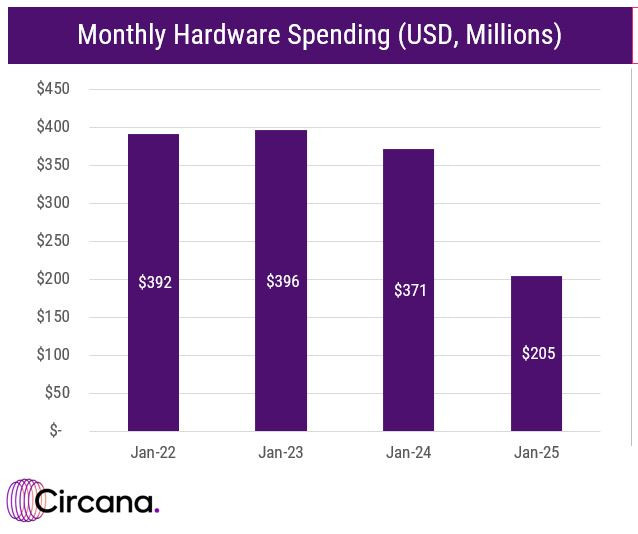
- Game sales fell by 12% - to $4.115 billion; gaming hardware sales dropped by 45% to $205 million; and accessory sales decreased by 28% to $194 million.
❗️BUT! The figures are for a 4-week period, while January 2024 accounted for 5 weeks. So it's not as bad as it seems.
- Gaming hardware sales figures are the lowest since January 2020. PS5 sales fell by 38% YoY, Xbox Series S|X sales - by 50%, Nintendo Switch - by 53%. “It’s 4 weeks”, - you can say. But Matt draws attention to 2022 and 2023 (also 4-week periods). The console market is cyclical.
- PlayStation 5 - the best-selling console of the month both in terms of revenue and number of systems. Xbox Series S|X is second in revenue, while Nintendo Switch is second in units sold.
- PlayStation 5 Pro sales are lagging behind PlayStation 4 Pro sales dynamics.
- 49% of all PS5s sold in January in the US were digital. 88% of Xbox Series S|X sold had no disc drive.
- PlayStation Portal continues to be the best accessory in the US by dollar sales. In terms of numbers sold, DualSense Midnight Black leads.
- Growing segments include non-mobile subscriptions (13% growth) and mobile game revenue (+2%). However, console content sales fell by 35% YoY (again, we're comparing 4 weeks to 5 weeks of January 2024).
Game sales
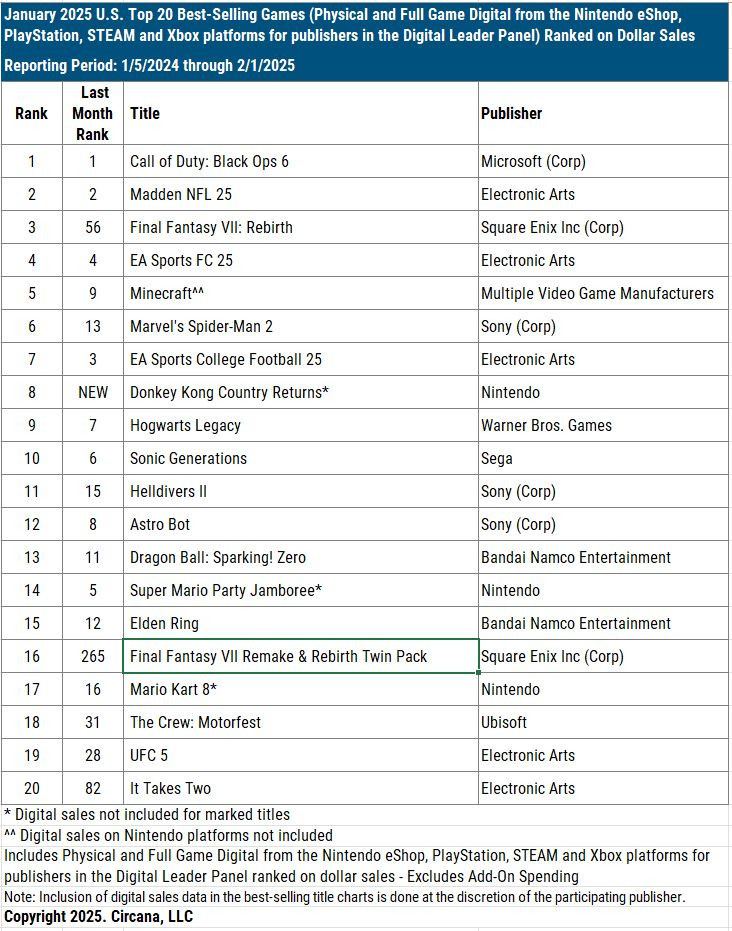
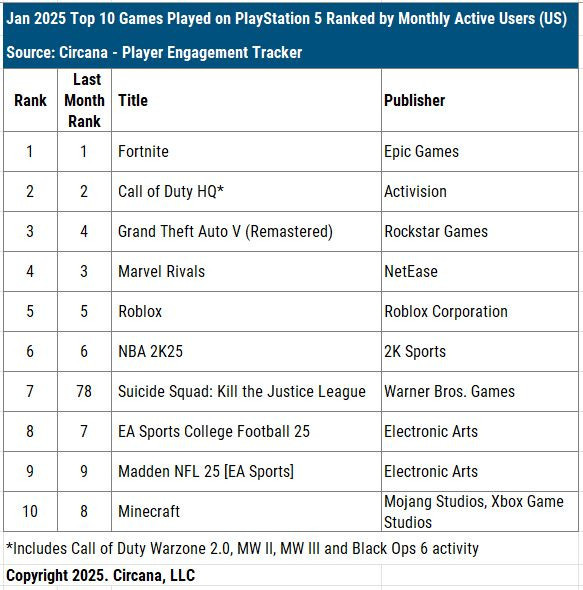
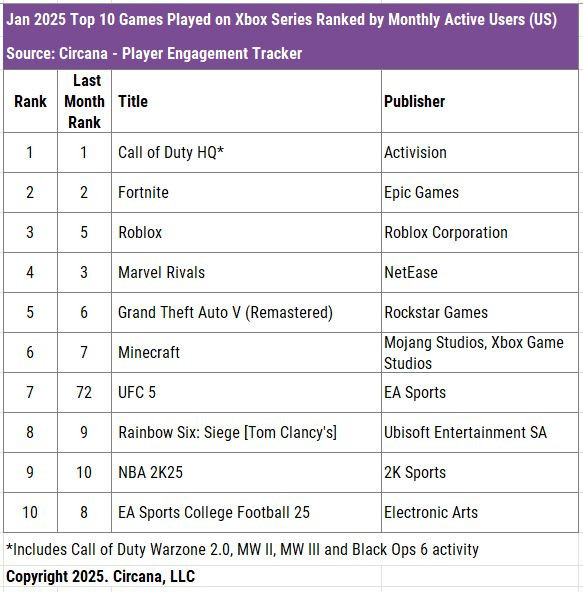
- Call of Duty: Black Ops 6 - the best-selling game of the month. It's the sales leader on PlayStation, while on Xbox the game ranks 2nd. For MAU, the situation is reversed.
- Final Fantasy VII: Rebirth showed good results on Steam. The game was released on January 23 on PC.
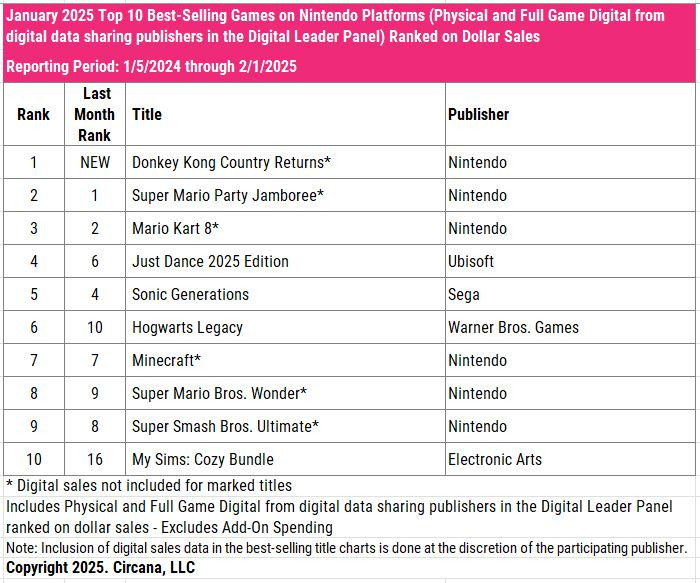
- Donkey Kong Country Returns is the only new release of the month. The game climbed to 8th place (excluding digital copies).
- Top revenue generators among mobile projects remain the same - MONOPOLY GO!, Royal Match, and ROBLOX.
Platform rankings
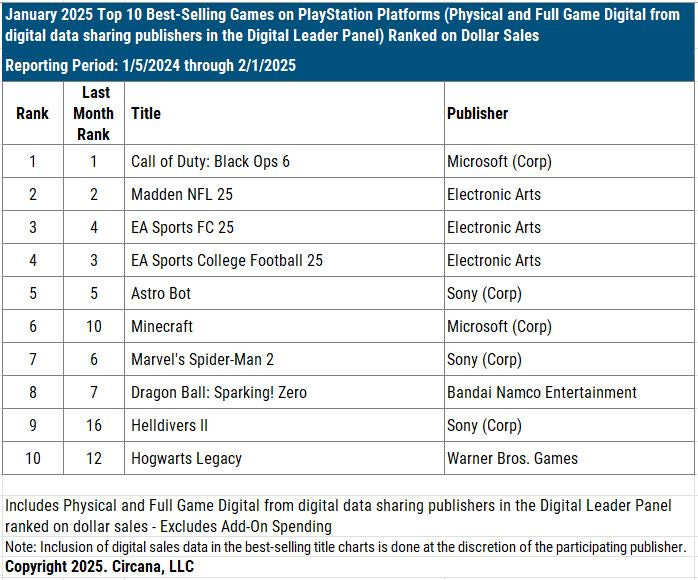
- The PlayStation sales chart is stable. Xbox is a bit more interesting - for example, The Elder Scrolls: Online made to the list.
- Looking at MAU in the US on consoles, Marvel Rivals' success is noteworthy - the game continues to successfully retain an active audience.
- In January, the top 10 sales for Nintendo Switch unusually include many other publishers. Games from Ubisoft, SEGA, Warner Bros. Games, and EA made the list.
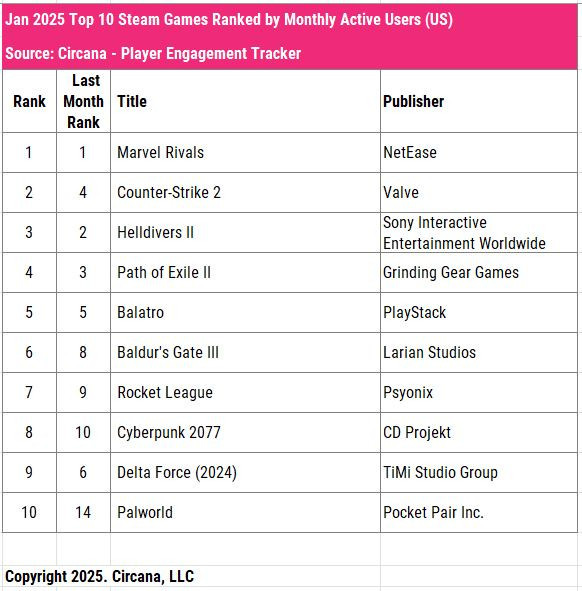
- Marvel Rivals - Steam's MAU leader in January 2024 in the US. It's surprising how different the platform audience's tastes are from console players.
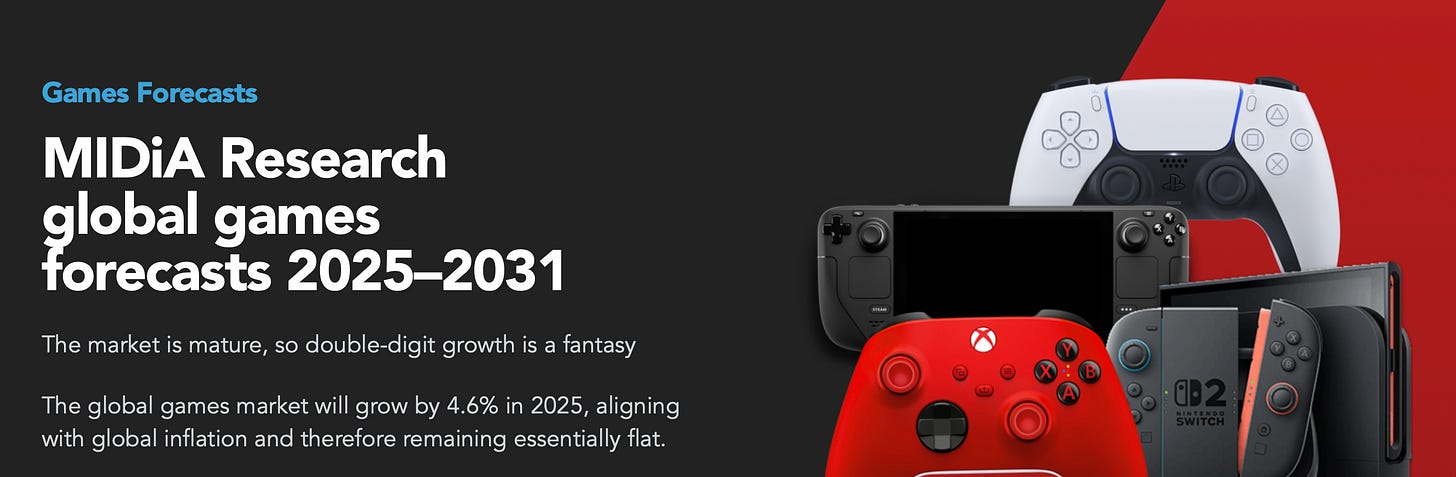
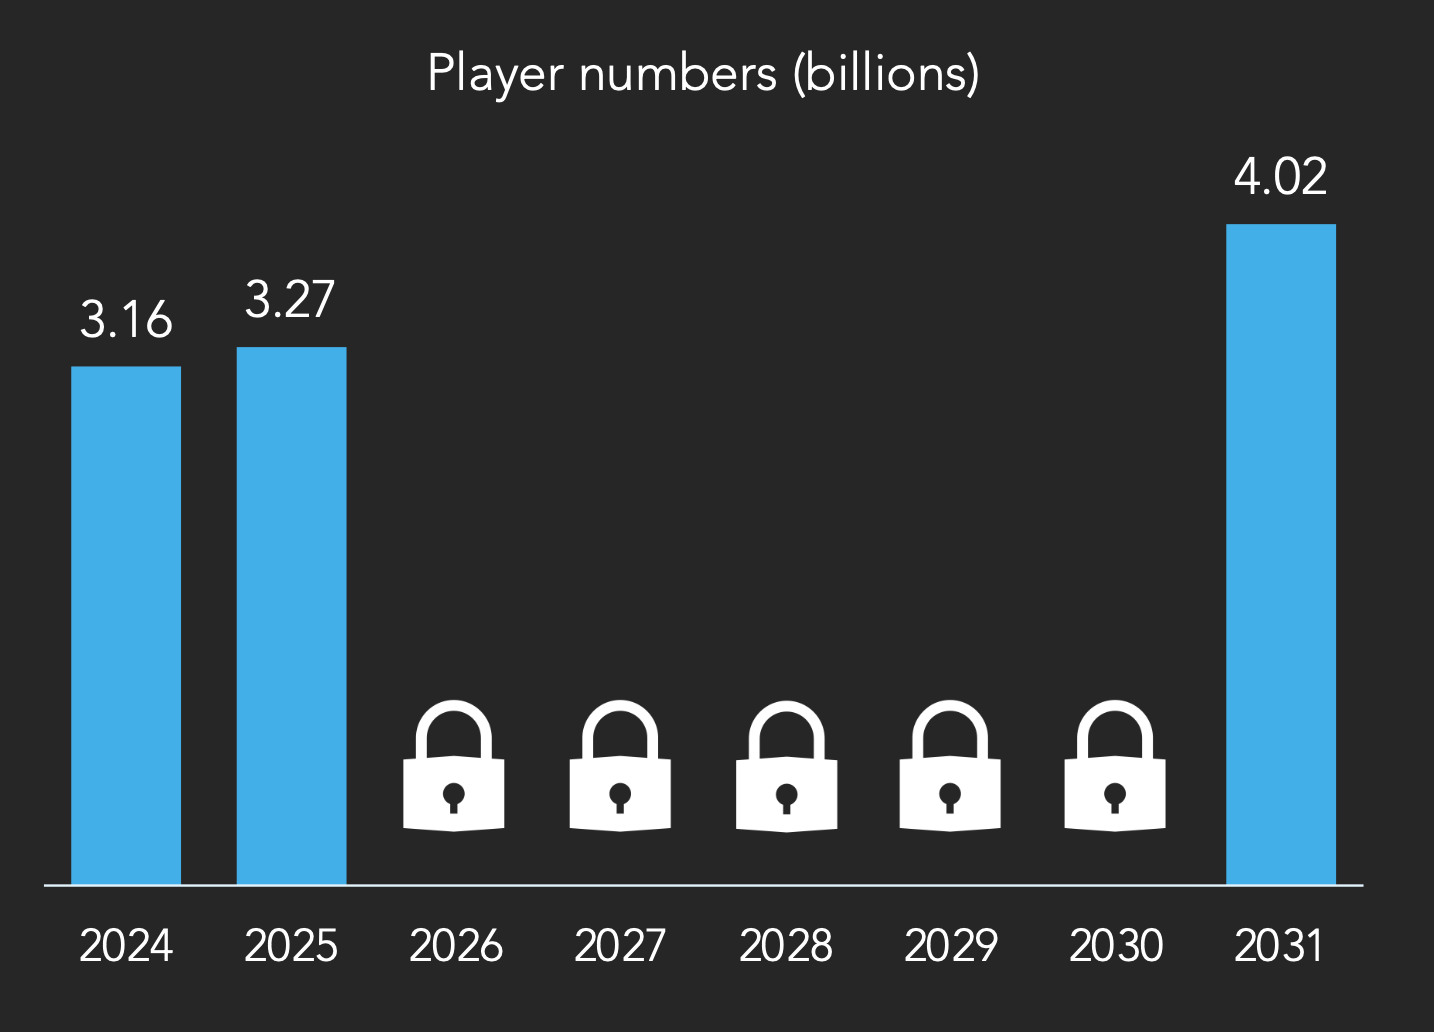
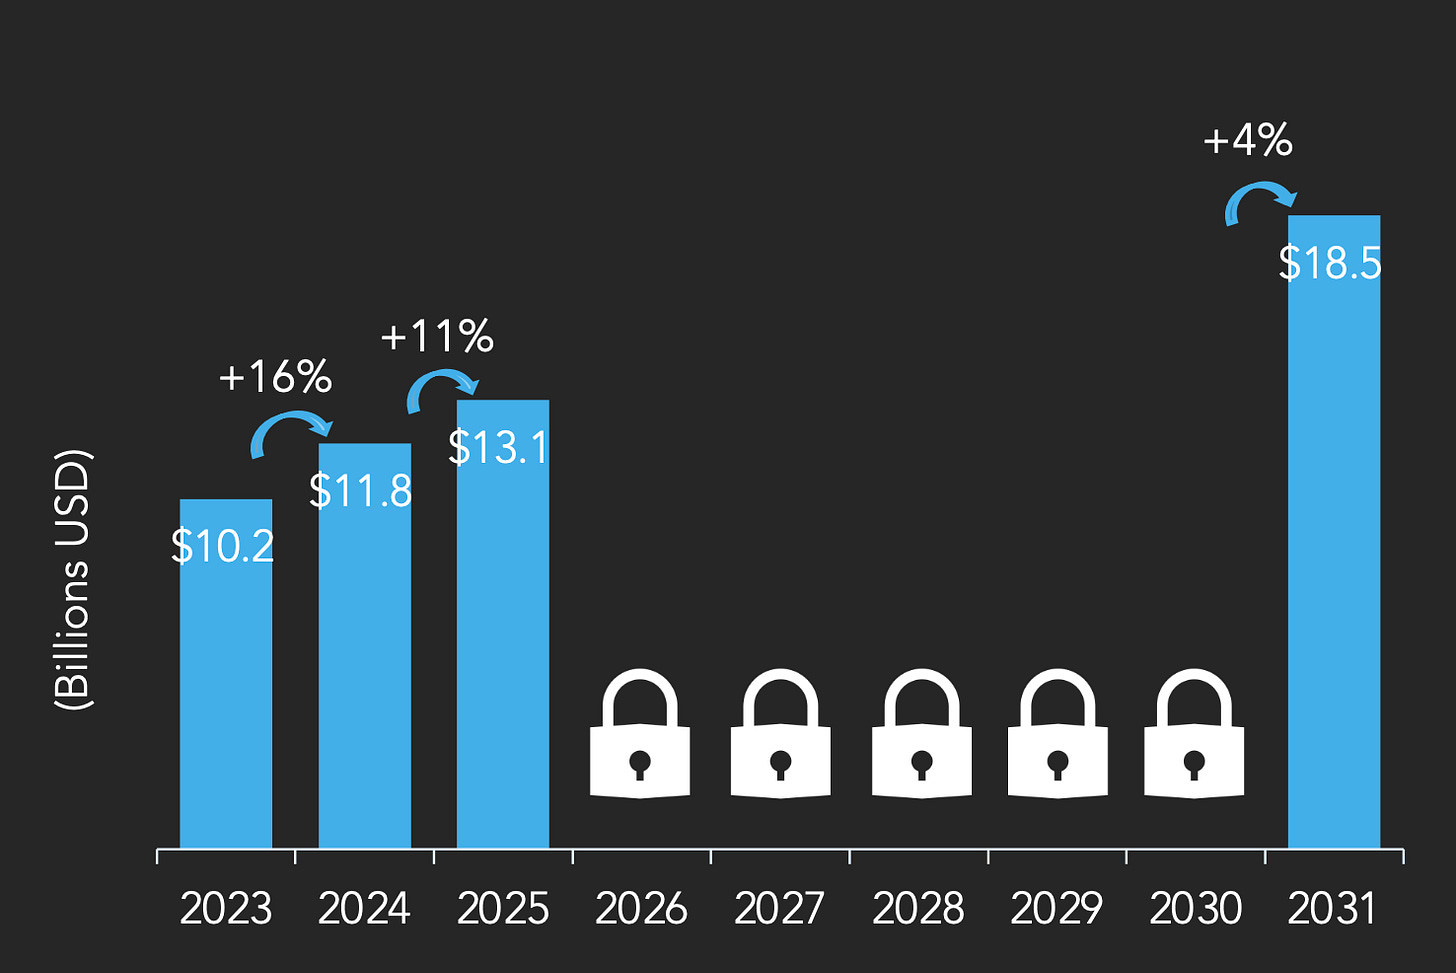
MIDiA Research: The gaming market will never return to double-digit growth rates (2025-2031 forecast)
The company's market assessment includes sales of games, gaming hardware, and in-game items. Game revenue is calculated considering commissions, taxes, and retail markups. Sales of phones, tablets, TVs, and PCs are not included. Accessory sales are also not considered. Foreign currency was converted to dollars at the average exchange rate for the reporting period. Data up to Q4'24 is historical, after that - forecast.
Overall market condition
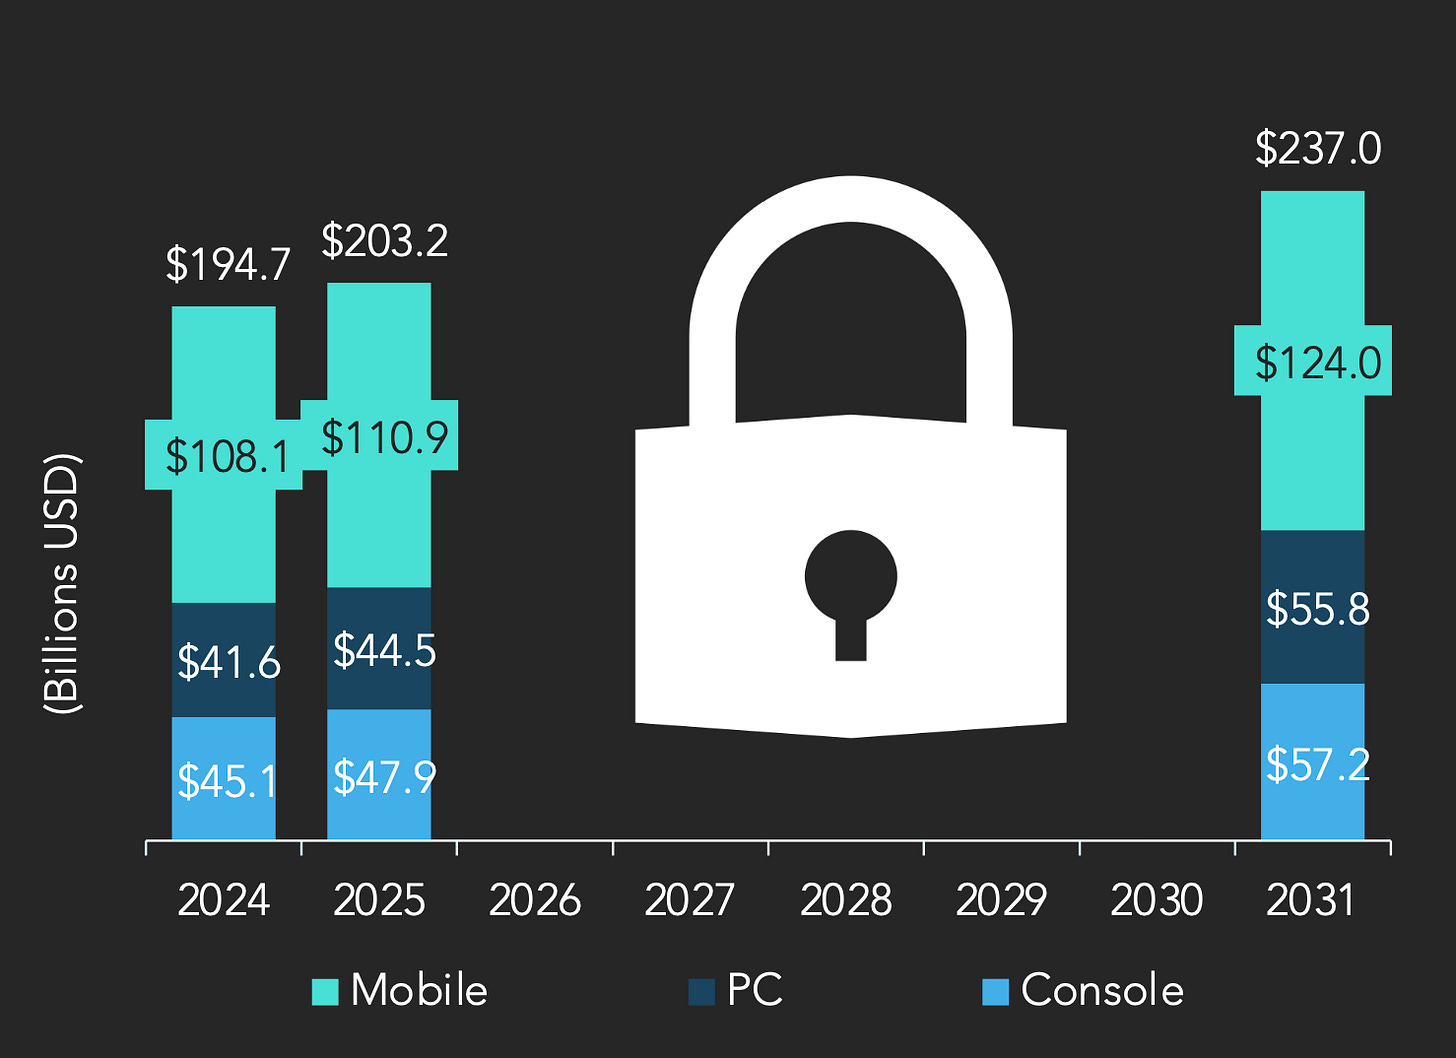
- The gaming market will reach $236.9 billion by 2031. In 2025 it will be 4.6% more than in 2024. However, adjusted for global inflation of 4.2%, the gaming market effectively remains on a plateau.
- Game revenue in 2025 will reach $203.2 billion. A big bet is placed on Grand Theft Auto 6, the launch lineup of Nintendo Switch 2, and successful launches of projects like Monster Hunter Wilds and Assassin's Creed Shadows.
- The release of Nintendo Switch 2 in 2025 should return the gaming hardware market to growth after a 19.9% decline in 2024. Growth of 8.4% is expected.
- The gaming subscription segment grew by 16% to $11.8 billion in 2024, largely due to the appearance of Call of Duty in Game Pass. Growth is expected to continue in 2025, with the segment reaching $13.1 billion.
- The company estimated the gaming advertising market at $23 billion in 2025.
❗️My subjective opinion is that the gaming advertising market is larger than estimated by MiDiA.
- In 2025, 68% of all game revenue will come from in-game purchases.
2024 Benchmarks
- ARPPU of a console user - $81.68.
- ARPPU of a premium PC game buyer - $55.47.
- The total number of players worldwide is estimated at 3.16 billion. Of these, 2.8 billion are mobile device players. In 2025, the number of players will grow to 3.27 billion.
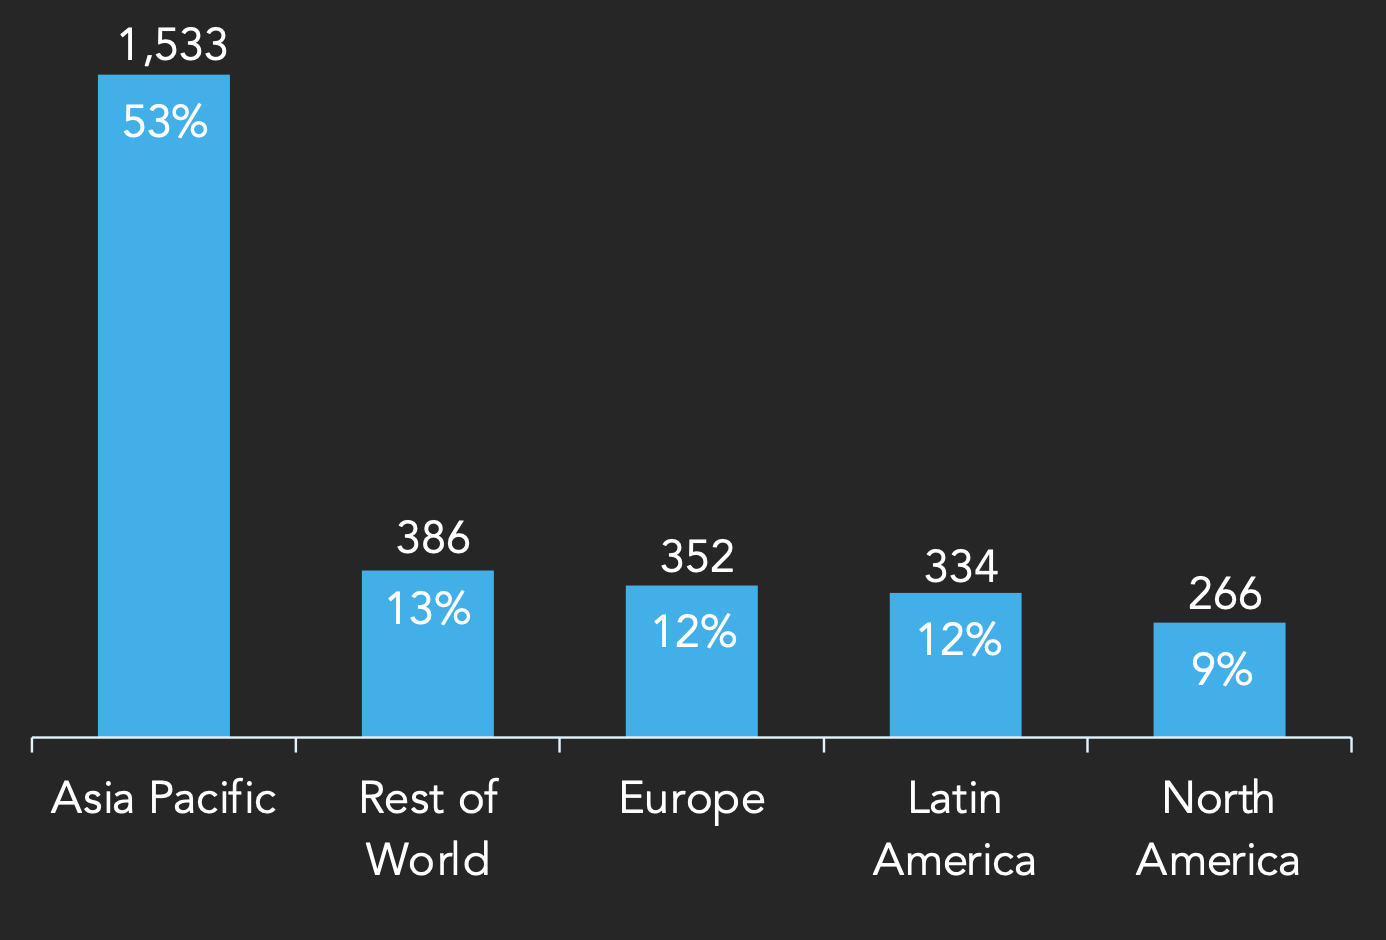
- The Asia-Pacific region accounted for 53% of the entire gaming audience in 2024.
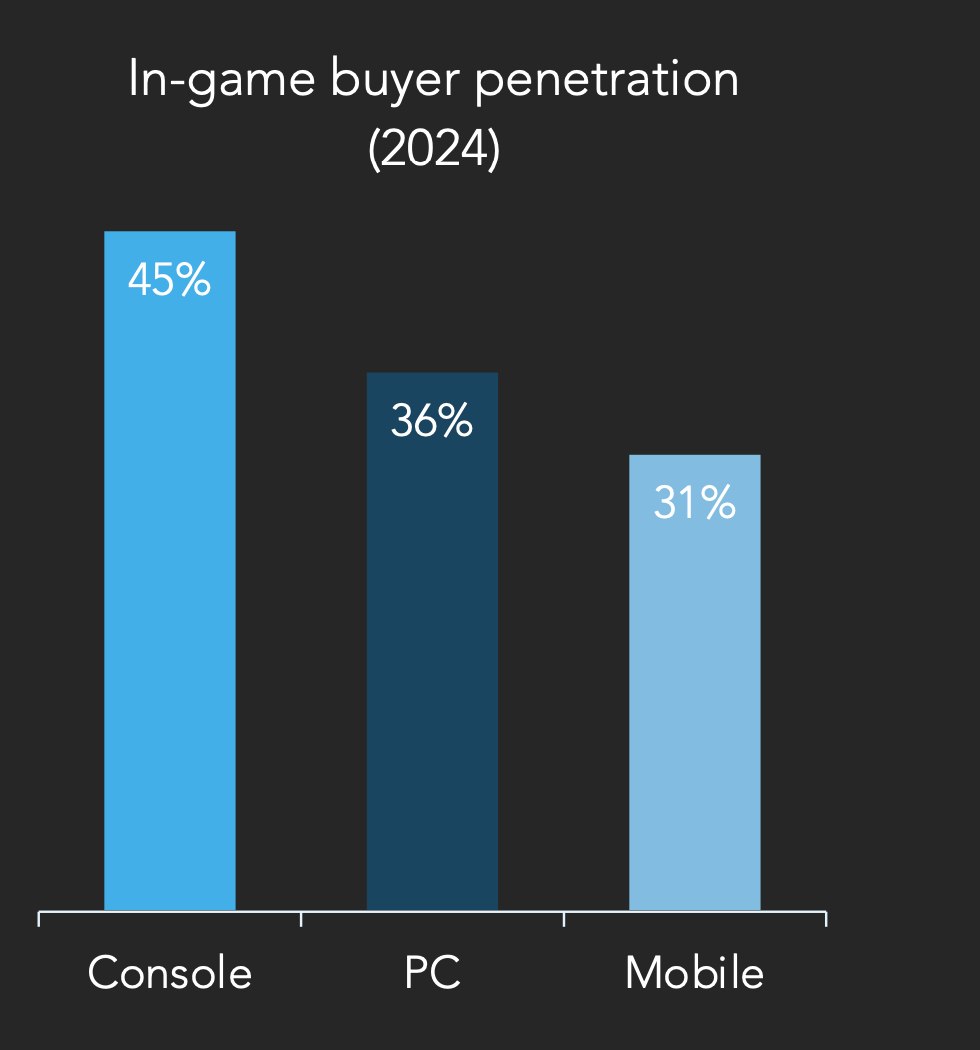
- Company analysts note that 45% of the console audience makes in-game purchases. On PC, it's 36%, and on mobile devices - 31%.
Forecast for 2031
- The market volume is expected to reach $280.1 billion by 2031.
- Game revenue by 2031 will be $237 billion.
- Revenue from the gaming console segment will be $24.6 billion by 2031.
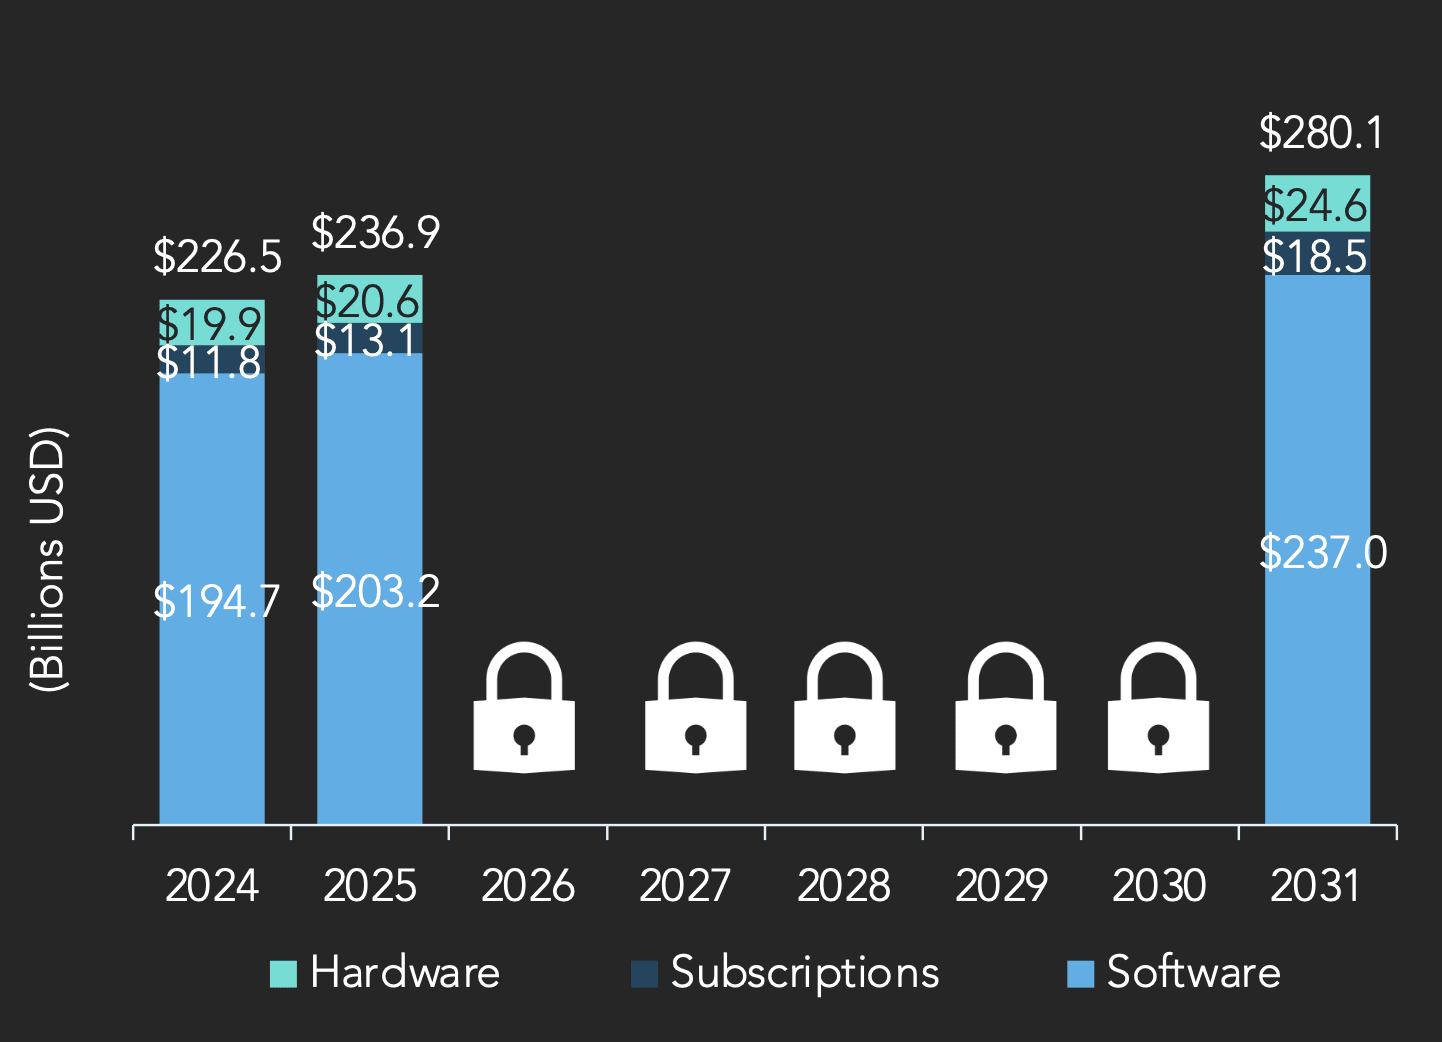
- MIDiA Research analysts predict that gaming subscriptions will account for $18.5 billion by 2031. They note that most of the growth will be due to price increases rather than audience growth.
- By 2031, the share of in-game purchases in the overall structure of game revenue will be 67%.
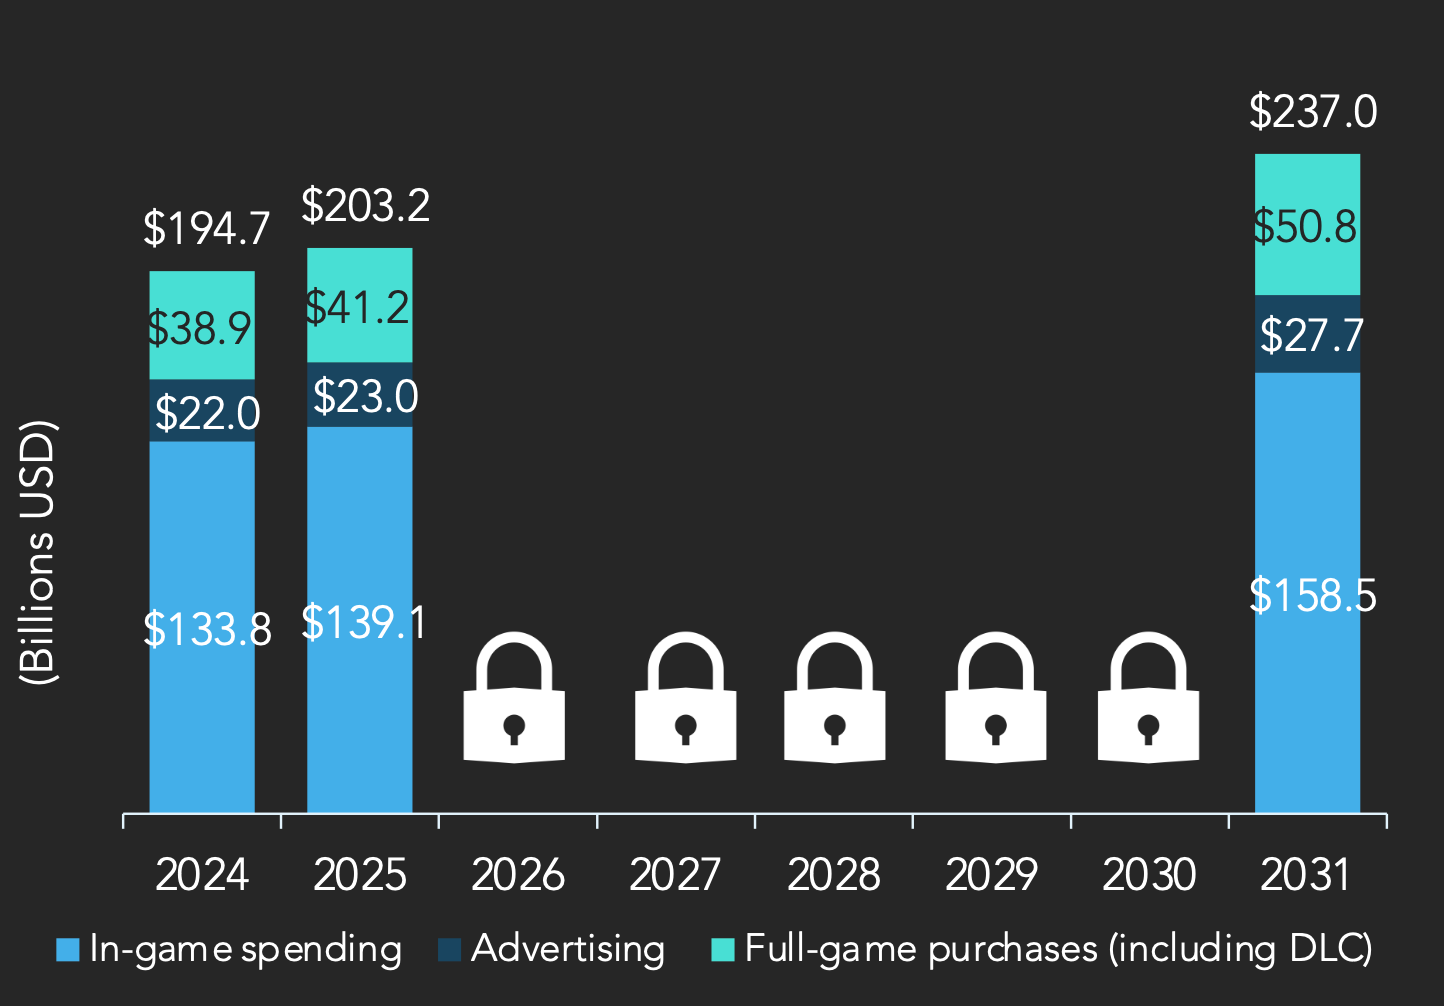
- By 2031, the gaming advertising market will reach $27.7 billion, according to the company's estimates.
- By 2031, the number of players worldwide will reach 4.02 billion.
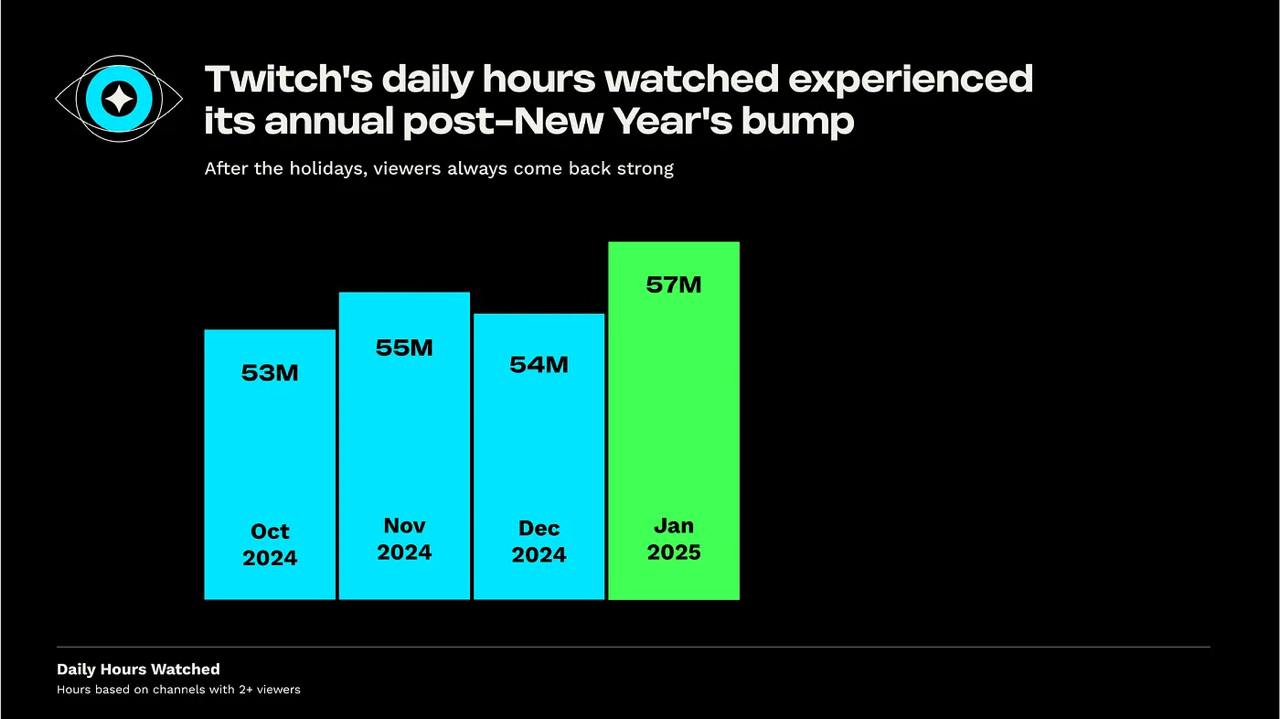
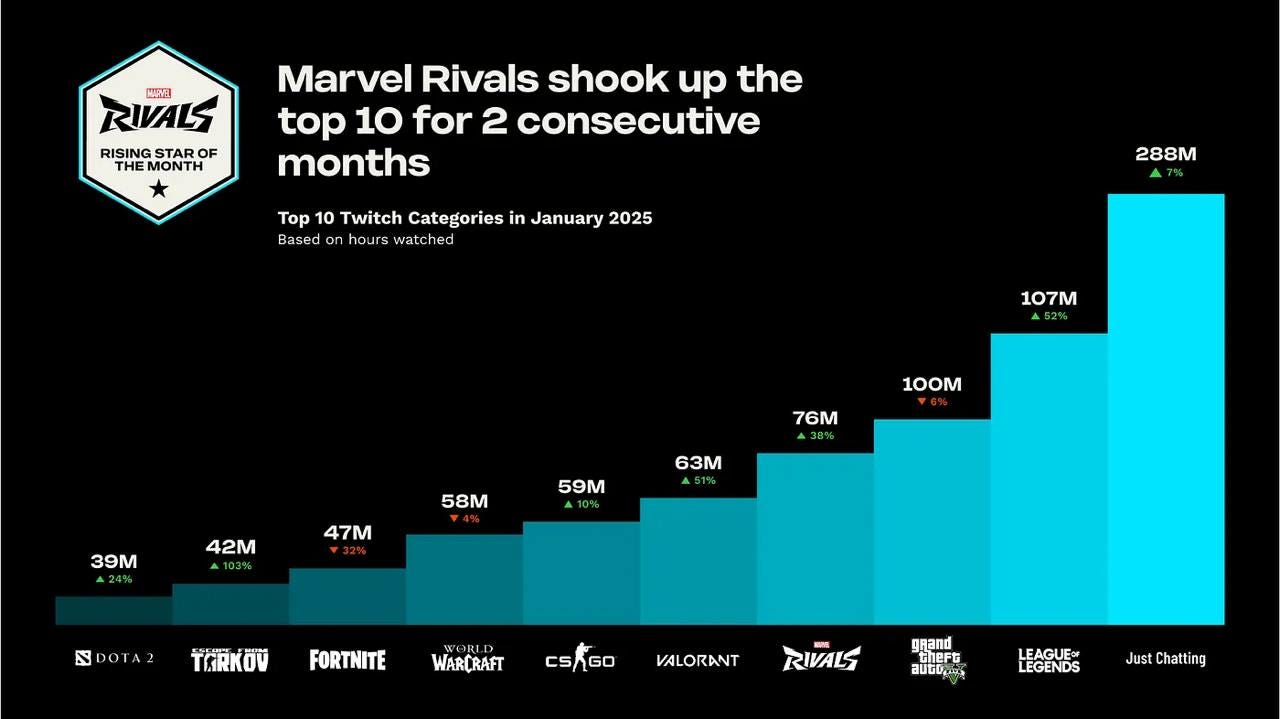
StreamElements & Rainmaker.gg: Streaming Market in January'25
- Twitch accumulated 1.776 billion hours of viewership in January 2025. The platform continued its strong performance from Q4 2024.
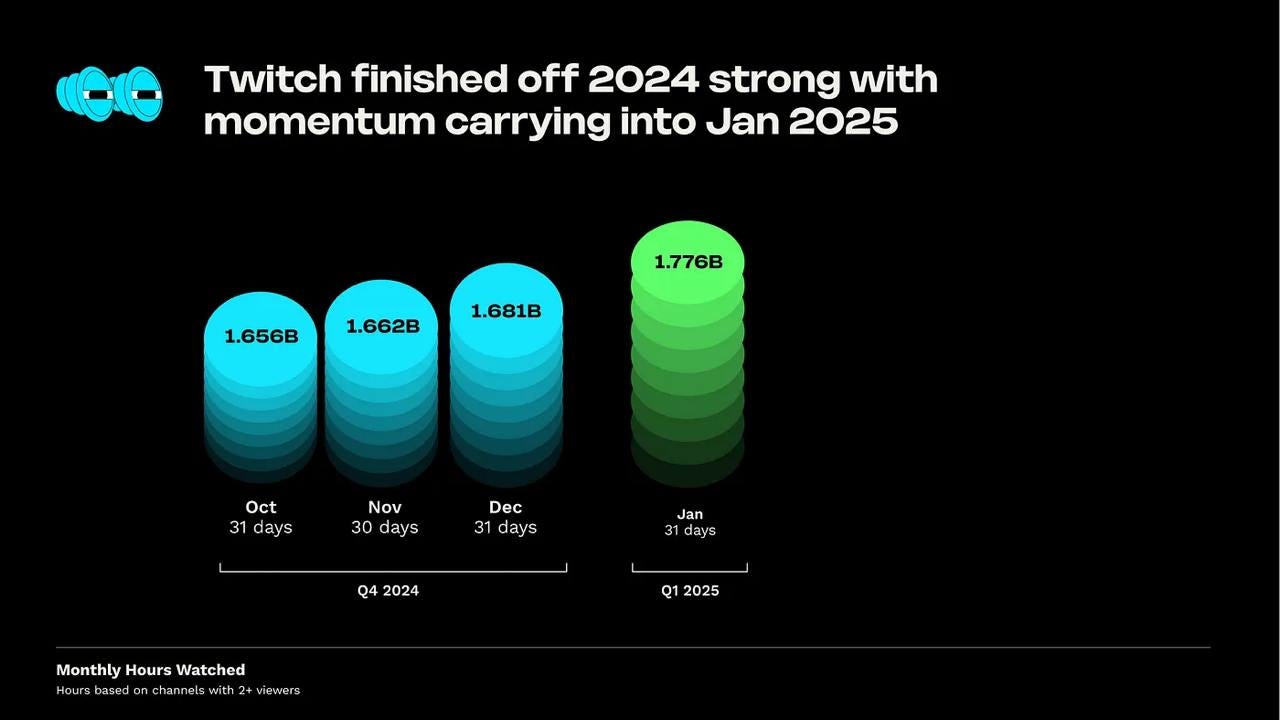
- The daily viewership in January reached 57 million hours - higher than any month in Q4'24. However, analysts note that this is a normal situation for Twitch - January is traditionally a good month for the platform.
- Marvel Rivals is performing great in the charts. The game has been in the top 10 for the second consecutive month, ranking third in January (76 million hours watched). League of Legends is in first place (107 million hours), while Grand Theft Auto V is in second place (100 million hours).
GDC: The State of the Game Industry in 2025

Survey participants
- The majority of developers are between 25 and 34 years old (36%) and between 35 and 44 years old (33%).
- 69% do not identify as part of the LGBTQ+ community. 24% identify. 7% preferred not to answer the question.
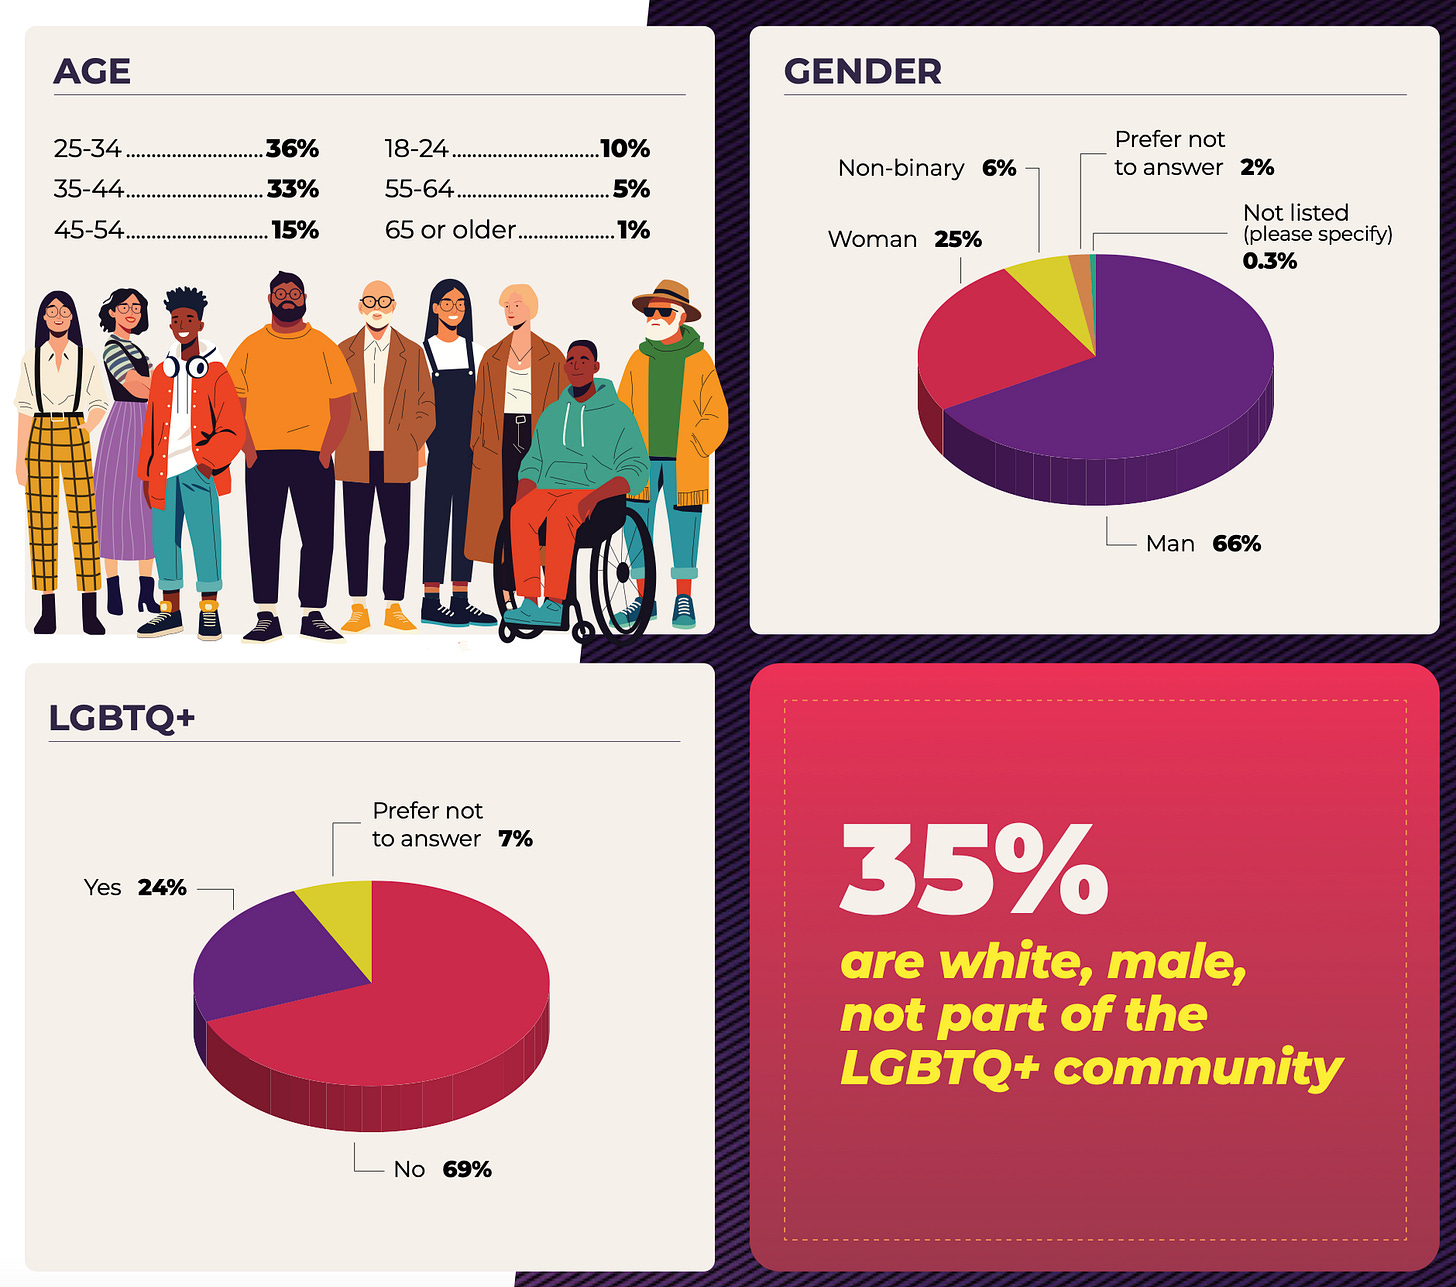
- 66% are men, 25% are women, 6% are non-binary persons. The rest preferred not to answer.
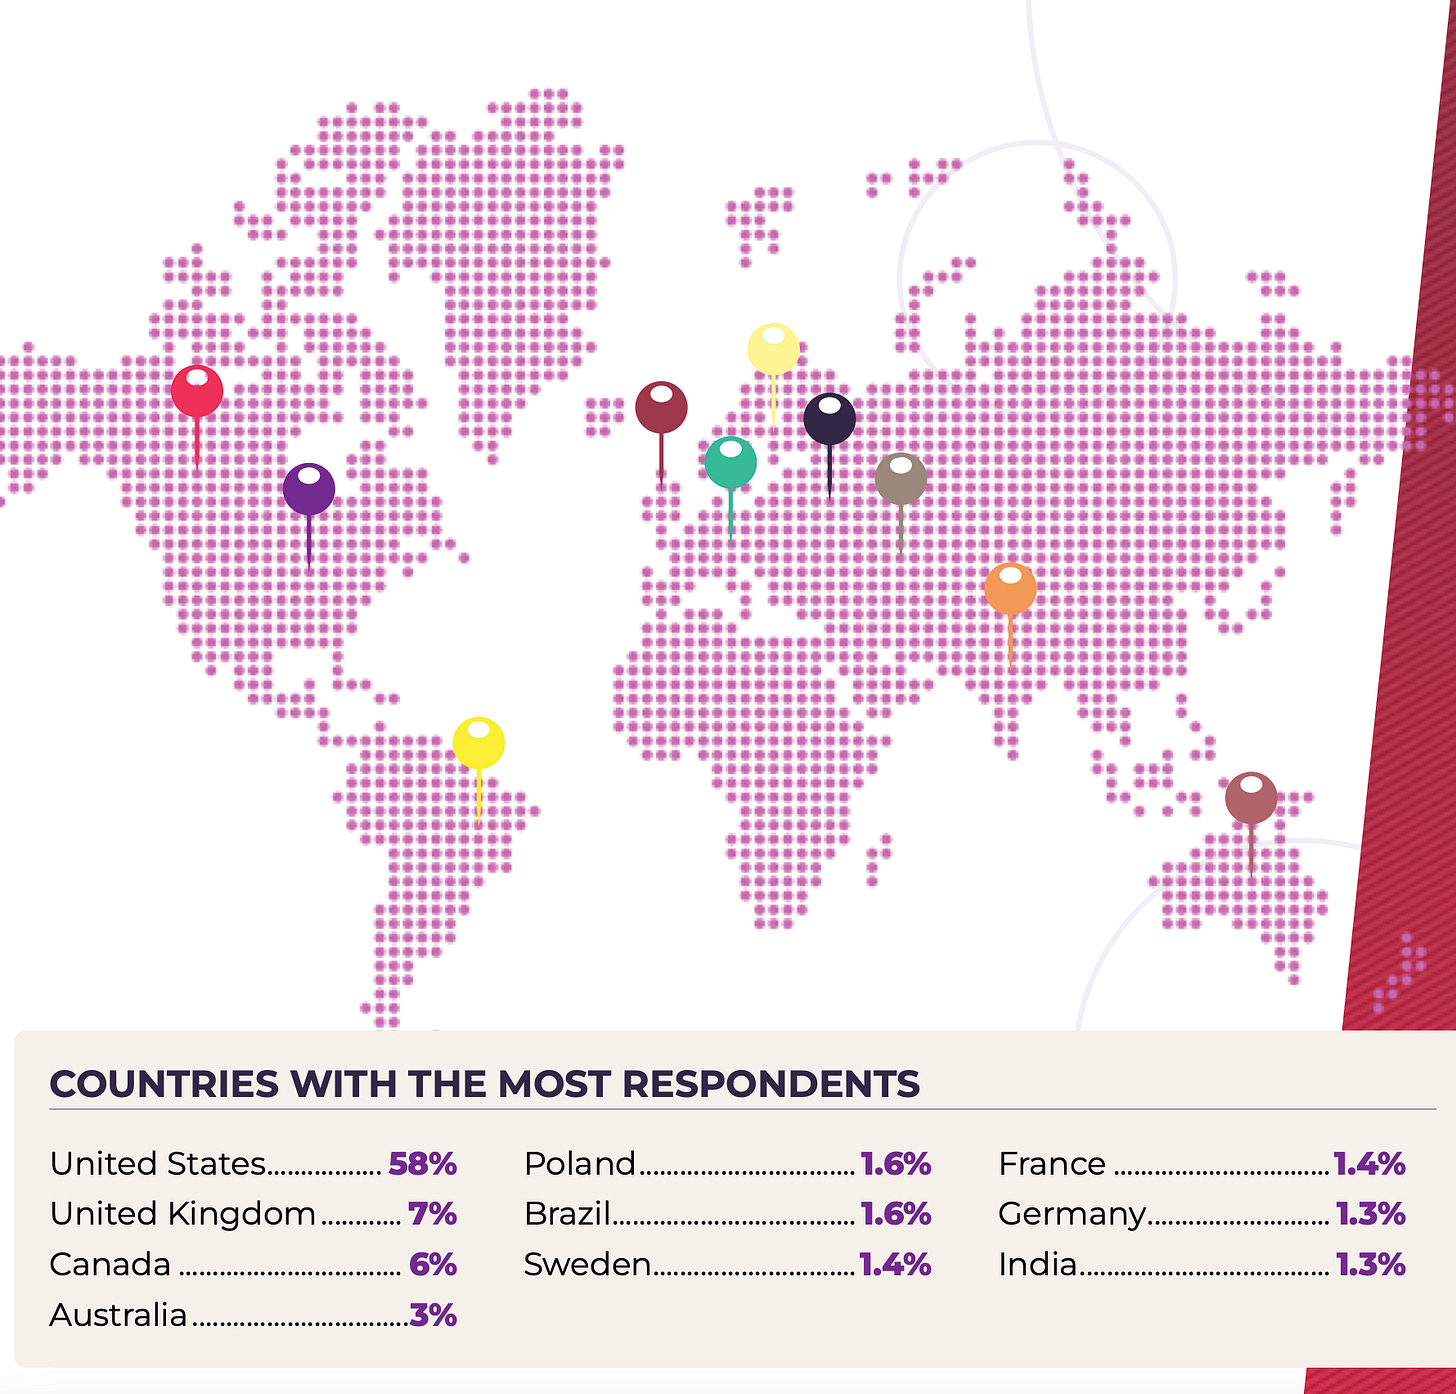
- Most survey participants are from the USA (58%), UK (7%), and Canada (6%). The report authors note that the survey may only representatively show what's happening in the Western game industry.
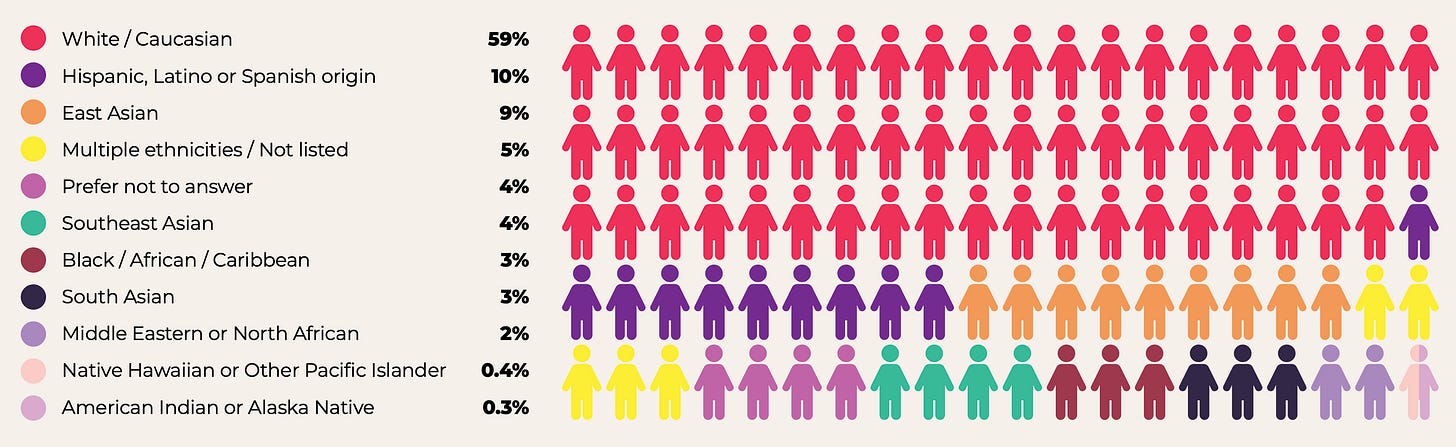
- The largest ethnic groups are White / Caucasian (59%), Asian (16%), and Latino/Hispanic (10%).
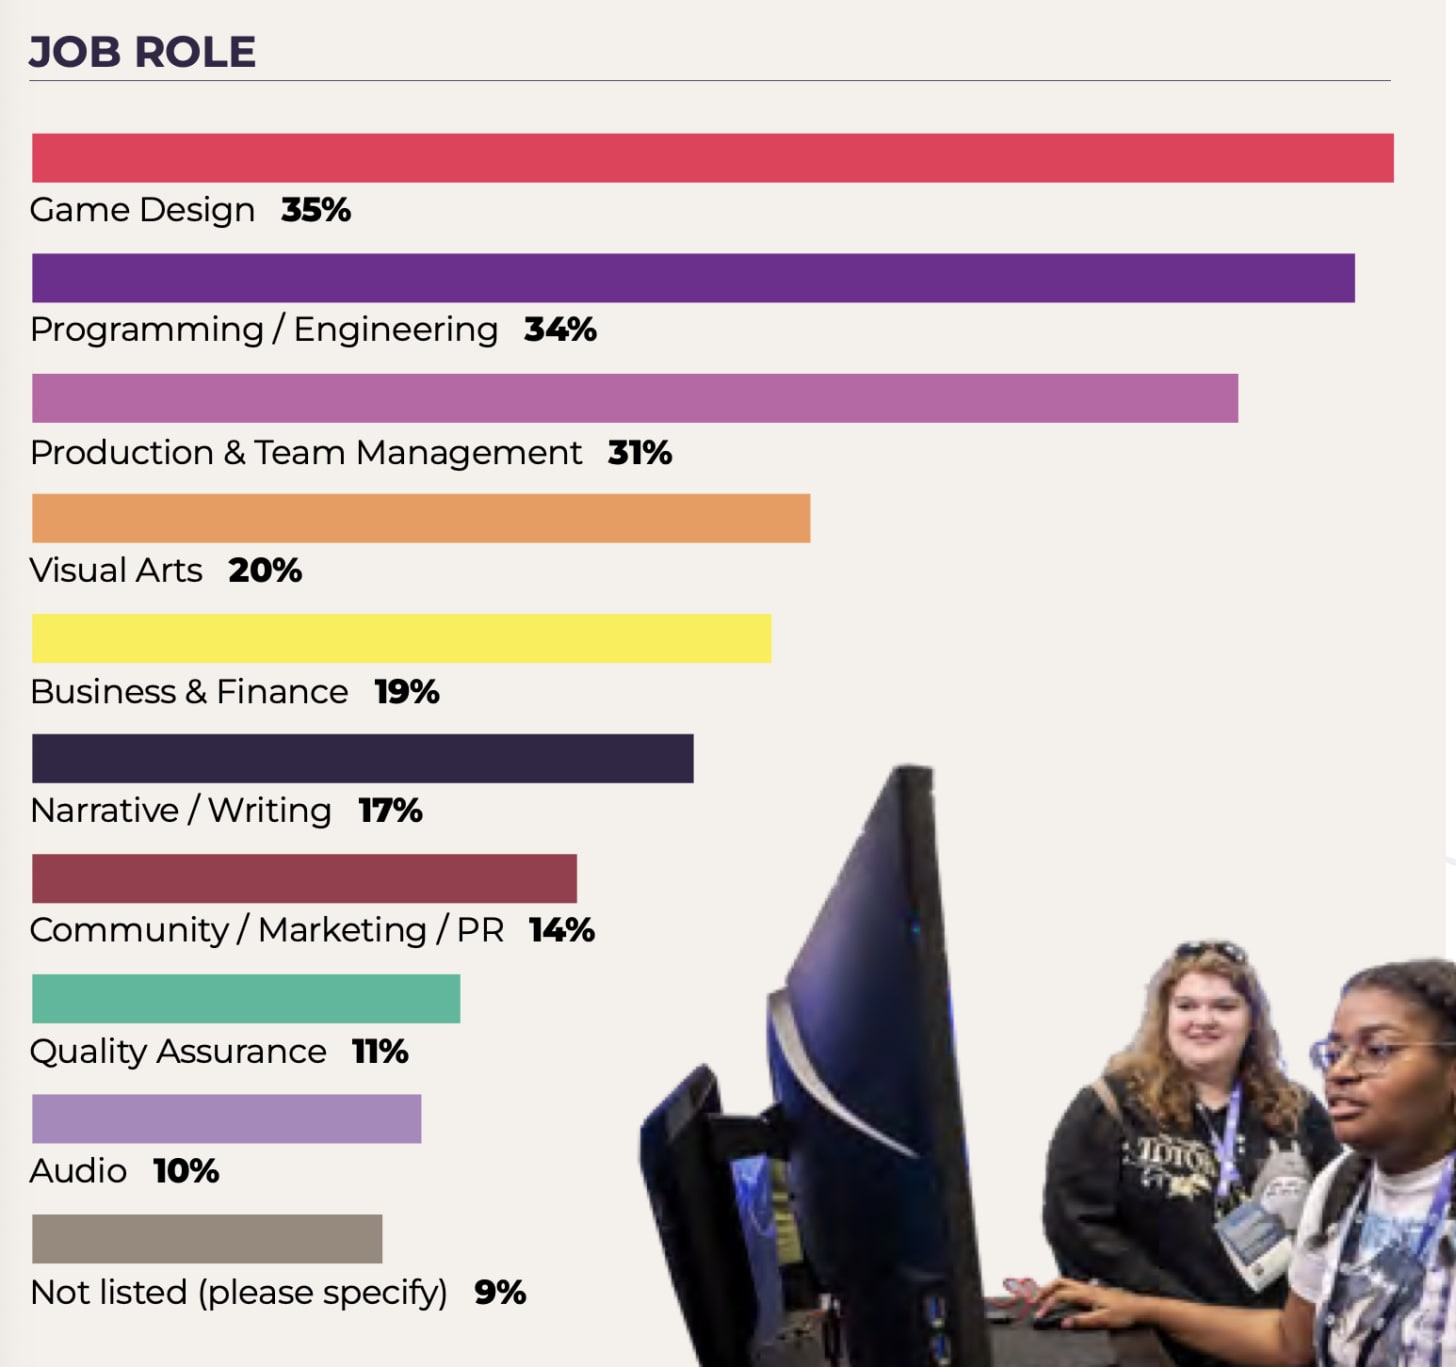
- Most respondents are game designers (35%), programmers (34%), and production or team managers (31%).
- Most respondents have been in the industry for 3-5 years (24%), 6-10 years (22%), and over 15 years (22%). The study authors note that 60% of developers have been in the industry for less than 10 years - an increase compared to previous years.
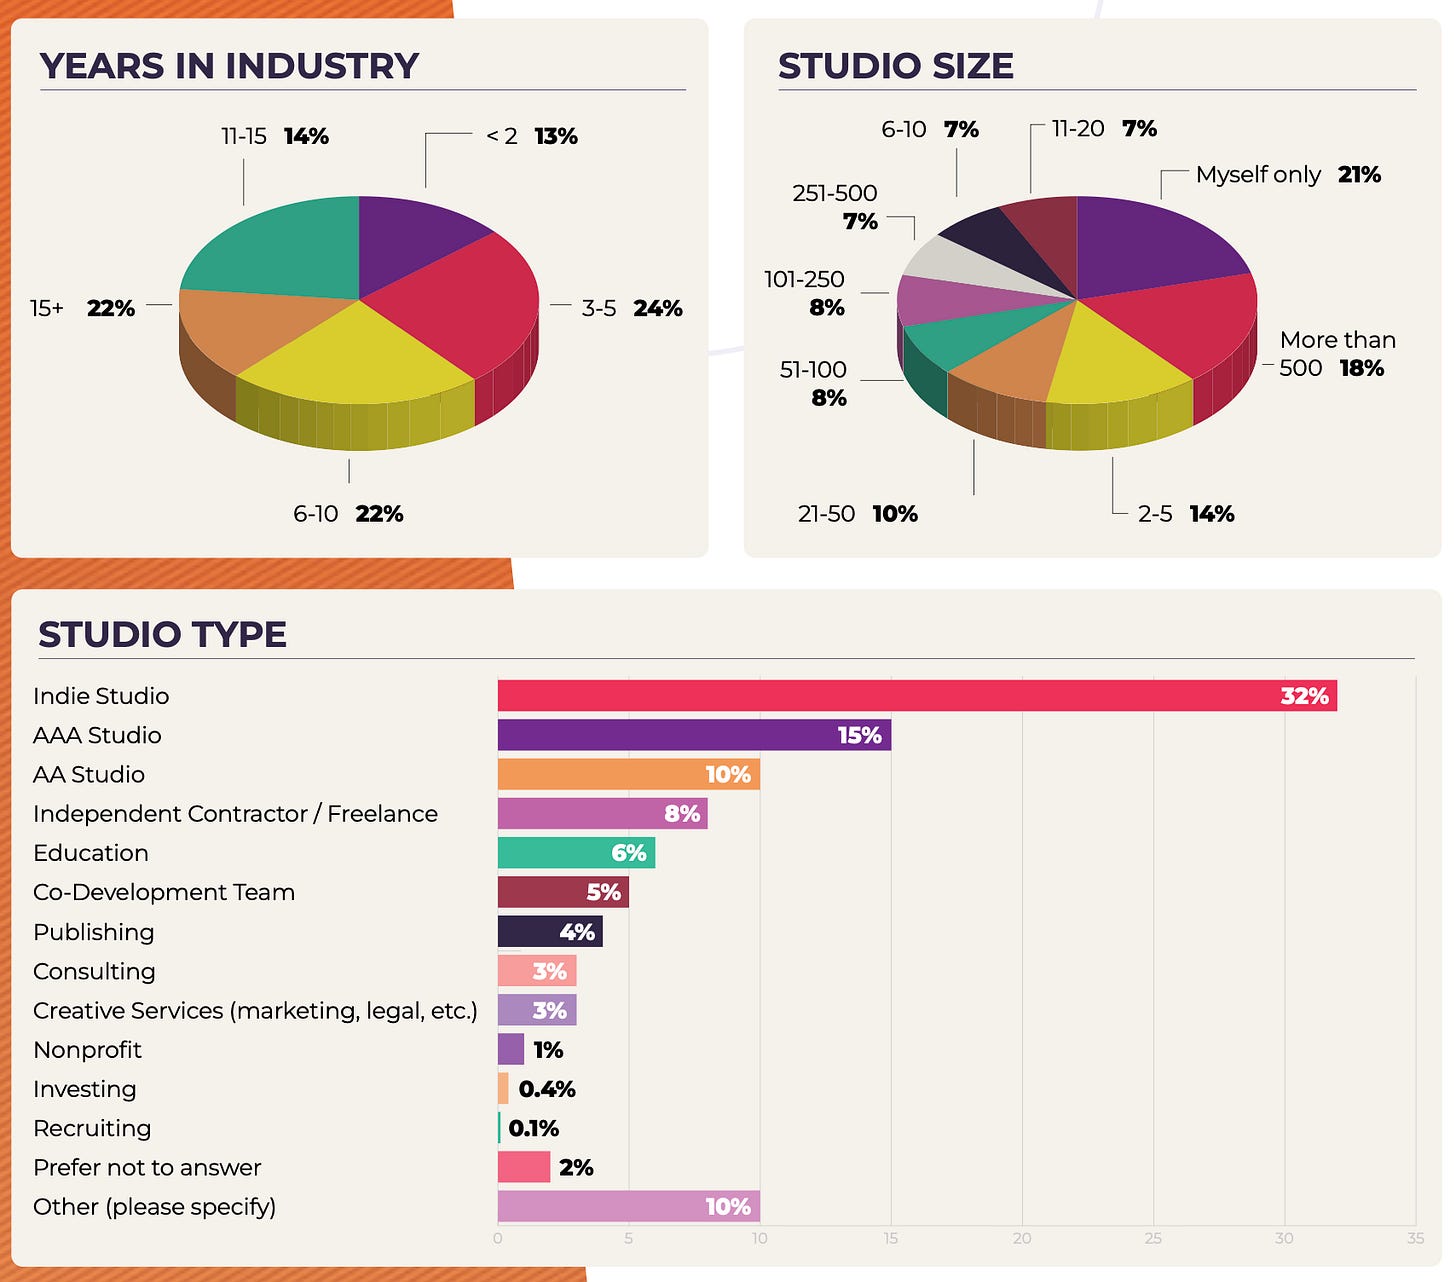
- Interestingly, the audience distribution by studio size shows that 21% of respondents work solo, while 18% work in studios with over 500 people. The number of people working in AAA companies has decreased.
Layoffs in the Industry
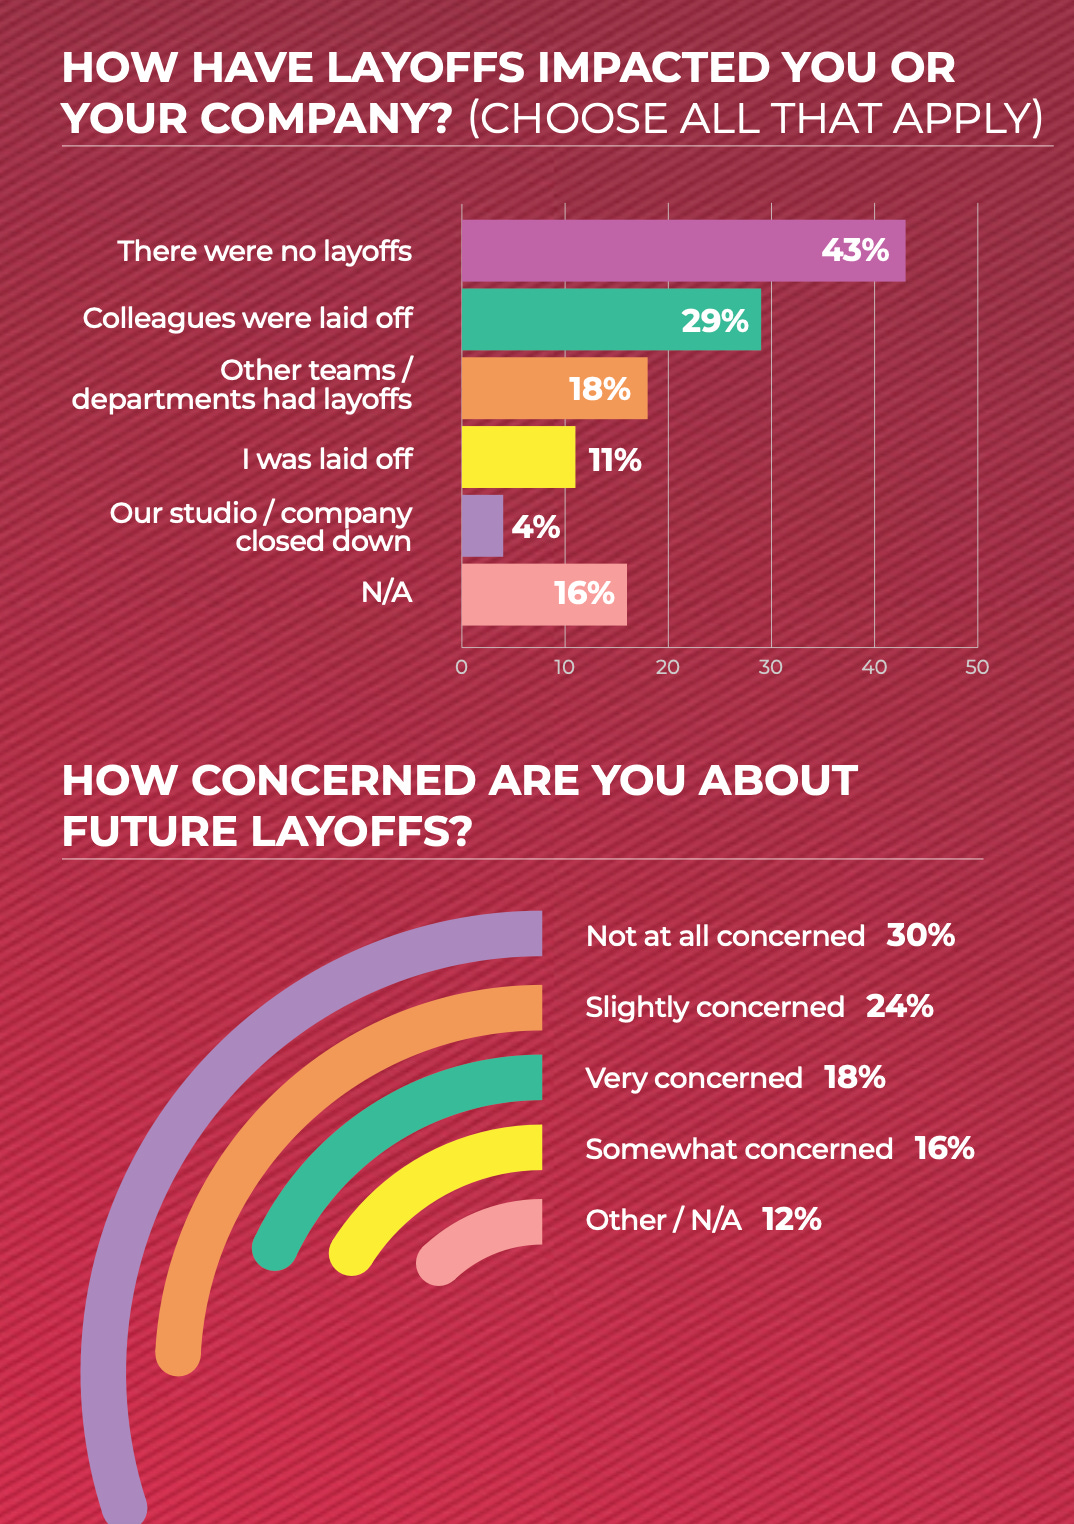
- 43% of respondents said there were no layoffs in their companies. In last year's survey, this figure was 53%.
- 4% said their company closed. 11% were laid off. 18% said layoffs occurred in other departments or teams of the company. And 29% noted that layoffs affected their direct colleagues.
-
Only 30% of respondents are not worried about layoffs. However, it's important to note that a large number of people chose to skip this question as they had already been affected by layoffs.
-
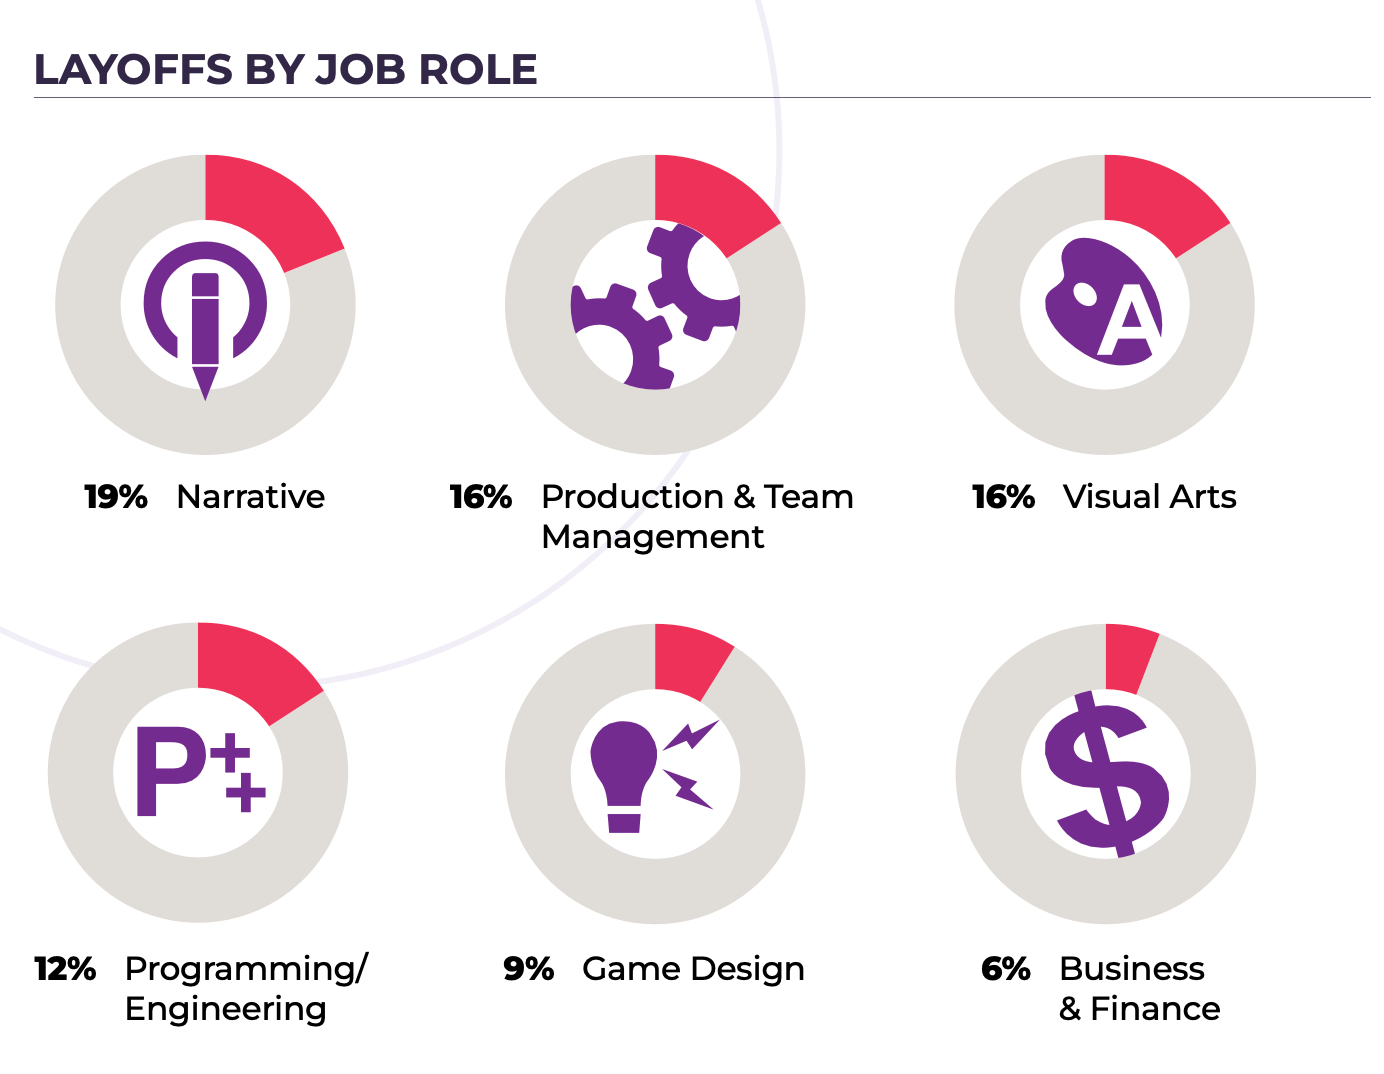
Narrative professions (19%), managerial positions (16%), and artists (16%) were most affected by cuts. Business and finance specialists were least affected.
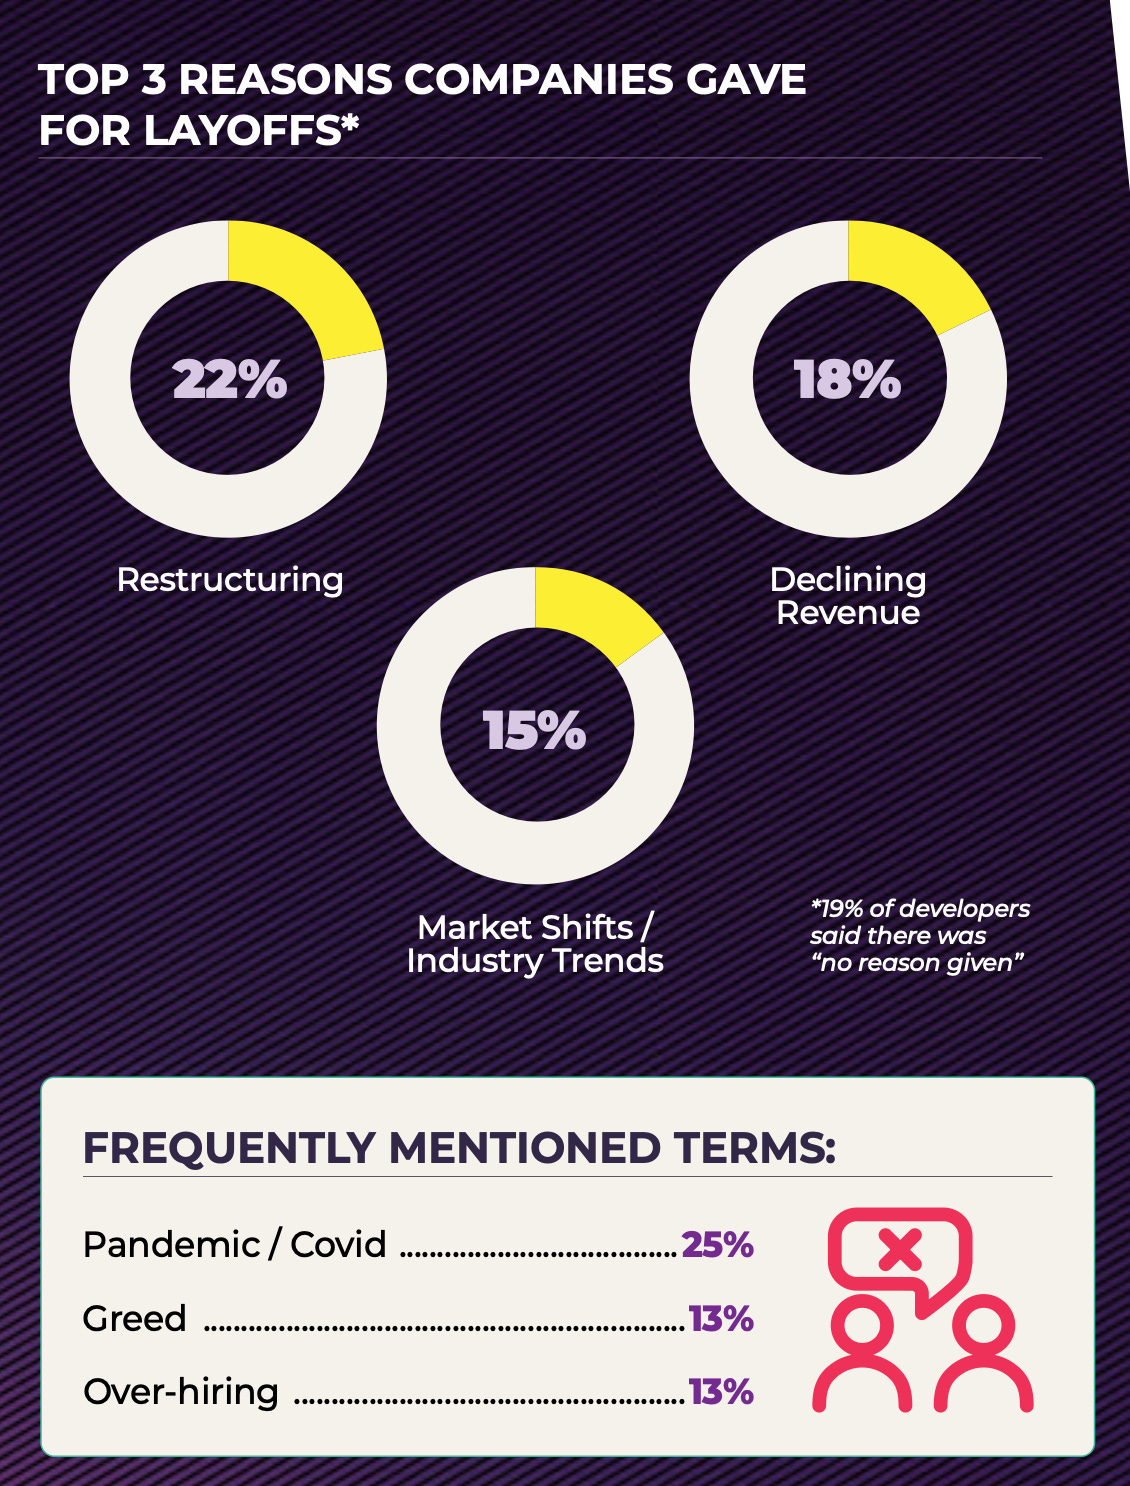
- Restructuring (22%), revenue decline (18%), and market changes (15%) are the main reasons given for employee layoffs. 19% of those who lost their jobs said they were not informed of the reasons for the decision.
Attitude towards generative AI
- 52% of respondents note that they use AI tools. 27% say they don't use them and don't plan to. Surprisingly, older employees use AI more often than their younger colleagues.
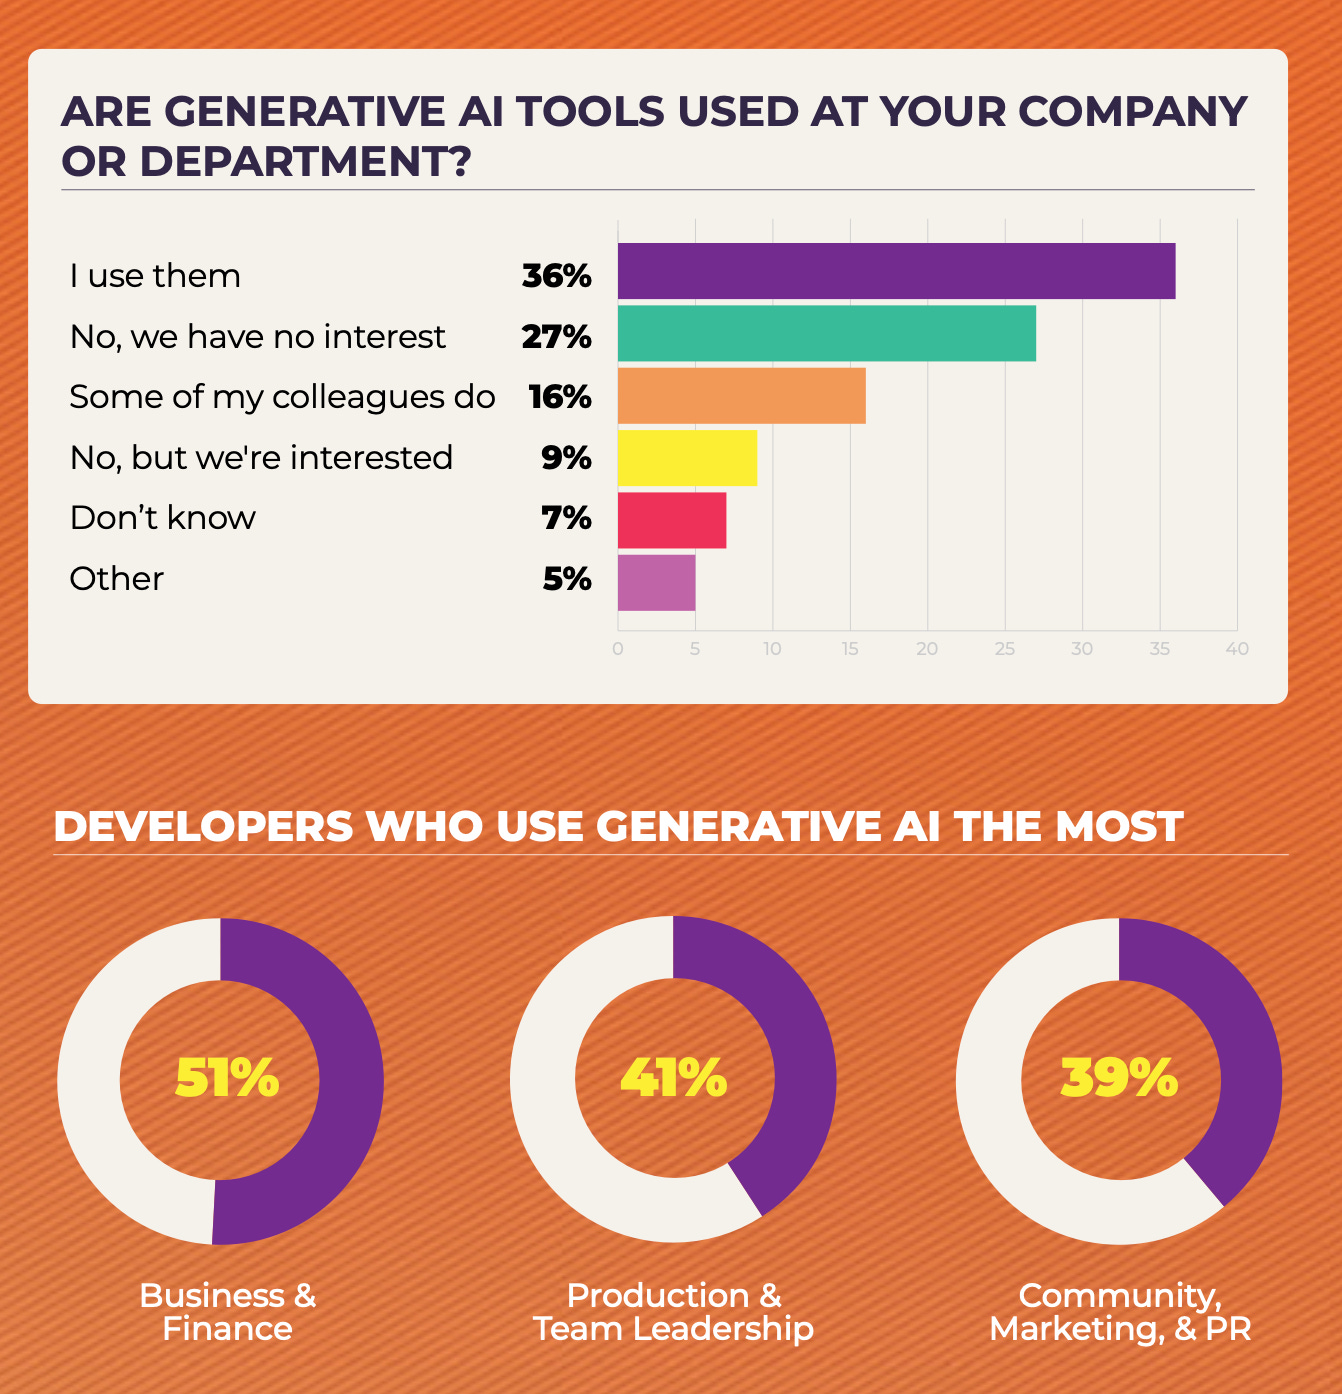
- AI is most often used in business processes and finance (51%), team management (41%), and communications, marketing, and PR (39%).
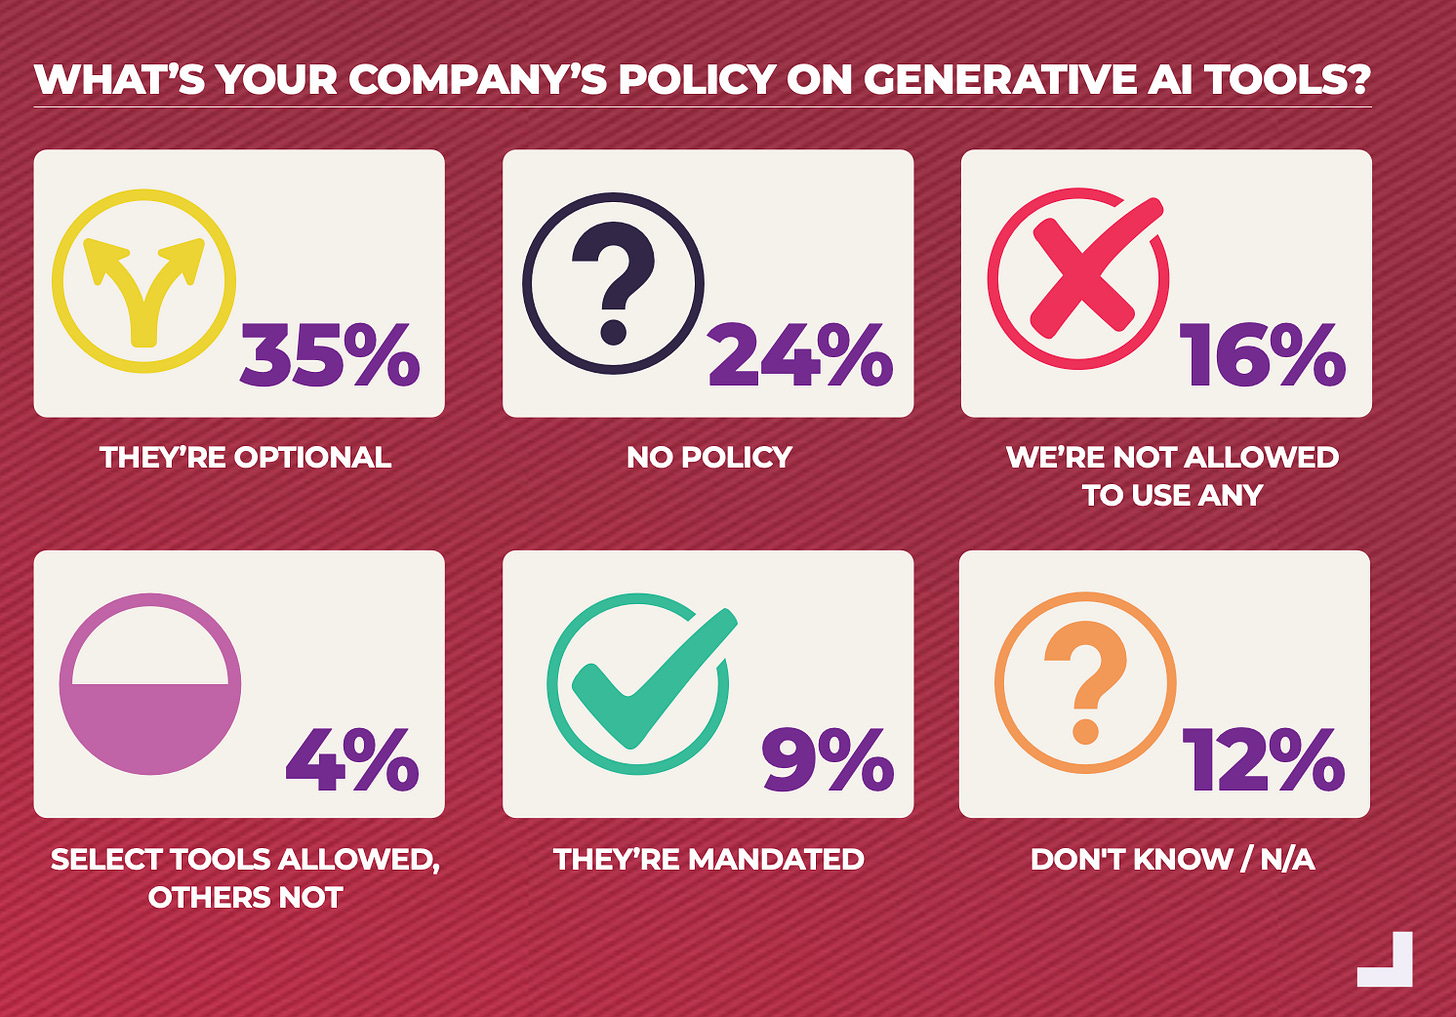
- 51% of companies in the market have some policy on working with AI. In AAA studios, this figure is 78%.
- The number of employees who noted that they need to use AI for work has doubled over the past year. But it's still only 4%.
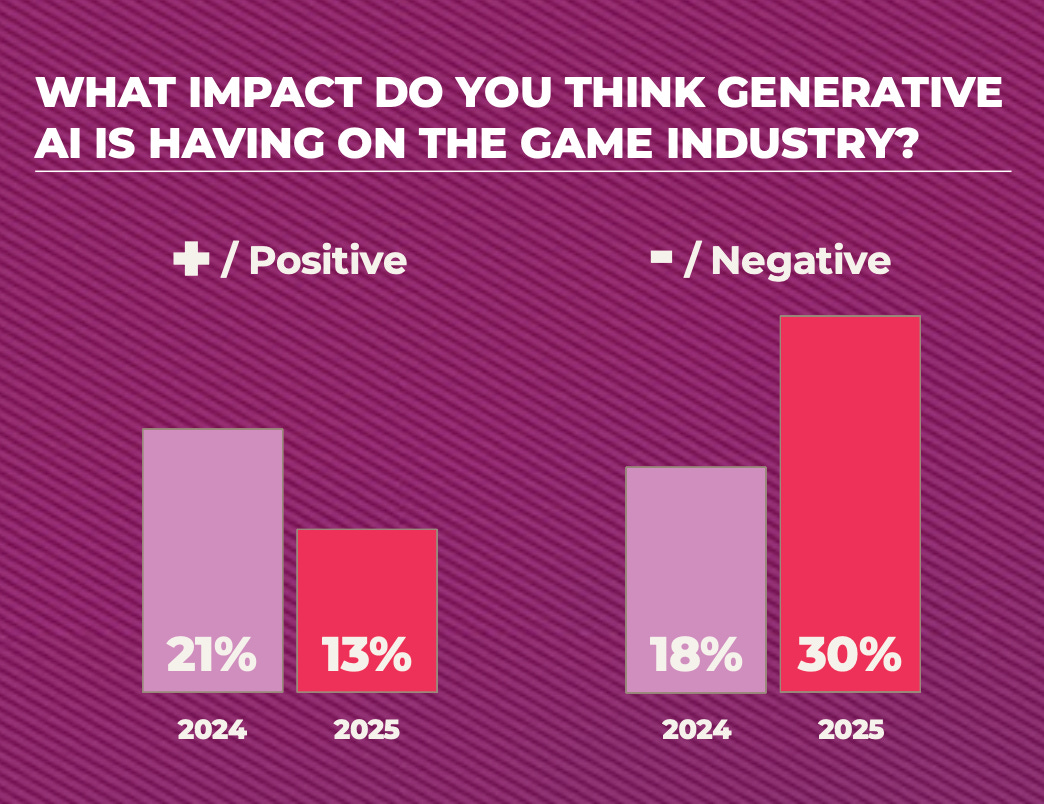
- Opinion on generative AI has significantly worsened over the past year. 13% believe AI will bring positive changes (vs. 21% last year). 30% are confident that changes due to AI will be negative (vs. 18% last year).
❗️It seems to me that the negativity about AI is caused not so much by the technology itself, but by the time in which the technology appeared. People associate industry problems with AI, although there are many more reasons for layoffs.
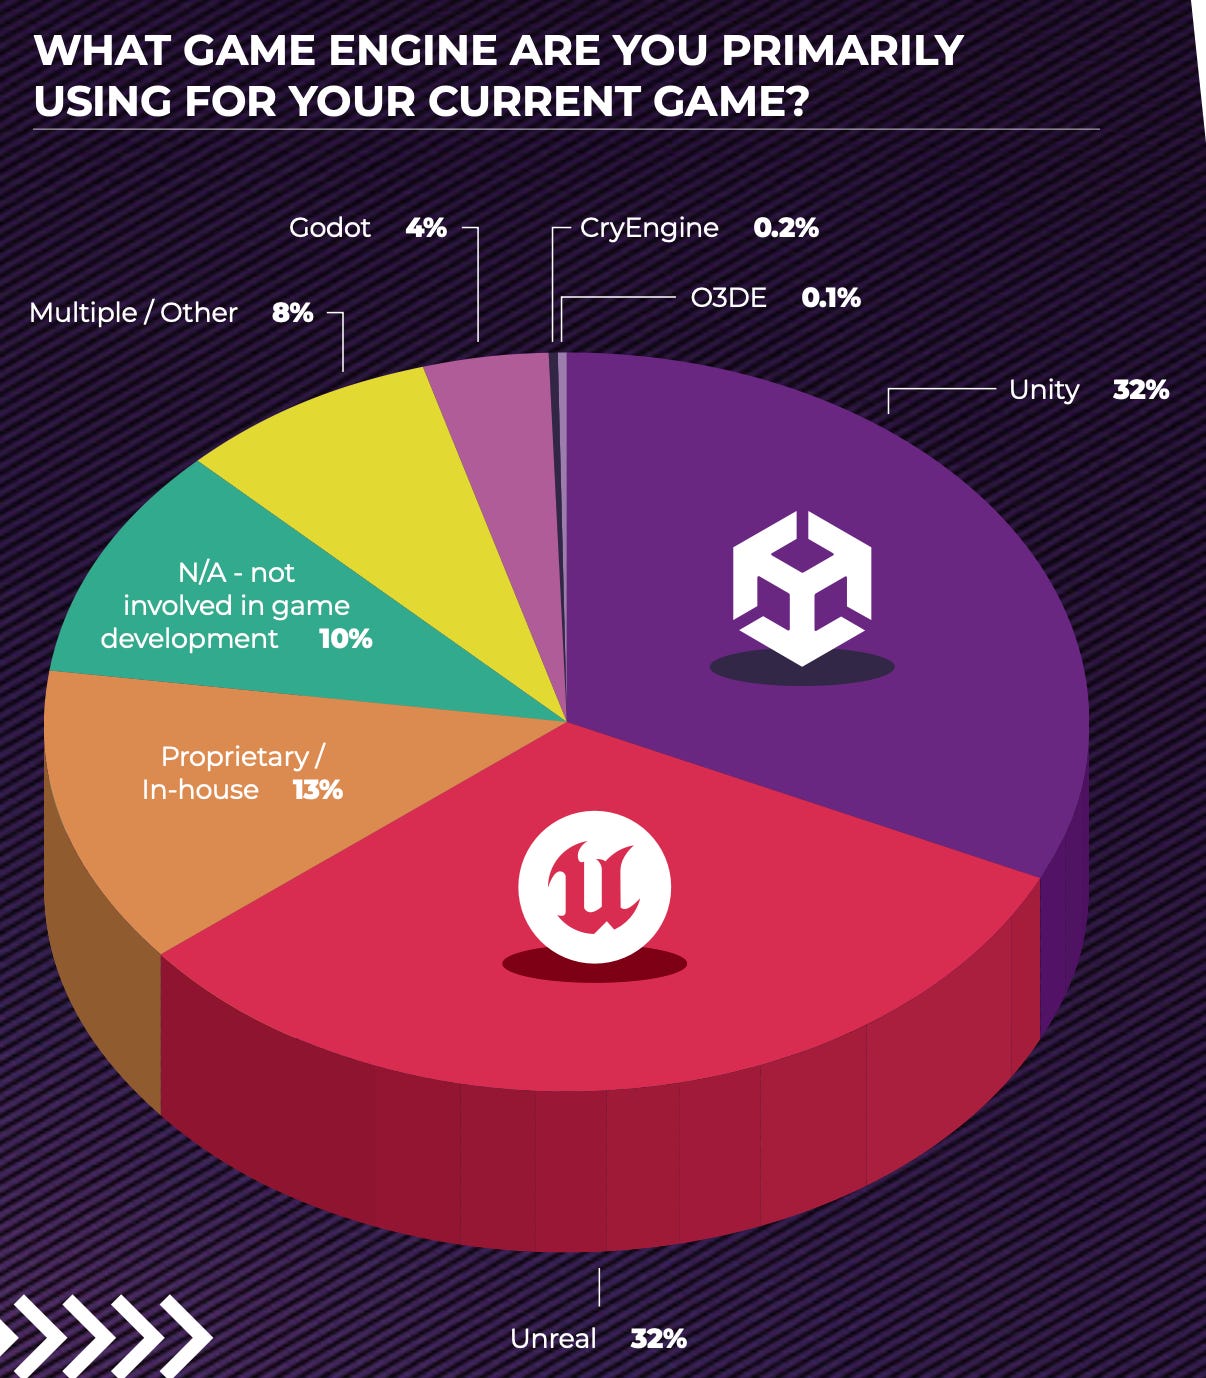
Engines and Platforms
- 80% of developers make games for PC - the most popular platform recently. Last year, 66% of developers said they make games for PC. The popularity of UGC platforms remains low (only 3% work in this direction).
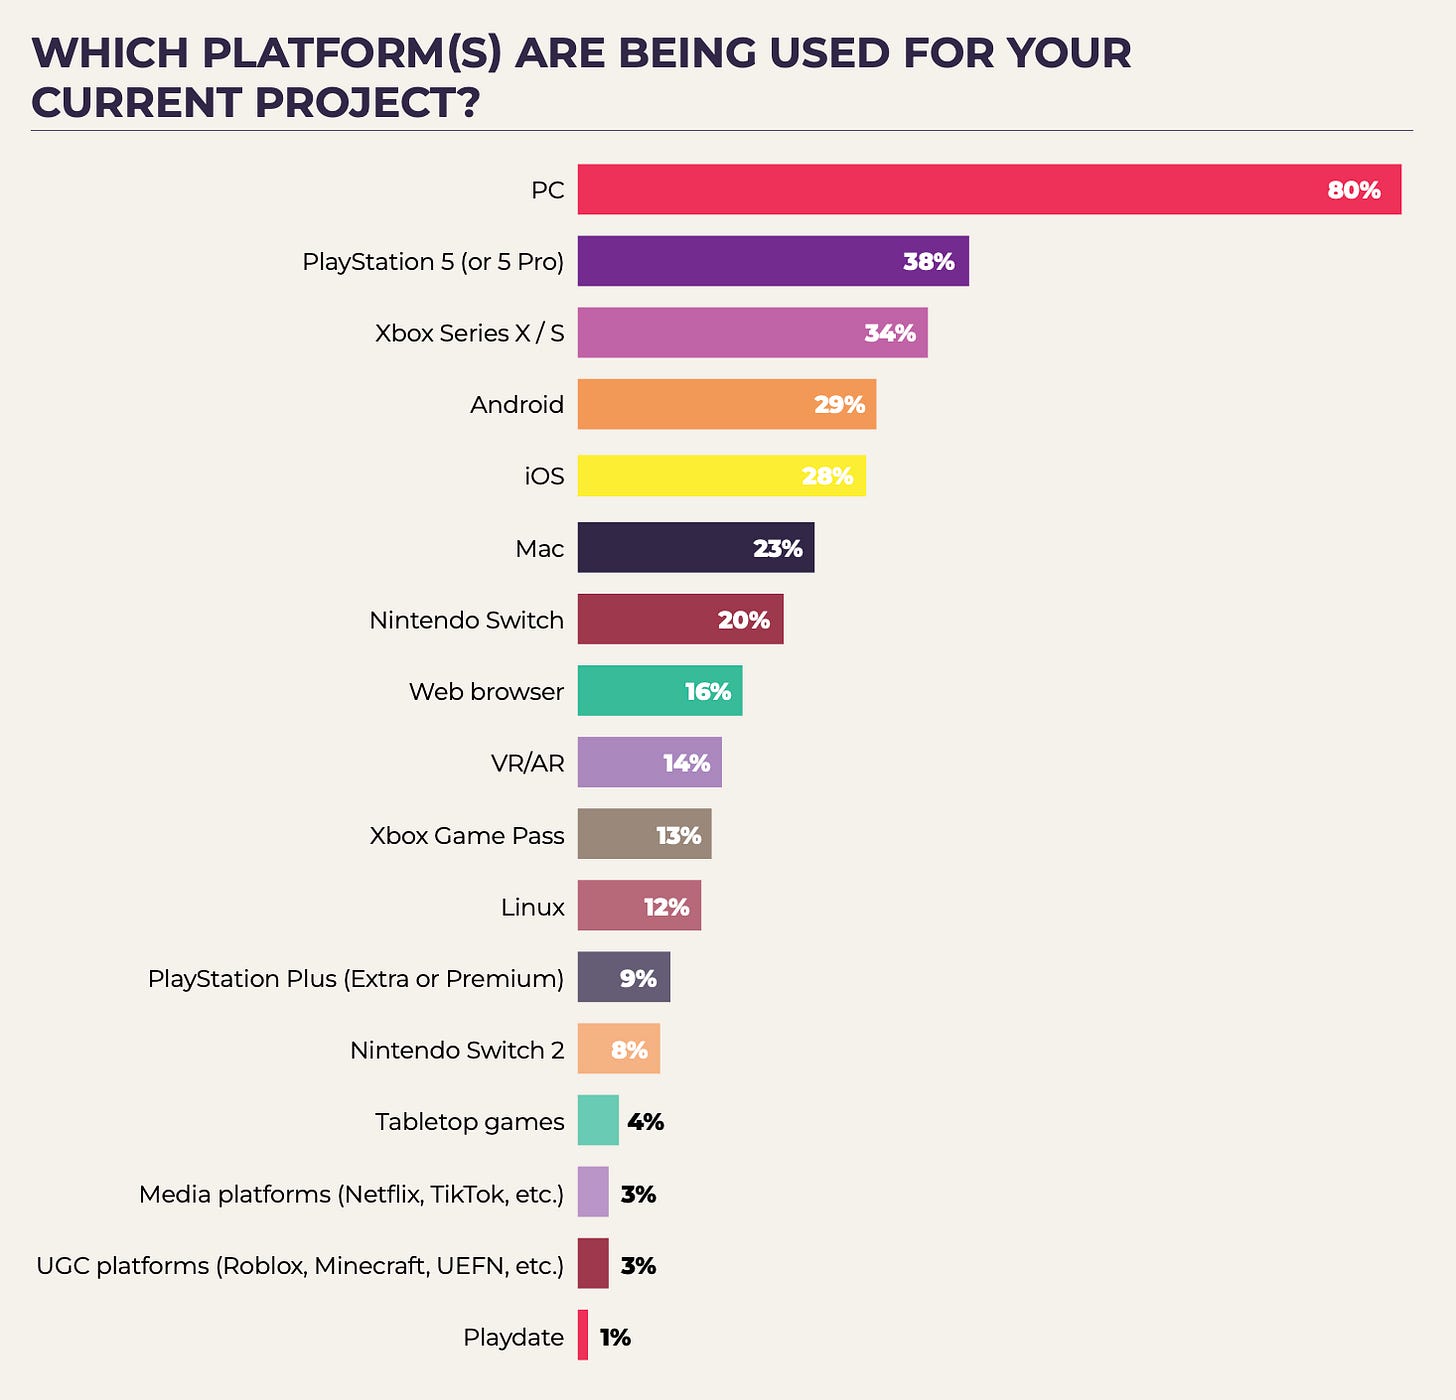
- For the first time since 2020, the number of developers making games for mobile devices has increased. 28-29% of respondents work on games for iOS and Android (vs. 23% and 24% last year). Most of these developers are from Brazil, the Middle East, and Asia.
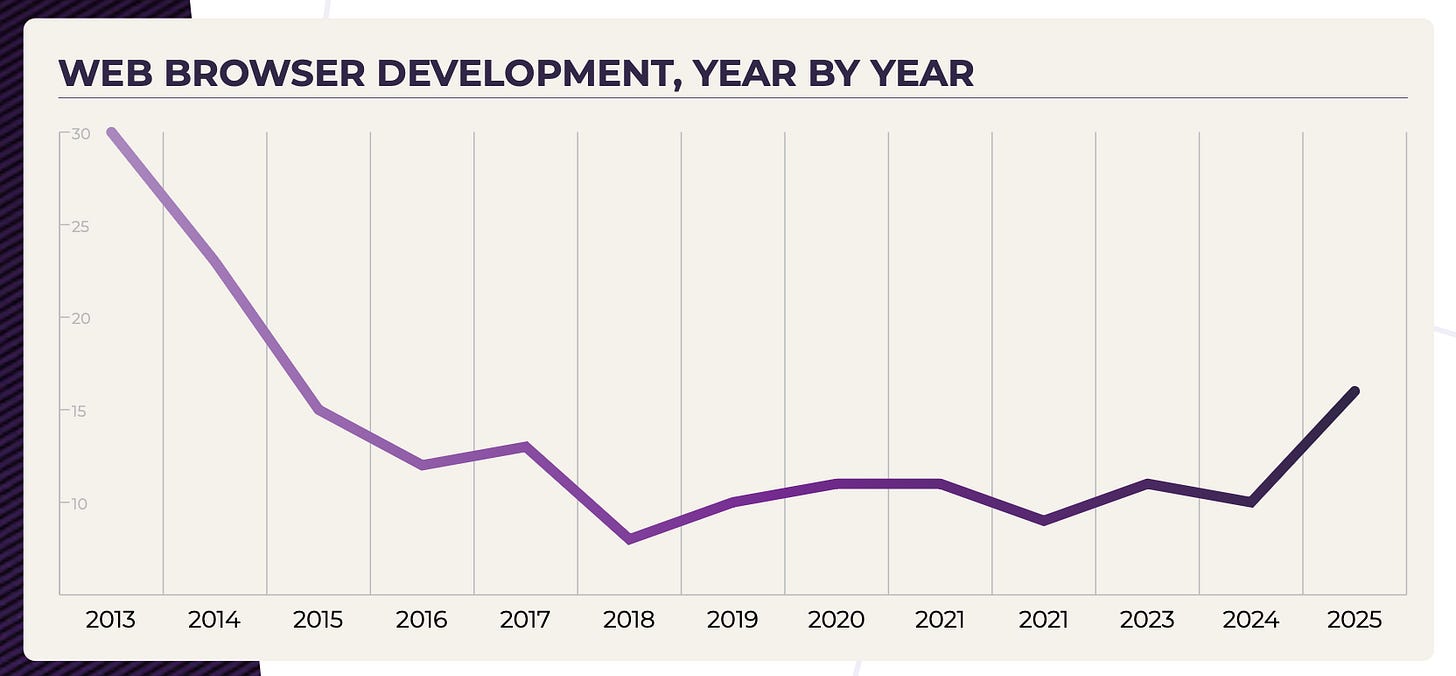
- Web platform game development is a clear trend. 16% of developers are preparing their projects for the web (vs. 9% last year and 11% the year before). This is the highest value since 2015.
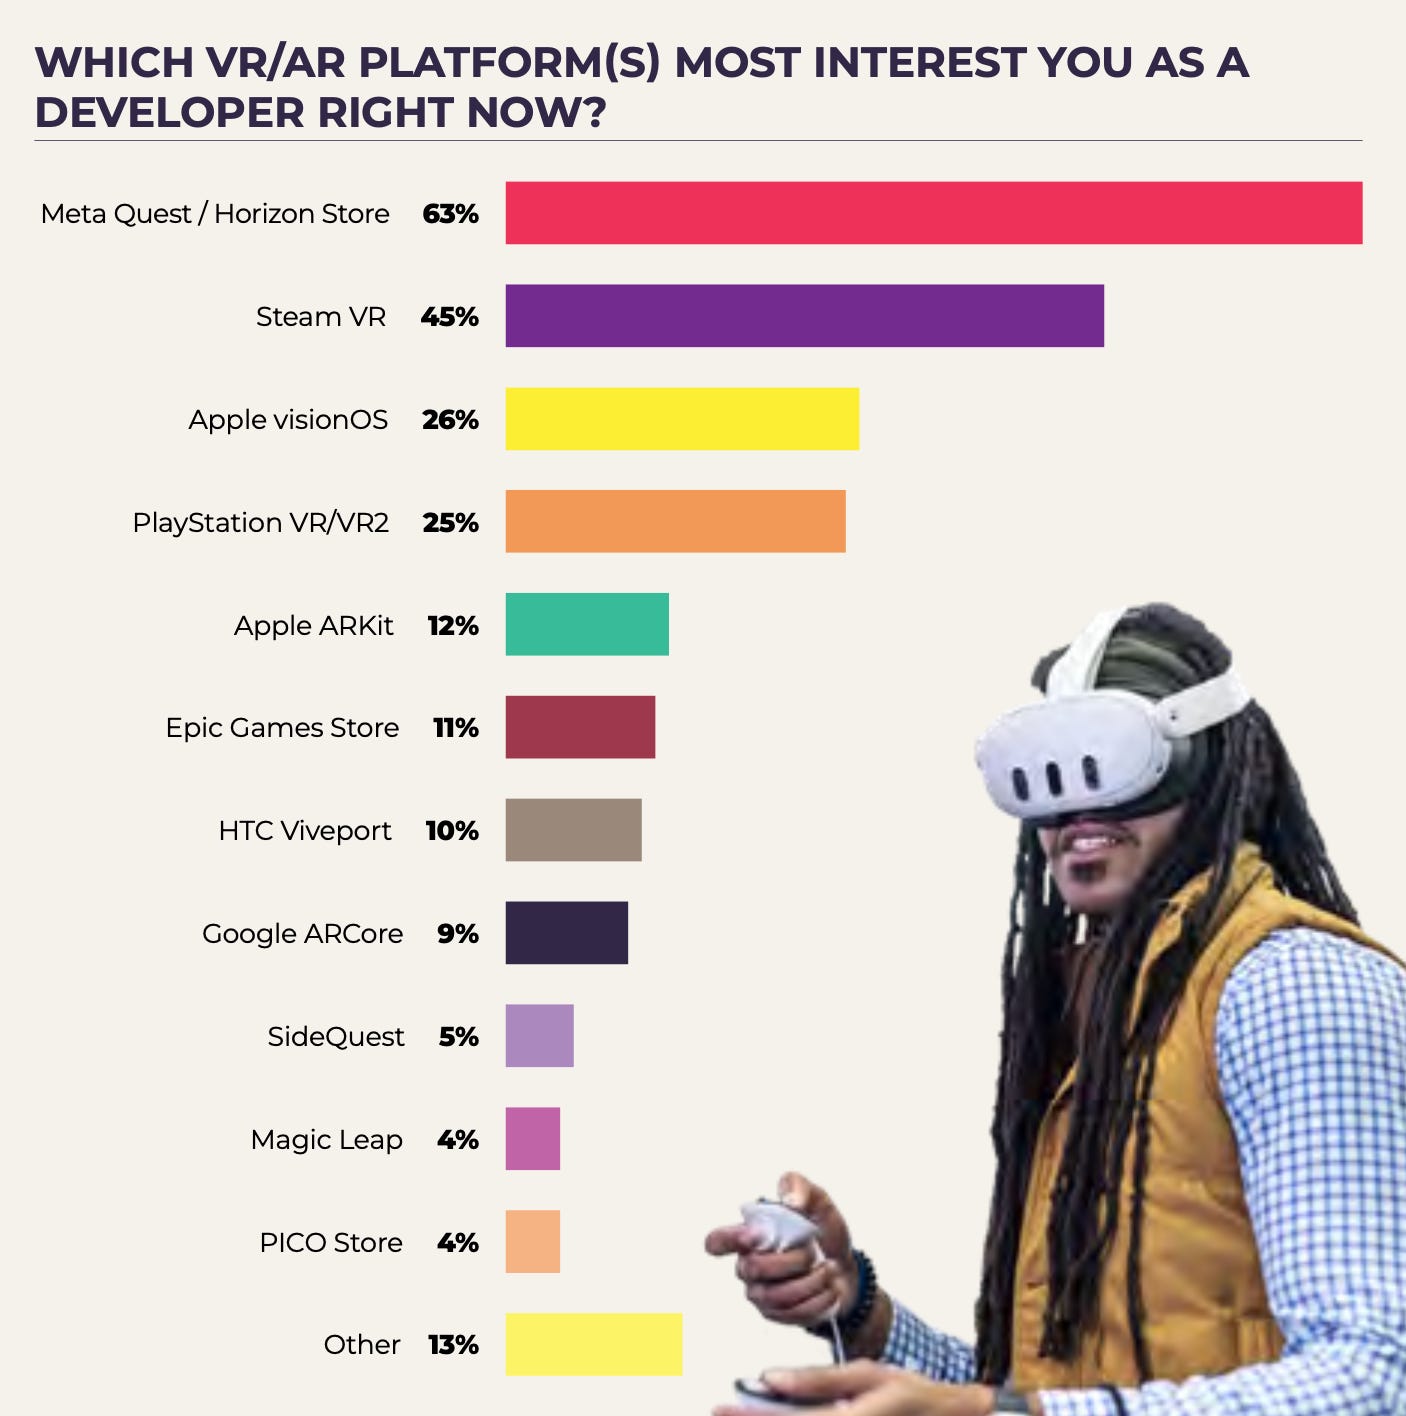
- Meta Quest remains the main VR/AR device on the market, as well as the most interesting for developers.
- Unity (32% of respondents) and Unreal Engine (32% of respondents) are the main engines in the industry. Another 13% work on their own proprietary engines. Interestingly, despite a lot of negativity associated with Unity Runtime Fee, it looks like developers haven't left the . The share of developers using the engine has hardly changed from last year.
Game Business
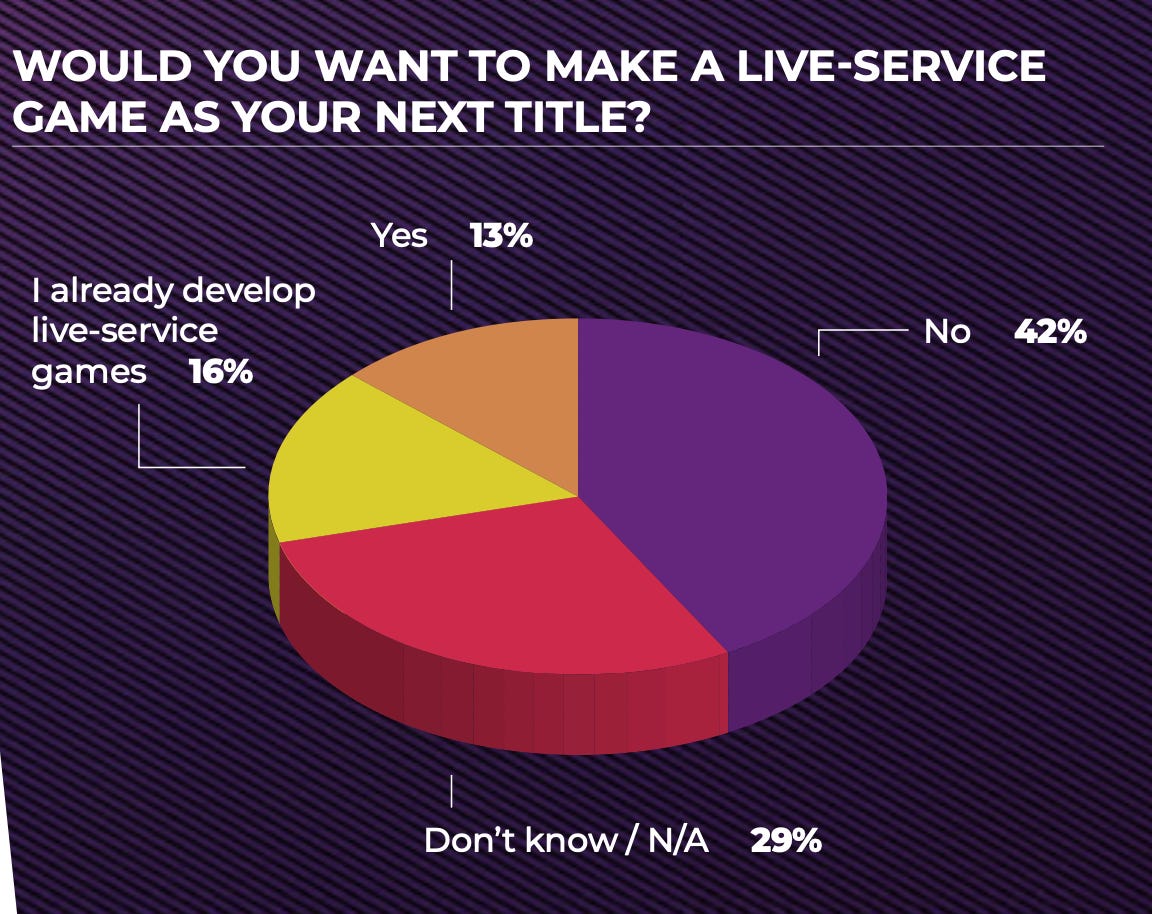
- 13% of respondents would like to make GAAS projects. Another 16% are already making them. But 42% don't want to get into this part of the business. Among AAA developers, the share of those working on service projects is higher - 33%.
- 62% believe that stable CCU is the main metric of a successful service game. 40% named DAU, 32% - the percentage of paying users.
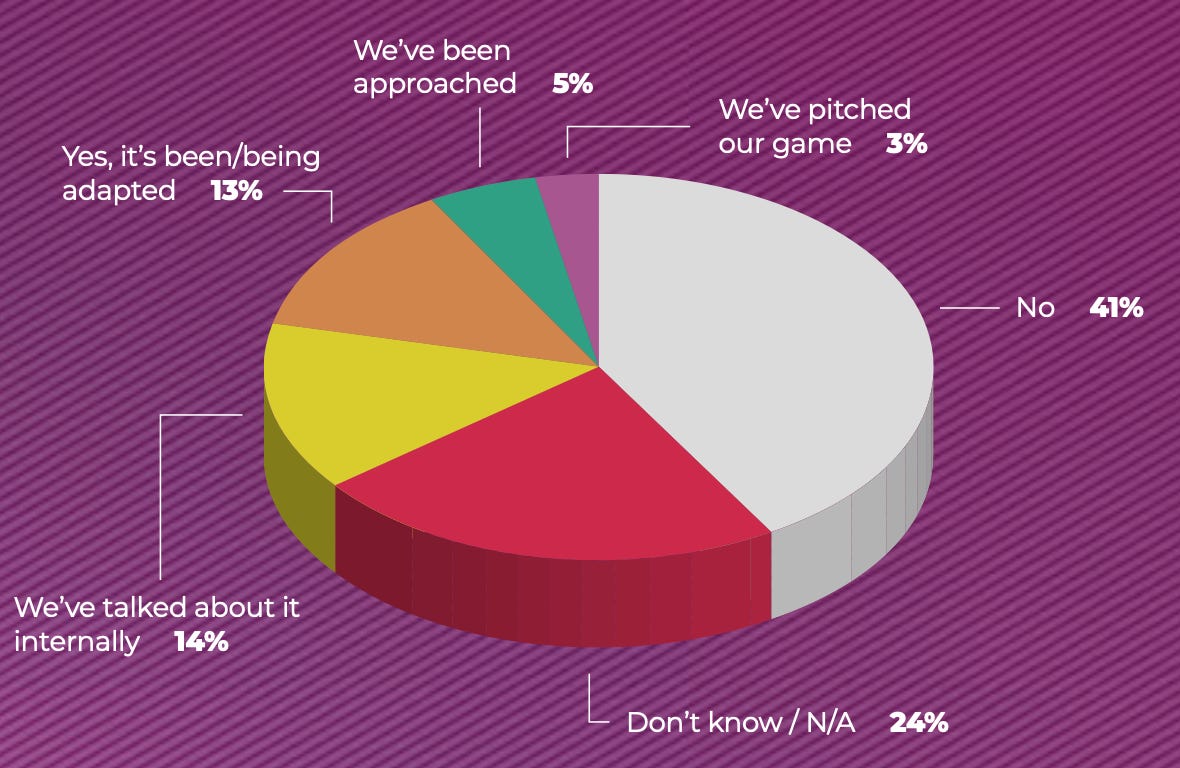
- 13% of developers are already working on translating their IP into movies or series. 5% of respondents said they were approached with such an offer. Another 14% discussed this possibility internally. At the same time, a third of major AAA developers are working on transferring their IP to television format.
Publishing and Financing
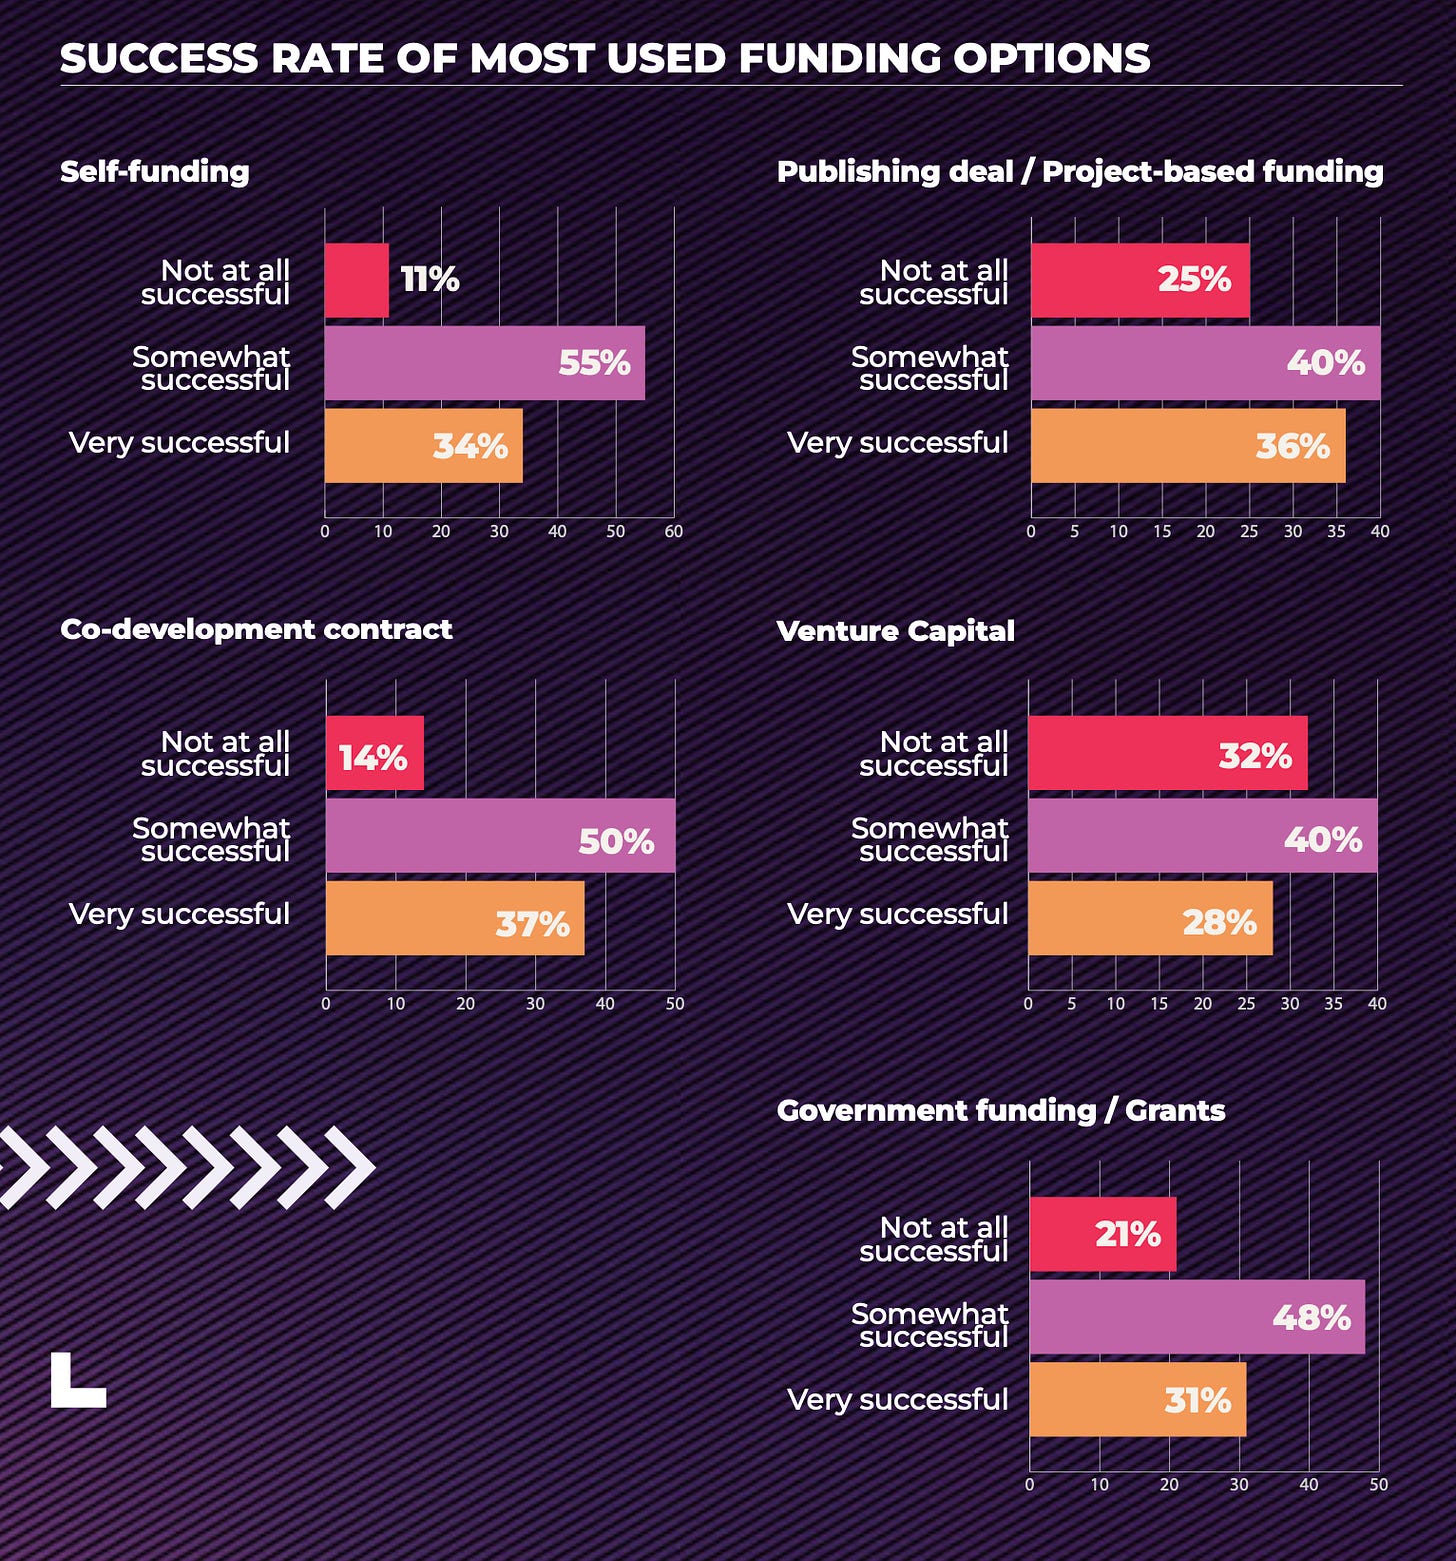
- Self-funding (56%), publisher funding or project financing (28%), grants and government support, venture investments, co-development (all at 15%) are the most popular financing formats among respondents. Interestingly, among AA developers, 40% are making projects with their own funds, while among AAA developers, only 29% do so.
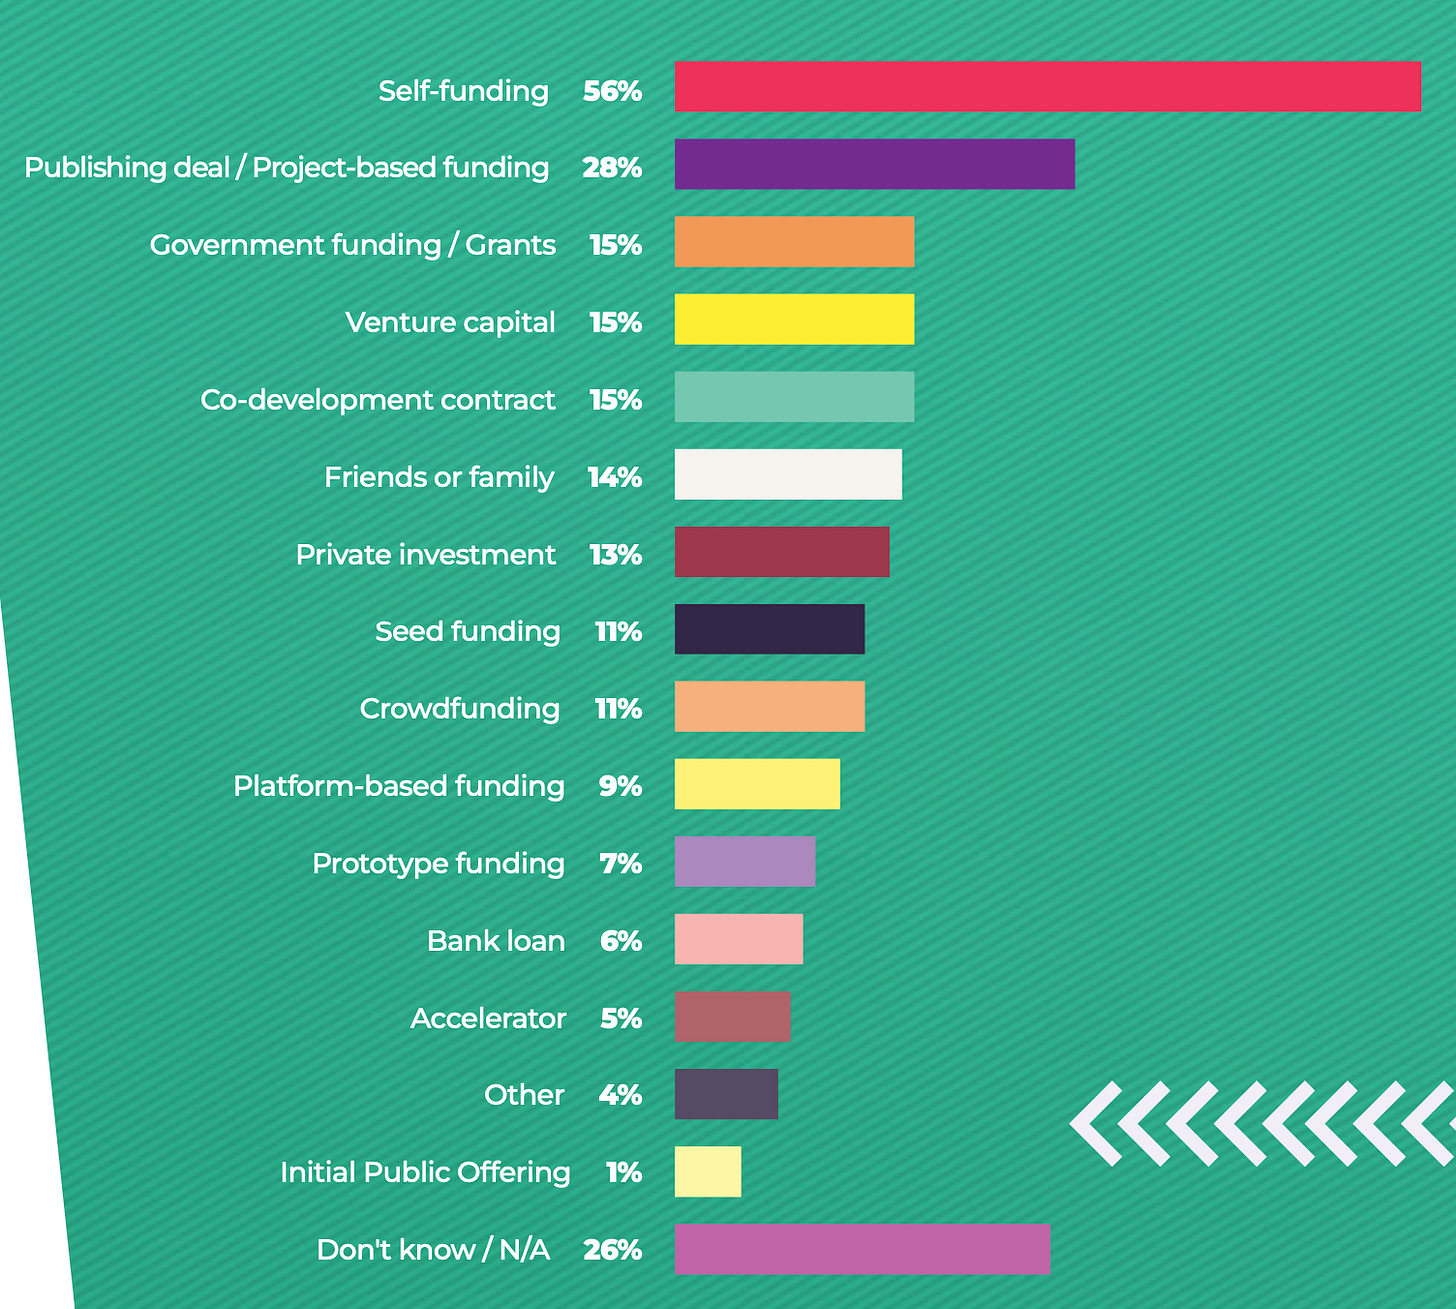
- In terms of subjective perception of success, venture investments received the most negative reaction as a financing method. 32% of respondents noted that their venture story didn't work out at all. Self-funding and co-development generate the most positive reactions.
Social Initiatives
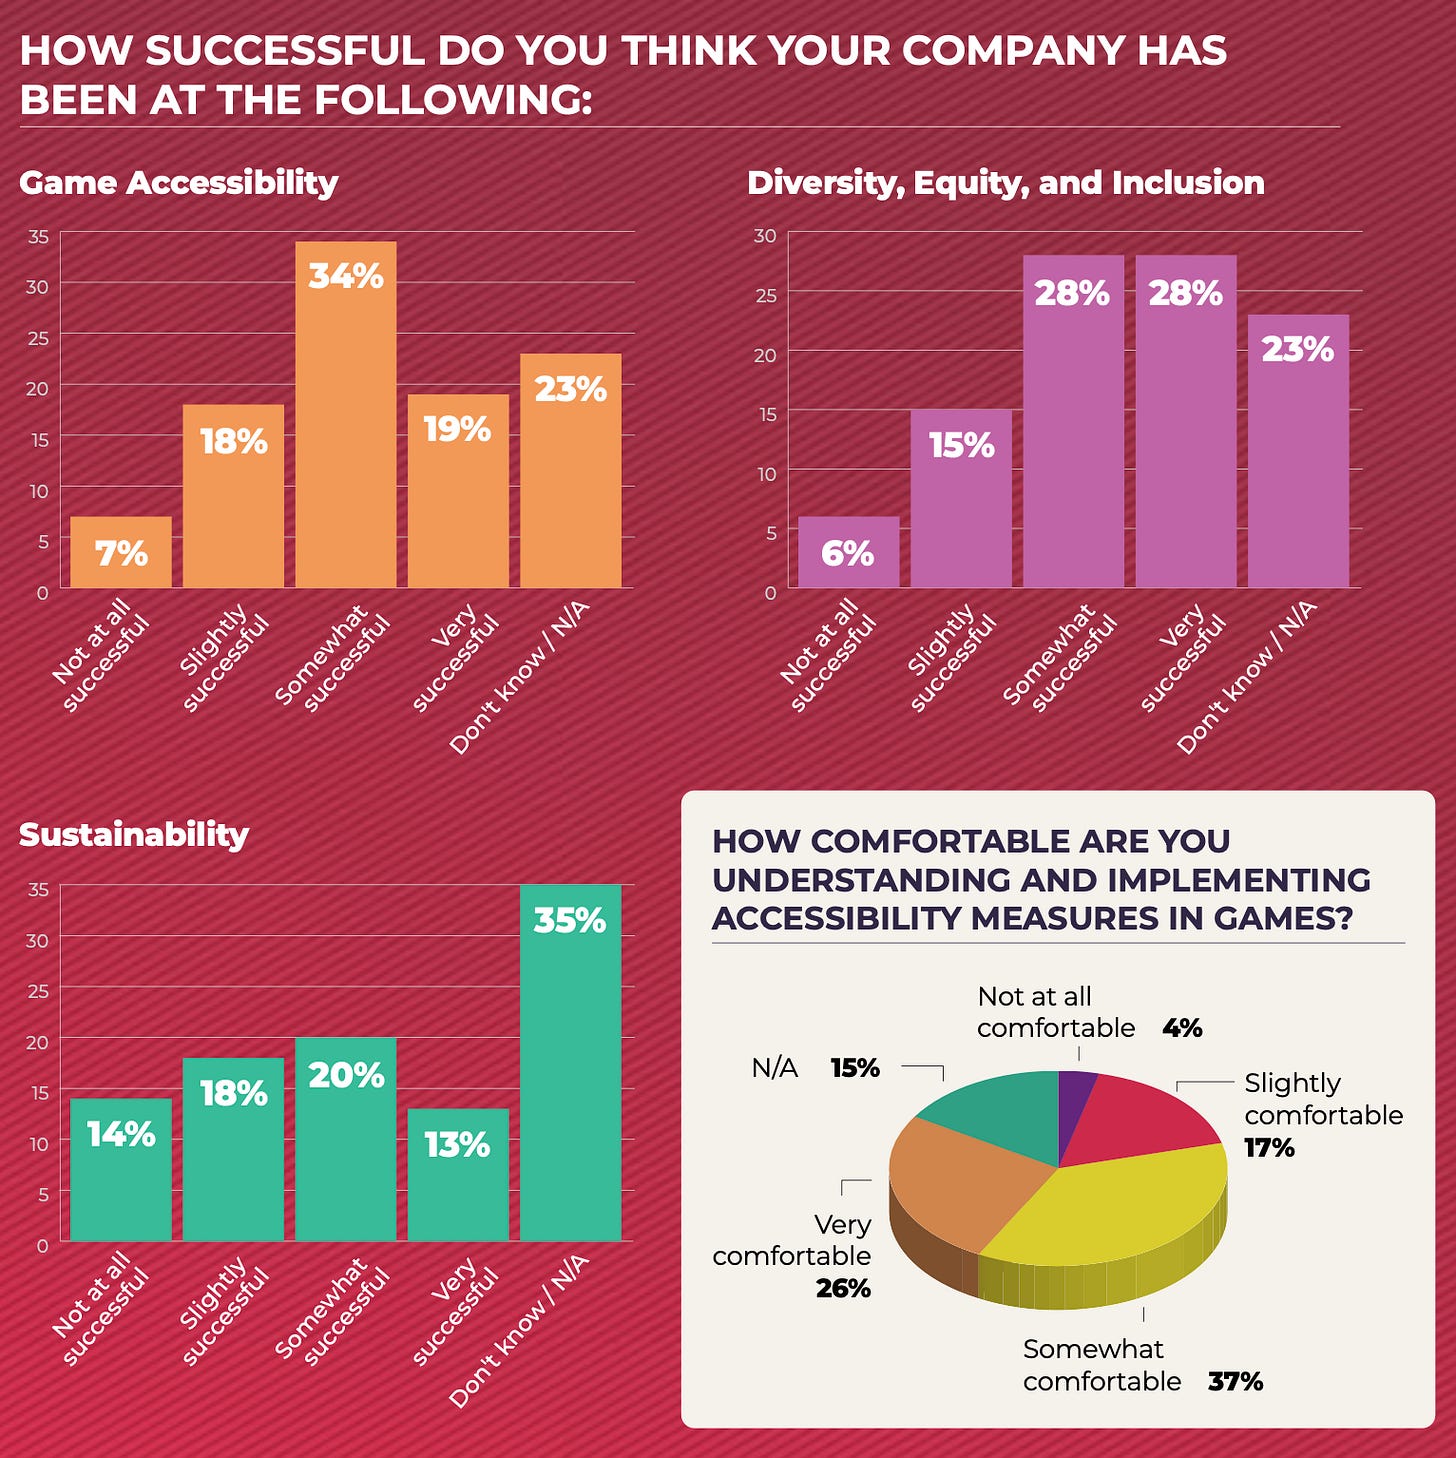
- Overall, the industry believes that they and their companies are succeeding in game accessibility, DEI initiatives, and sustainability.
- 16% of respondents noted that they faced natural disasters over the past year. This figure has seriously increased over the past couple of decades.
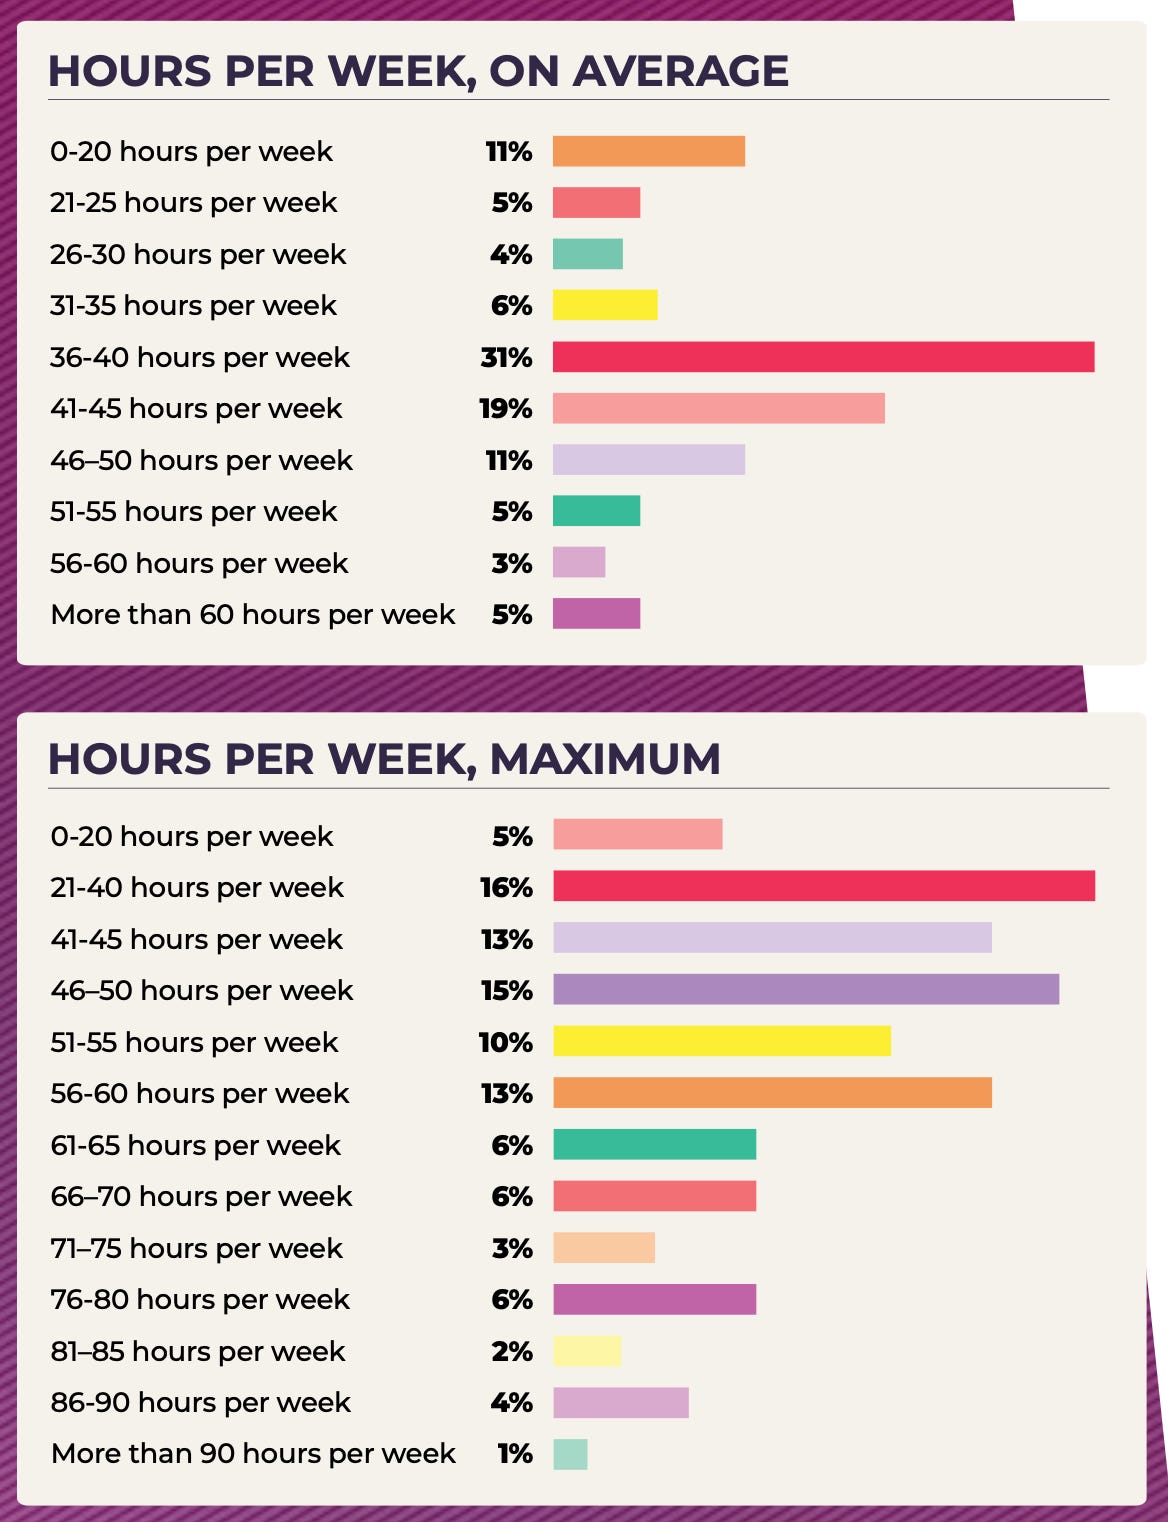
- Game developers have started working more for the first time since 2019. The share of those who work 40 hours or less per week decreased from 64% last year to 57% this year. There are more of those who work more than 51 hours per week (the share increased from 8% to 13%).
- People have different motivations for overtime. 67% do it on their own initiative (there may be a whole complex of factors why this happens). 23% don't consider it overtime. 14% fear consequences (probably layoffs). 12% noted that management pressures them.
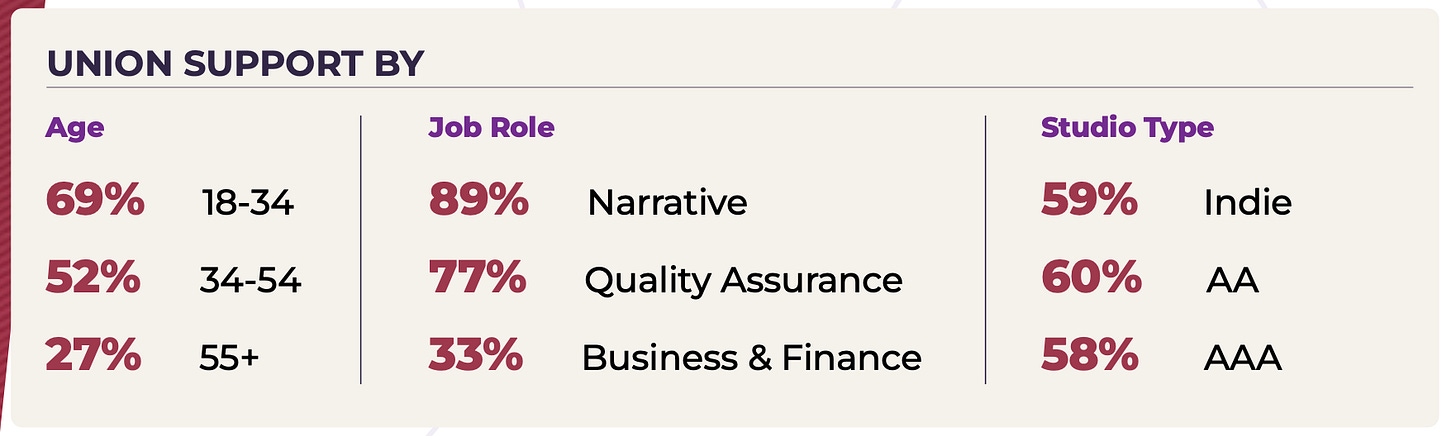
- Overall, the industry expresses support for the emergence of unions. Representatives of narrative professions and QA specialists vote the most for them. These are professions that are often at risk. Among young people, there are more who want to have a union.
Stay tuned for more updates next month!
Meanwhile, you can check out our free demo to see how devtodev can help your game project succeed.