
Devtodev is helping you keep in touch with what’s happening in the game market. Every month we publish an overview of reports on the most popular games worldwide, top-grossing games, successful releases, favorite video game types, trends, etc. This overview was prepared by Dmitriy Byshonkov, the author of the GameDev Reports by the devtodev Telegram channel. You can also read the July and August reports.
Contents
- AppMagic: Top Mobile Games by Revenue and Downloads in August 2024
- Aldora: The Gaming market will reach $250.2B in 2025
- Games & Numbers (August 24 - September 3; 2024)
- Stream Hatchet: Streaming of Mobile Games in H1'24
- game: The German Gaming Market declined in H1'24
- Sensor Tower: RPG Revenue Declines in South Korea
- Sanlo: Mobile Web Shops in 2024
- Niko Partners & Saudi Esports Federation: Gulf Countries Market, User Preferences, and Localization
- Perforce & JetBrains: Gaming Technologies in 2024
- Famitsu: The Japanese gaming market in August 2024
- Amir Satvat: Data on job openings in the gaming industry
- Sensor Tower: The Japanese mobile gaming market declined in H1'24
- VideoGamesEurope & EGDF - European Gaming Market in 2023
- Games & Numbers (September 4 - September 17; 2024)
- AppMagic: The casual games market in Tier-1 West countries grew in H1'24
- Unity: Mobile User Acquisition and Monetization trends in 2024
- GSD & GfK: August'24 PC/Console sales in the UK dropped by 1.5%
- Tenjin: Ad Monetization in Mobile Games in Q2'24
- Newzoo: Top-20 PC/Console Games of August 2024 by Revenue and MAU
- GSD & GfK: Sales of PC/console games in Europe increased in August'24; GTA V is the best-selling game of the month
AppMagic: Top Mobile Games by Revenue and Downloads in August 2024
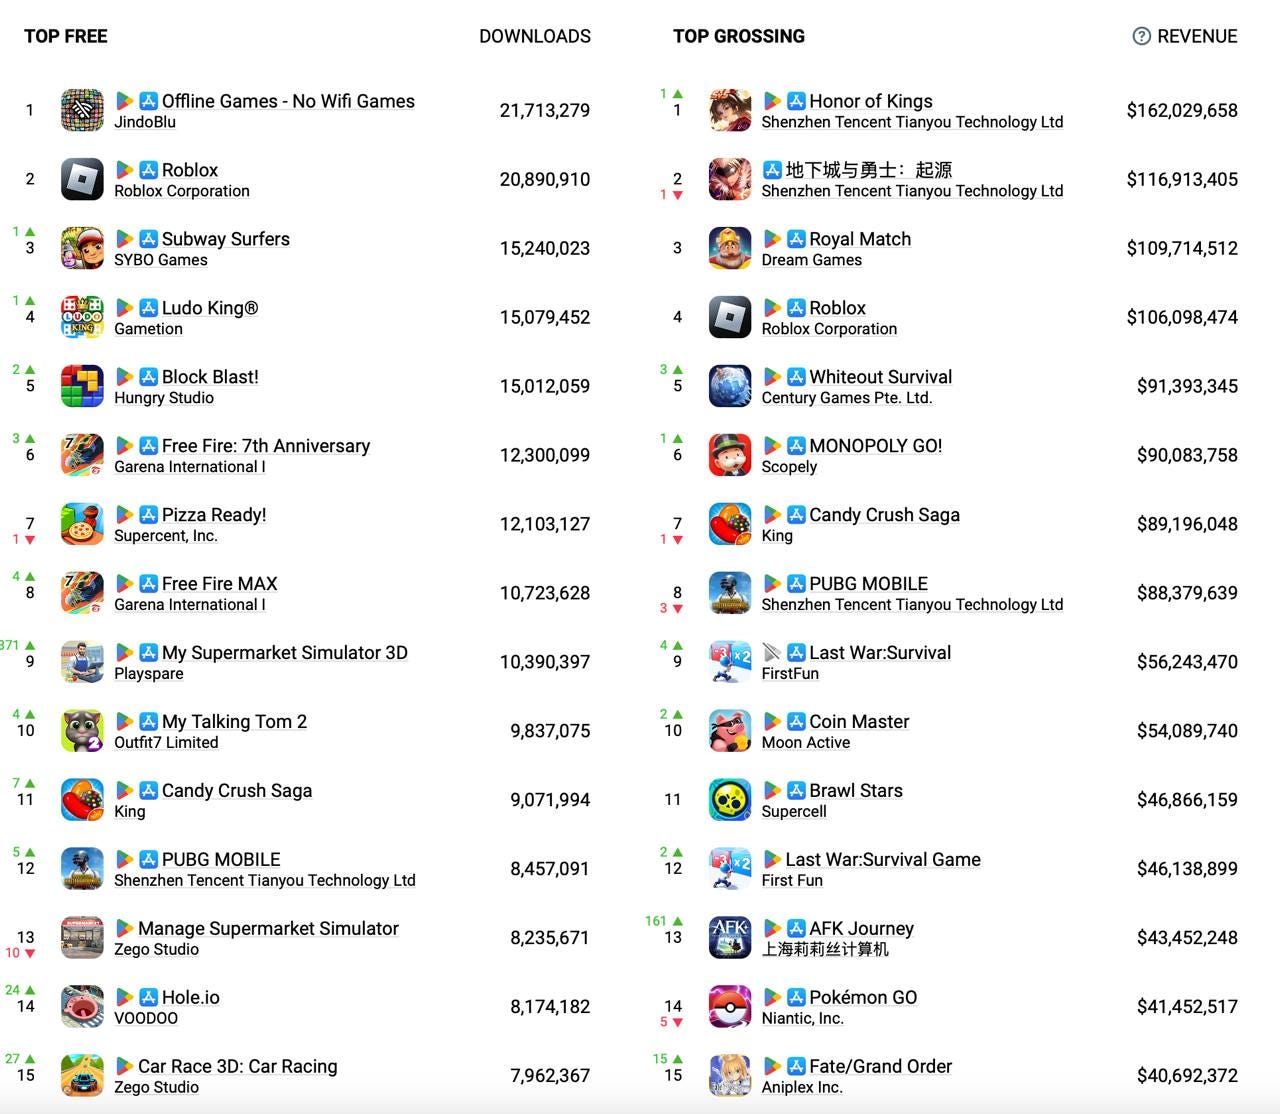
AppMagic provides revenue data net of store commissions and taxes.
Revenue
- Honor of Kings returned to the top spot in revenue ($162M in August), surpassing Dungeon Fighter Online ($116.9M).
- Whiteout Survival saw a significant increase in revenue in August, earning $91.3 million. This is 16% more than the previous month. Overall, since its launch in February 2023, the game has shown a positive revenue trend. From March to May 2024, the game plateaued at $62 million, but as seen from the numbers, this was successfully overcome.
- AFK Journey launched in China, with August revenue exceeding July's figures by 10 times ($4.6 million compared to $43.4 million). 42% of the game's August revenue came from China; 23% from South Korea; 10% from Taiwan. The game jumped 161 positions in the rankings, reaching 13th place.
Downloads
- The download charts remain stable. In first place is Offline Games - No WiFi Games (21.7 million downloads); in second is ROBLOX (20.9 million downloads); and in third is Subway Surfers (15.2 million downloads).
- My Supermarket Simulator 3D surged to 9th place in the chart, with 10.4 million downloads. The leading countries are Indonesia, Russia, and Turkey.
Aldora: The Gaming market will reach $250.2B in 2025

Aldora is a new company founded by Joost van Dreunen, co-founder of SuperData Research
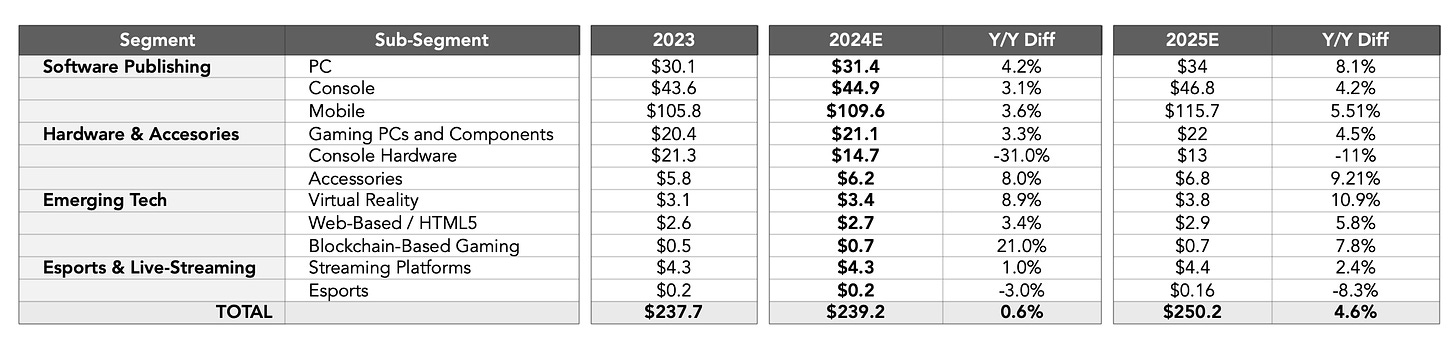
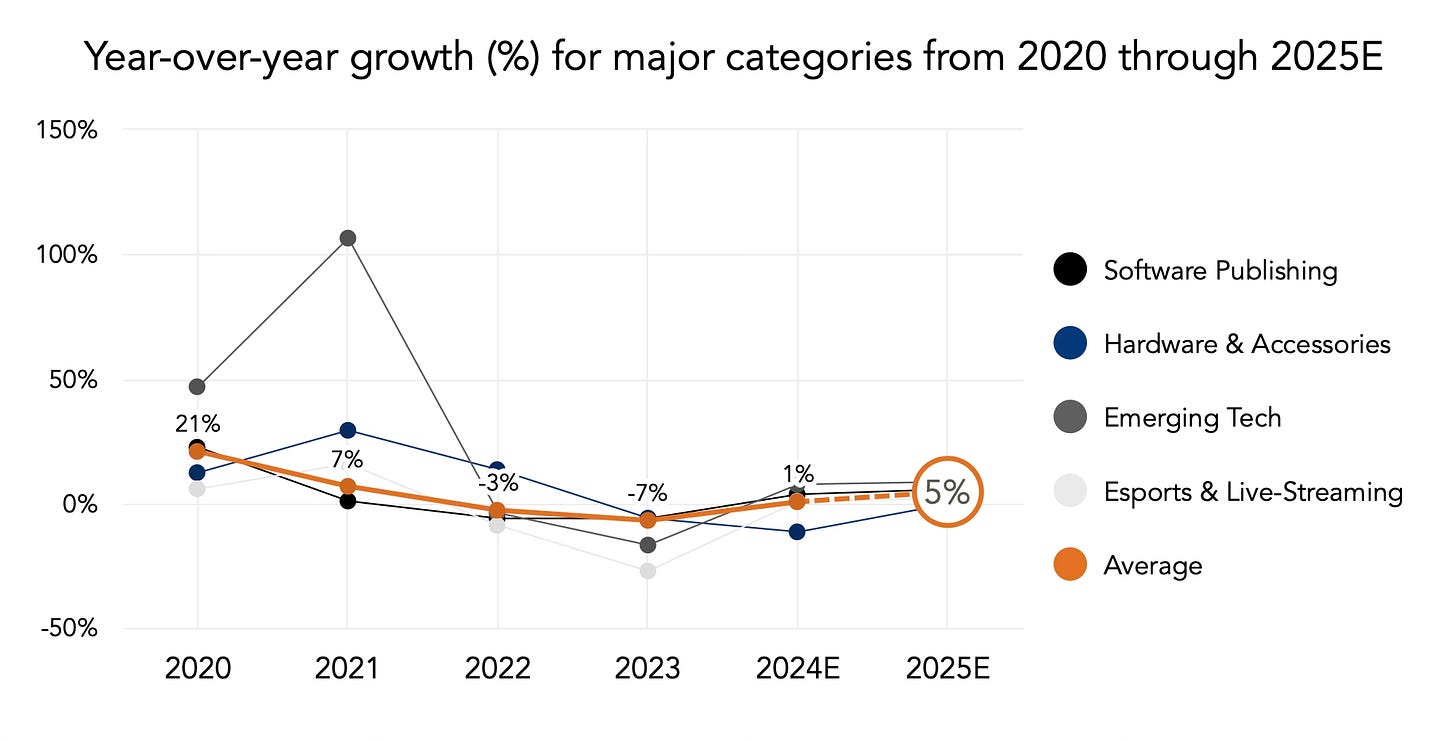
- The company estimates that in 2025, people will spend $250.2 billion on interactive entertainment (+4.6% YoY). This figure includes game sales, gaming hardware, accessories, eSports, and live streaming. The forecast for 2024 is $239.2 billion (a growth of 0.6%).
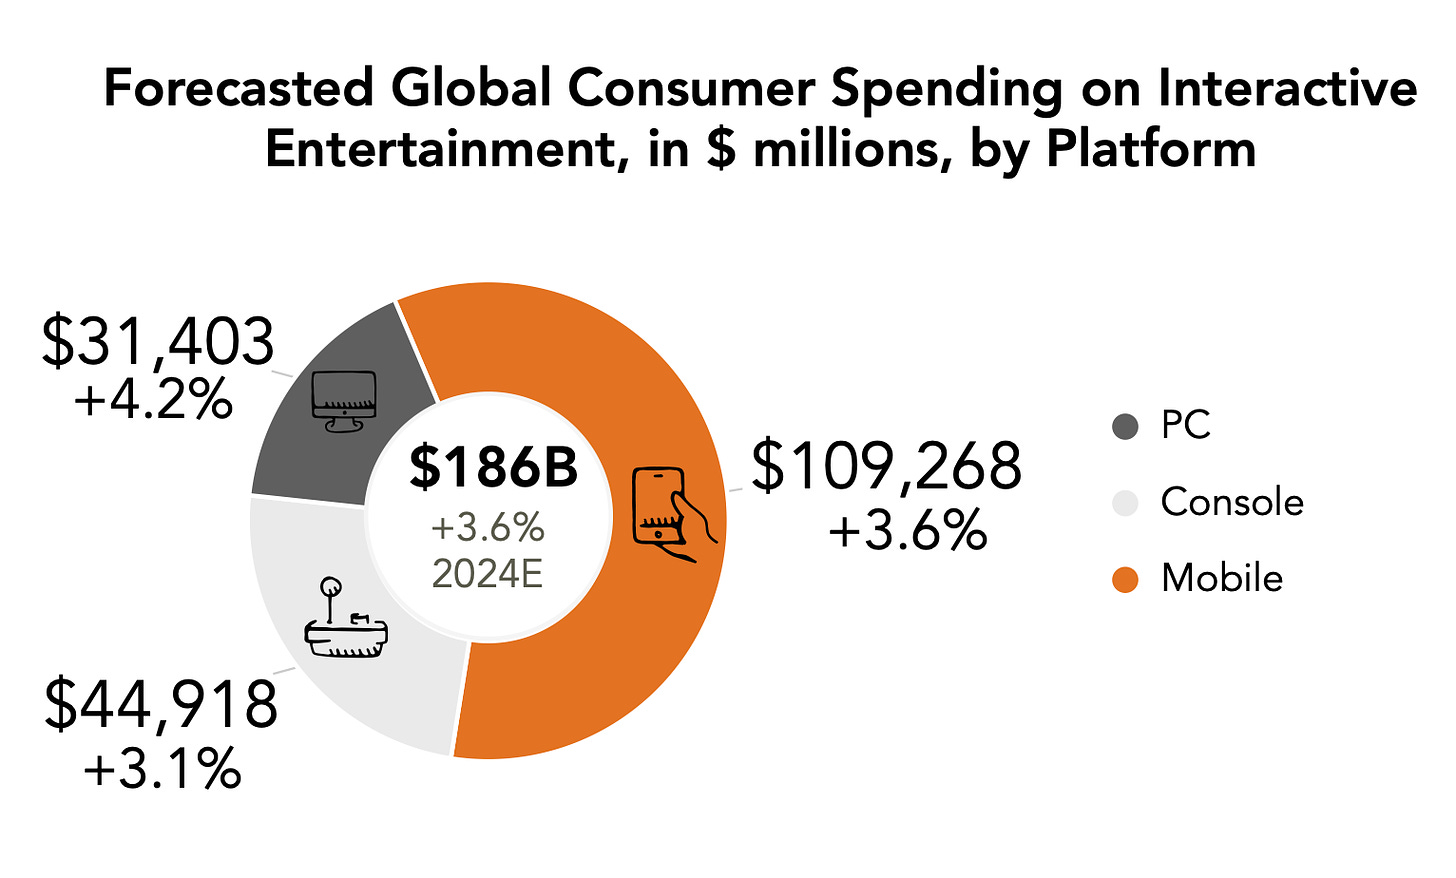
- Game sales in 2024 will reach $186 billion (+3.6% YoY). The PC segment will see the highest growth (+4.2%, up to $31.4 billion), followed by mobile games (+3.6% YoY, up to $109.3 billion). In third place in terms of growth are consoles (+3.1%, up to $44.9 billion).
- Sales of gaming hardware are expected to decline by 31% YoY in 2024. The peak of sales was in 2022 when $21.4 billion was spent on gaming consoles and accessories. Aldora believes this signals that the current console lifecycle is nearing its end. The PC and laptop market remains stable. However, accessory sales are expected to grow by 5% in 2025.
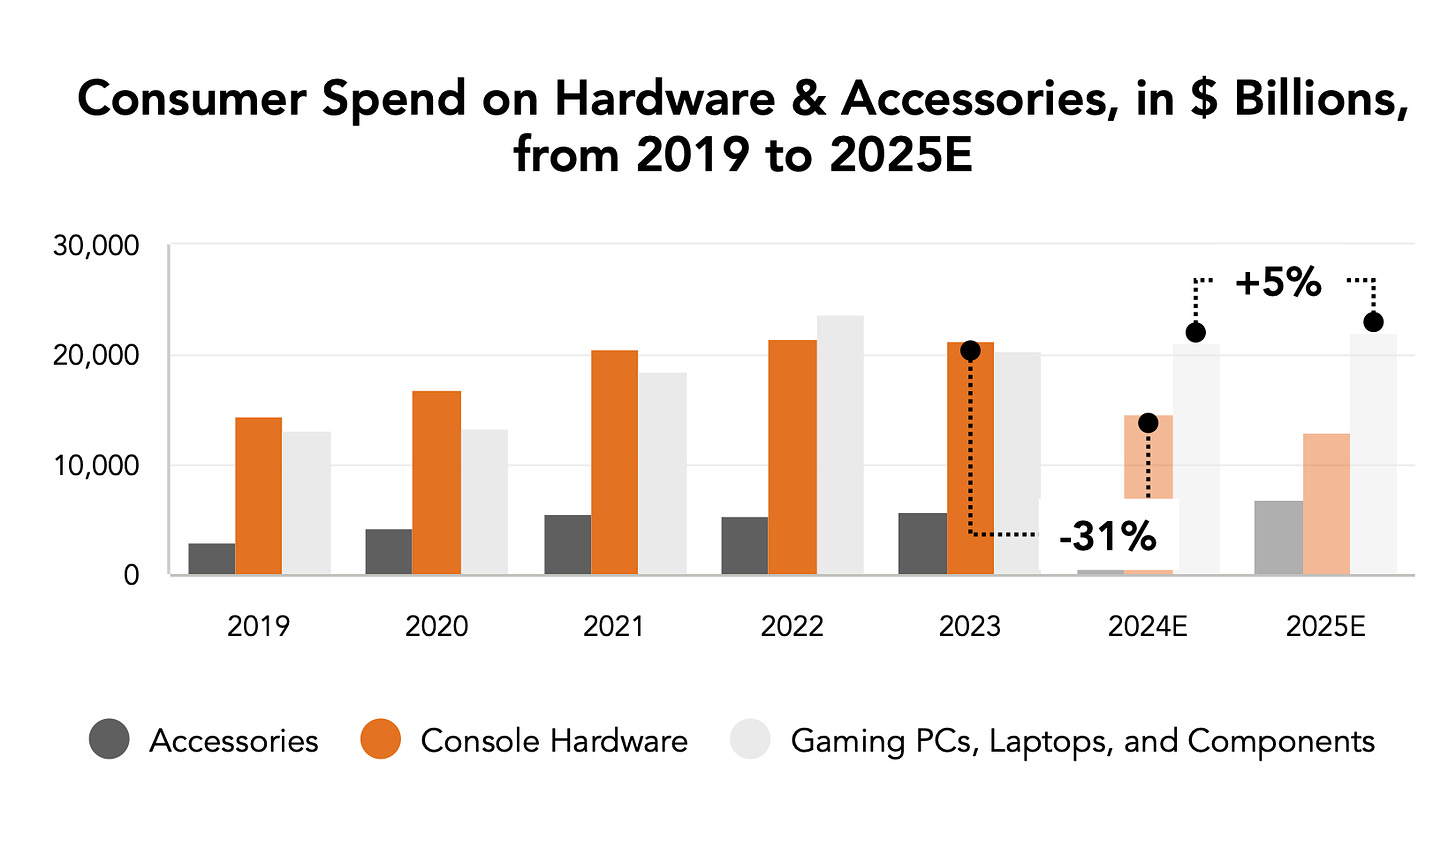
- Innovative technologies have not yet gained a significant share of the gaming industry. The VR market is projected to be worth $3.3 billion by the end of 2024, with an expected growth of 11% in 2025. The blockchain gaming market is expected to reach $651 million in 2024 (+21% YoY), but market leaders (Animoca, Sorare) are seeing revenue declines. The web gaming market is expected to show modest growth in 2024 (up 3%, to $2.7 billion).
- By the end of 2024, the streaming market will be worth $4.3 billion. This is 1% more than last year but significantly less than the peak of $6.62 billion in 2021. Despite this, leading streaming platforms (Twitch) remain unprofitable.
- The eSports market continues to struggle. In 2024, its value will be $173 million (-3% YoY), and in 2025, Aldora experts expect a decline of 8.3%.
Games & Numbers (August 24 - September 3; 2024)
PC/Console Games
- Steam set a new record with 37.2 million concurrent users on the platform.
- Crime Scene Cleaner sold over 200,000 copies in less than 2 weeks.
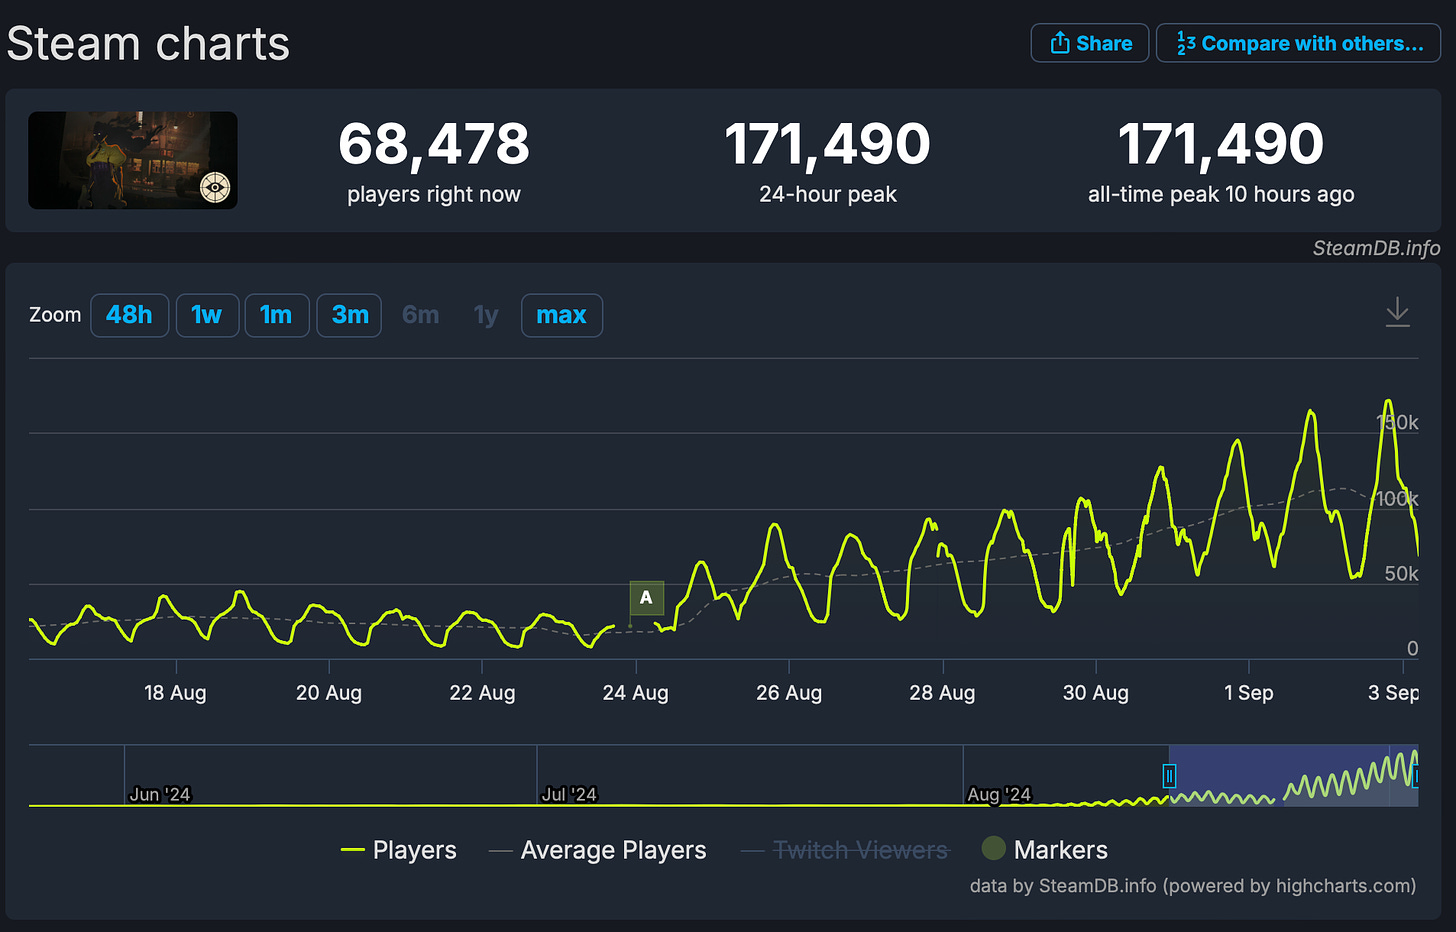
- Valve’s Deadlock is gaining popularity. The game hit a new peak of 171,000 concurrent users. It’s still in closed beta. According to VG Insights, the game has over 1.5 million wishlists.
- GameDiscoverCo estimates that Black Myth: Wukong has 3 million buyers on PS5, with 2 million in China.
- Over 19 million people have played Control. This doesn’t reflect sales since the game has been available on subscription services.
- The mobile game CarX Street has launched on Steam. The game had 600,000 wishlists at release. Unlike the mobile version, the game is sold for $19.99 with no microtransactions. The mobile version has been downloaded over 50 million times.
Mobile Games
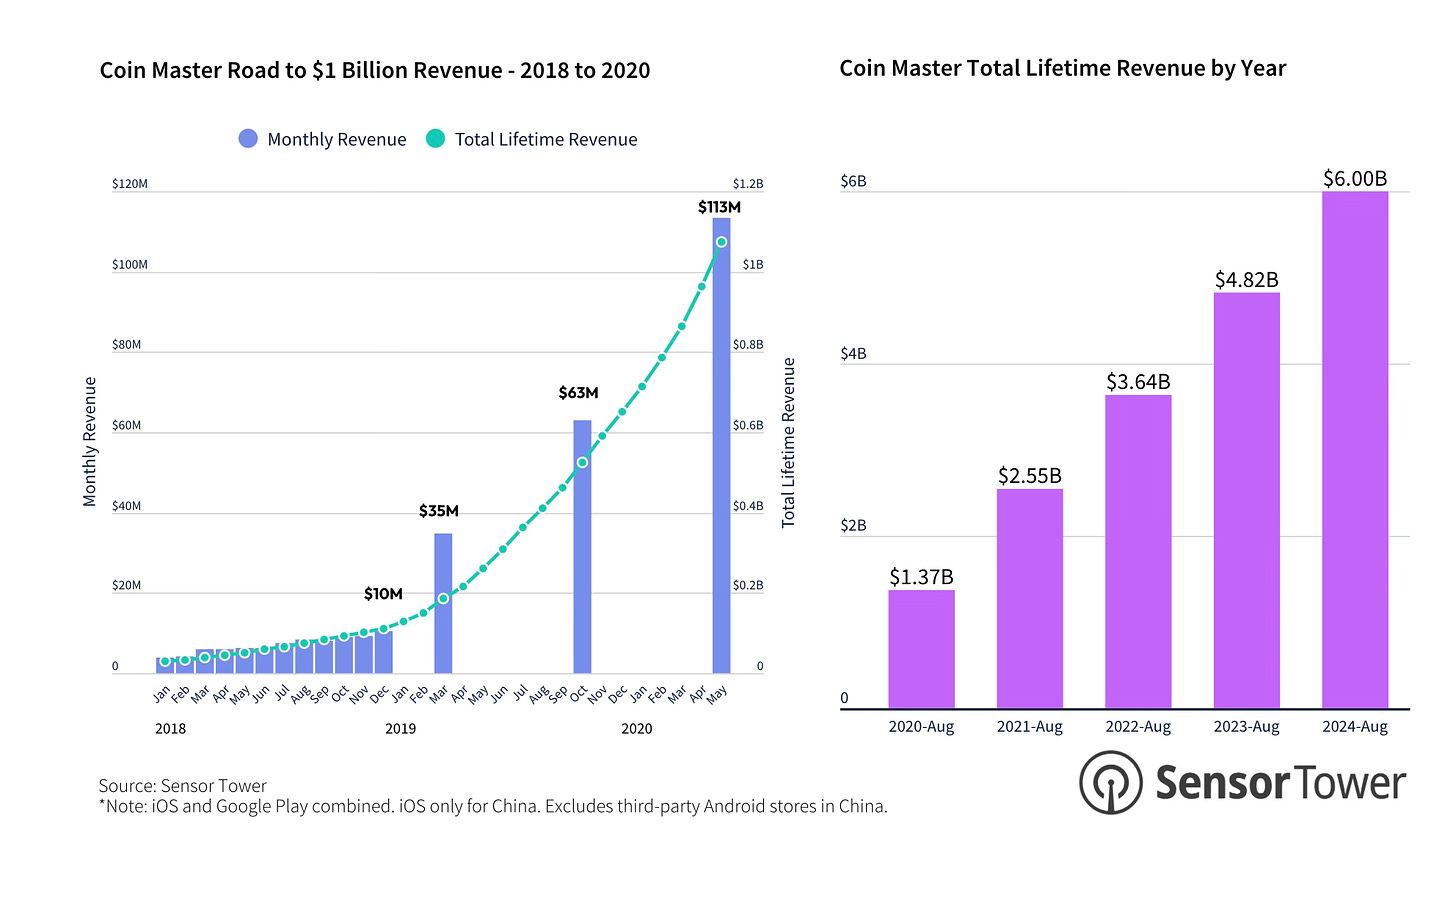
- Sensor Tower reports that Coin Master has surpassed $6 billion in revenue. The game has an interesting history. It was nominally released in 2012 but didn’t receive any support until February 2016. By December 2018, the game was making $10 million a month. In August 2020, Coin Master had a total revenue of $1.37 billion. By August 2024, the developers managed to increase it more than fourfold.
- Merge Mansion by Metacore has earned $500 million in 4 years of operation, with 55 million downloads during that time.
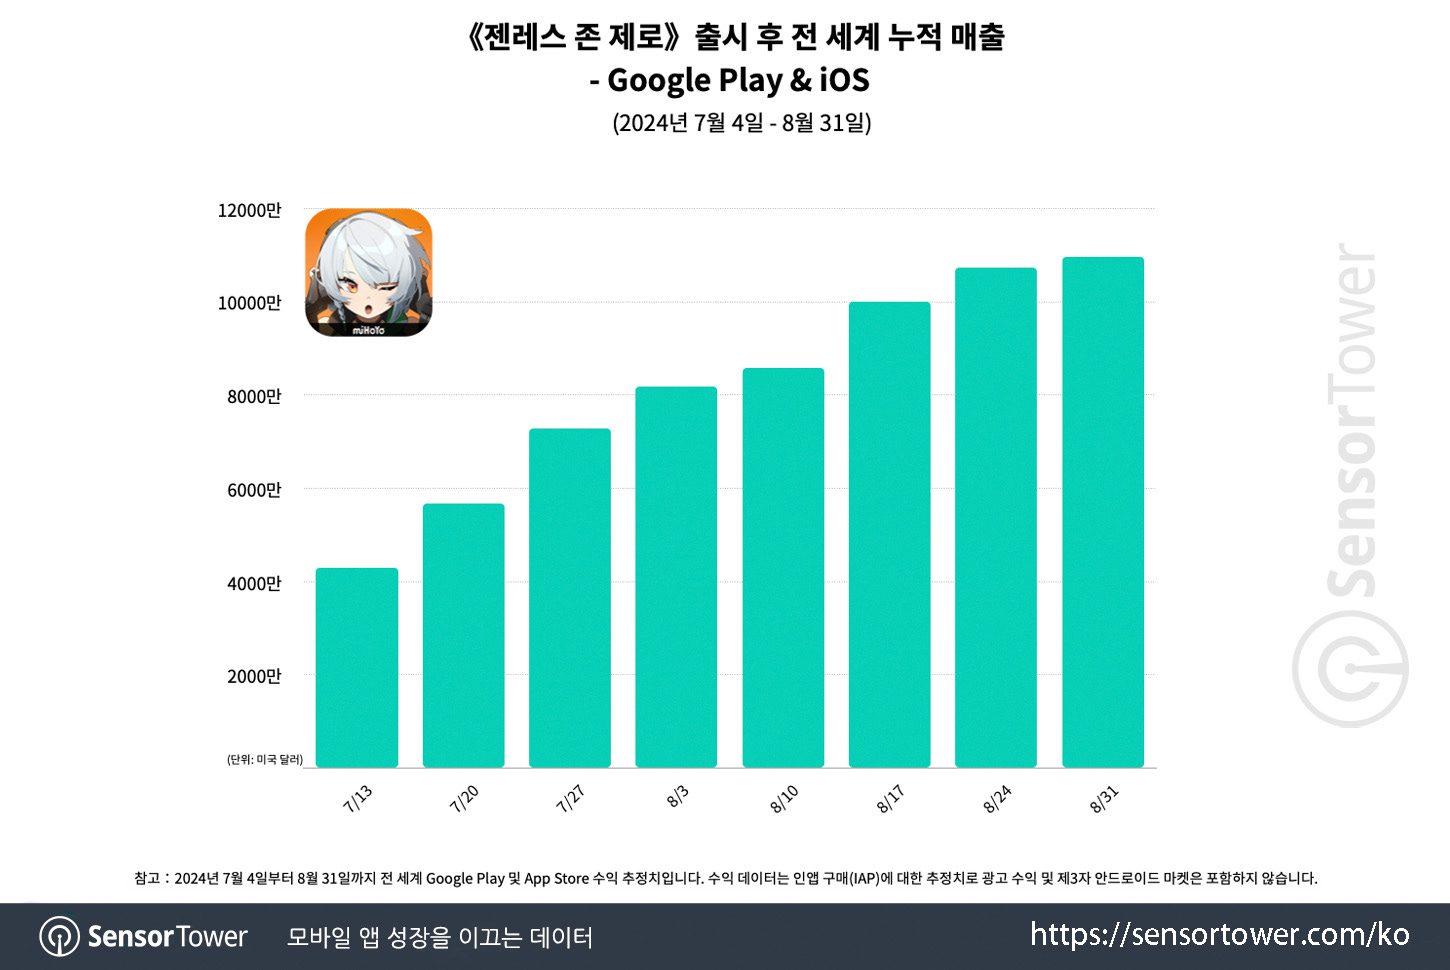
- Sensor Tower reports that Zenless Zone Zero reached $100 million in revenue faster than any other game released in 2024. The main regions are China (39.7% of revenue), Japan (27.7%), the USA (10.1%), and South Korea (9.1%). The RPD in South Korea is $14, second only to Japan. Note that Sensor Tower does not account for PC and console sales, so the actual revenue of the game is even higher.
- Goddess of Victory: Nikke launched a collaboration with Evangelion, resulting in the project’s revenue doubling on the day of the update's release. According to AppMagic, the peak gradually normalized afterward.
Other
- More than 335,000 people from 120 countries attended Gamescom ’24 this year, which is 4.6% more than last year.
Stream Hatchet: Streaming of Mobile Games in H1'24
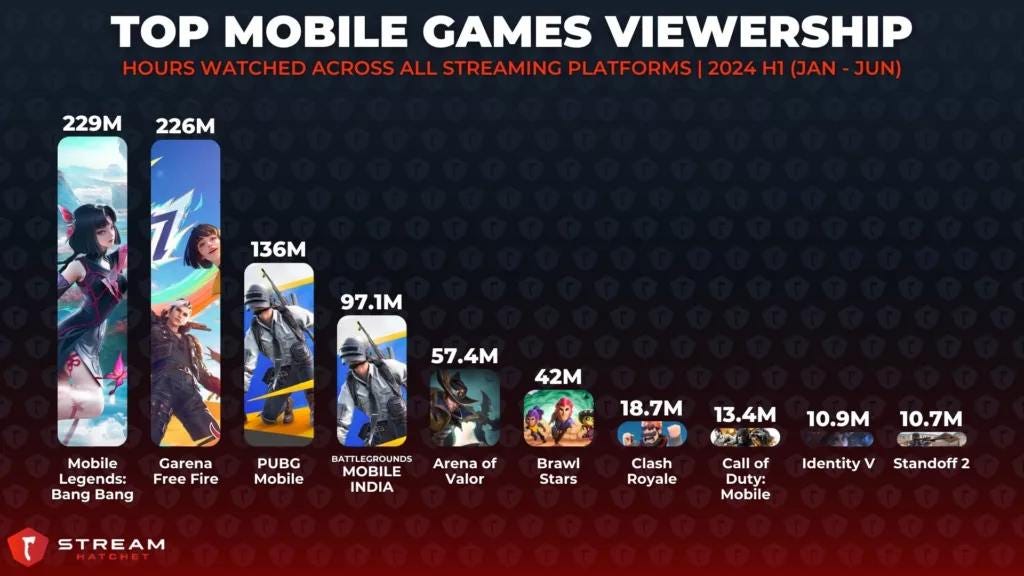
We're not used to seeing mobile games at the top of streaming platforms. But that doesn't mean people aren't watching them. Stream Hatchet has gathered information on the most popular mobile games and genres on streaming platforms.
- Mobile Legends: Bang Bang (229 million hours watched) and Garena Free Fire (226 million hours) are the two clear leaders in the mobile market. Interest in these two projects is actively supported by esports tournaments (for Mobile Legends: Bang Bang, 54% of the views come from tournaments).
❗️There is no correlation between a game's popularity on streaming platforms and its revenue in the mobile market. Titles like Honor of Kings, MONOPOLY GO!, and Royal Match are absent from the top lists.
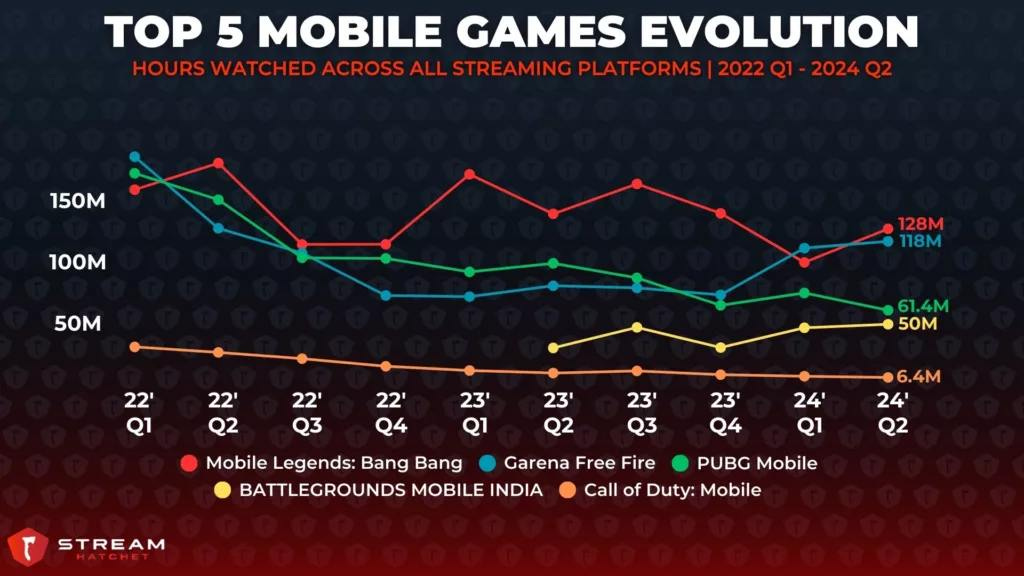
- When considering the top 5 mobile games by viewer interest, only two leaders have managed to maintain their positions since Q1'22. Call of Duty: Mobile is showing a negative trend, and PUBG Mobile has lost 65% of its viewer interest since Q1'22. However, it's worth noting the rising popularity of Battlegrounds Mobile India.
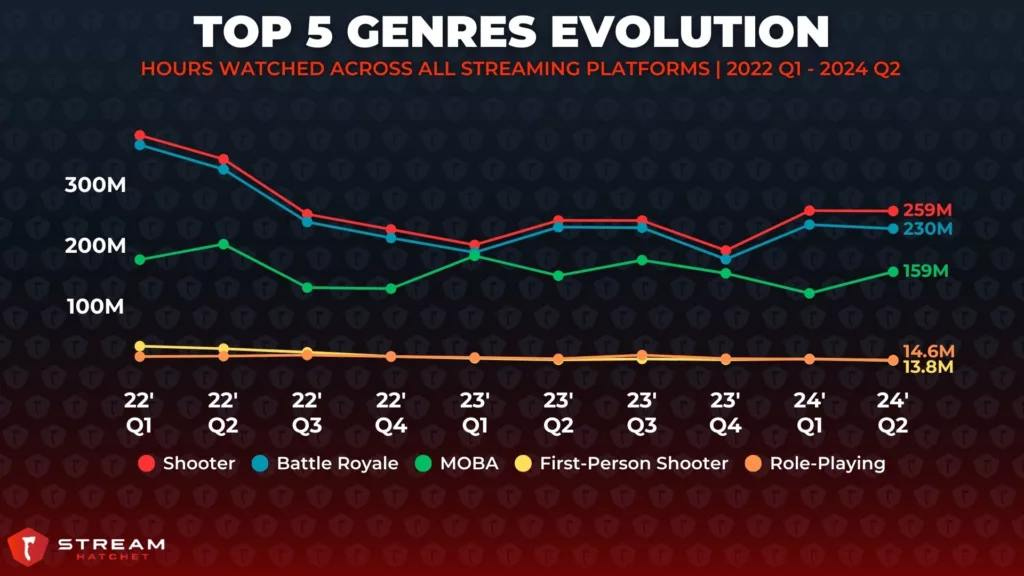
- The most popular genres for streaming in the mobile market are shooters (259 million hours watched in Q2'24); Battle Royale (230 million hours); and MOBA (159 million hours).
game: The German Gaming Market declined in H1'24
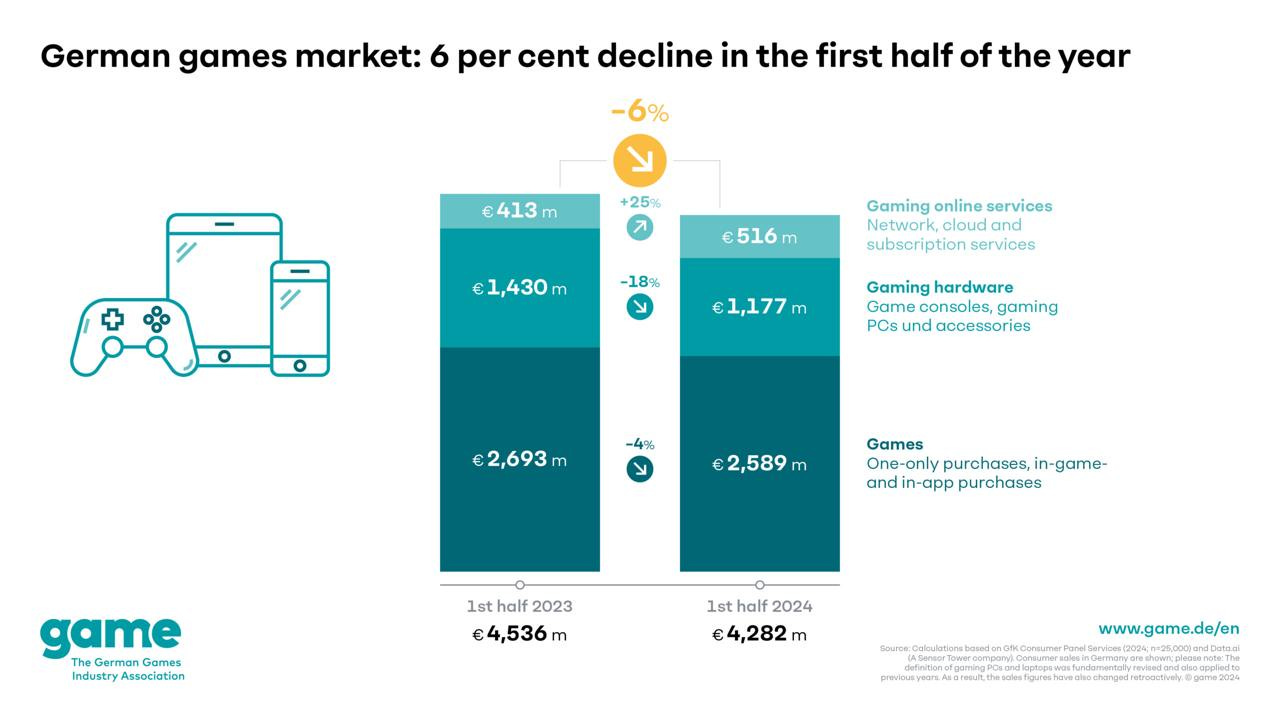
Data provided by GfK and data.ai (Sensor Tower).
- For the first time in a long while, the German market showed negative results in the year's first half. Revenue for H1'24 amounted to €4.3 billion, which is 6% less than the same period in 2023.
- Sales of gaming hardware decreased by 18% (from €1.43 billion to €1.177 billion); sales of gaming content fell by 4% (from €2.693 billion to €2.589 billion). The only segment that grew was online services, including various subscriptions, which increased by 25% (from €413 million to €516 million).
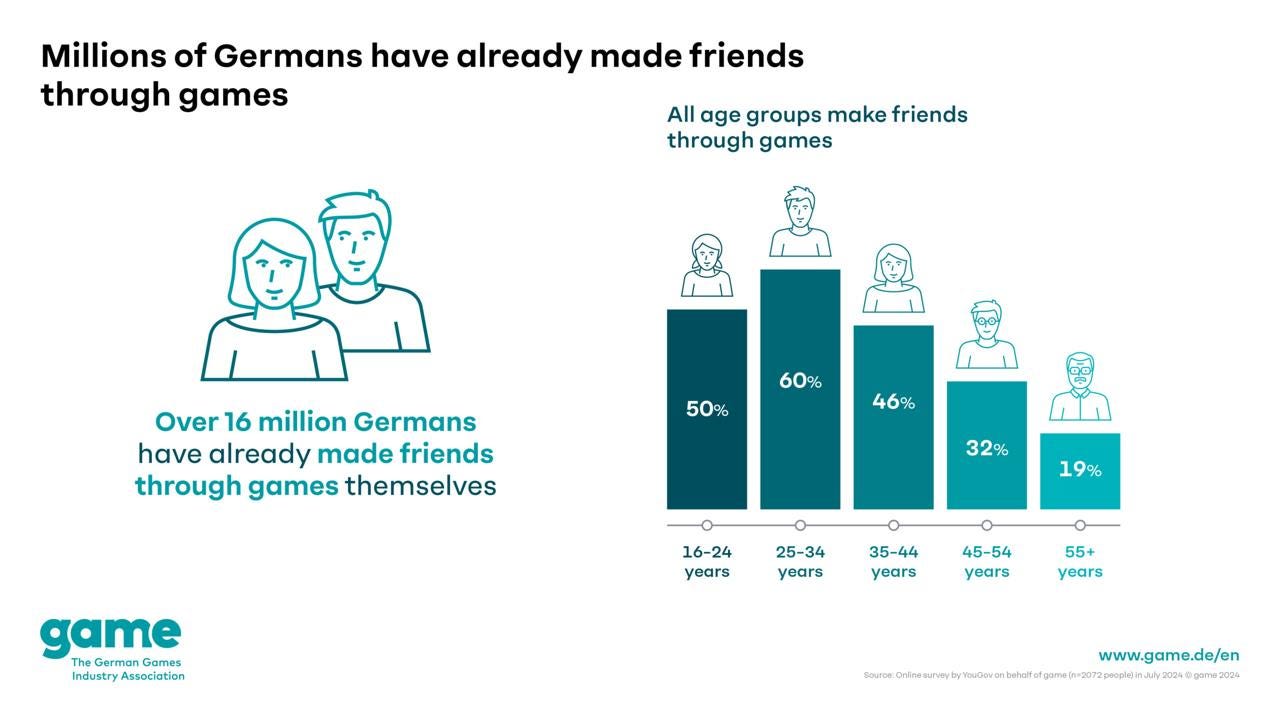
- In the report, the German association highlighted the social significance of games. 16M Germans made new friends through games.
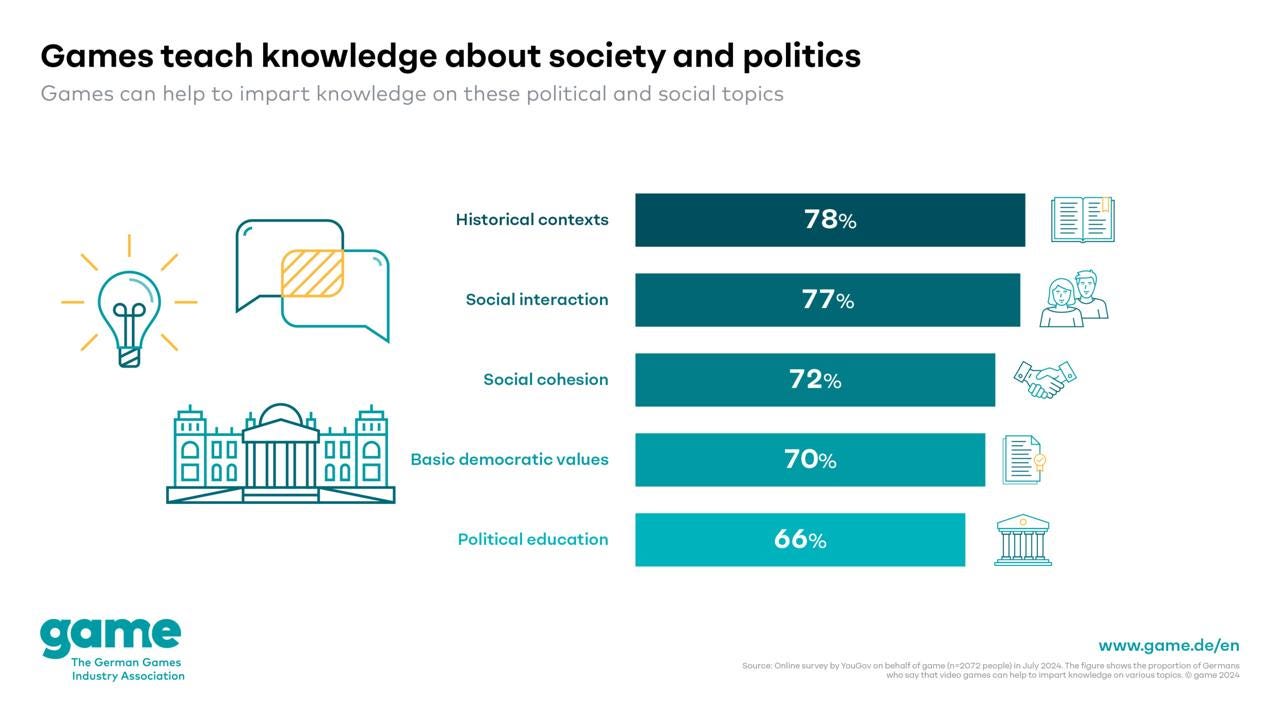
- 78% of German players reported that games help them better understand history; more than 70% noted that games are crucial for building social connections.
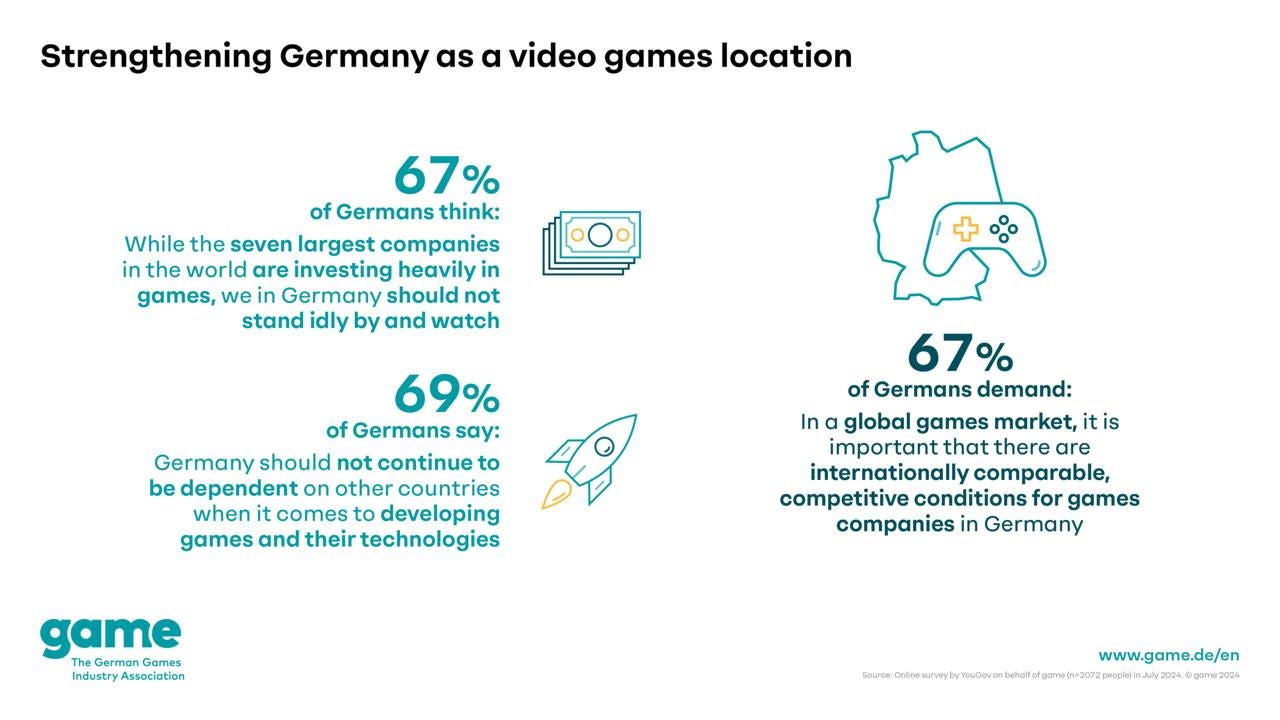
- 67% of Germans believe that the local gaming industry should be independent and competitive on international markets.
Sensor Tower: RPG Revenue Declines in South Korea
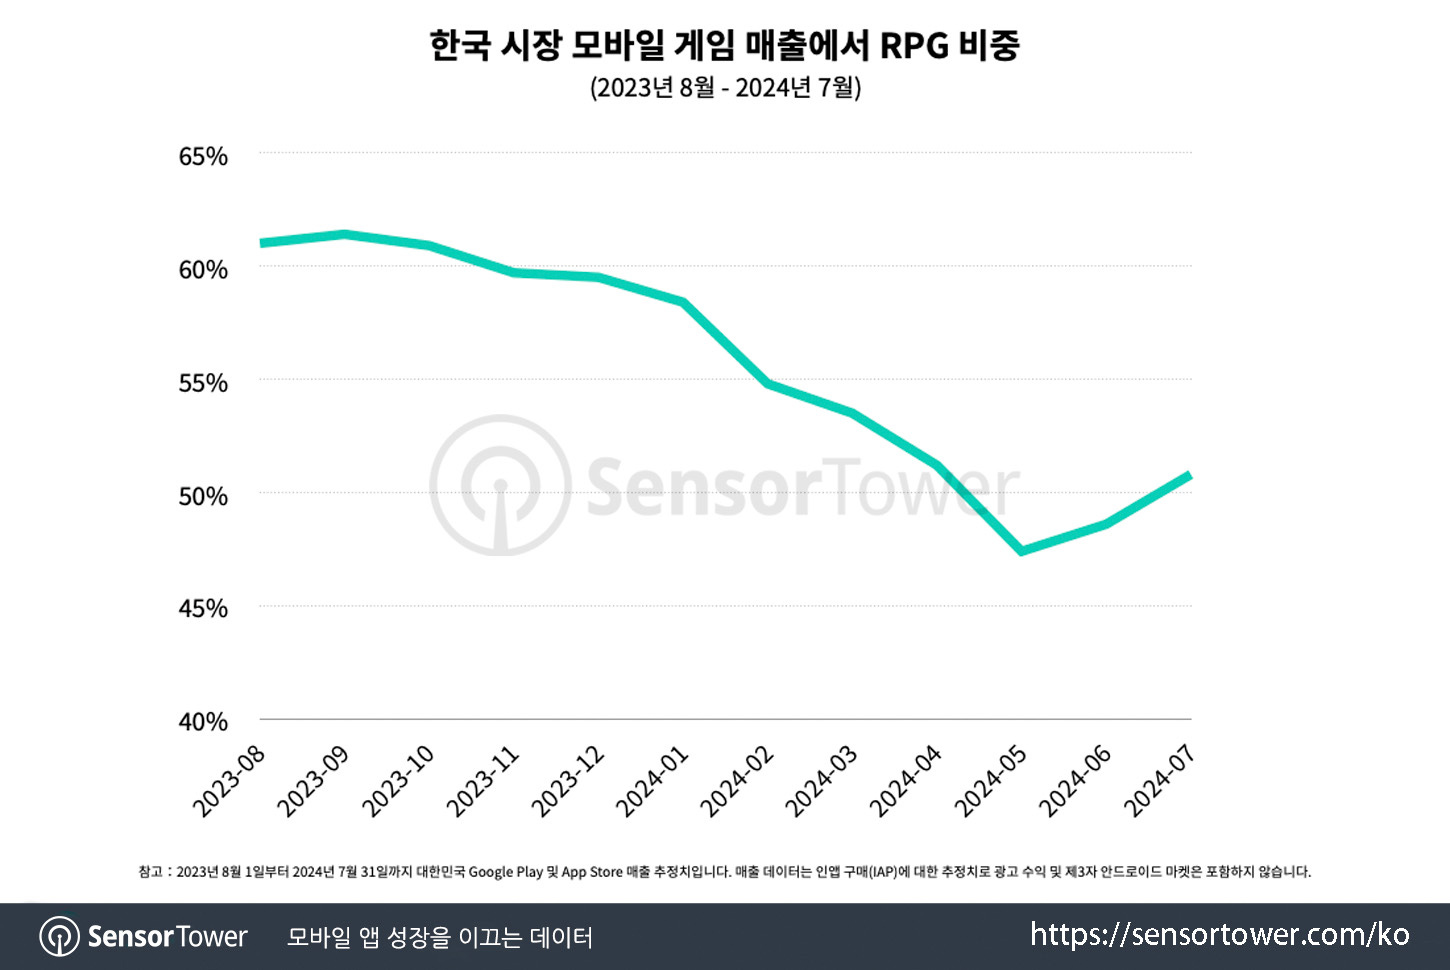
- The share of RPGs in the revenue structure of the South Korean mobile market has been declining since 2022. In May 2024, their revenue share fell below 50% for the first time in recorded history.
- MMORPGs are significantly losing popularity. Their revenue share in the RPG genre was 78.8% in 2020, but by 2024, it had decreased to 56.2%.
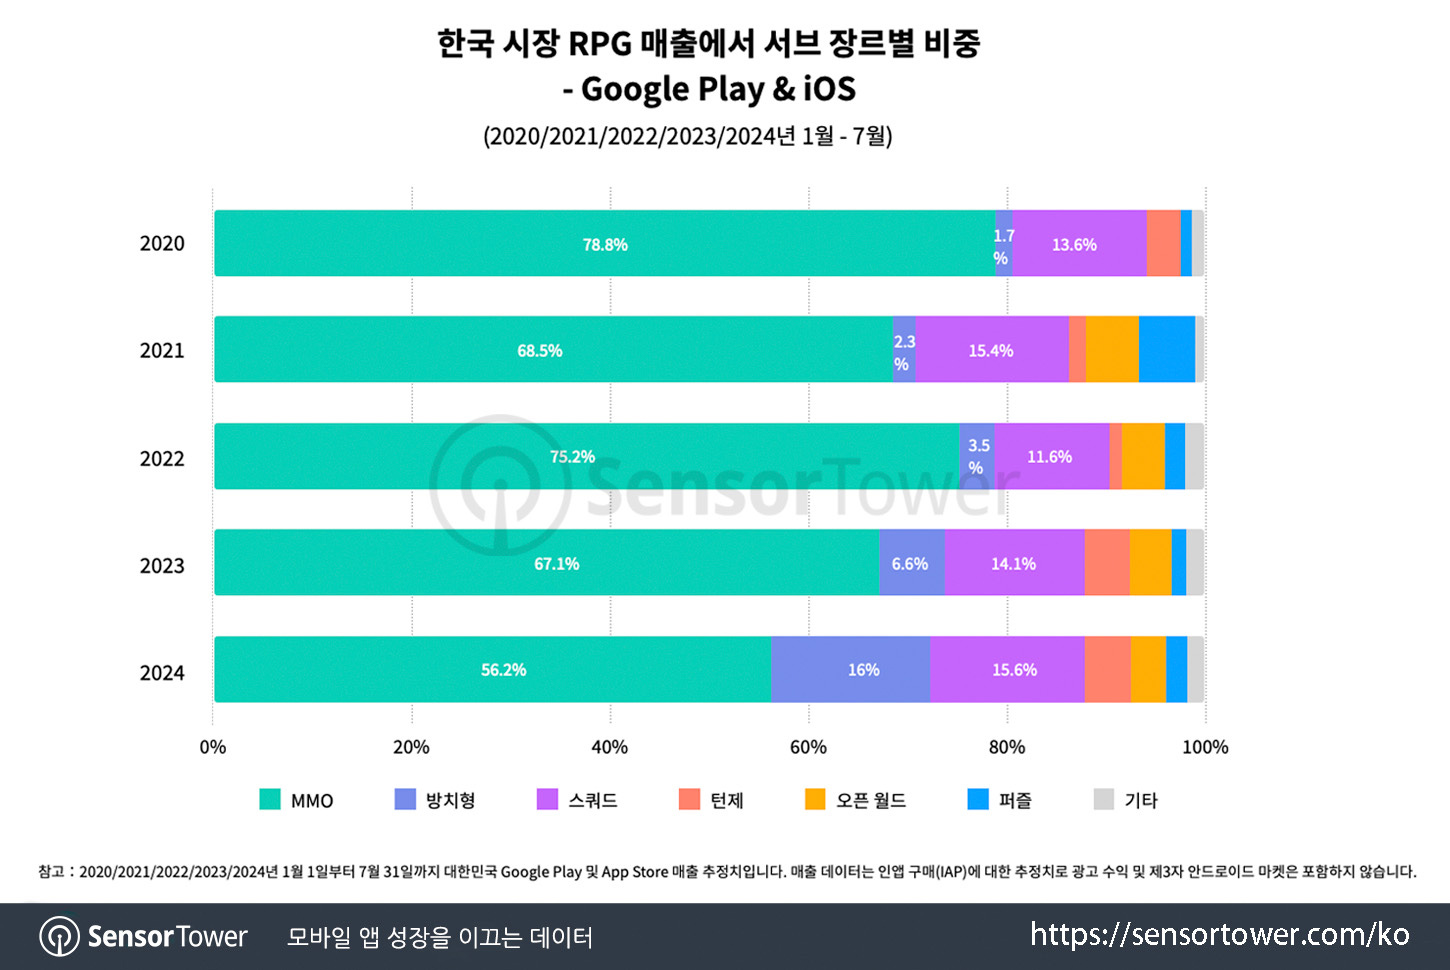
- Meanwhile, the Idle RPG segment is showing significant growth. In 2020, they accounted for only 1.7% of the genre's revenue, but by 2024, this had risen to 16%. Squad RPGs also hold a considerable share (11-15%). The launch of Honkai: Star Rail and Reverse: 1999 contributed to the share of turn-based RPGs growing to 4.7%.
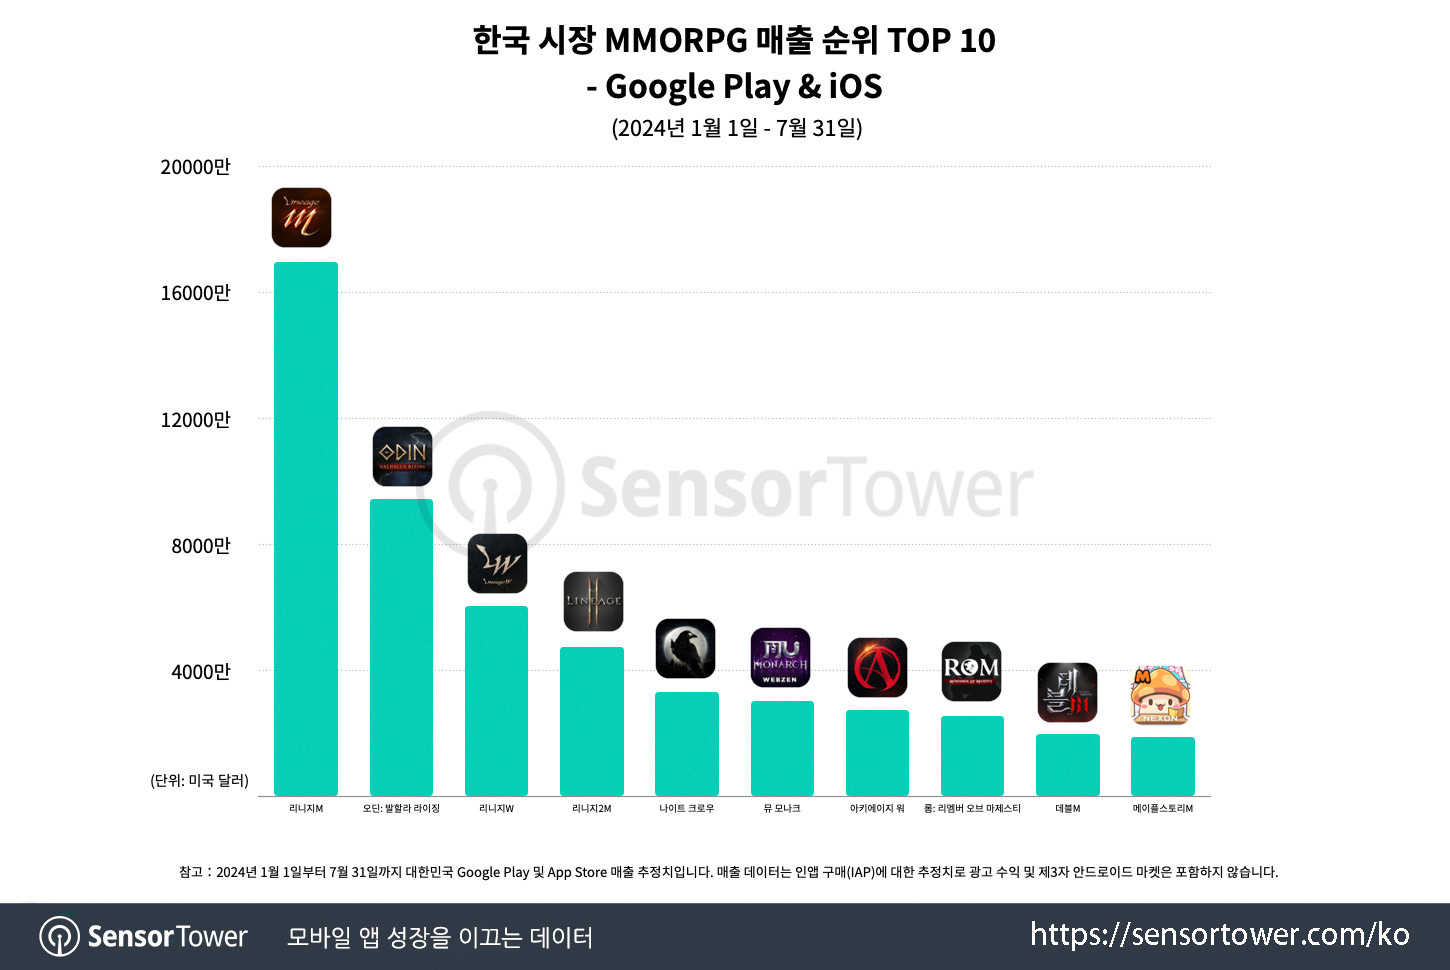
- Despite the significant decline, MMORPGs still dominate the South Korean market. In 2024, four MMORPG projects made it into the top 10 (compared to 7 in 2023, 5 in both 2021 and 2022, and 7 in 2020). Lineage M, Odin: Valhalla Rising, Lineage W, Lineage 2M, Night Crow, and MU Monarch are the most popular MMORPGs in the country.
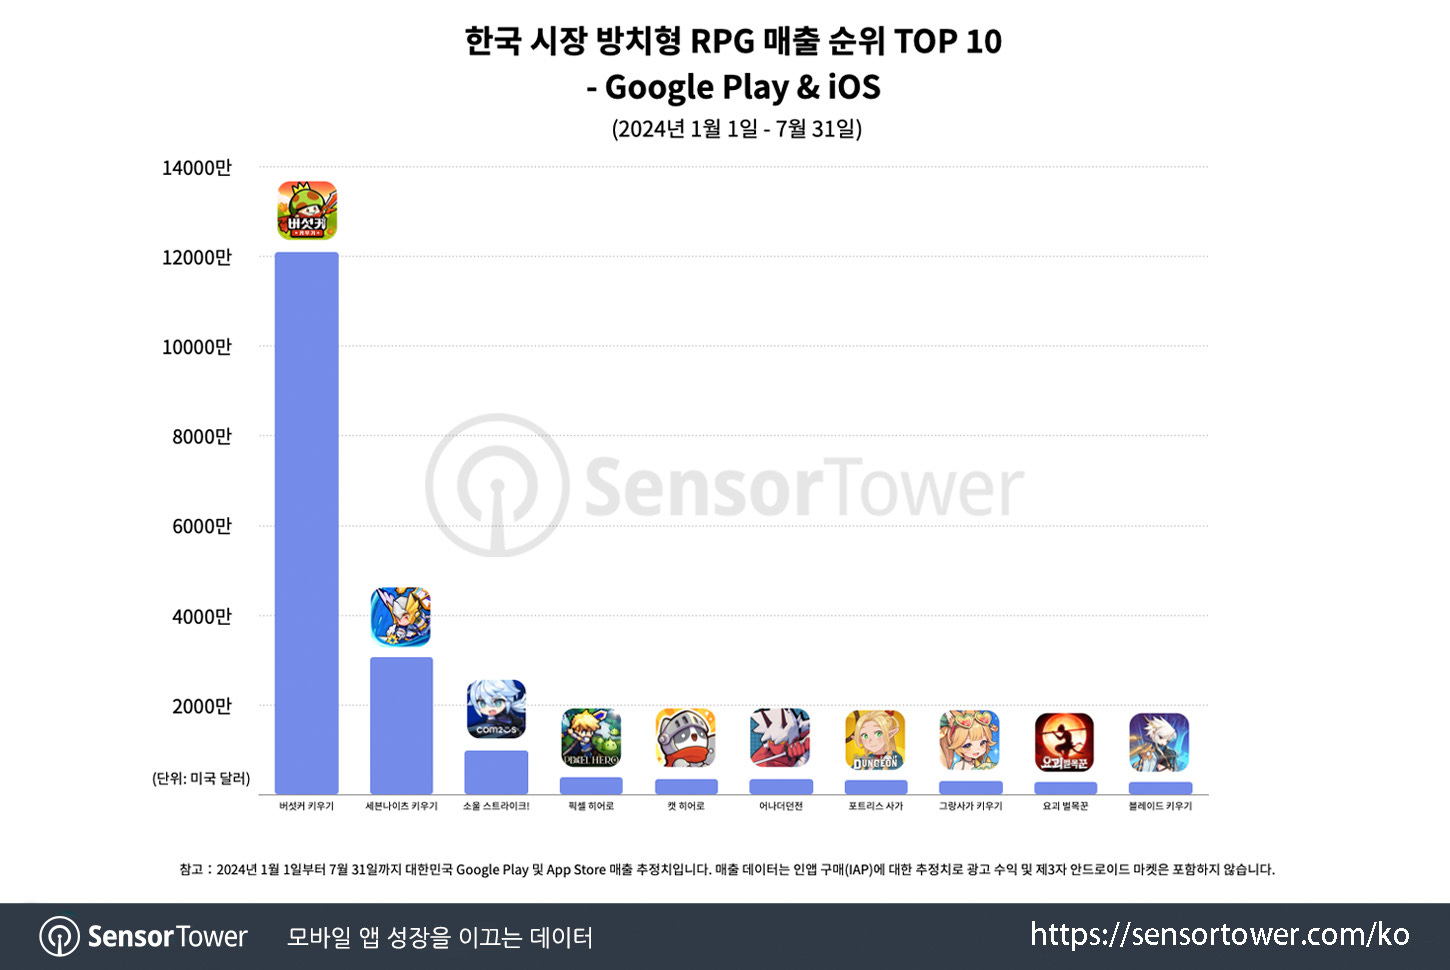
- Legend of Mushroom became the third highest-grossing game in South Korea in the first half of the year, and it is by far the most popular Idle RPG.
- Sensor Tower notes that user habits limit MMORPG growth. In Idle RPGs, people spend less time—5.21 sessions per day with a total duration of 50.42 minutes. In contrast, people spend 135 minutes per day in MMORPGs (5.4 sessions). People simply don’t have enough time for other games. Additionally, the Idle RPG audience is slightly younger (32 years old on average versus 36 for MMORPGs), and there is a higher percentage of people under 25 years old (16% versus 10% for MMORPGs).
Sanlo: Mobile Web Shops in 2024

The company surveyed 5,050 mobile players in the USA, Canada, the UK, Germany, and Japan. 52% were women; and 48% were men; the survey was conducted among players who played mobile games at least once in the past 30 days. 85% of respondents made at least one transaction in mobile games in the last 12 months.
❗️Sanlo is a company that provides web shops to gaming companies.
- 81% of respondents stated they are aware of the existence of web shops in some mobile games. The same percentage mentioned they had visited web shops.

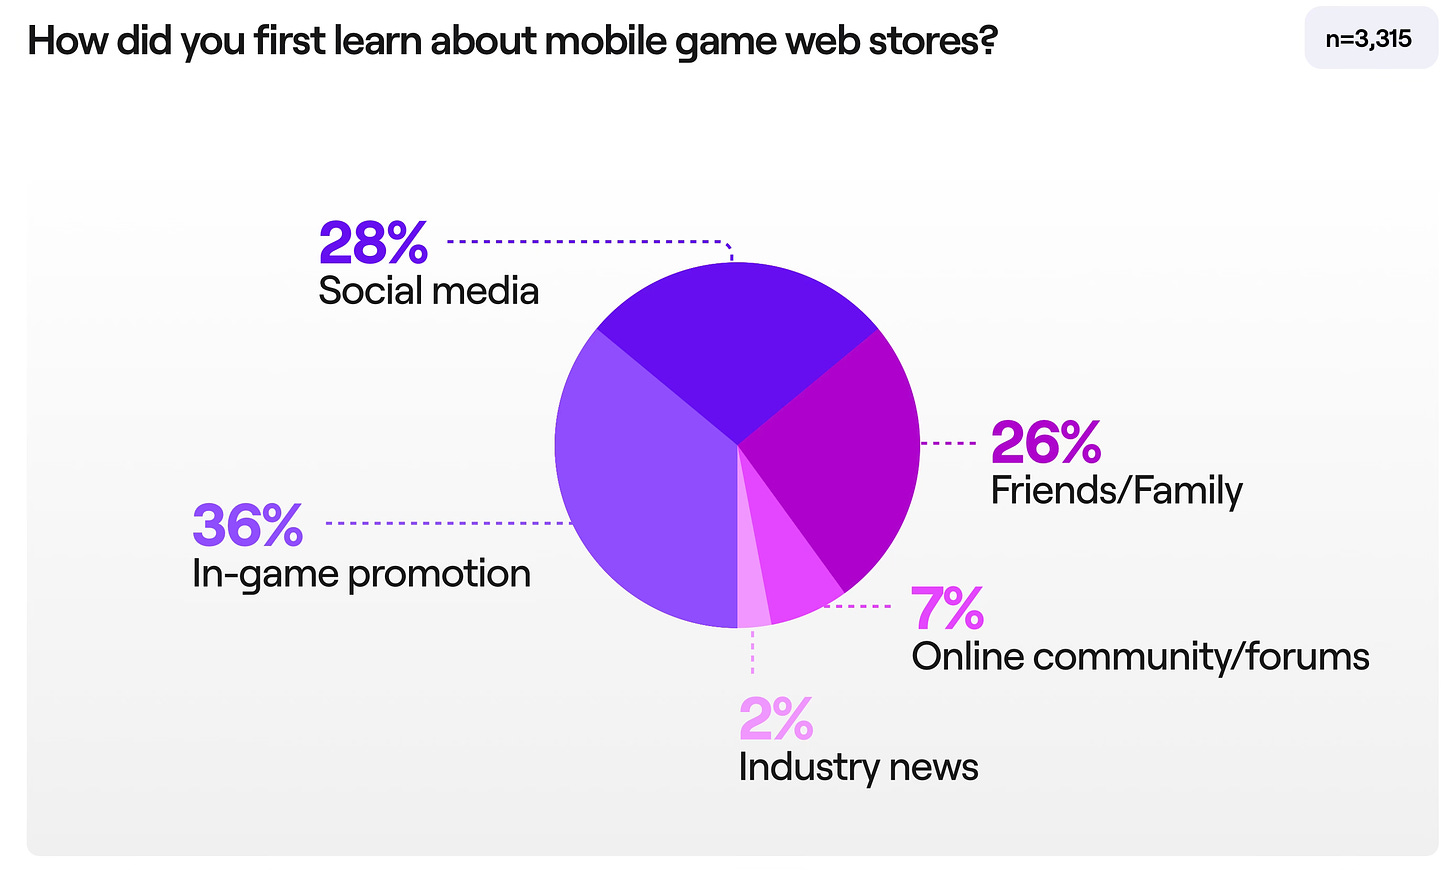
- Among those aware of web shops, 36% learned about them through in-game promotions; 28% through social media; 26% from friends or family members; 7% from community or forums; and 2% from industry news.
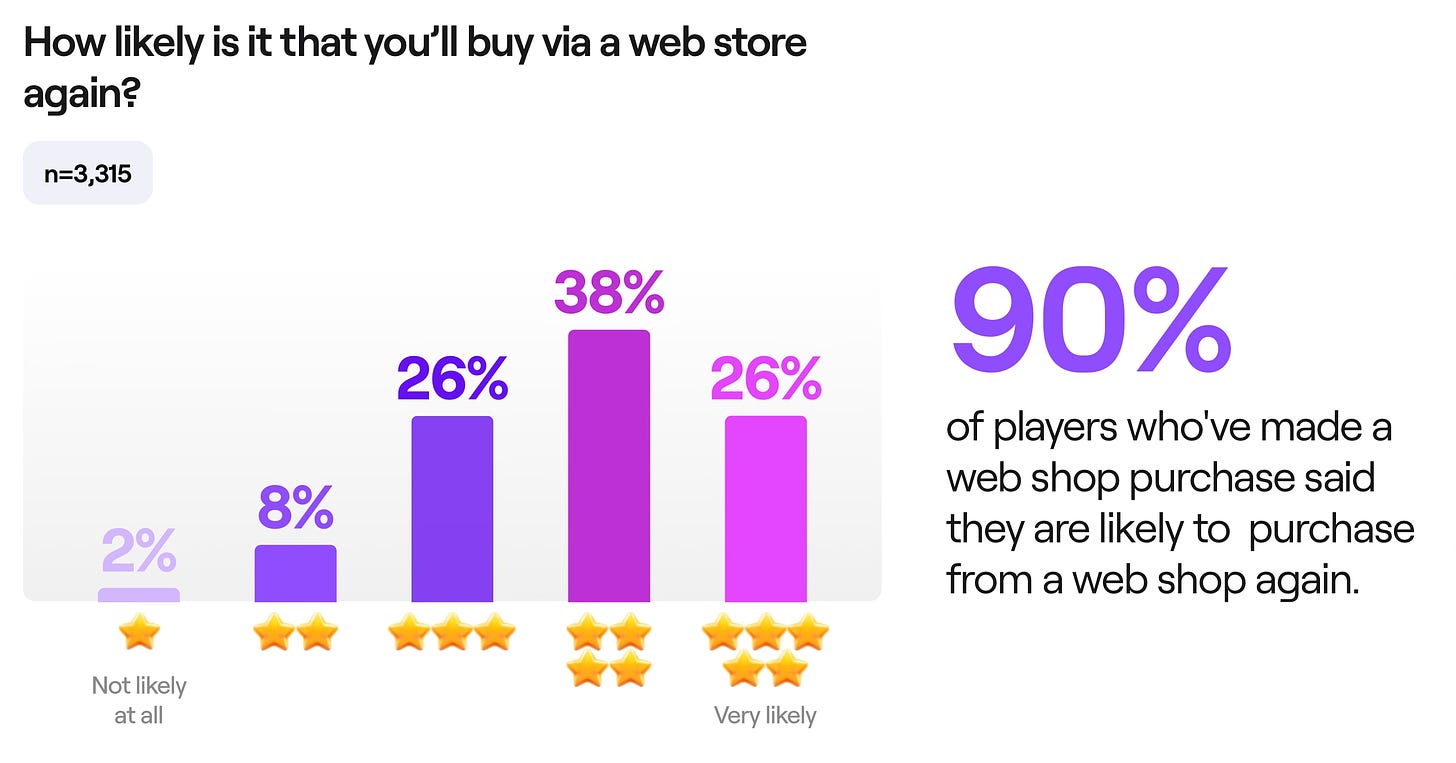
- 77% of respondents said they had made purchases in a webshop.
- 90% of those who have already made a purchase noted they would continue to do so in the future.
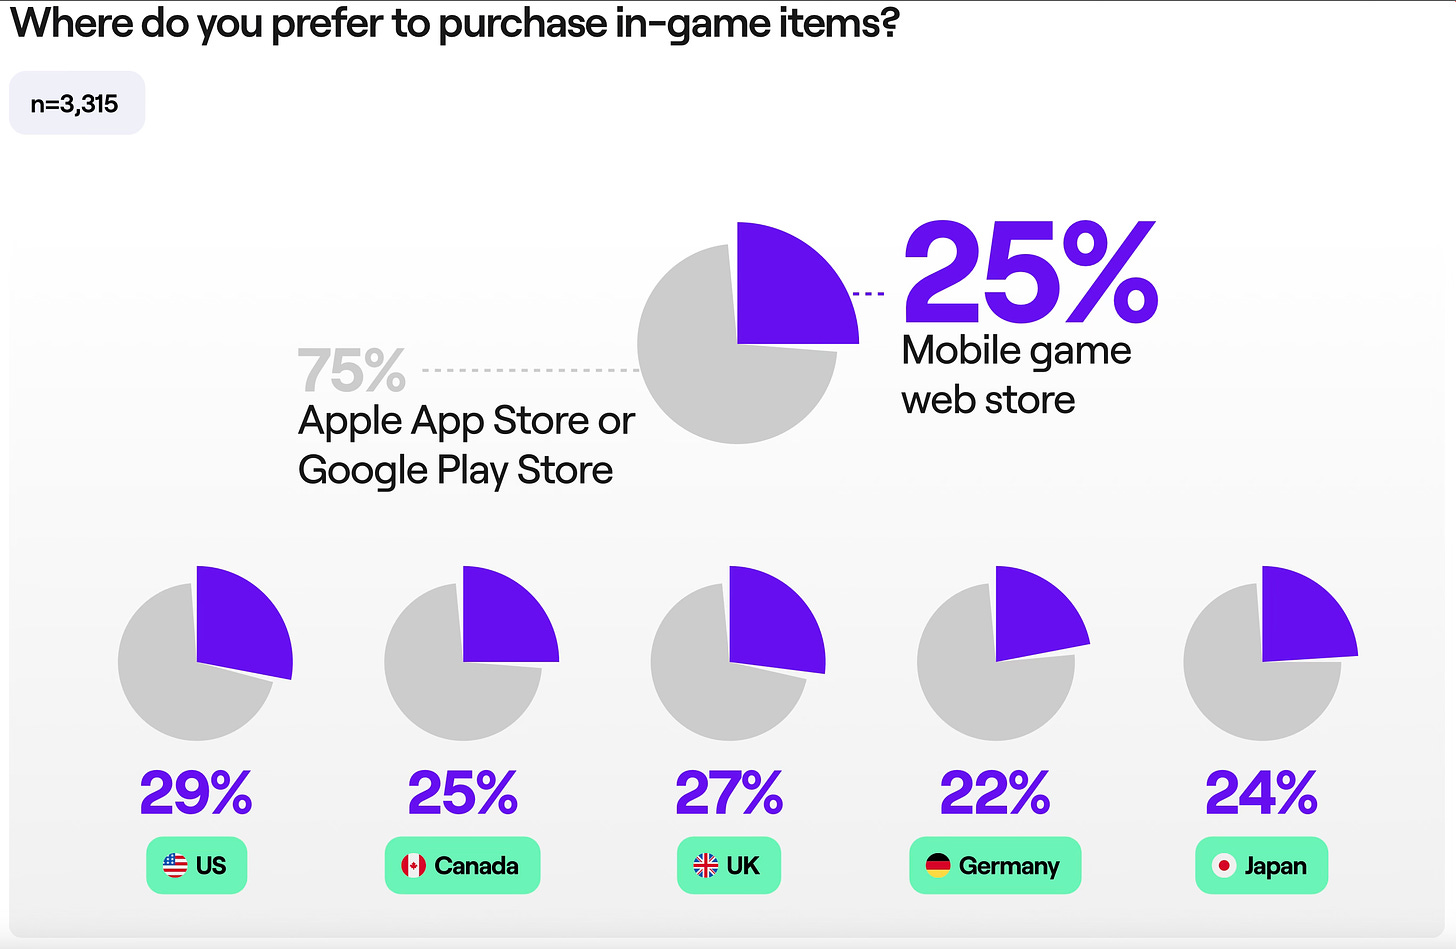
- However, when it came to preferences and where it is more convenient to shop, 75% of users said they would prefer to make purchases in the App Store or Google Play. People don’t like to change their habits.
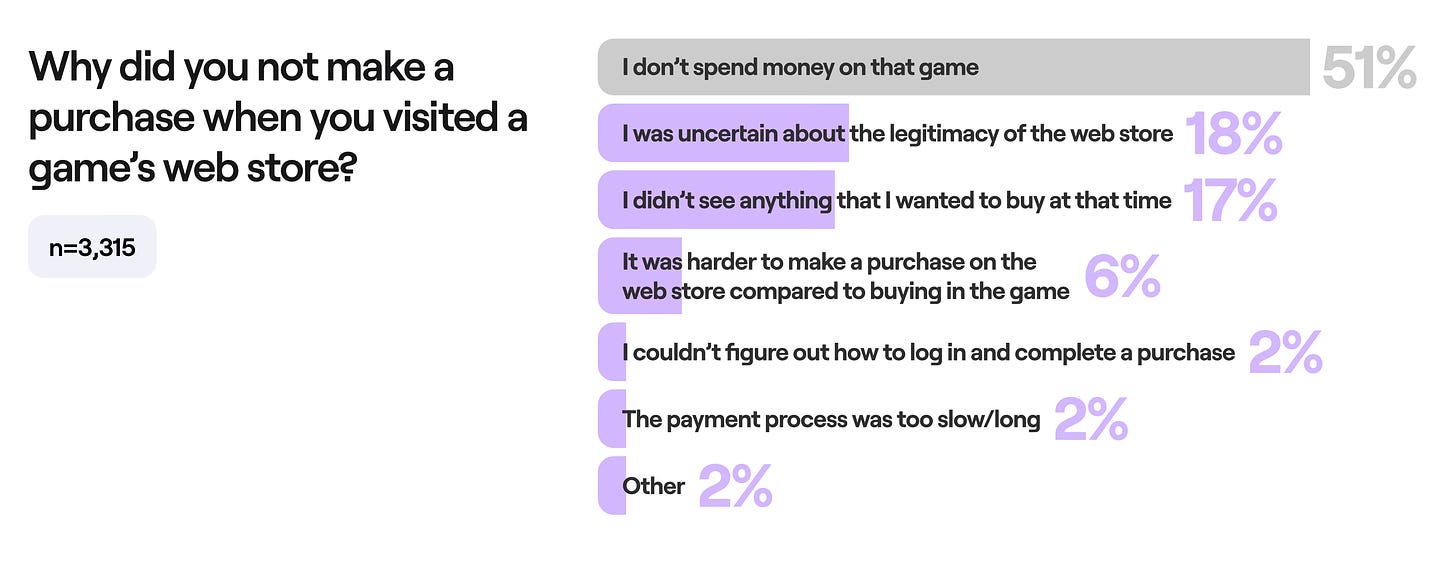
- Among those who make purchases, 18% of users stated that they hadn’t made a transaction in a web shop because they were unsure of its legitimacy. 17% said they didn’t see an offer worth paying for. 6% noted that it was more difficult to purchase in the webshop. 2% could not figure out the authorization process; the same percentage said the payment process was too slow and/or lengthy.
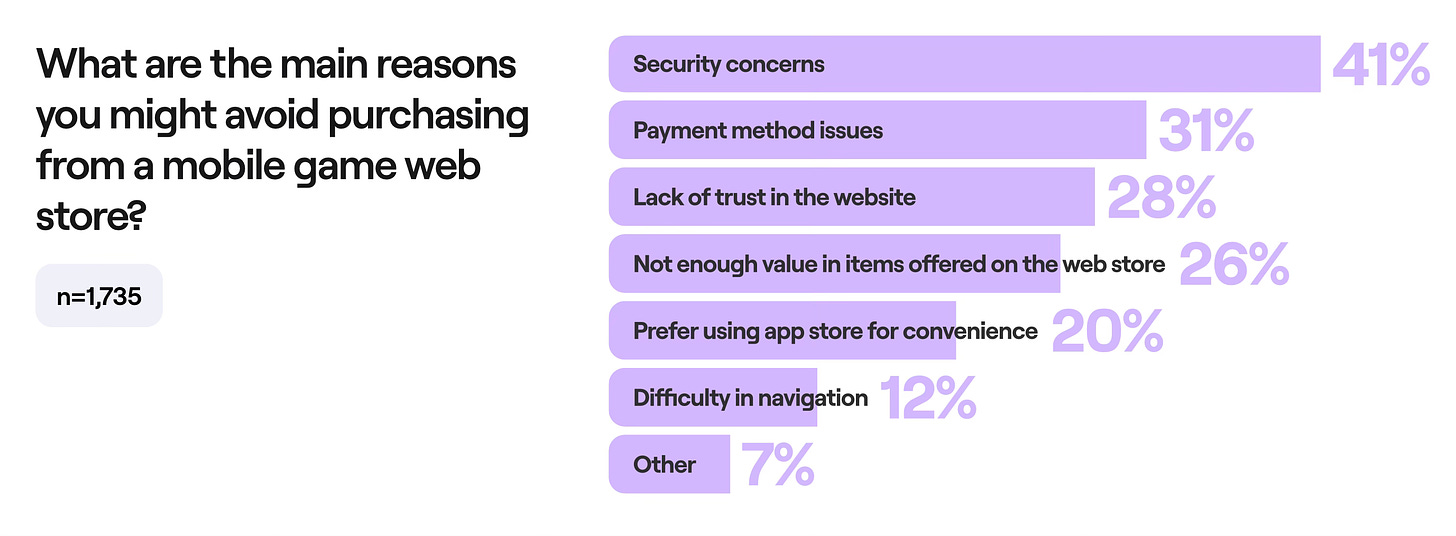
- For those who don’t pay in web shops, the reasons are as follows: 41% are unsure about security; 31% face payment method issues; 28% don’t trust the authenticity of the webshop; 26% don’t see value in paying through a webshop; 20% prefer app stores for convenience; 12% note difficulty in navigation.
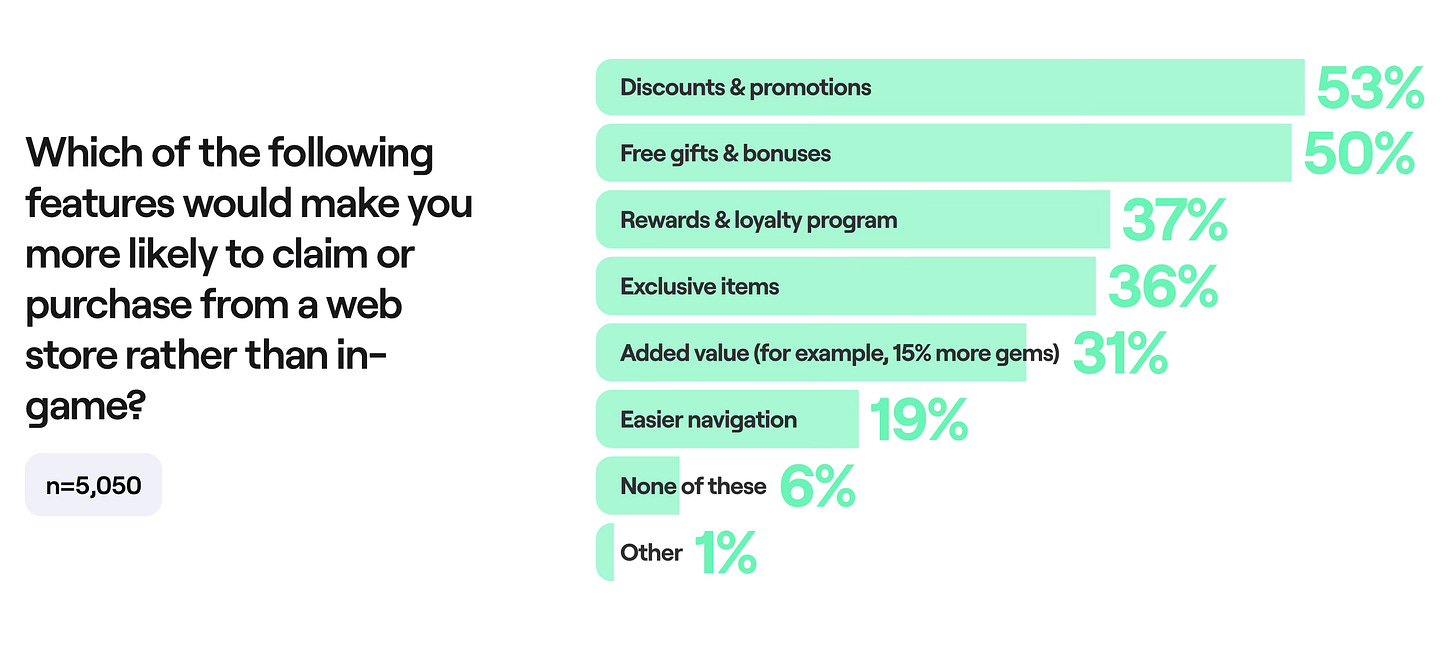
- 53% of users said they could be motivated to make purchases in web shops by discounts and special offers; 50% by gifts and bonuses; 37% by loyalty programs; 36% by exclusive items; and 19% by simplified navigation. 6% said none of these factors mattered to them.
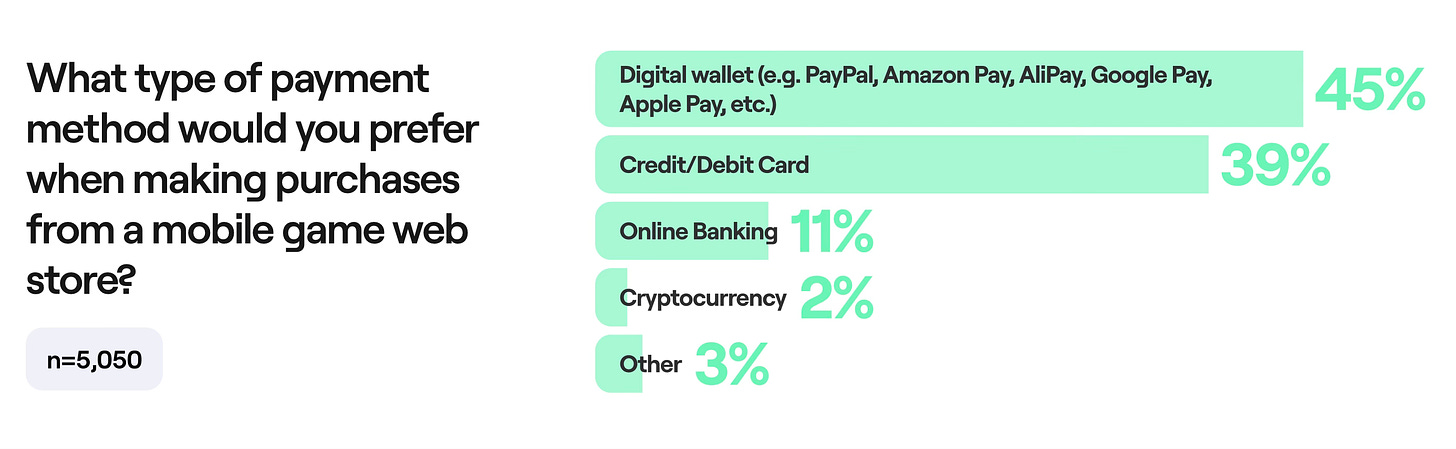
- Digital payment methods (PayPal, Amazon Pay, AliPay, Google Pay, Apple Pay) are convenient for 45% of the audience. Next are cards (39%), online banking (11%), and cryptocurrencies (2%).
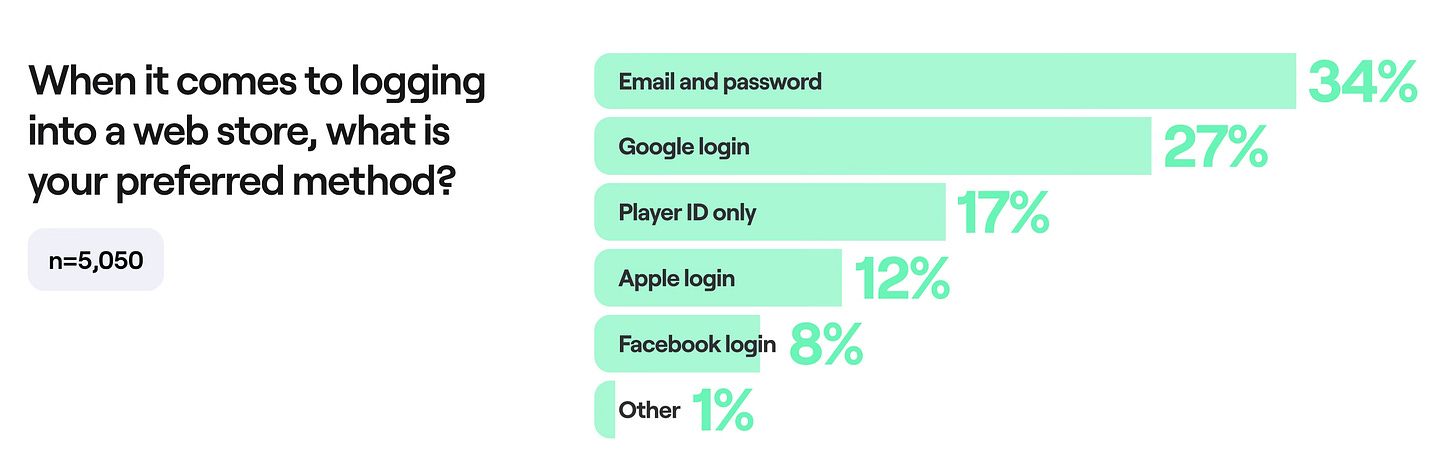
- People still find it most convenient to log in with email and password (34%). Following that is Google authorization (27%), Player ID (17%), Apple (12%), and Facebook (8%).
- Statistics show that most of the audience is unaware of the 30% commission on the App Store and Google Play.
- 26 mobile games in the top 100 by revenue have integrated web shops. These include Honor of Kings, Brawl Stars, Coin Master, Pokemon GO, PUBG Mobile, Call of Duty: Mobile, and Garena: Free Fire.
Niko Partners & Saudi Esports Federation: Gulf Countries Market, User Preferences, and Localization
The report focuses on the Gulf Cooperation Council (GCC) countries – Bahrain, Kuwait, Oman, Qatar, KSA, and the UAE. The total population of these countries is over 60 million, with 57% of that number being in Saudi Arabia.
General Market Information
- In 2023, there were 33.7 million players in the GCC countries, with total gaming revenue amounting to $2.24 billion. The annual ARPU across all platforms was $66.34. Saudi Arabia accounted for 49.5% of the income and 61.7% of the gaming population in these countries.
- Niko Partners forecasts that 2028 gaming revenue in these countries will reach $3.24 billion (+7.7% CAGR).
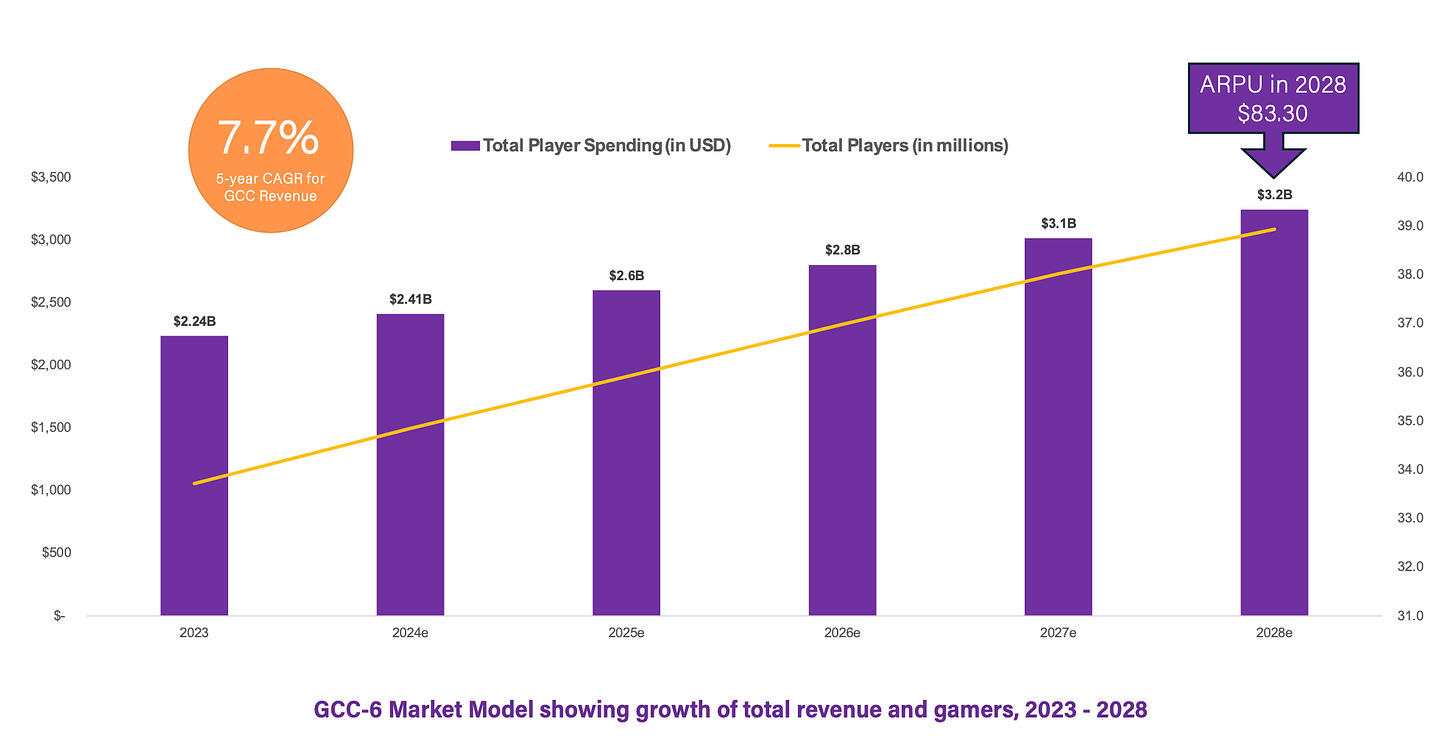
- The number of players in the GCC countries will increase to 38.9 million by 2028. This will represent a 2.9% growth per year. ARPU will reach $83.3.
- The leading countries are Saudi Arabia and the UAE. Together, they will account for approximately 80% of all revenue.
- There are currently 420 million people in the world who speak Arabic, making it the 5th most popular language globally. It is an official language in 25 countries. For comparison, the population of the USA is 331 million people.
Player Profile
In December 2023, Niko Partners surveyed 1,225 players from the GCC countries.
- 69% of gamers in these countries are male.
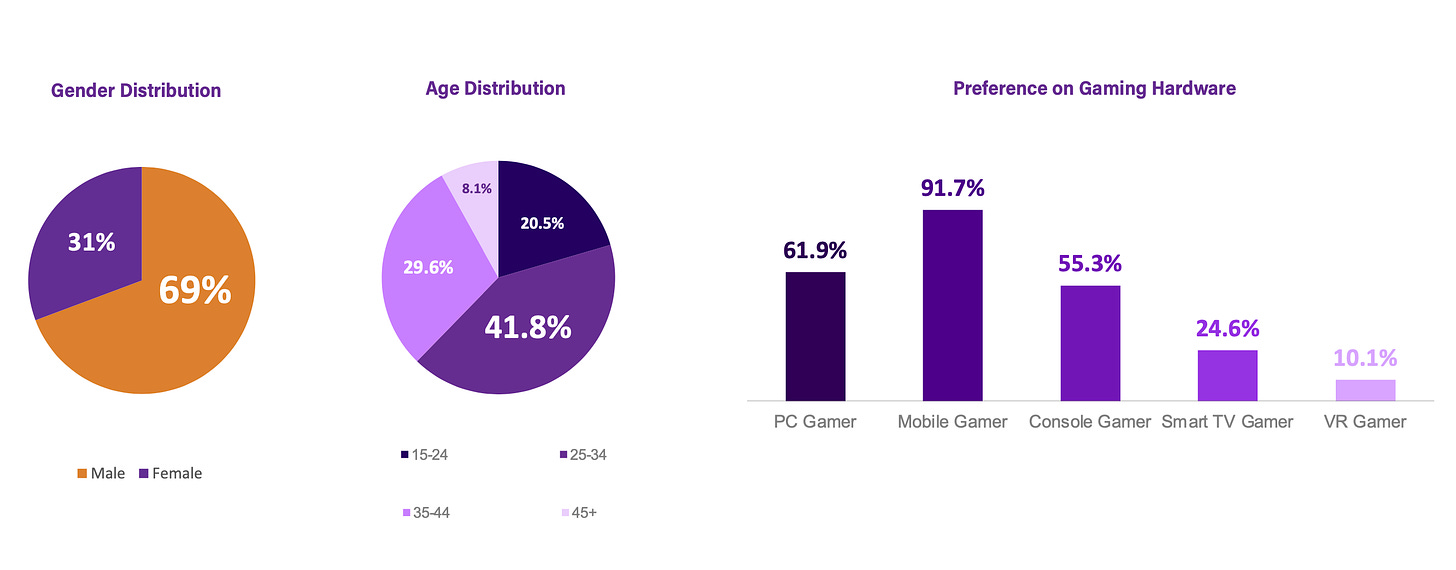
- 62.3% of respondents are under the age of 34.
- 91.7% play on mobile devices. 61.9% on PC; and 55.3% on consoles. People also said they play on Smart TVs (24.6%) and VR (10.1%).
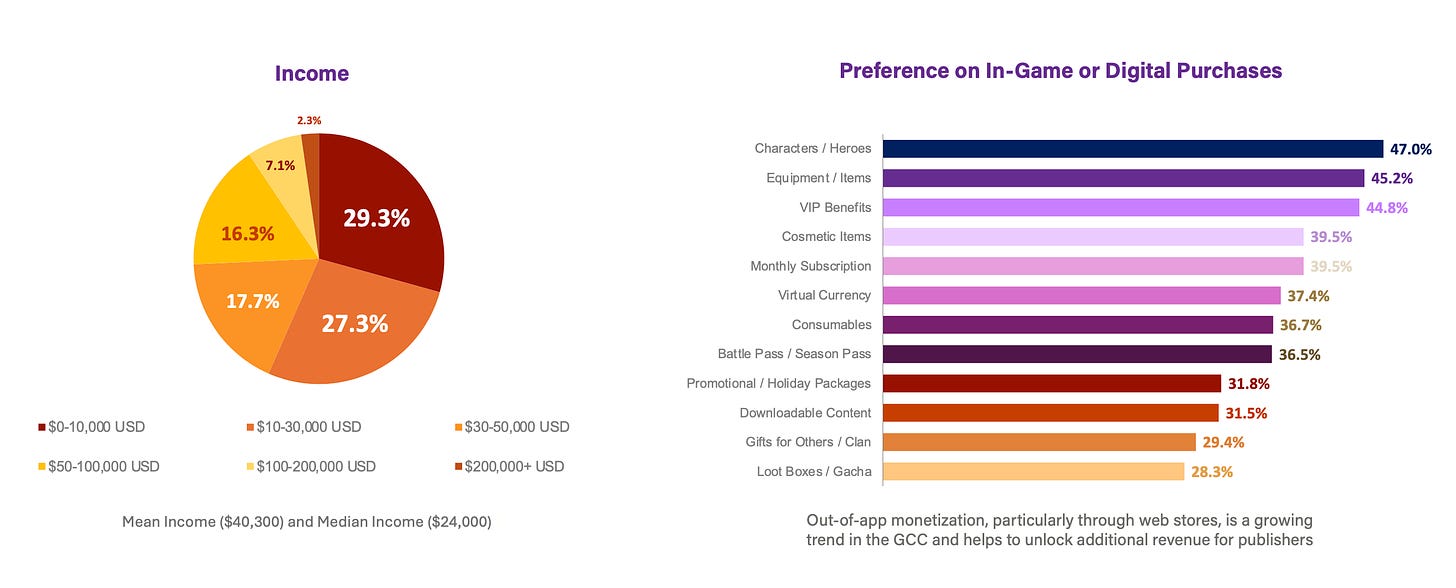
- 56.6% of respondents earn less than $30,000 a year. However, 9.4% earn more than $100,000.
- Most players prefer F2P games (83.6%). Next come premium games (66%).
- The most popular payment methods in the country are credit cards (61.2%), digital wallets (54.5%), debit cards (53.6%), gift/top-up cards (41.7%), cash (29.9%), and payment via phone (20.8%).
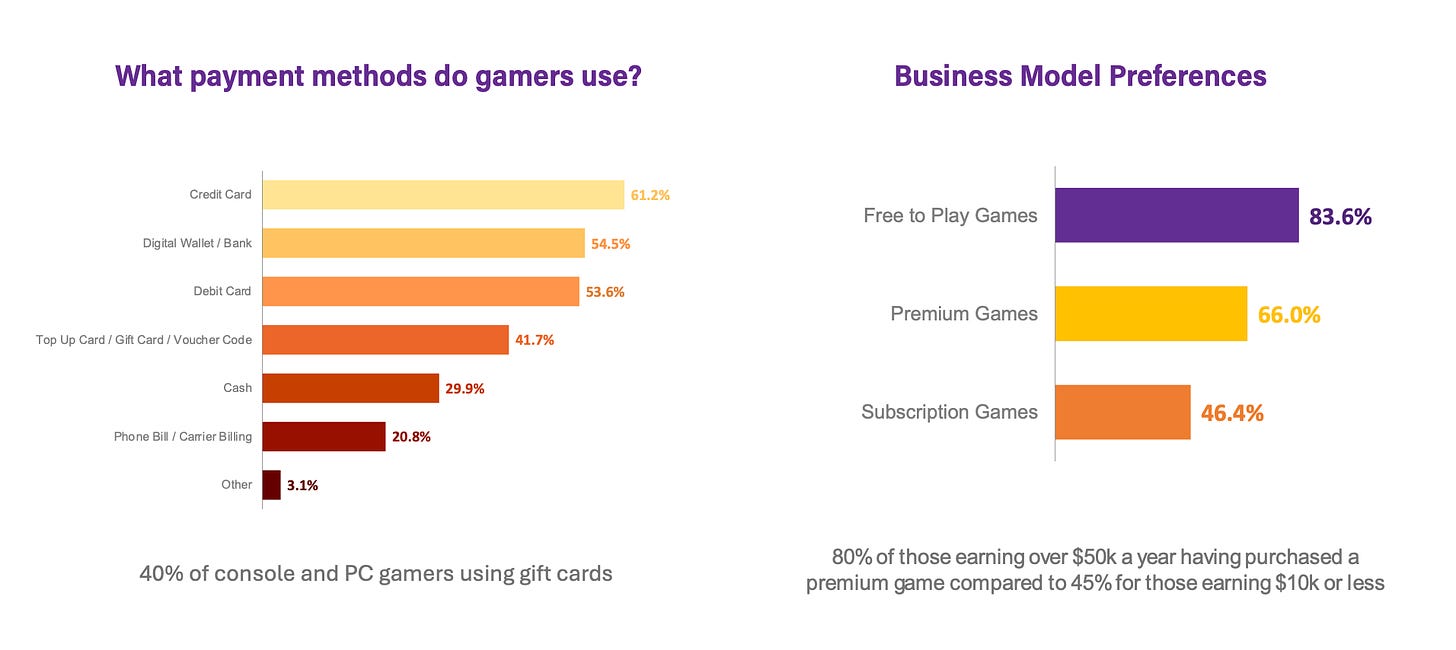
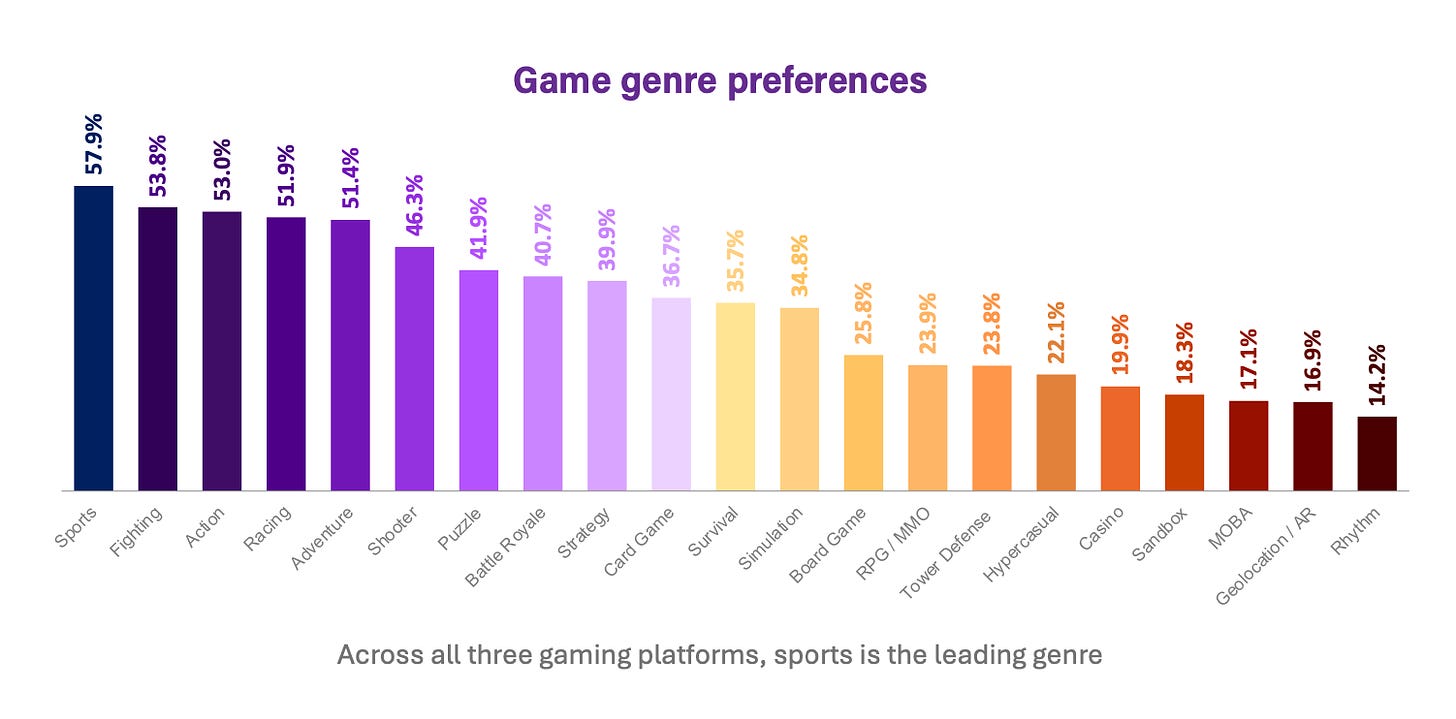
- Sports games (57.9% play), fighting games (53.8%), and action games (53%) are the most popular genres in the country.
Preferences of GCC Players
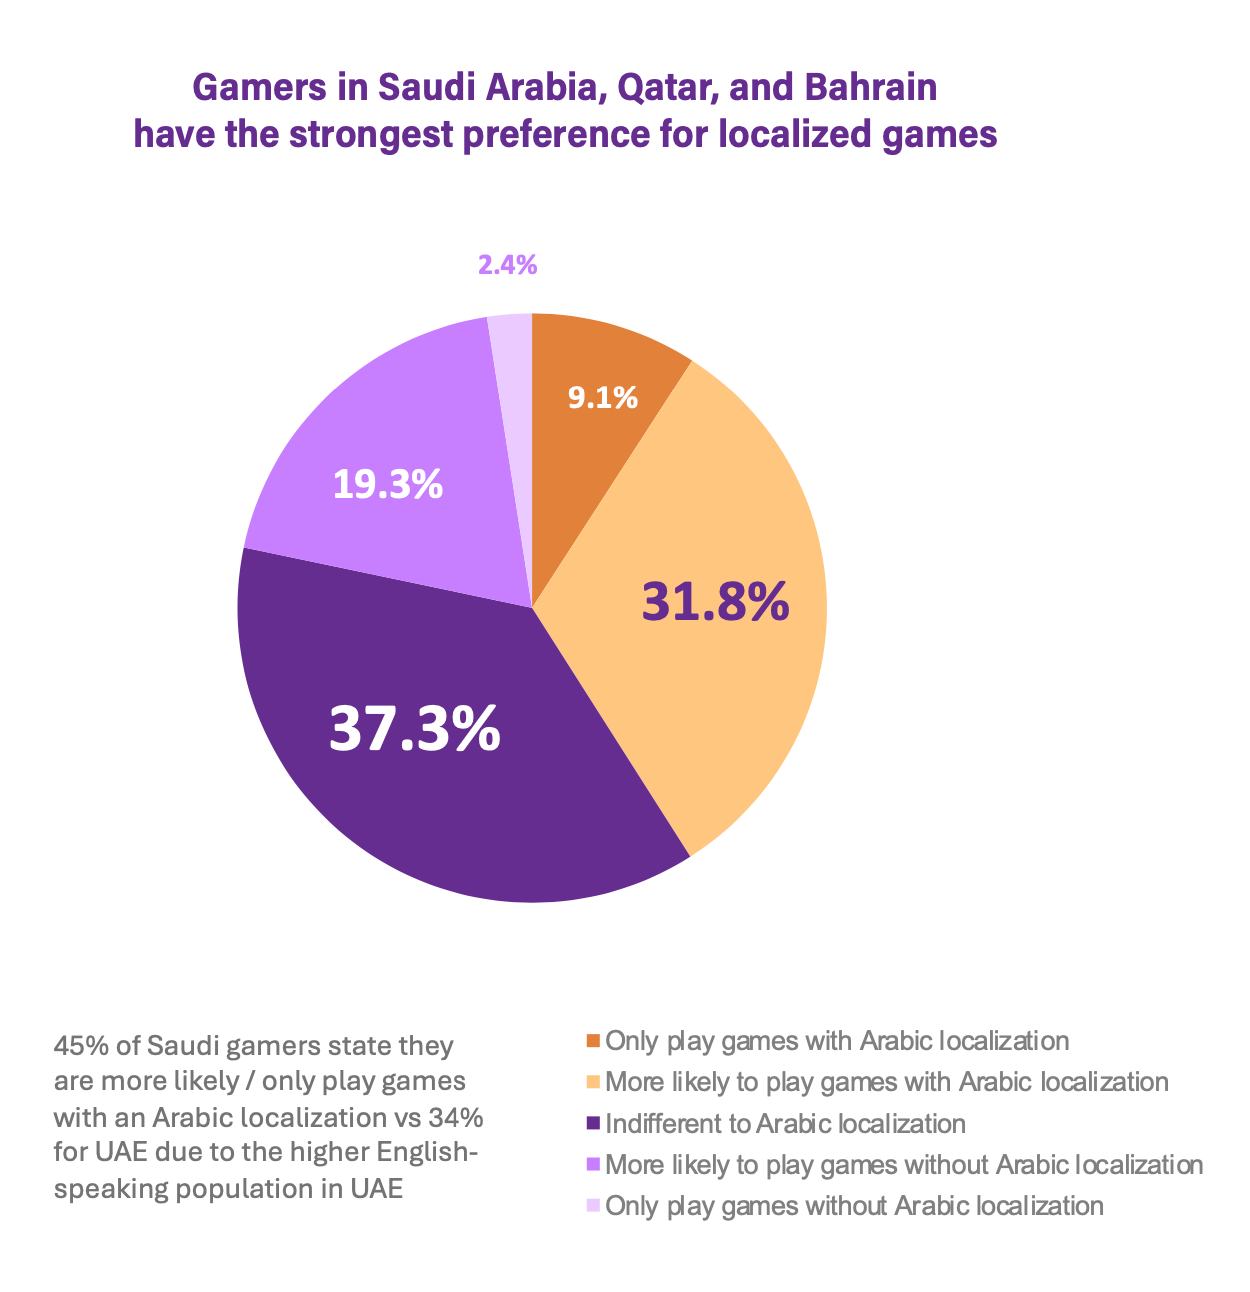
- 40.9% of players consider Arabic localization important. But for the rest, it's not a concern, as they can comfortably play in English.
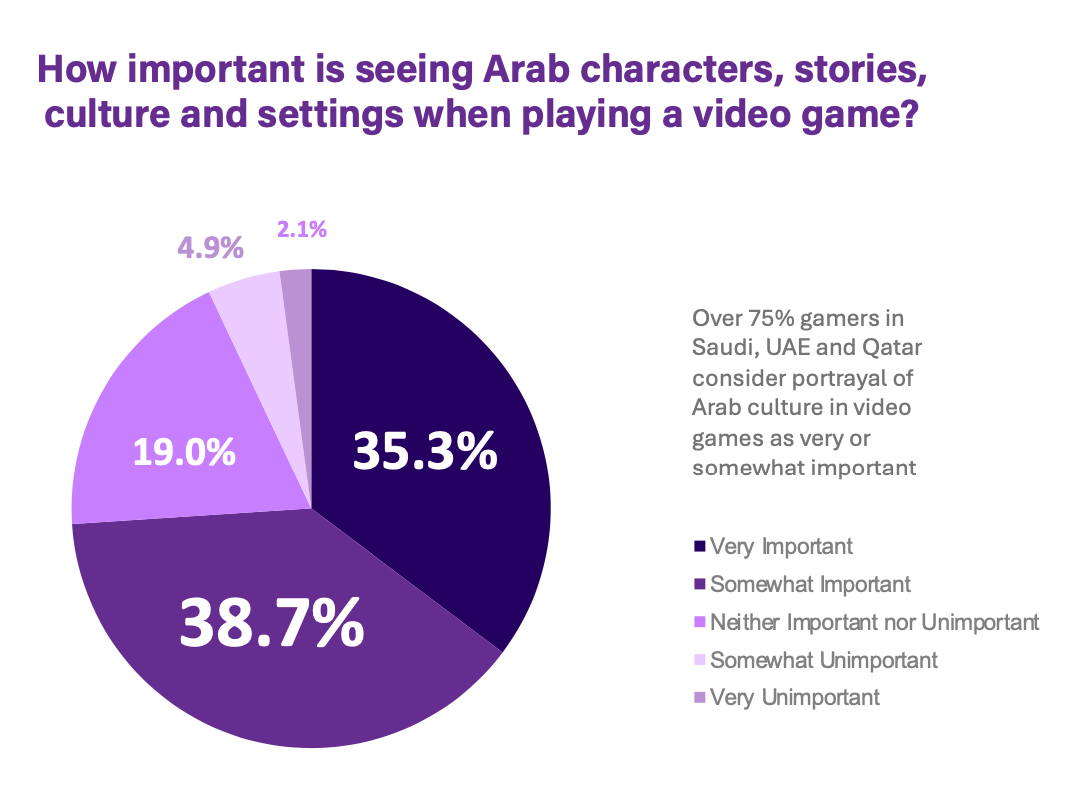
- However, 75% of players believe that seeing elements of Arab culture in games is important.
Perforce & JetBrains: Gaming Technologies in 2024

The companies surveyed 576 people from 64 countries across 6 continents. One-third of the respondents work in non-gaming industries (automotive, healthcare, finance). Companies were interested in how gaming technologies are used beyond the gaming industry.
- 53% of small and medium-sized studios face funding issues, while only 7% of large companies have this problem.
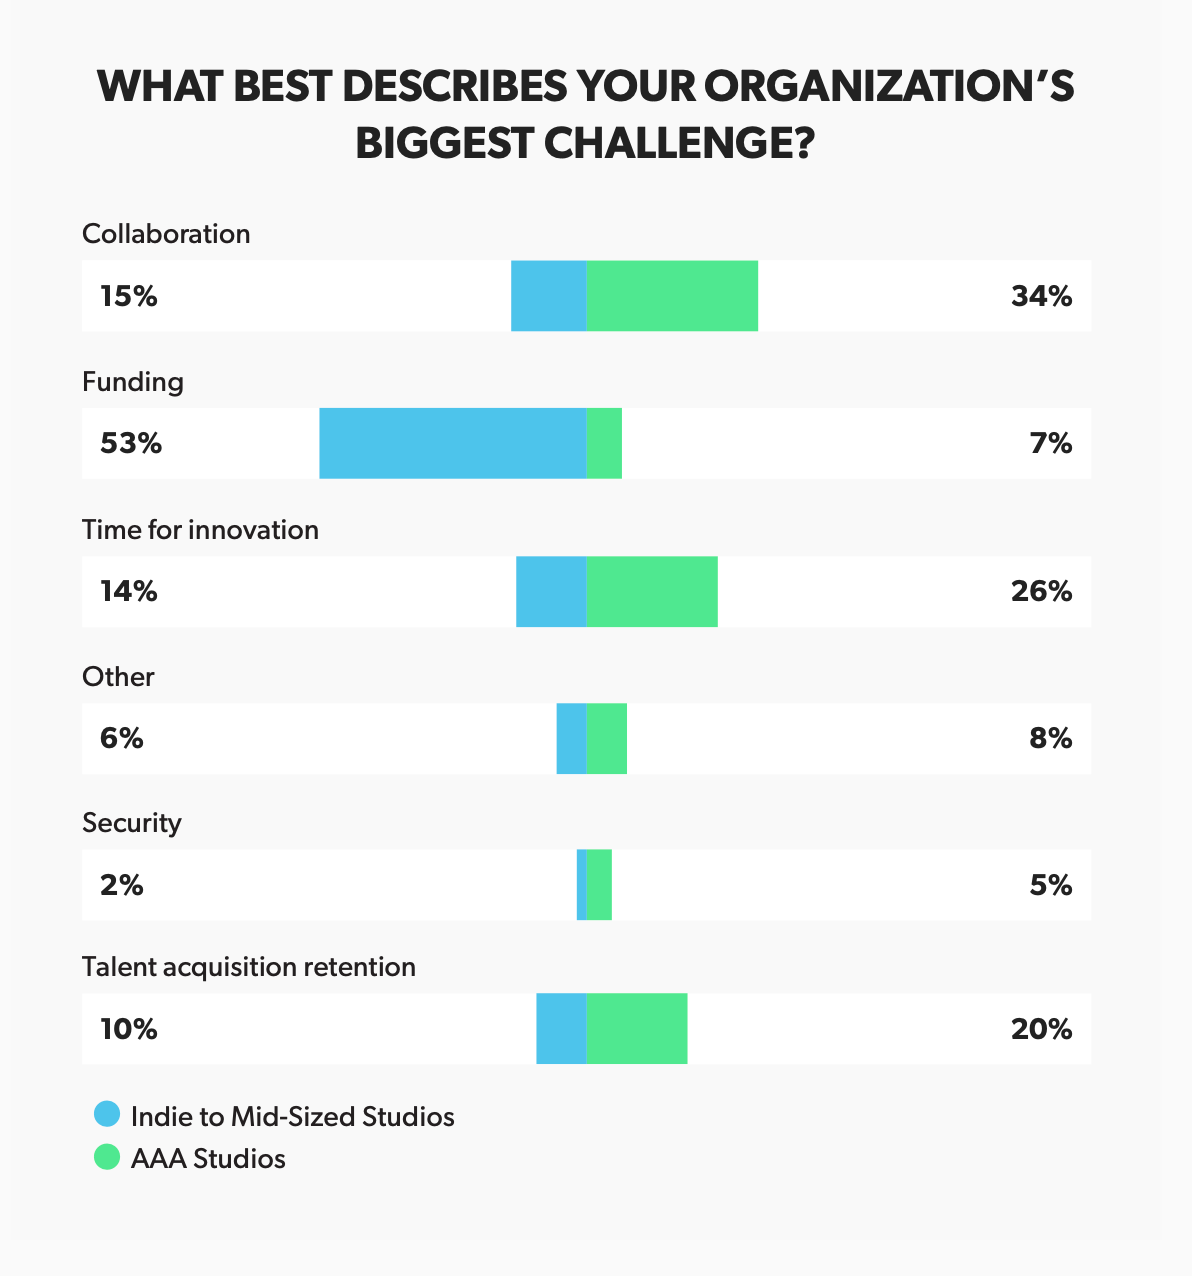
- However, large companies more frequently encounter challenges with effective collaboration (34% vs. 15% in smaller companies); the pace of innovation (26% vs. 14% in smaller companies); and talent retention (20% vs. 10% in smaller companies).
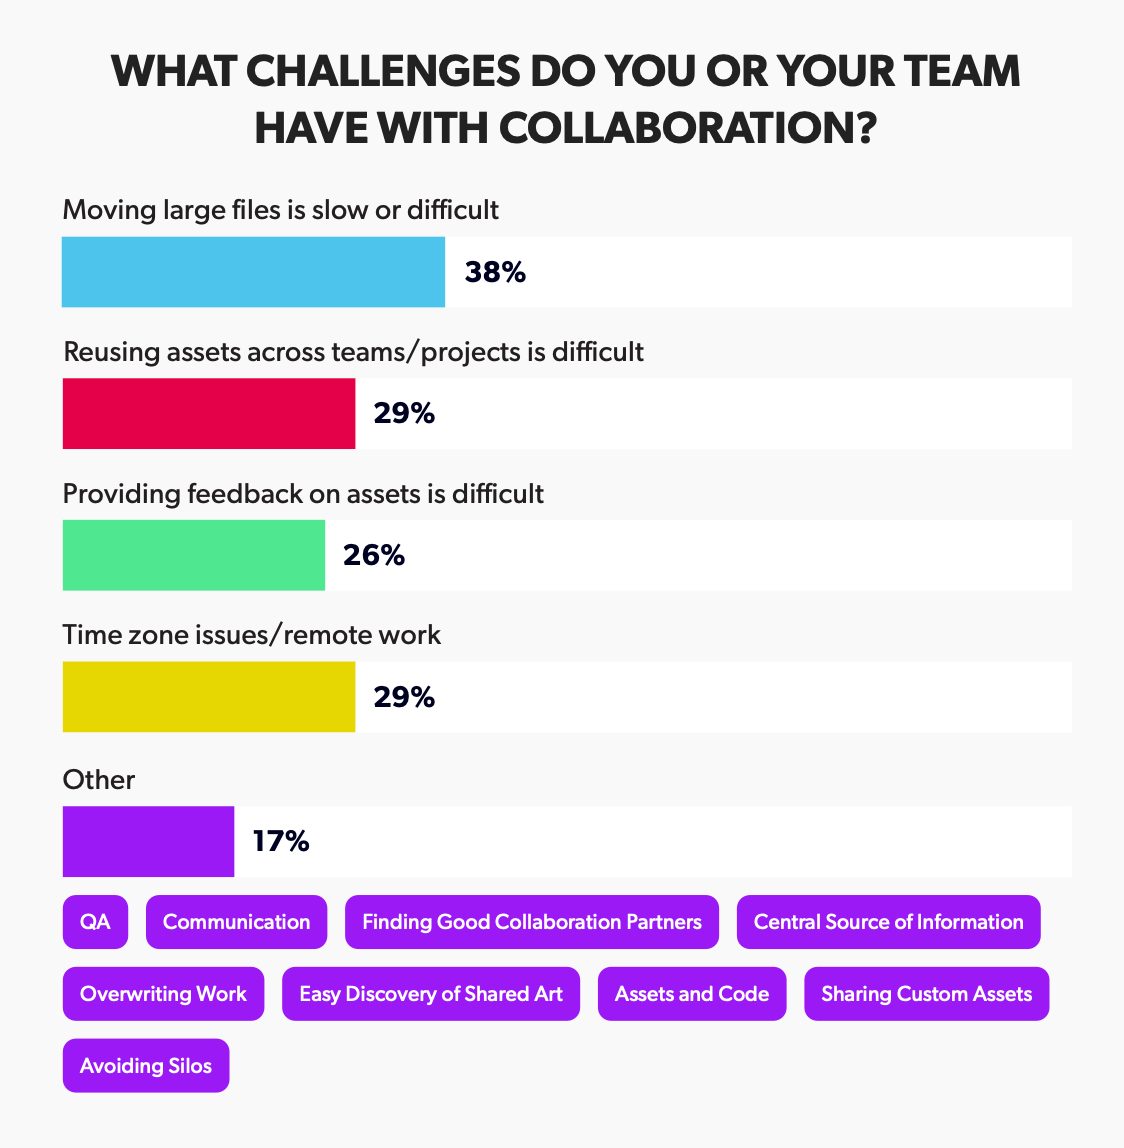
- The main collaboration issues highlighted by respondents include working with large files (38%), difficulties in reusing assets (29%), time zone and remote work problems (29%), and providing feedback on assets (26%).
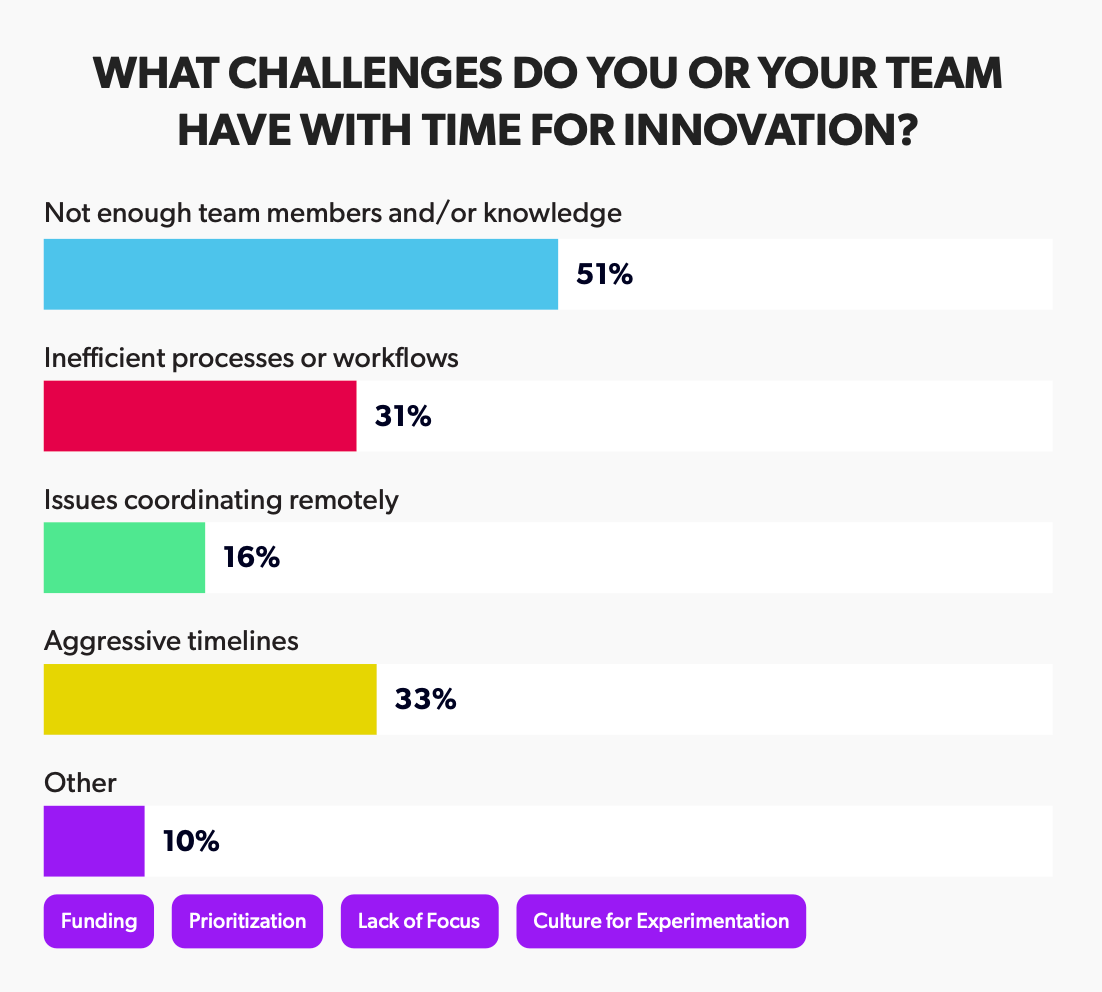
- The main innovation constraints are a lack of people or knowledge (51%), tight deadlines (33%), inefficient processes (31%), and coordination issues in remote work (16%).
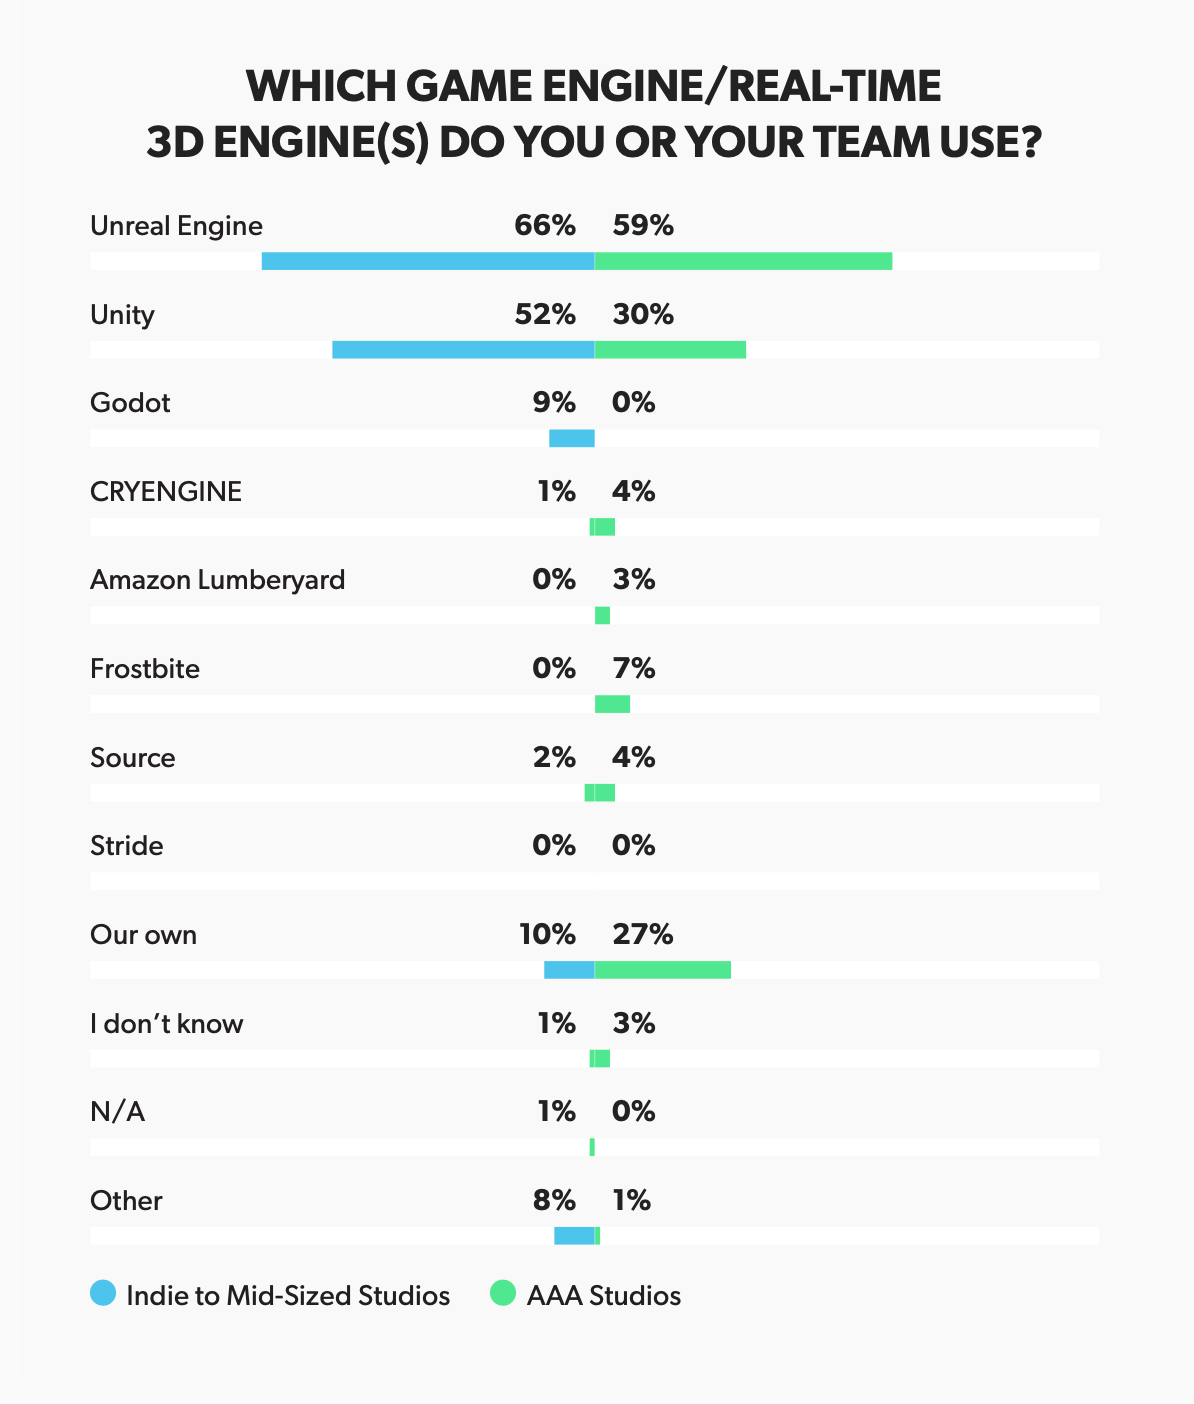
- 63% of companies use Unreal Engine, making it the most popular engine. 47% use Unity, 11% use their own engine, and 9% use Godot. In non-gaming industries, Unreal Engine is used by 51% of companies, while only 16% usage of Unity.
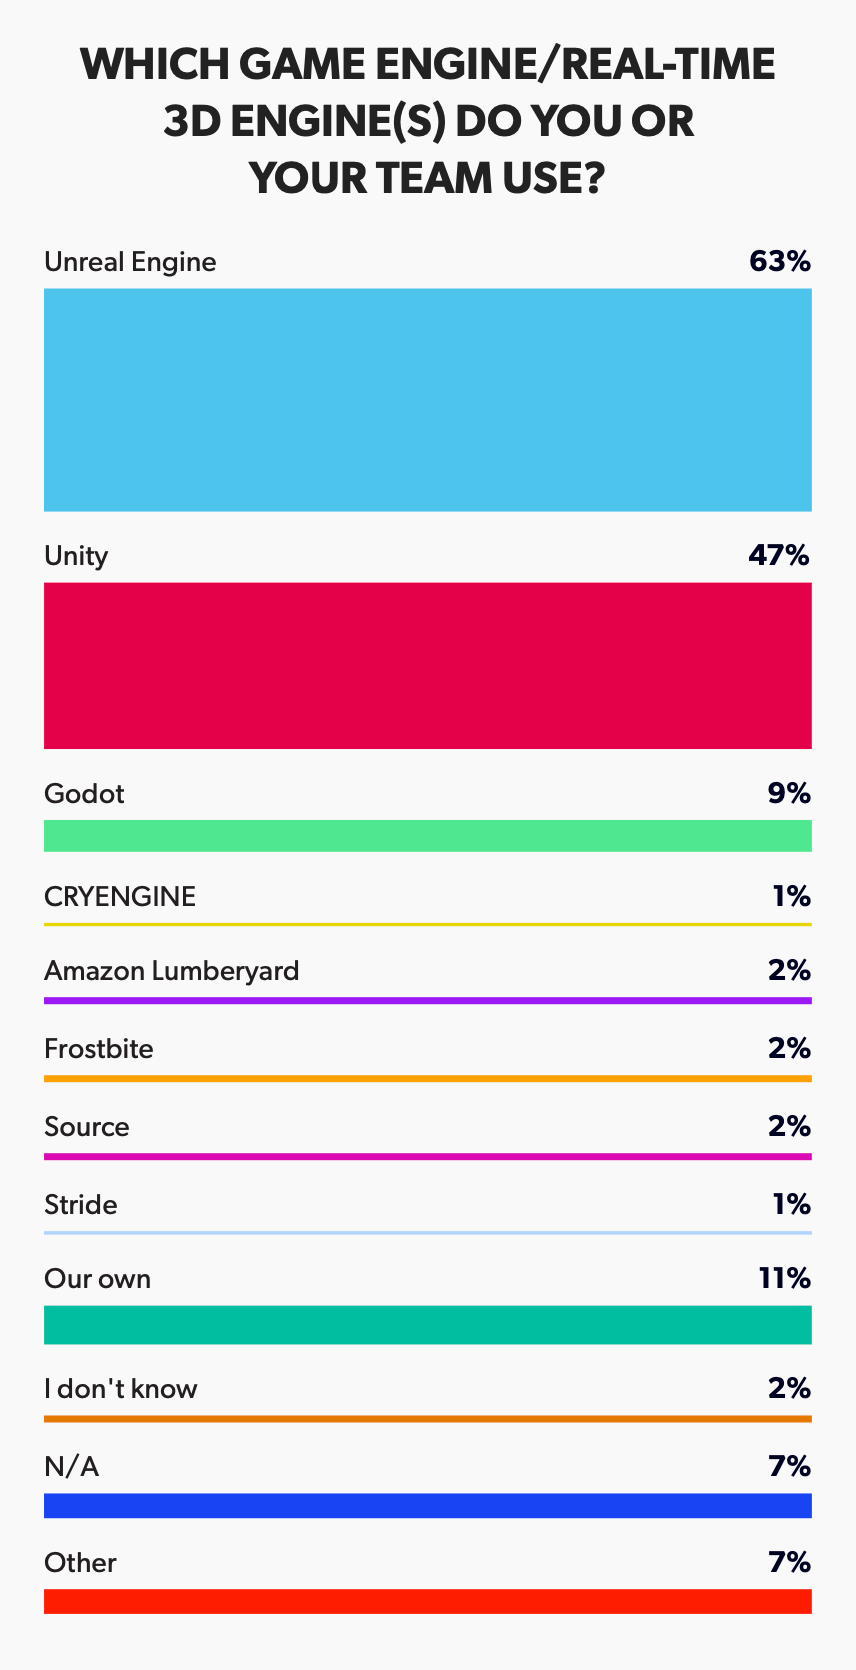
- Unreal Engine's popularity is roughly equal among small to medium (66%) and large studios (59%). Unity, however, is used more by smaller companies (52% vs. 30% in large companies). Larger developers more frequently use their own engines (27% vs. 10% in small studios).
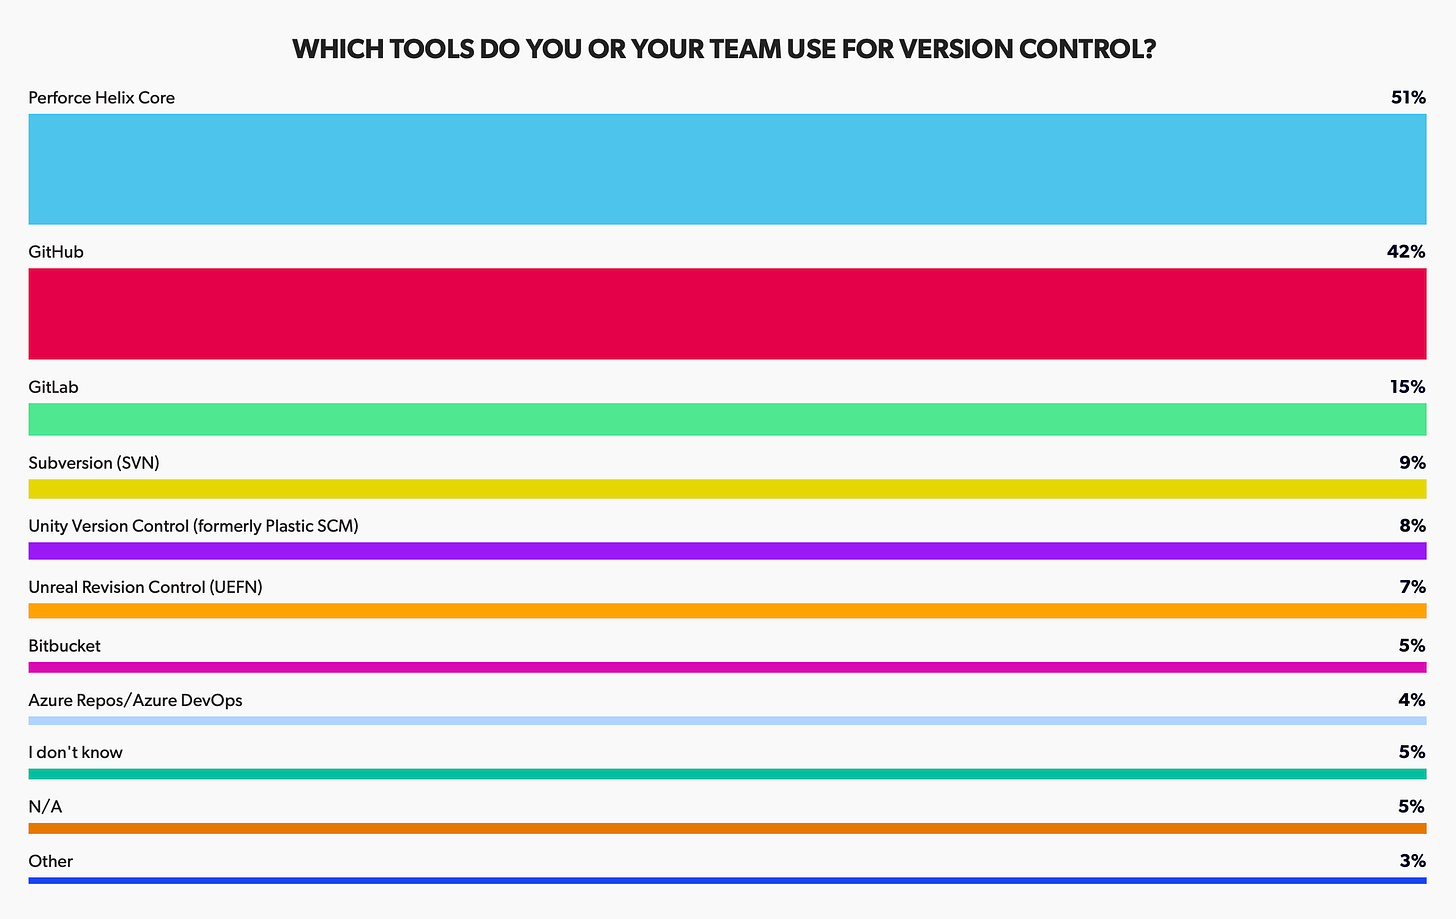
- Perforce Helix Core (51%), GitHub (42%), and GitLab (15%) are the leaders in version control services.
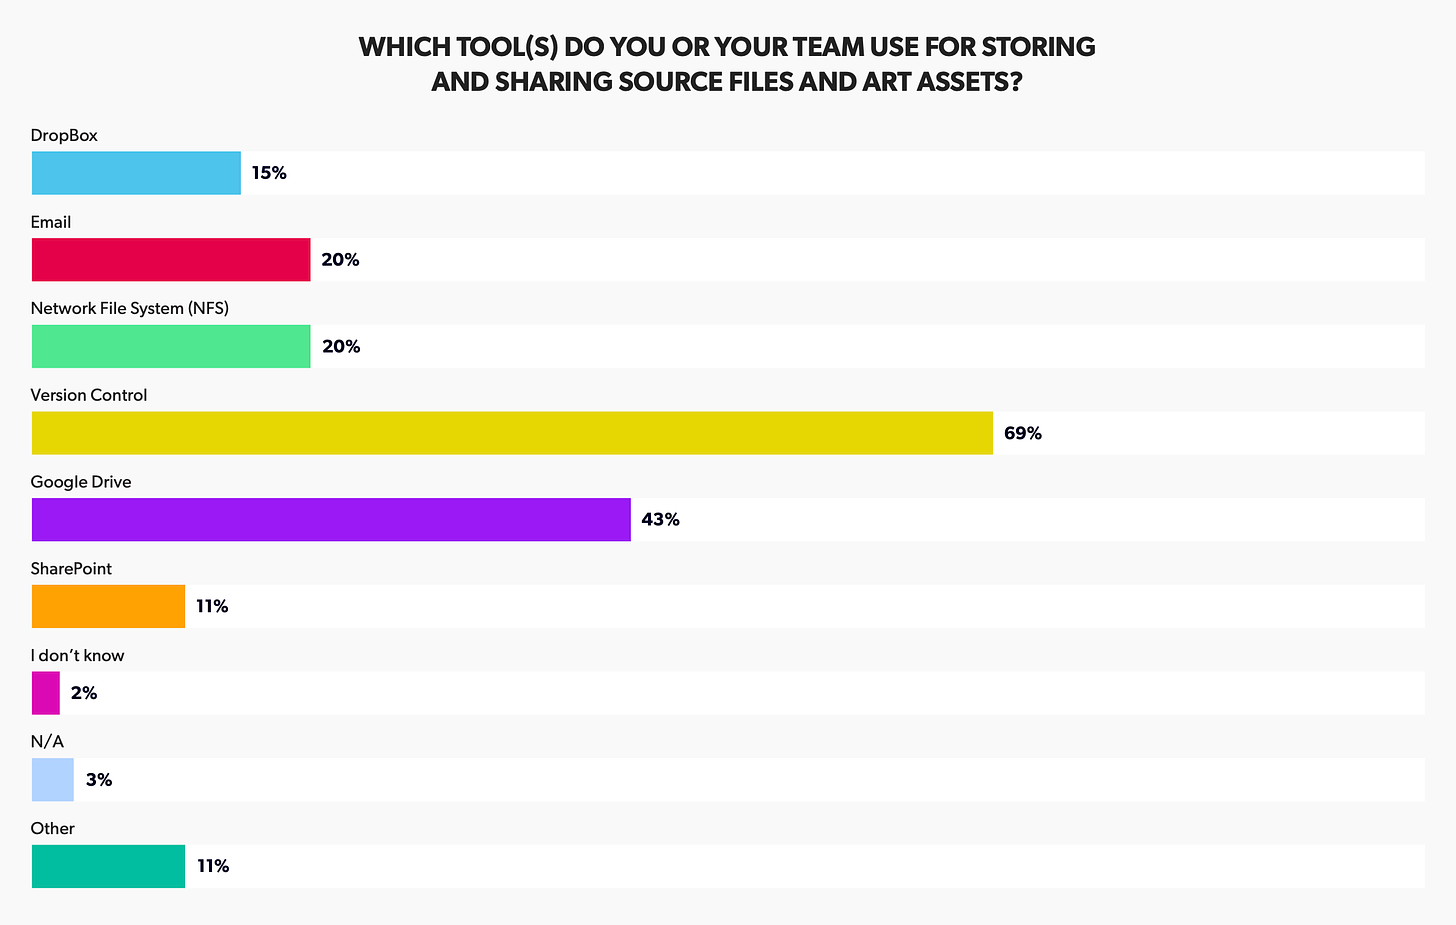
- Version Control (69%), Google Drive (43%), and Network File System (NFS) with simple email (20%) are the top tools for asset storage.
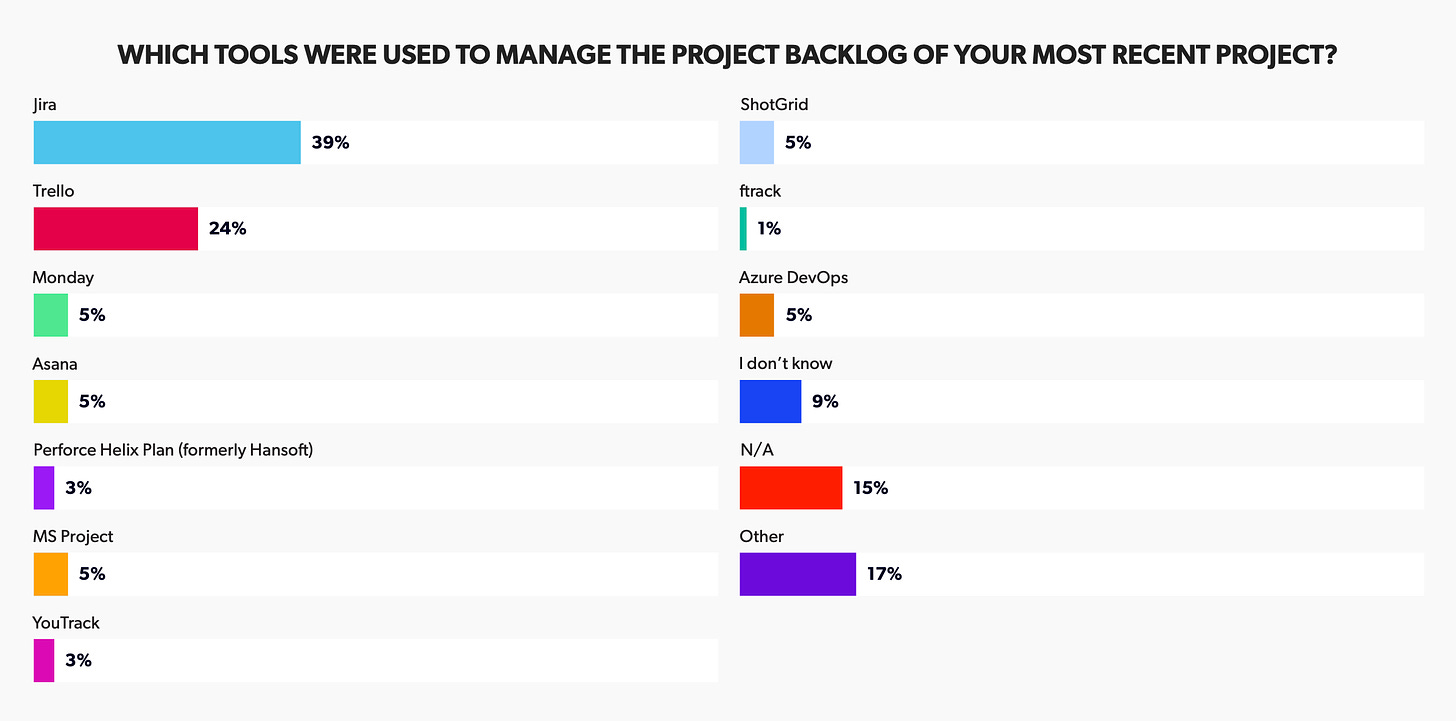
- Jira (39%) and Trello (24%) are the leaders in project management software.
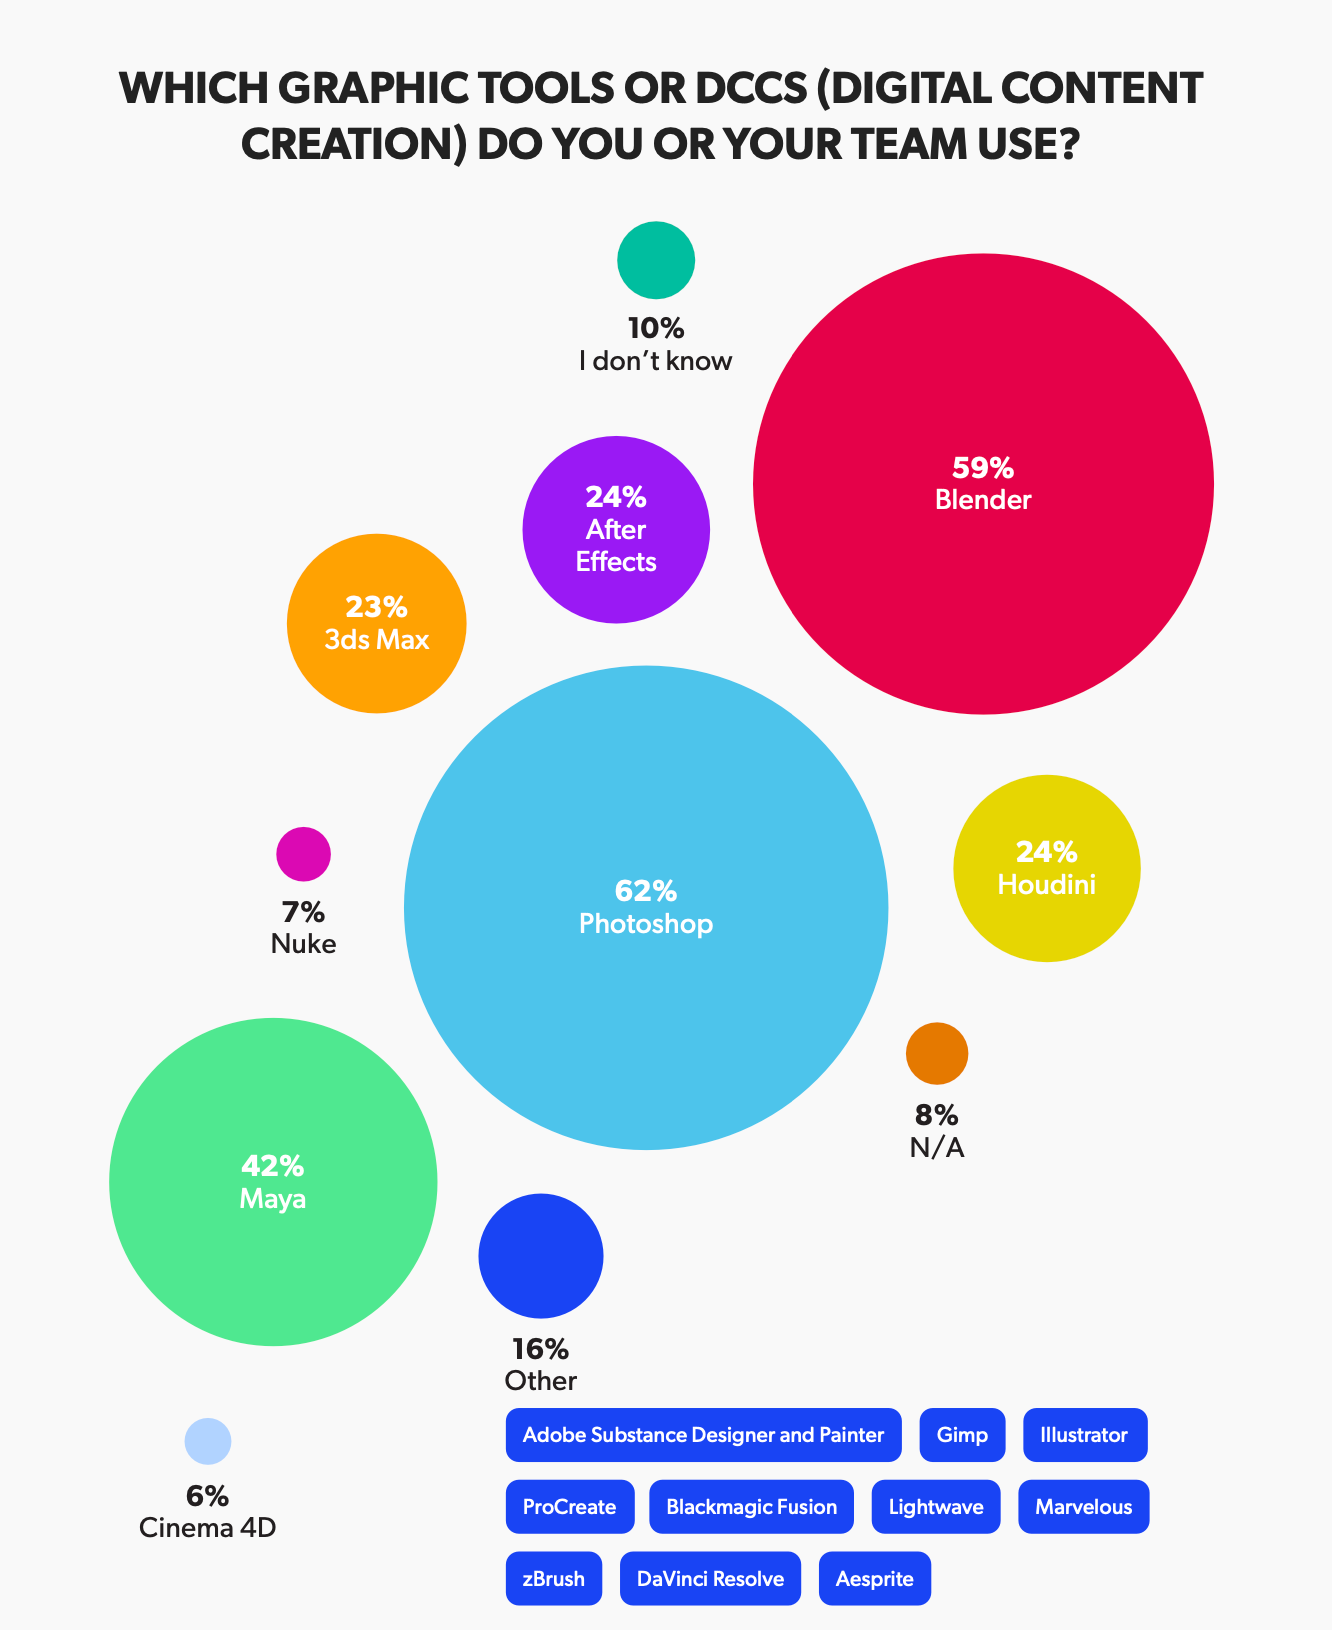
- Photoshop (62%), Blender (59%), and Maya (42%) are the industry leaders in graphic tools.
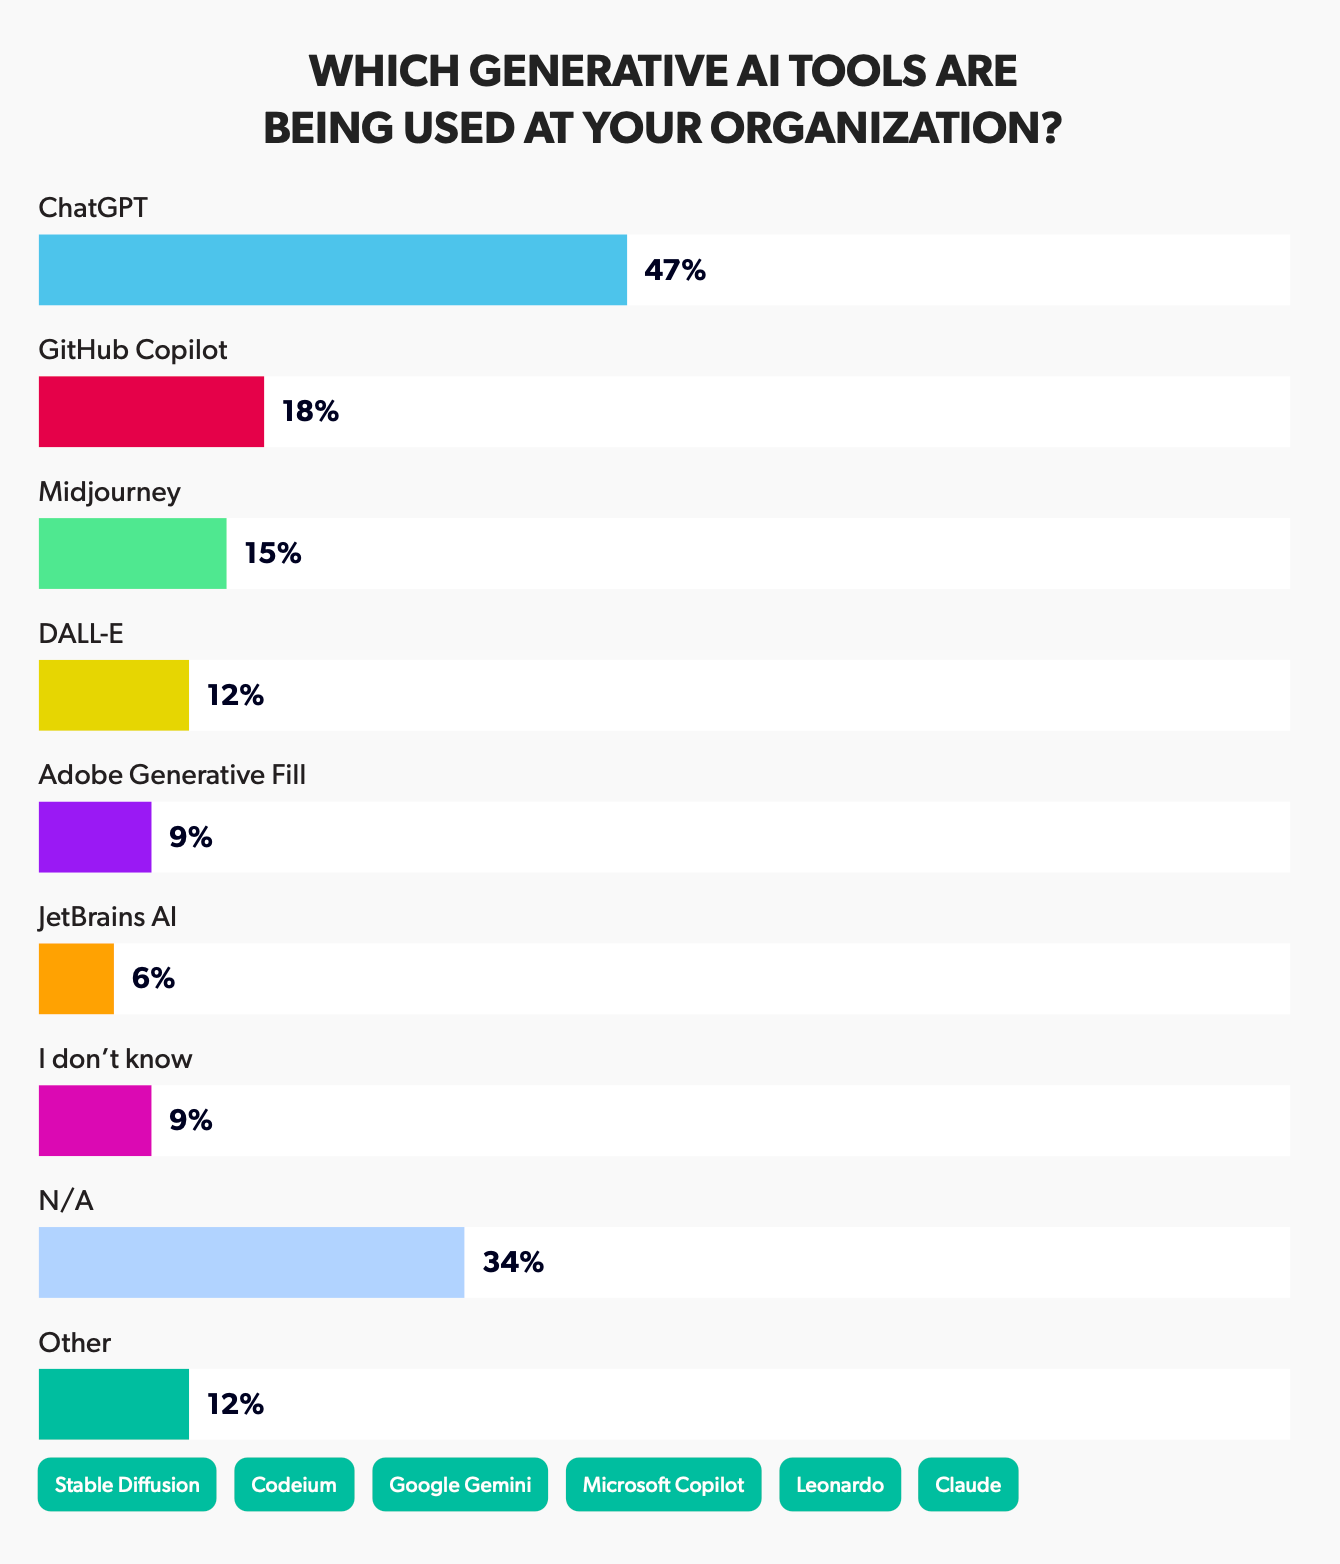
- AI tools are also gaining popularity, with the leaders being ChatGPT (47%), GitHub Copilot (18%), and Midjourney (15%).
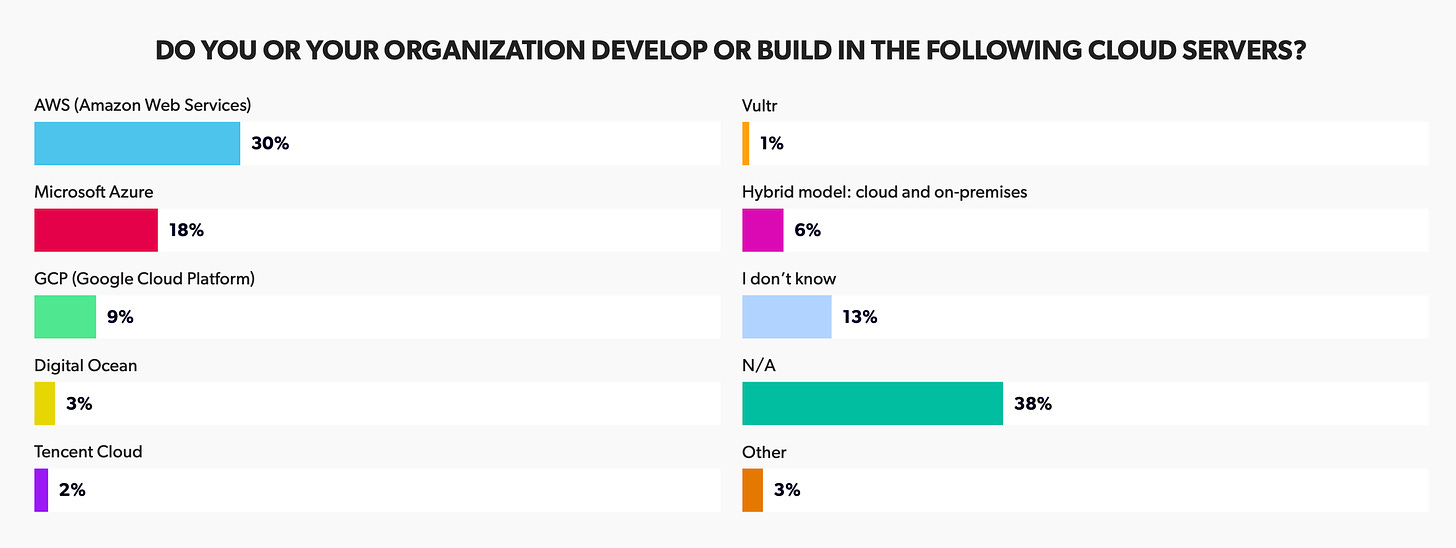
- AWS (30%), Microsoft Azure (18%), and GCP (9%) are the leaders in cloud hosting.
Famitsu: The Japanese gaming market in August 2024

Famitsu only takes physical sales into account.
Game Sales
- Powerful Pro Baseball 2024-2025 remained the leader in August. The game was purchased by 76,000 people on Nintendo Switch and PlayStation 4. Combined physical sales of the project have surpassed 336,000 copies over six weeks. Its predecessor, eBaseball Powerful Pro Baseball 2022, sold 259,000 copies in the same period.
- Otherwise, August turned out to be a calm month. Mario Kart 8 Deluxe returned to second place (50,000 copies). Nintendo Switch Sports climbed to third place—baseball was added to the game.
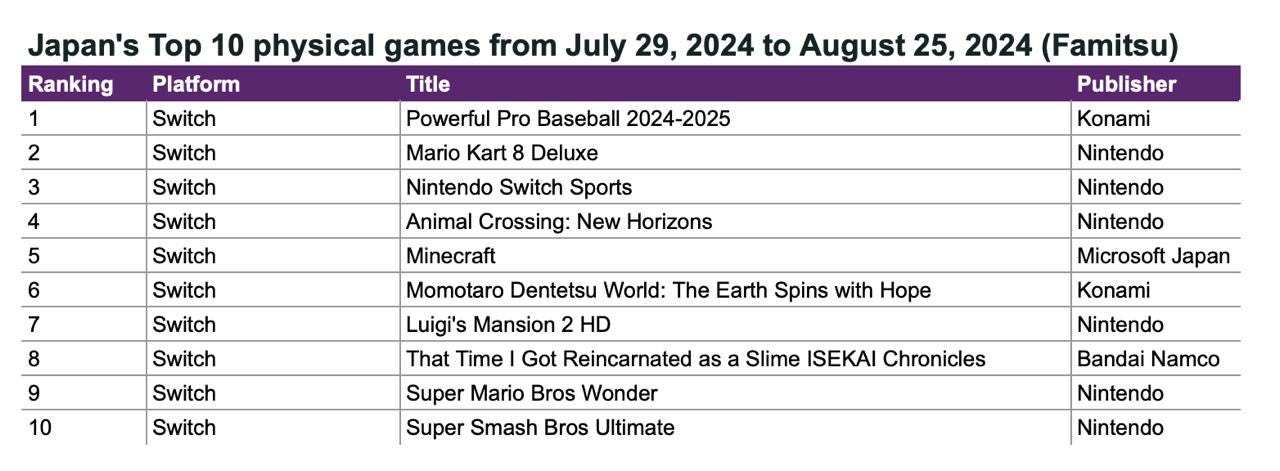
- One of the few new releases of the month, That Time I Got Reincarnated as a Slime ISEKAI Chronicles, ranked 8th with the Nintendo Switch version (23,000 copies). The PS5 version sold an additional 6,000 copies.
- In August, Nintendo accounted for 40.9% of all physical sales in Japan (¥2.3 billion - $16.1 million). Konami had 16%.
- In terms of platforms, the Nintendo Switch dominated with 88.1% of the total market. 883,789 games were purchased for this system in August.
Hardware Sales
- Unsurprisingly, the Nintendo Switch was the best-selling console of the month, with 228,000 sales.
- The PlayStation 5 sold 104,000 units in August.
Amir Satvat: Data on job openings in the gaming industry
Amir Satvat analyzed 95-99% of the open positions. It is unclear over what time period the sample was taken, but the database includes a total of 14,162 job openings.
❗️Amir helps people in the gaming industry find jobs—more details can be found on his website.
- 86% of all open positions do not offer remote work options. Only 14% of positions provide this opportunity.
- Asia (32.5%), Europe (28.3%), and North America (22.9%) lead in the number of open job positions. Only jobs that do not offer remote work were considered.
- The countries with the most job offers for gaming industry workers are: USA (16.4%), China (13.9%), UK (7.4%), Canada (6.3%), and Japan (4.2%).
- At the city level, Shenzhen (6.7% of all job openings) and Shanghai (4.4%) are the leaders in terms of the number of open positions. They are followed by Montreal (3.6%), Tokyo (3%), and London (2.7%).
The full database is available via the link.
Sensor Tower: The Japanese mobile gaming market declined in H1'24

Sensor Tower only considers Gross IAP revenue.
- Revenue from the Japanese market in dollar terms dropped by 17% in the first half of 2024, down to $5.3 billion. The wakened yen caused this.
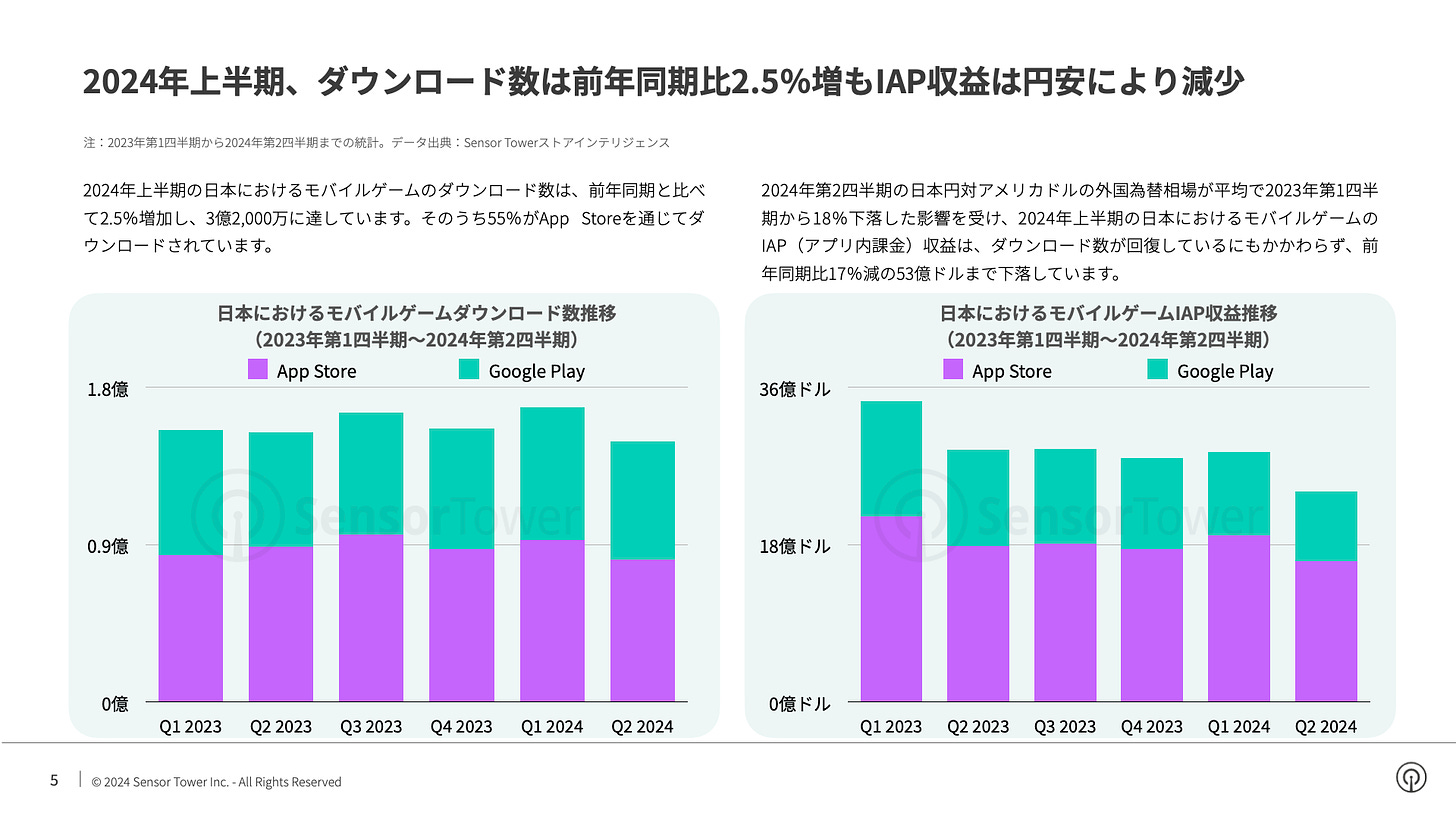
- Game downloads in the first half of 2024 increased by 2.5%, reaching 320 million. 55% of the installs came from the App Store.
- The biggest mobile games in Japan from January to July this year were Monster Strike (over $290 million in revenue during the period; cumulative revenue over 11 years – more than $11 billion), Umamusume: Pretty Derby, and Puzzle & Dragons.

- There is one newcomer in the chart – Legend of Mushroom, which earned over $100 million in the 4 months after its release. At the end of May, Bandai Namco Entertainment also launched The Idolmaster Gakuen, which topped the monthly ranking. However, the project has not yet entered the top 10.
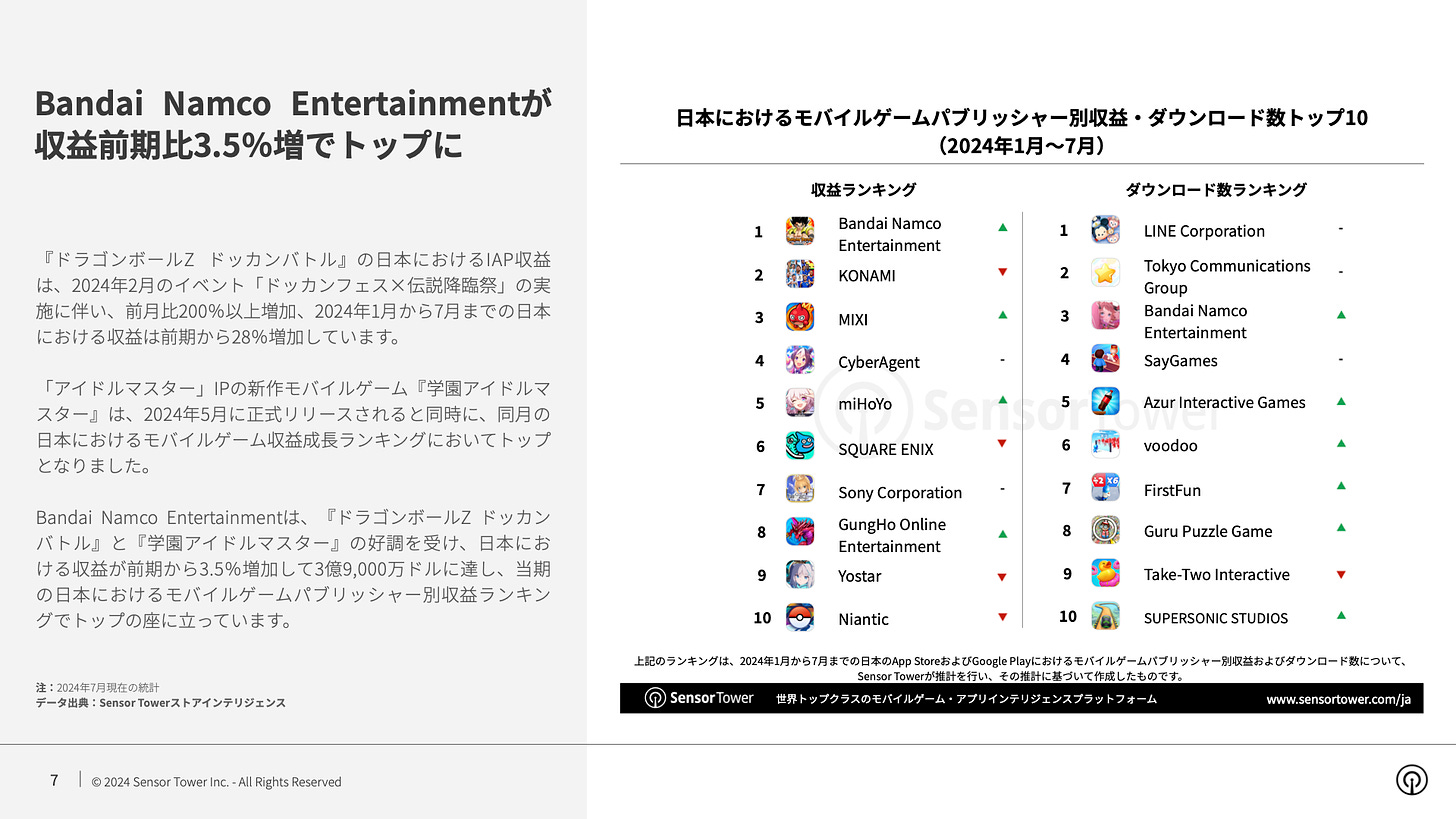
- Bandai Namco Entertainment became the most successful mobile publisher in Japan. Its revenue grew by 3.5% in the half-year to $390 million. Outside its home country, the company earned $270 million over the same period. Konami ranks second in revenue, and mixi is third.
- Dragon Quest is the most popular IP in the mobile market. Games from this franchise earned $170 million in the first half of the year. However, when it comes to individual games, the leader is Umamusume: Pretty Derby (over $160 million in revenue; total project revenue is nearing $2.5 billion).

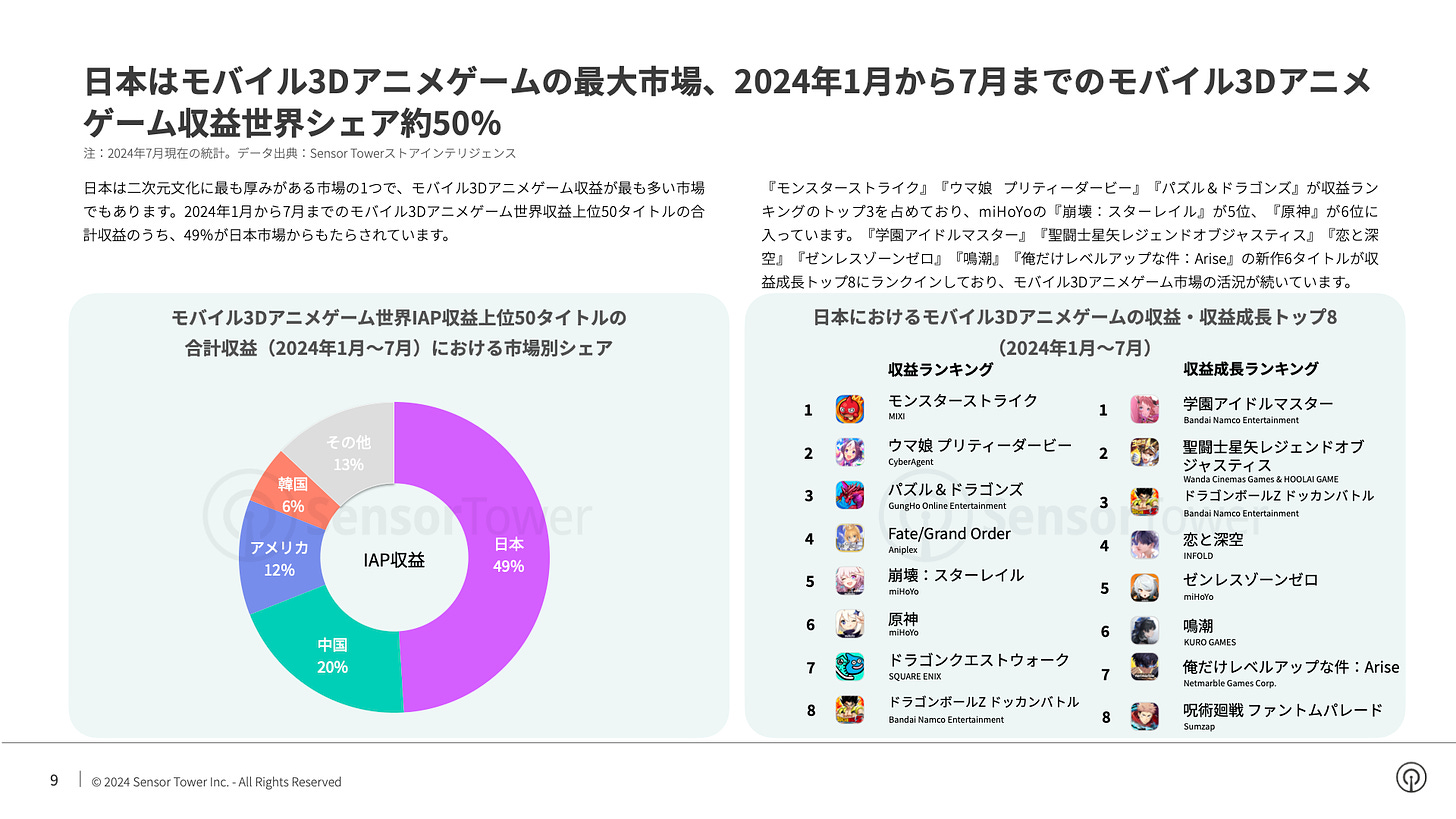
- Japan accounts for 49% of all revenue from 3D anime games.
VideoGamesEurope & EGDF - European Gaming Market in 2023

Data for the report provided by GSD, Gametrack, and EGDF.
European Market
- The European gaming market in 2023 earned €25.7 billion (5% more than last year).
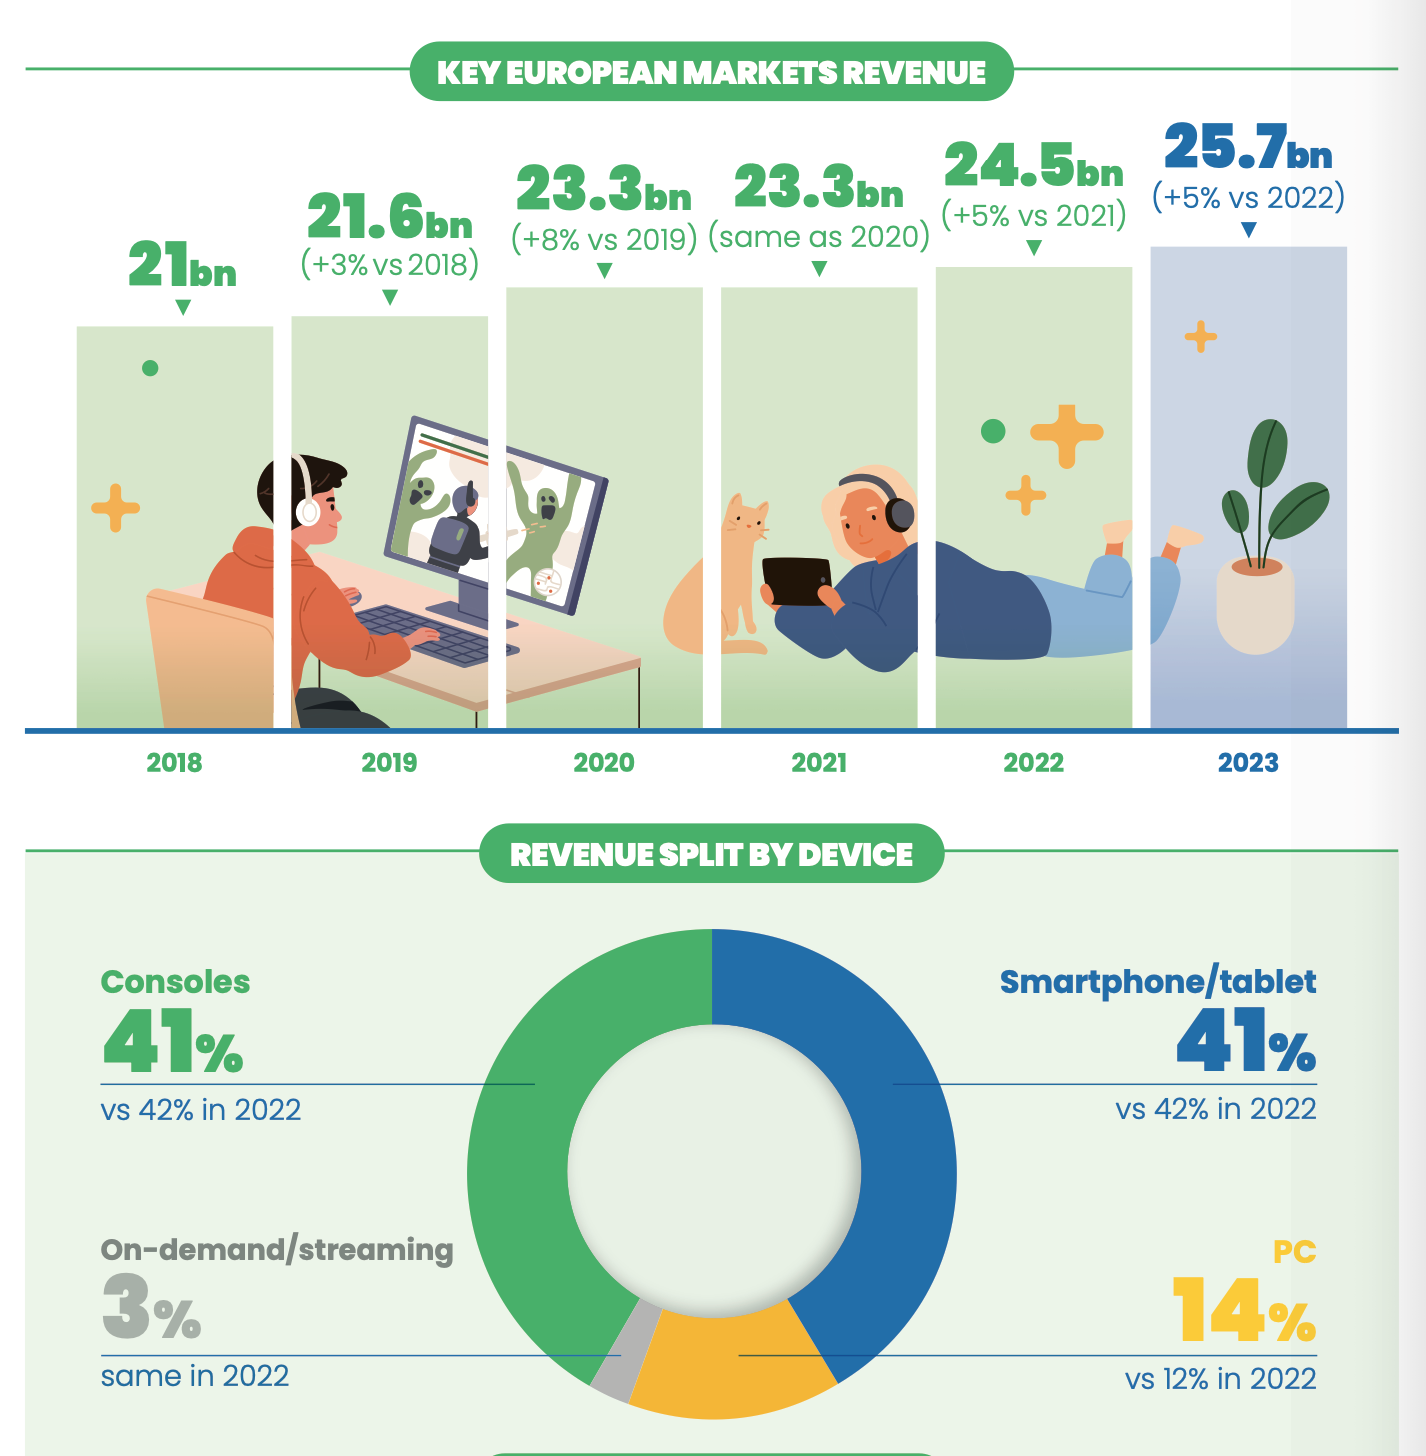
- 41% of the revenue came from consoles (compared to 42% in 2022); 41% from mobile devices (after 42% in 2022); 14% from PC (compared to 12% in 2022); and 3% from streaming services (the same as in 2022).
- The share of digital sales in Europe continues to grow. In 2023, the distribution was 85% digital and 15% physical sales.
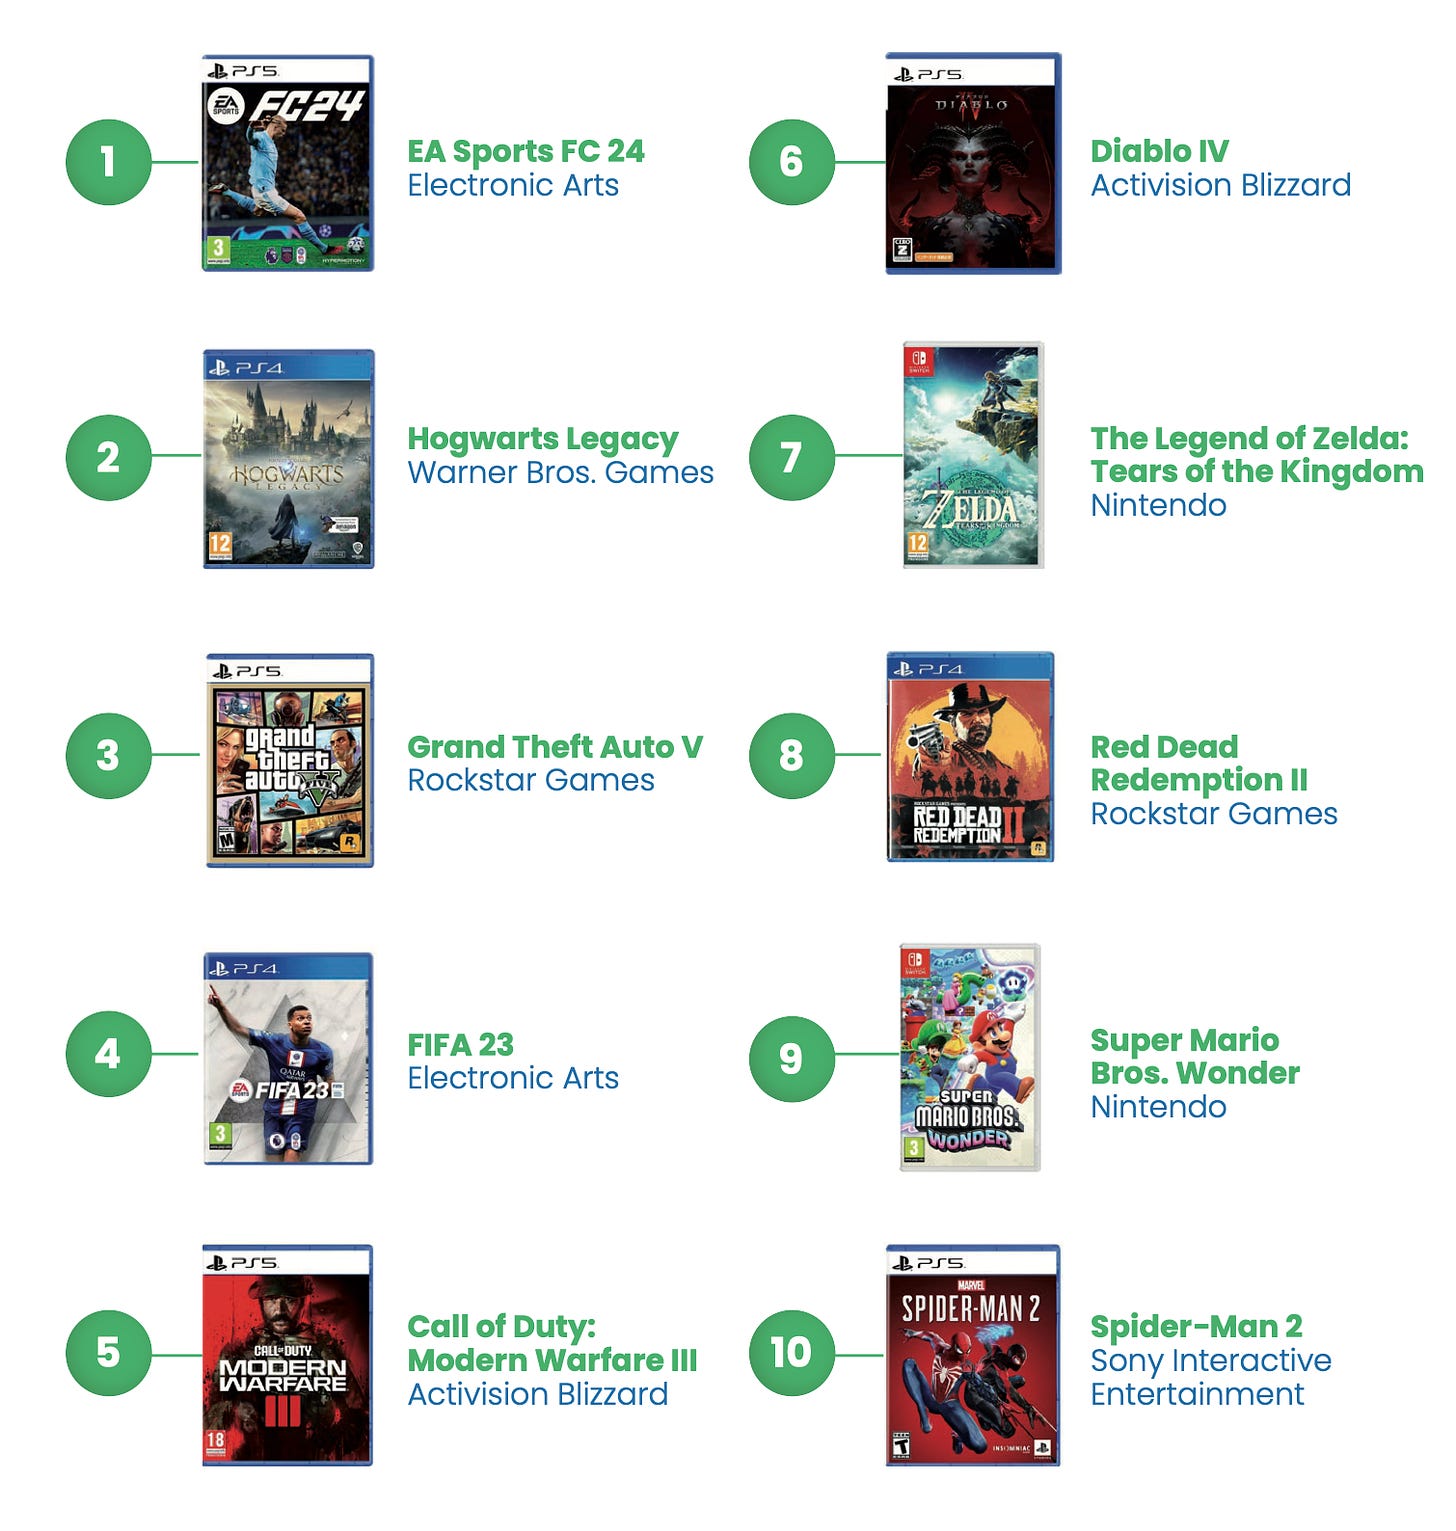
- The best-selling games in 2023 in Europe were EA Sports FC 24, Hogwarts Legacy, and Grand Theft Auto V.
European Gamers
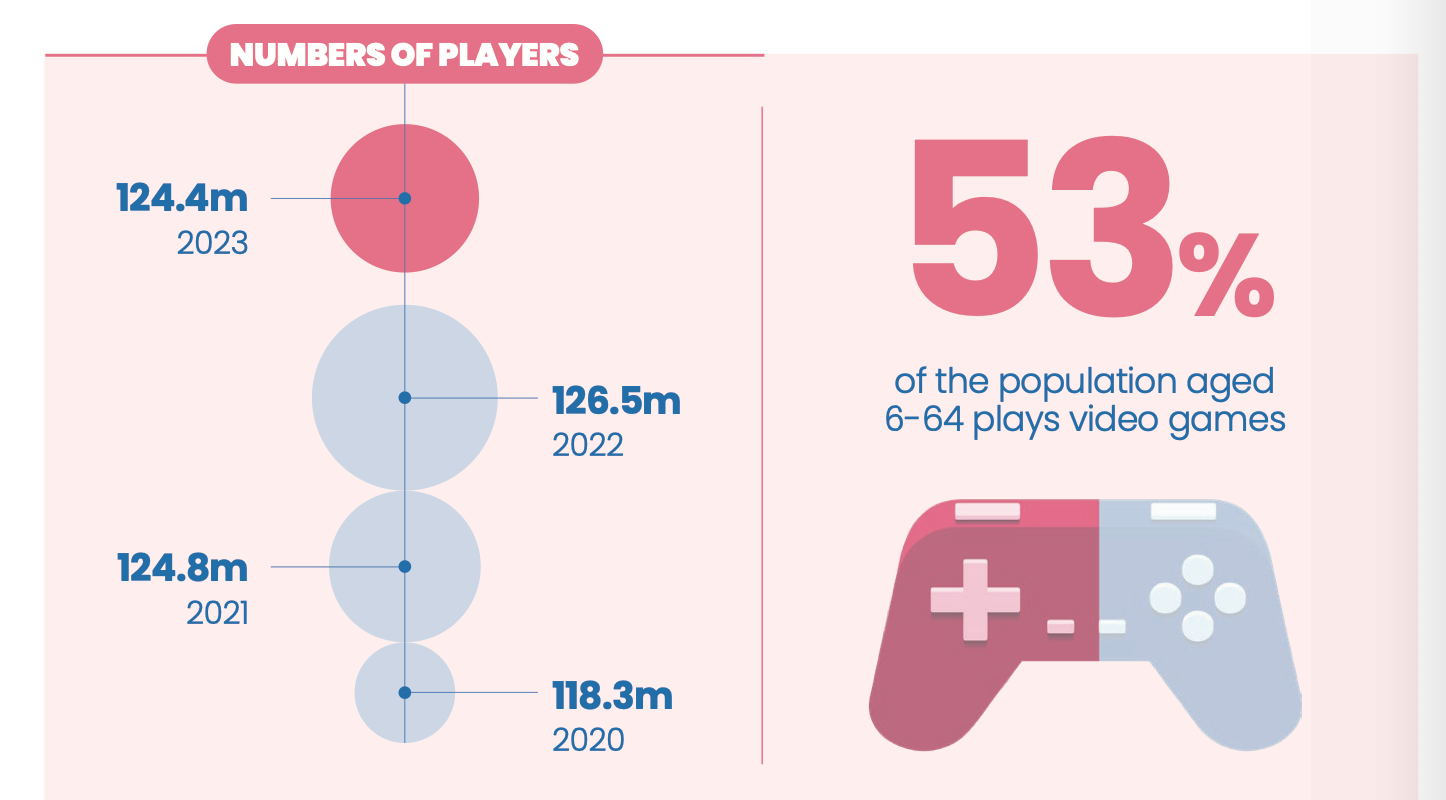
- 53% of Europeans play video games. 75% of this number are adults. The average age of a gamer in Europe is 31.4 years. Compared to 2022, there are now more people aged 15 to 44 playing games.
- The main devices for gaming are smartphones (68% compared to 69% in 2022), consoles (56% compared to 59% in 2022), and PCs (46% compared to 48% in 2022).
- It is estimated that the number of players in the five largest European markets in 2023 was 124.4 million. This is less than in 2022 (126.5 million) and 2021 (124.8 million).
- 43.5% of European gamers are women. On average, they play 6.7 hours per week.
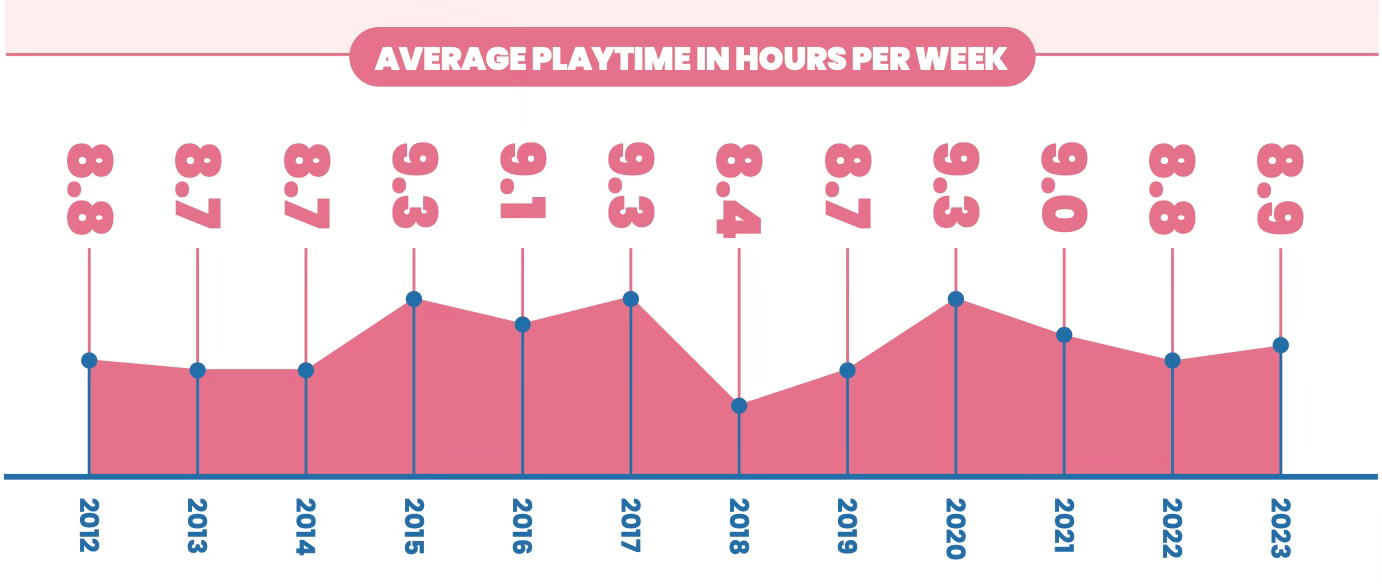
- The average number of hours spent gaming per week in Europe is 8.9, and this figure has remained about the same since 2012. Europeans spend significantly less time on games than on social media (16.3 hours per week) and watching TV shows and series (24 hours per week).
Work in Europe
- 114,400 people work in the European gaming industry. 24.4% of employees are female, a 1.3% increase compared to 2022. For instance, in Sweden, 44% of all new hires in 2023 were women.
- 31.2% of all employees hold technical positions; 23.5% are in creative roles (creative directors, game designers); 22.6% are in artistic roles; 14% are in management; and 8.7% work in publishing, business development, and other related activities.
Games & Numbers (September 4 - September 17; 2024)
PC/Console Games
- Sales of Black Myth: Wukong surpassed 18 million copies in just two weeks. This was reported by Daniel Wu, one of the founders of Hero Games, the largest shareholder of the game's developers. According to him, the game's development cost $70 million and took 6 years.
- Street Fighter 6 sales reached 4 million copies across all platforms. The total sales of the series as of the end of the first half of 2024 stand at 55 million.
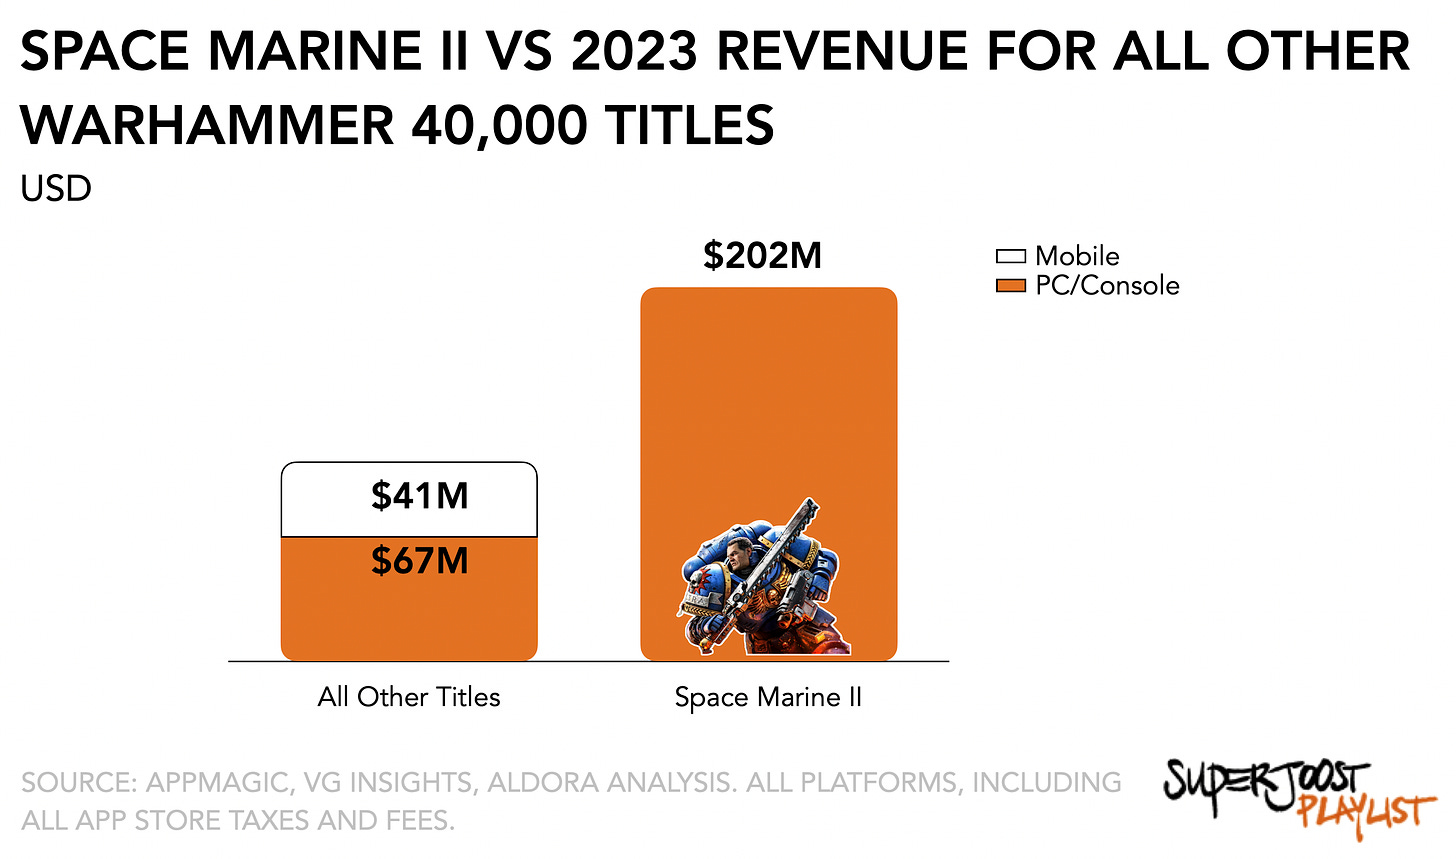
- Sales of Warhammer 40,000: Space Marine 2 are approaching 3 million copies, earning more than all other Warhammer universe games combined in 2023.
- Harrison Froschke, Senior Product Manager at Blizzard Entertainment, revealed on his LinkedIn the revenue of Diablo IV. The game has surpassed $1 billion in earnings, with $150 million coming from microtransactions. Blizzard had officially reported that the game earned $666 million in its first 5 days of sales.
- More than 1 million people have played Citizen Sleeper. The studio and publisher (Fellow Traveller) proudly shared this on their social media.
- Released on August 15, shapez 2 has already sold 260,000 copies. In the first week, the game was purchased 70,500 times. It launched with 330,000 wishlist entries.
- Earth Defence Force 6, released in September 2022, has sold 550,000 copies in two years.
Mobile Games
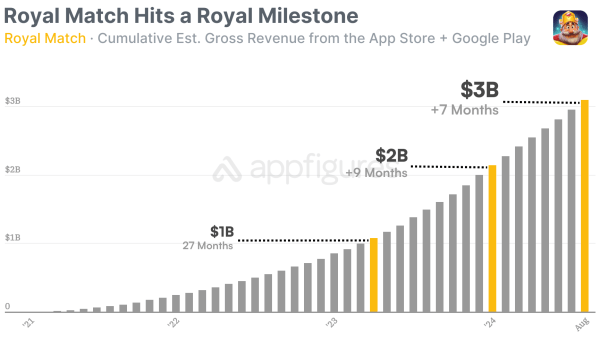
- According to AppFigures, the gross revenue of Royal Match has reached $3 billion. The previous billion was achieved in January this year, and the game has surpassed 300 million downloads.
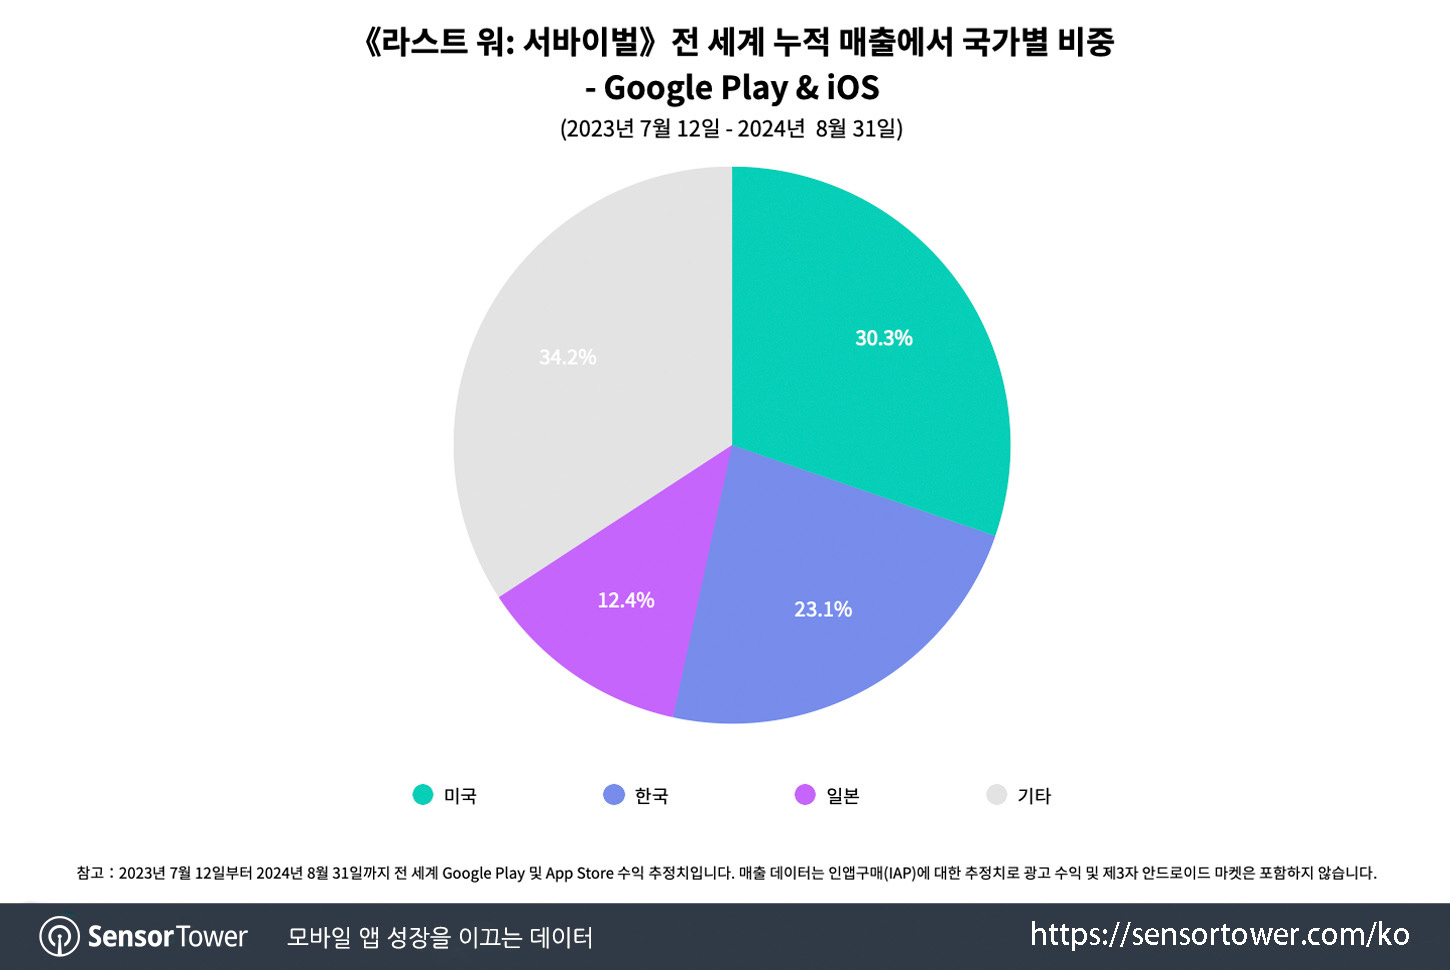
- Sensor Tower reports that The Last War: Survival has earned over $900 million since its release. 30.4% of that amount came from the US, 22.9% from South Korea, and 12.4% from Japan. The RPD (revenue per download) in South Korea is $53, the highest among all countries. Additionally, The Last War: Survival accounts for 30% of the revenue from strategy games in South Korea.
- In its first year, Monster Hunter Now has earned over $225 million, according to data from AppMagic.
- Trivia Crack by Etermax has been downloaded more than 800 million times. It took 11 years to reach this milestone.
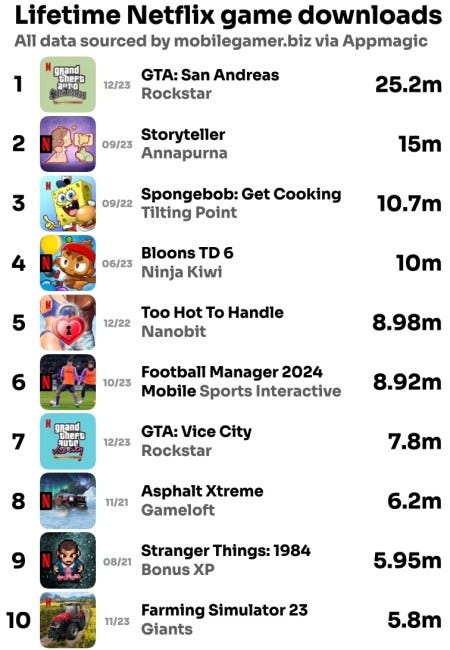
- Using AppMagic, Mobilegamer.biz found that games from Netflix Games have been downloaded more than 210 million times. The leader is GTA: San Andreas with 25.2 million downloads.
- Infinity Nikki by Infold Games has surpassed 14 million pre-registrations. The game, in addition to mobile platforms, will also be released on PlayStation 5 and PC.
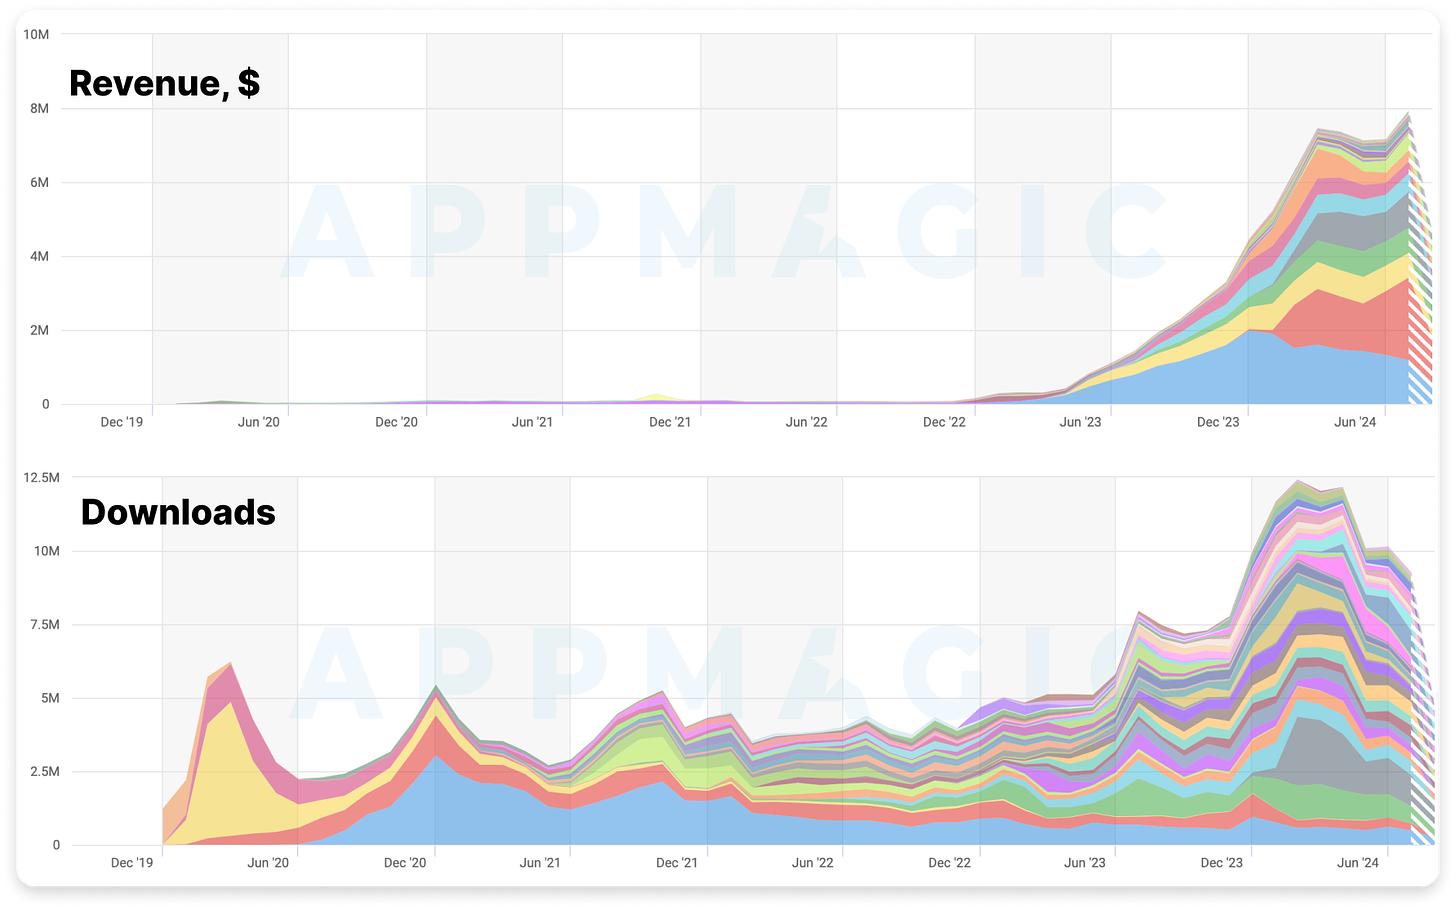
AppMagic: The casual games market in Tier-1 West countries grew in H1'24
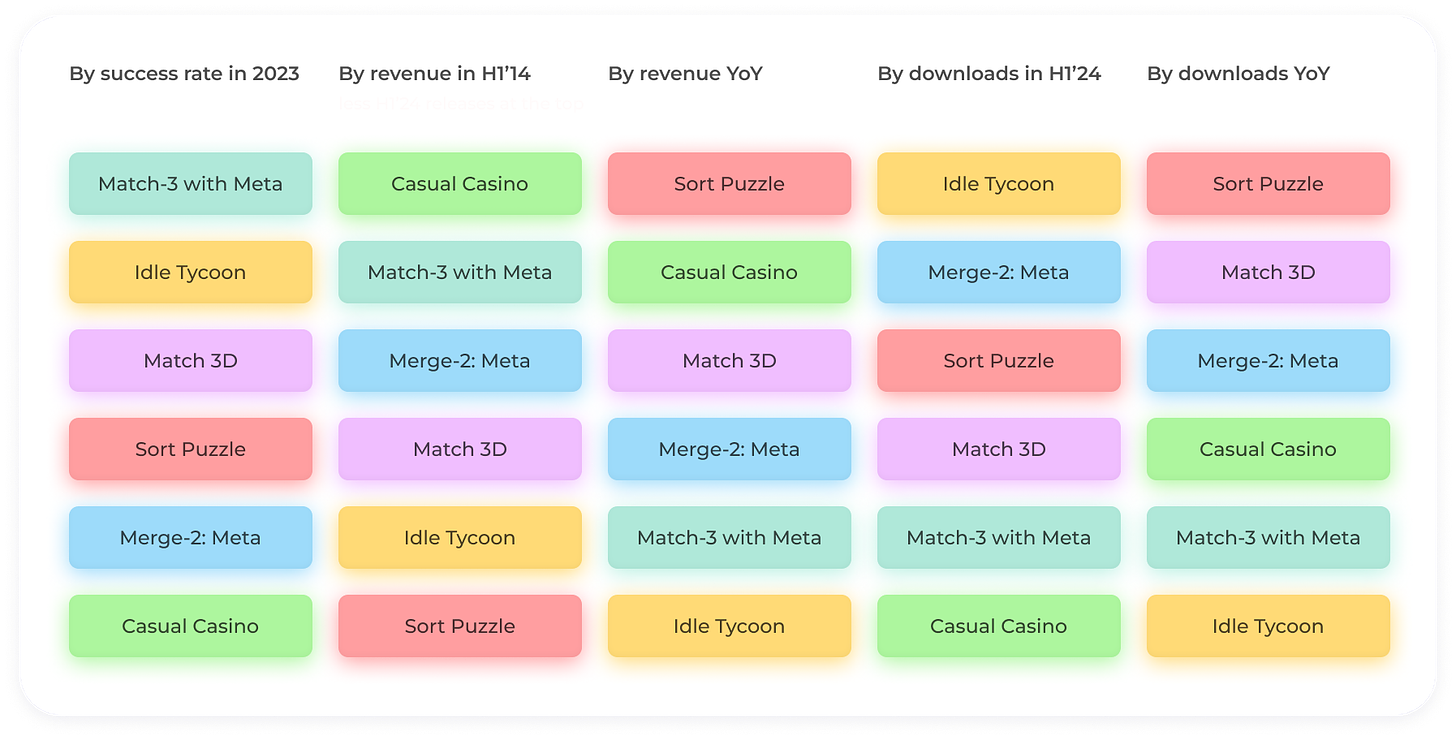
The analytical platform took a closer look at the genres Merge-2, Match-3, Match 3D, Sort Puzzle, Idle Tycoon, and Social Casino (Casual Casino according to AppMagic’s classification). The Tier-1 Western countries include the US, UK, Australia, Canada, France, and Germany.
- Casual games in Tier-1 Western countries earned $7.2 billion in the first half of 2024. This is 11% more than in the first half of 2023 ($6.5 billion).
Match-3 with meta
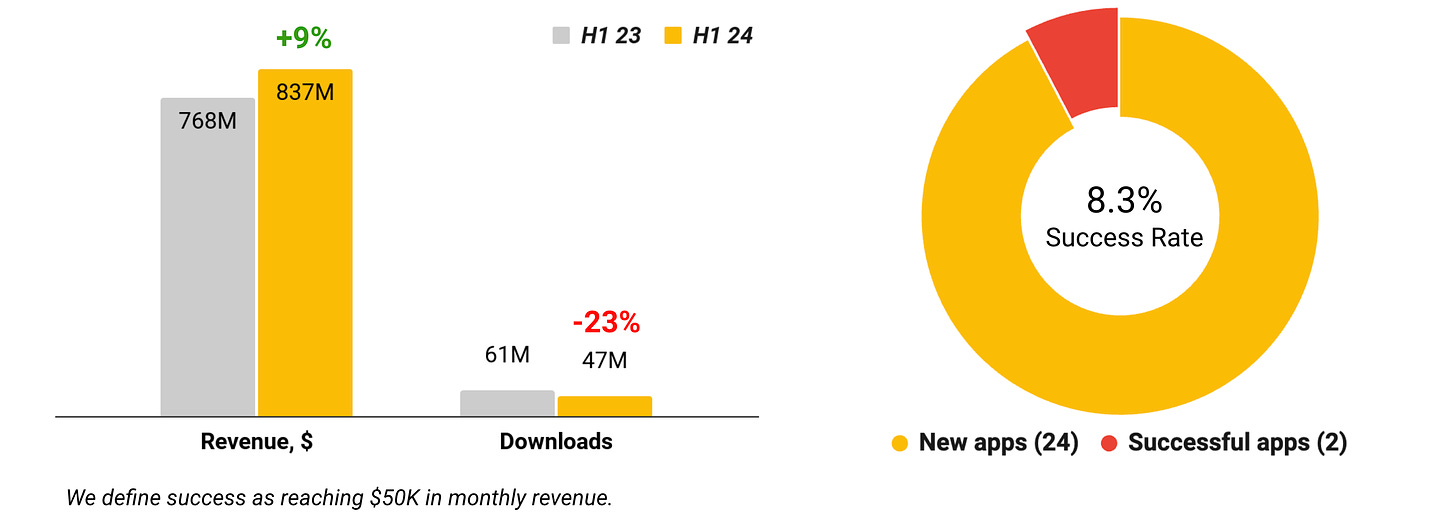
- In the first half of 2024, games in this genre earned $837 million (9% more than H1'23 - $768 million) in Tier-1 Western markets. However, downloads dropped by 23% – from 61 million in H1'23 to 47 million in H1'24.
- 24 new games in this genre were released in the first half of 2024. Two were successful, with a Success Rate of 8.3%.
❗️AppMagic considers a game successful if it earns more than $50,000 per month.
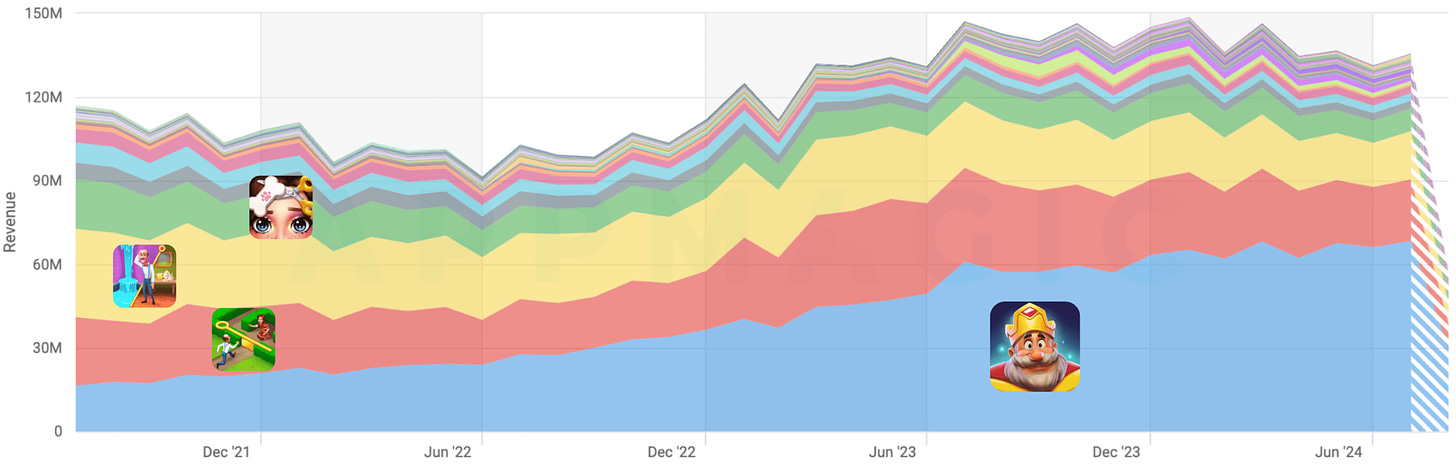
- Revenue growth was largely driven by Royal Match, which is increasing its RPD in the West. Recently, new social features, new game mechanics, reworked old mechanics, and new events were added to the game.
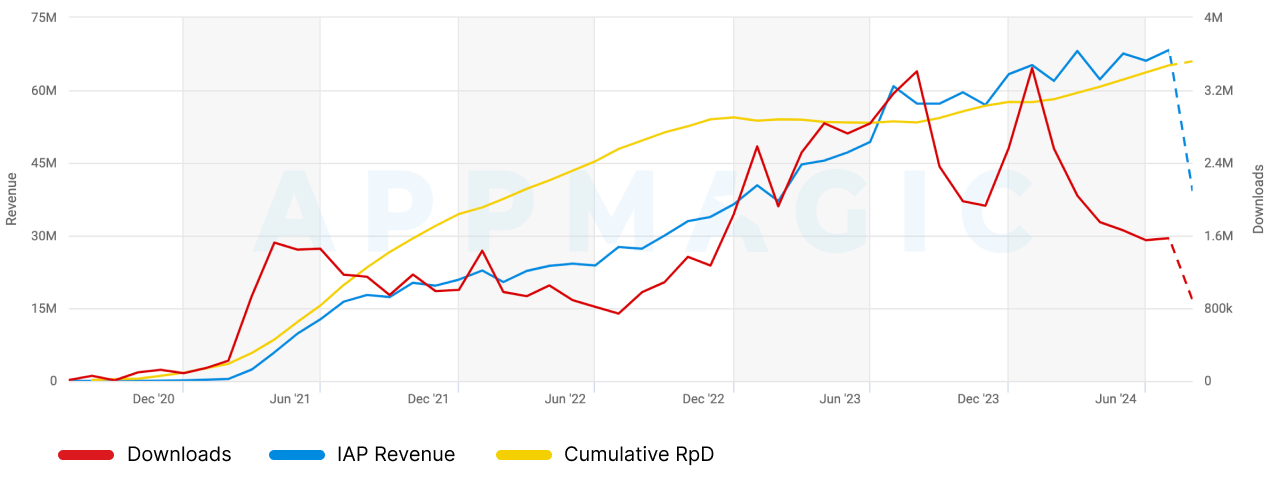
❗️AppMagic analysts note that revenue growth despite declining downloads is a typical story for the modern casual market. Attracting players has become more challenging and expensive, so companies are focusing more on retention and monetizing existing users.
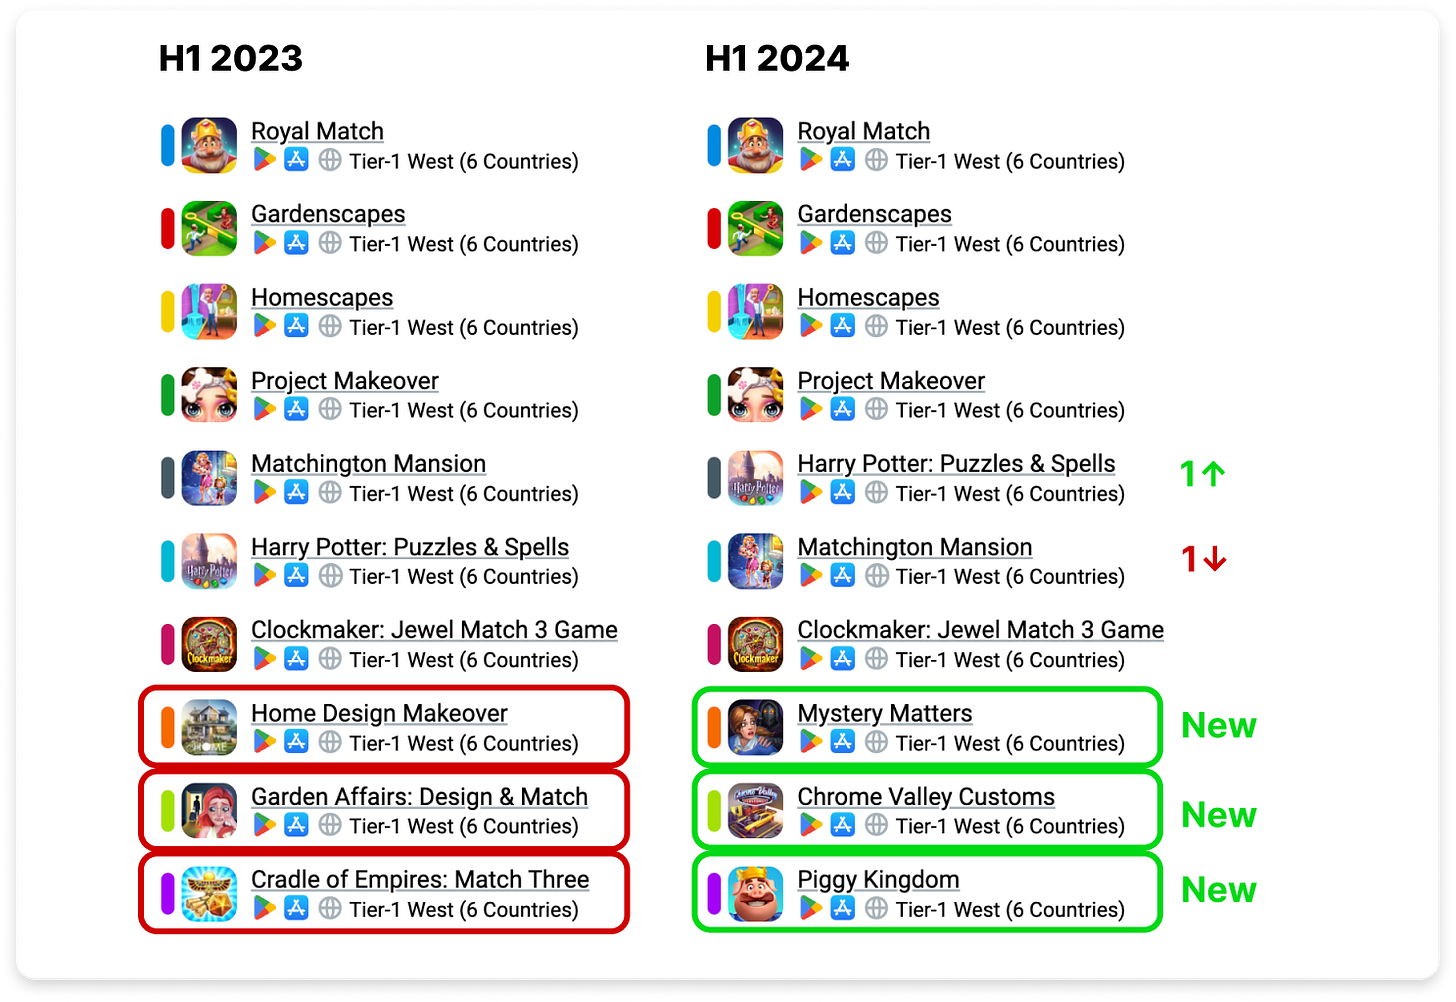
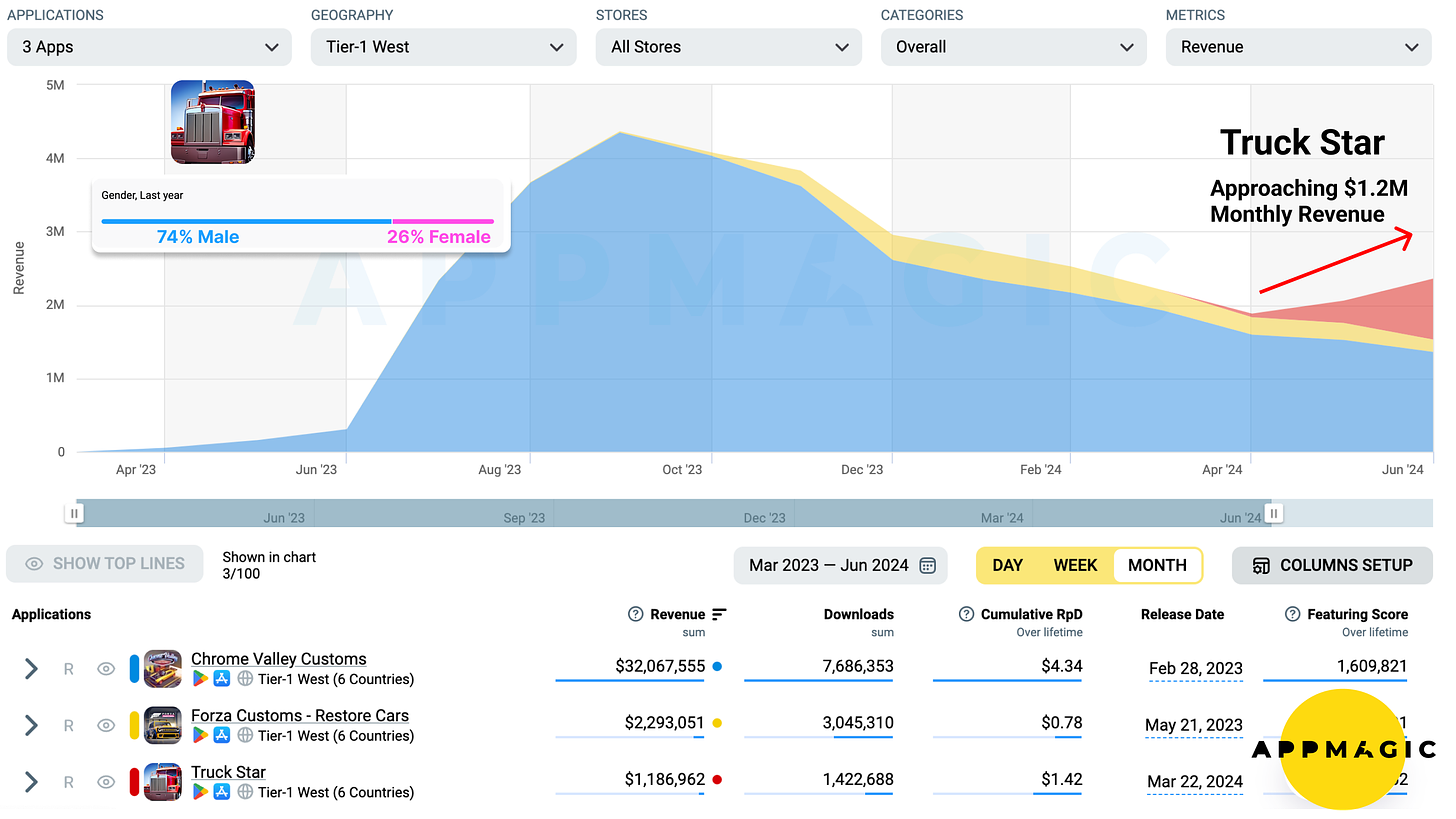
- Among the highest-earning games in the genre, three new projects have emerged: Mystery Matters, Chrome Valley Customs, and Piggy Kingdom. However, Chrome Valley Customs is declining, and Forza Customs has not caught up to its competitors. On the other hand, Truck Star is performing well, but its results are not yet sufficient to enter the top 10 (currently earning $1.2 million a month and growing).
Merge-2 with meta
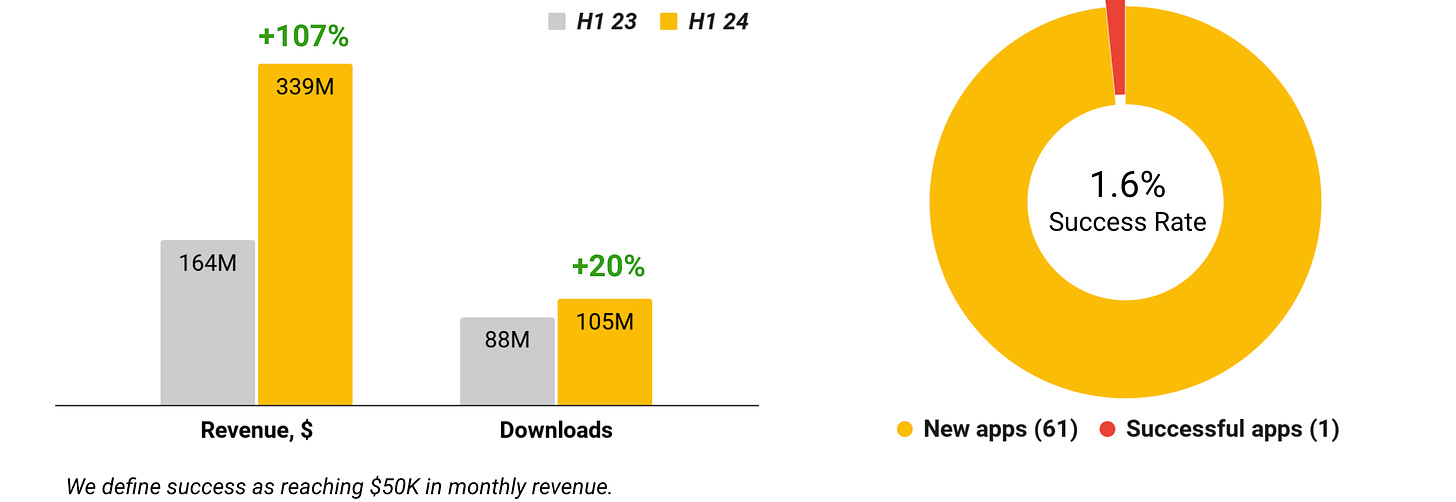
- Revenue from projects in this genre increased by 107% in H1'24 – from $164 million last year to $339 million. Downloads grew by only 20% (from 88 million to 105 million).
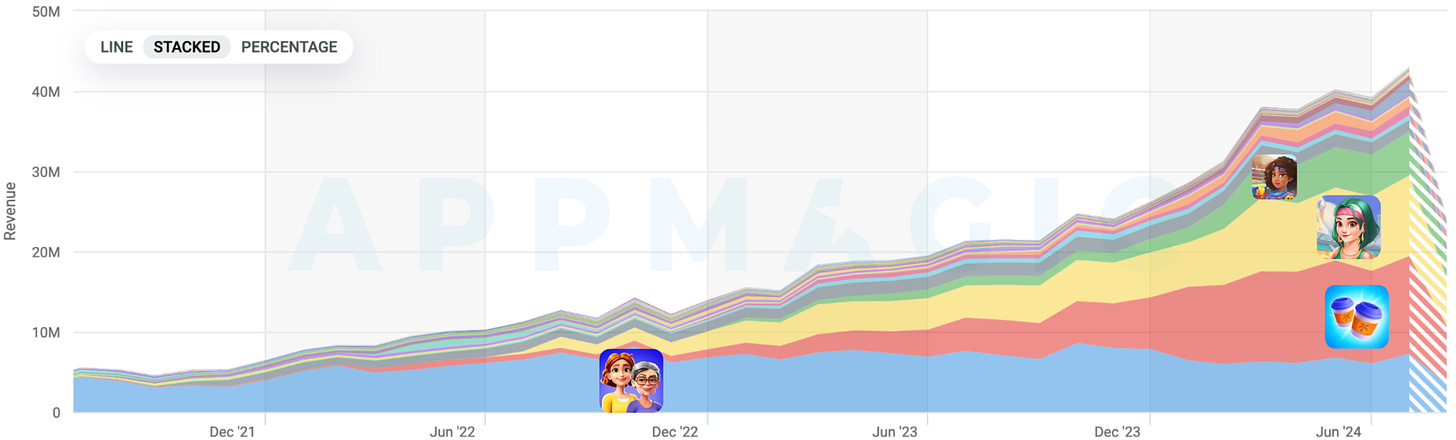
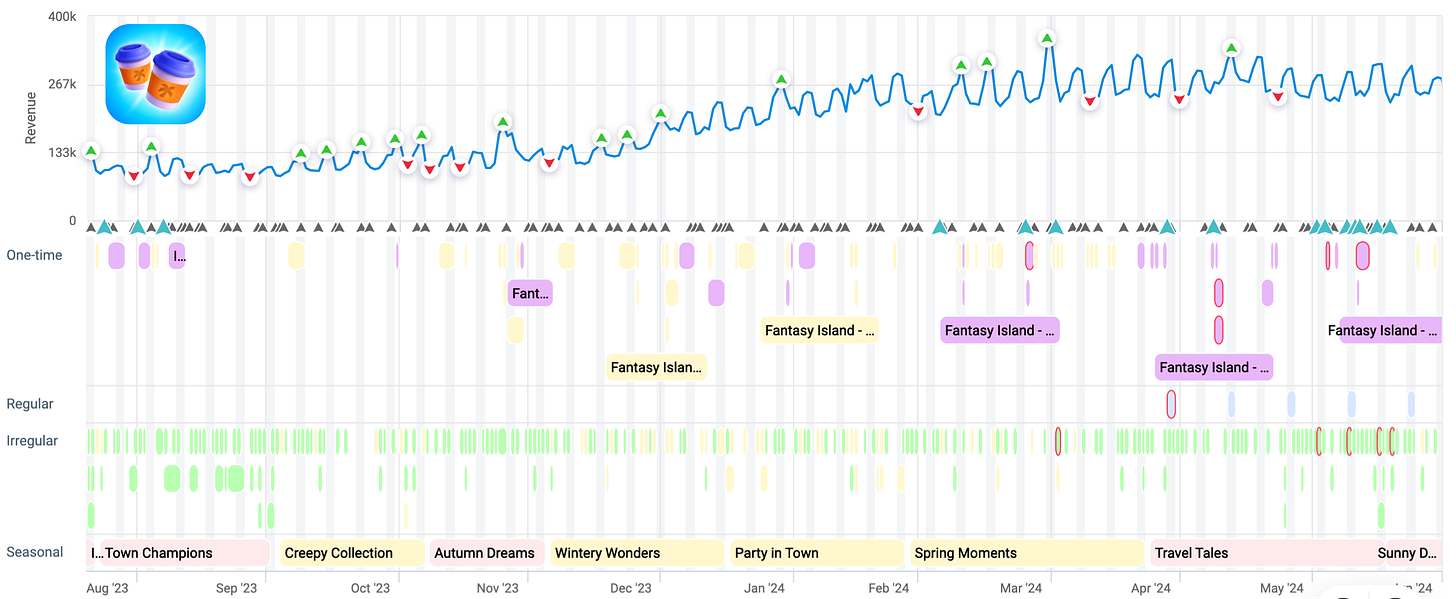
❗️The main reason is that the revenue leaders are well-established games like Travel Town, Gossip Harbor, and Seaside Escape. For example, Travel Town saw a significant increase in both event frequency and variety in H1'24.
- 61 projects in this genre were released in H1'24, and only one game is earning more than $50,000 a month – Merge Prison: Hidden Puzzle from Hong Kong’s Blue Ultra Game. Interestingly, the game’s setting is a prison. The Success Rate for the genre is 1.6%. This is better than in all of 2023, during which no "successful" projects were released.
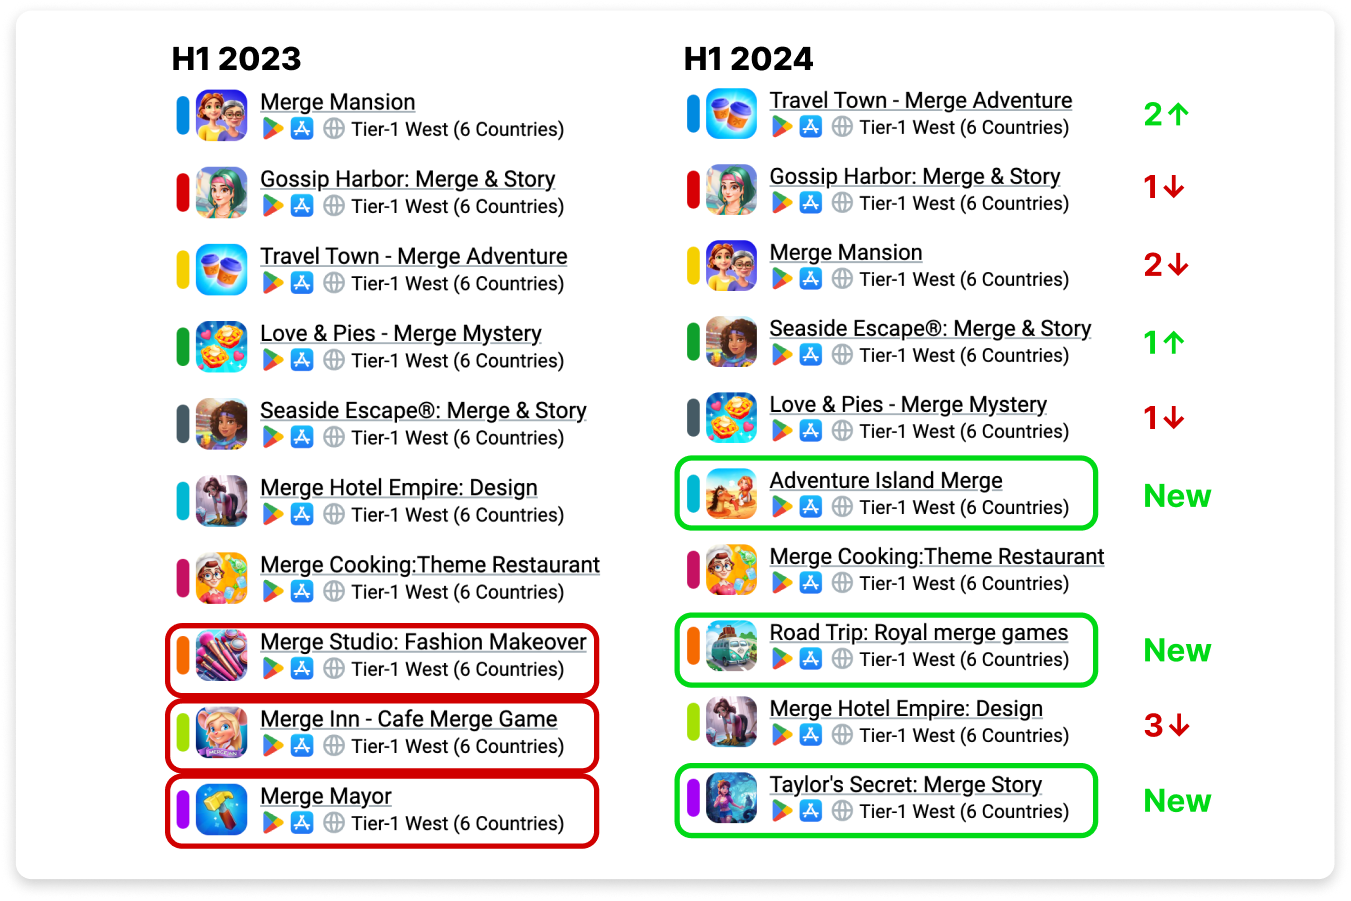
- Three new projects entered the top 10 in the first half of the year: Adventure Island Merge, Road Trip: Royal Merge Games, and Taylor’s Secret: Merge Story. There were also changes at the top – Merge Mansion was dethroned from the first spot, for instance.
Match 3D
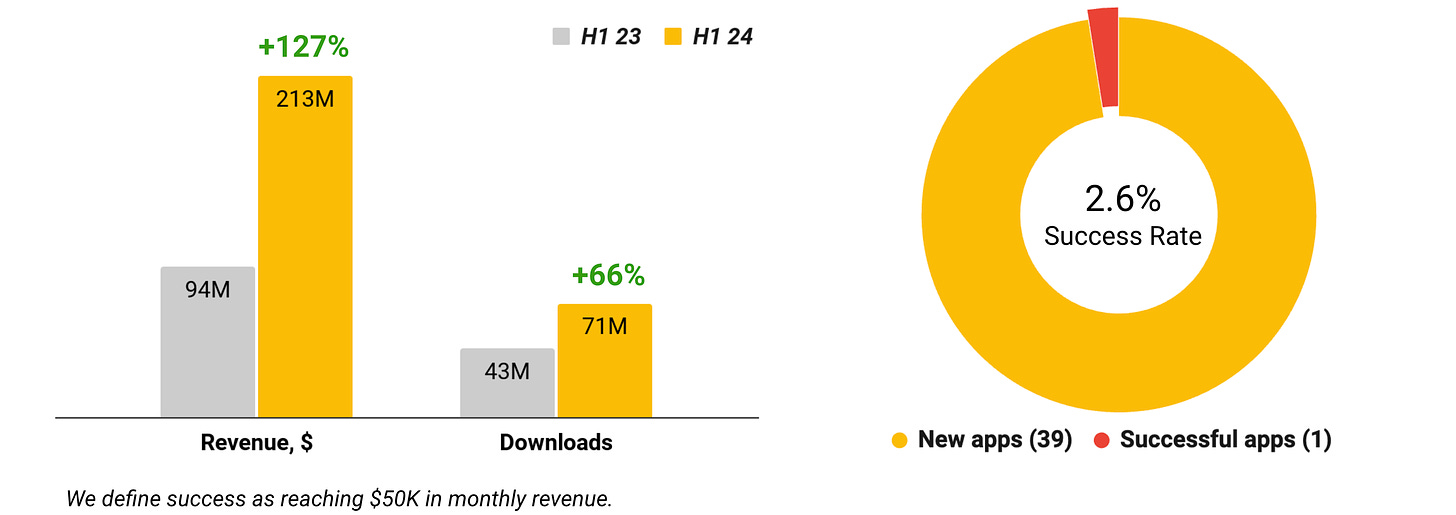
- Revenue for the genre grew from $94 million in H1'23 to $213 million in H1'24, an increase of 127%. Downloads also grew significantly, by 66%, from 43 million to 71 million.
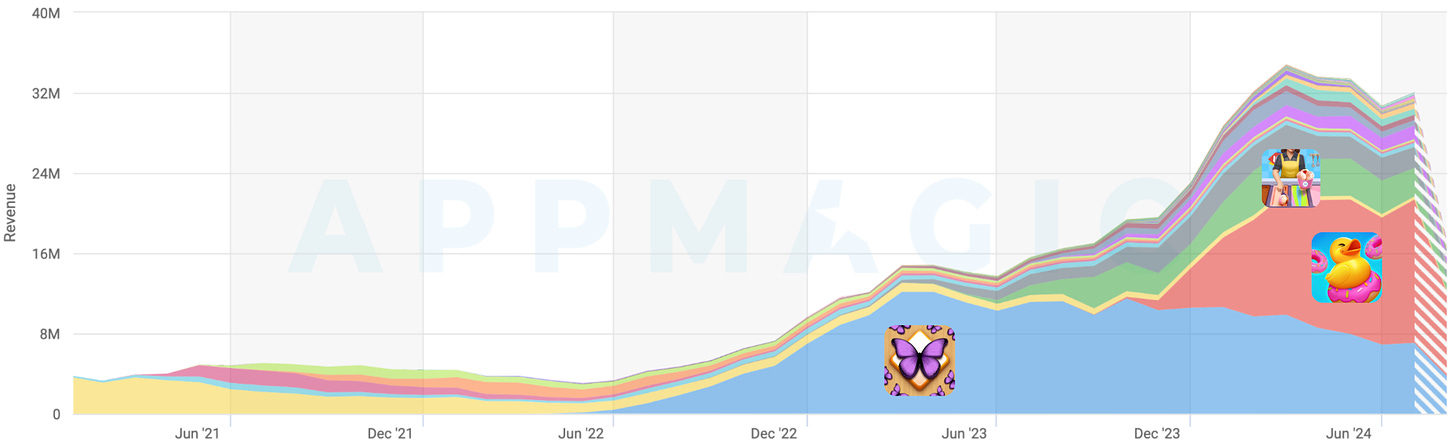
- In H1'24, 39 new projects were released in the genre, one meeting the success criteria (Success Rate – 2.6%). This was Match Rush 3D: ASMR Care.
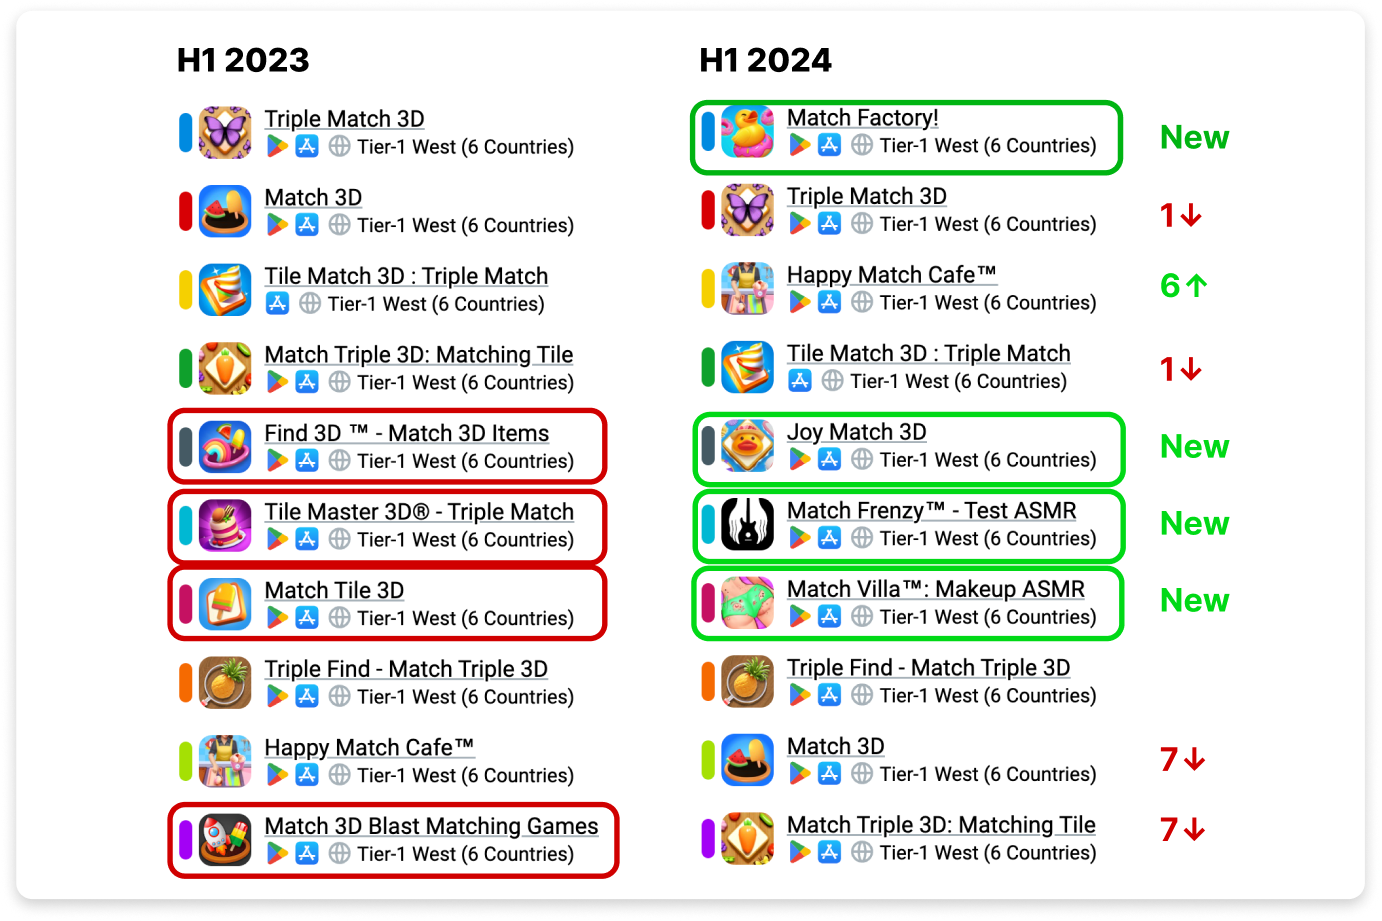
- The genre’s growth is largely driven by new projects. The previous genre leader, Triple Match 3D, is stagnating. Match Factory! (over $100 million in lifetime revenue) and Happy Match Cafe (over $44 million in lifetime revenue) are growing. In the H1'24 top 10, in addition to Match Factory!, there are three other projects: Joy Match 3D, Match Frenzy – Test ASMR, and Match Villa: Makeup ASMR.
Idle Tycoon
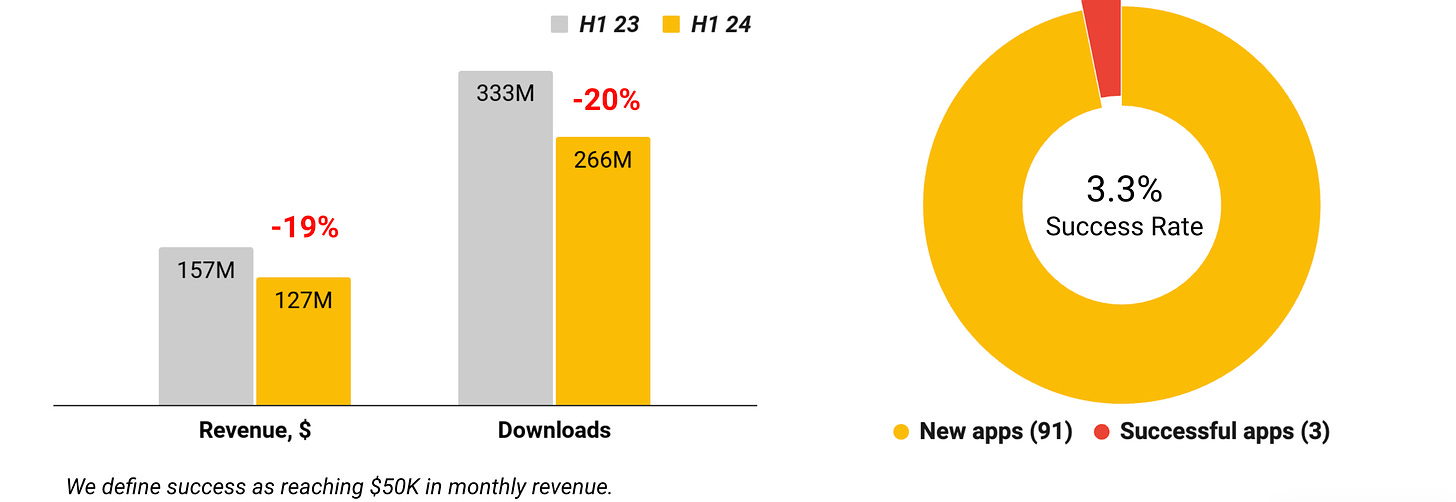
- Genre revenue fell from $157 million in H1'23 to $127 million in H1'24, a 19% decline. Downloads also dropped from 333 million to 266 million (-20% YoY). It’s important to note that H1'23 was the genre's peak, largely thanks to Frozen City.
- In H1'24, 91 games were released, three of which crossed the $50,000-per-month revenue mark. Success Rate – 3.3%.
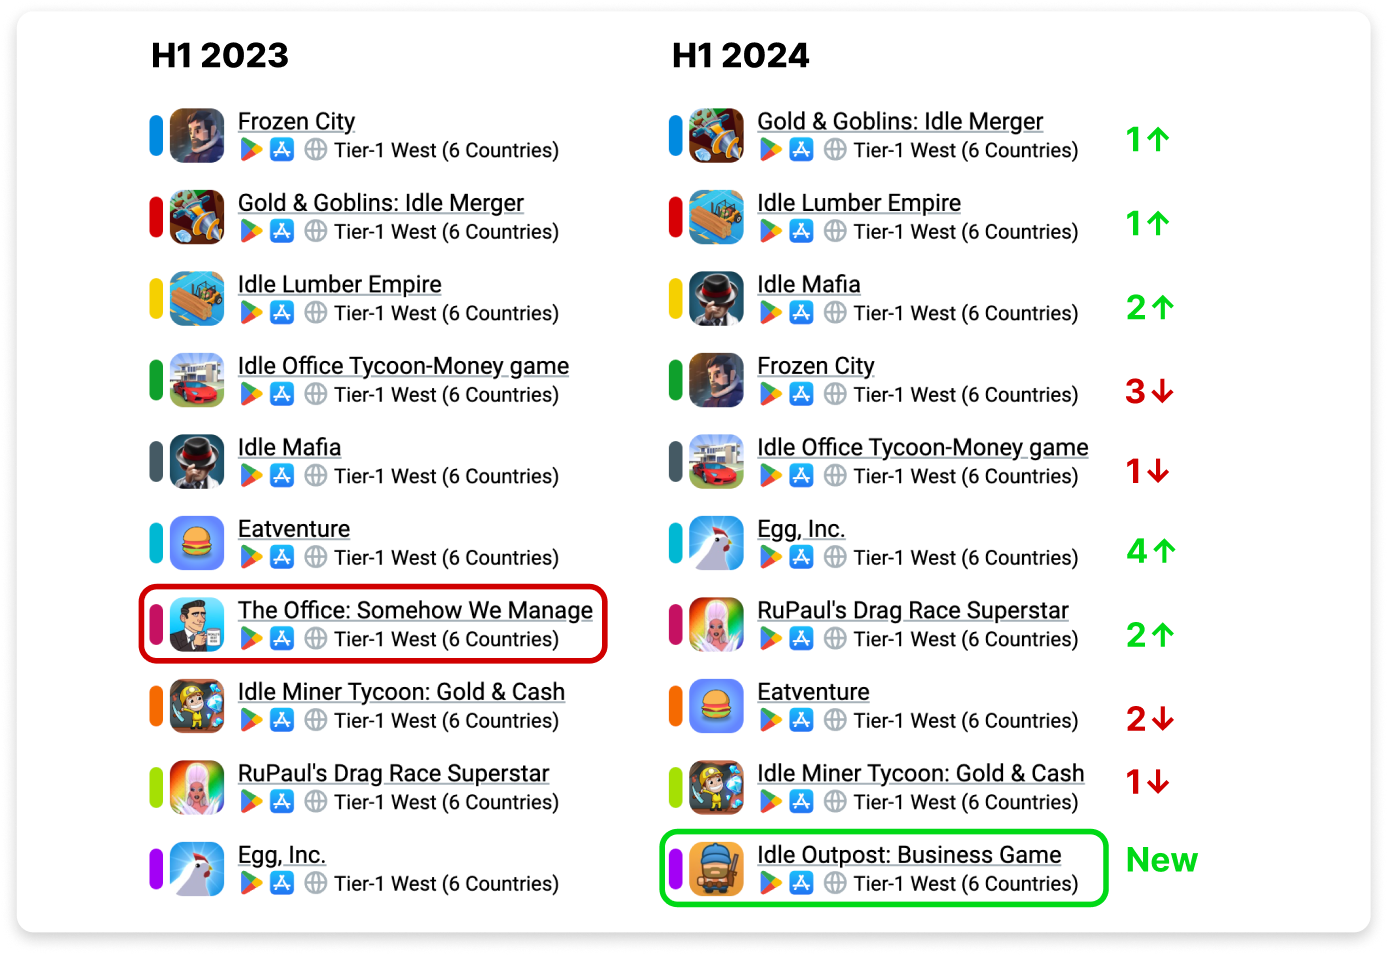
- Only one new game entered the top 10: Idle Outpost: Business Game.
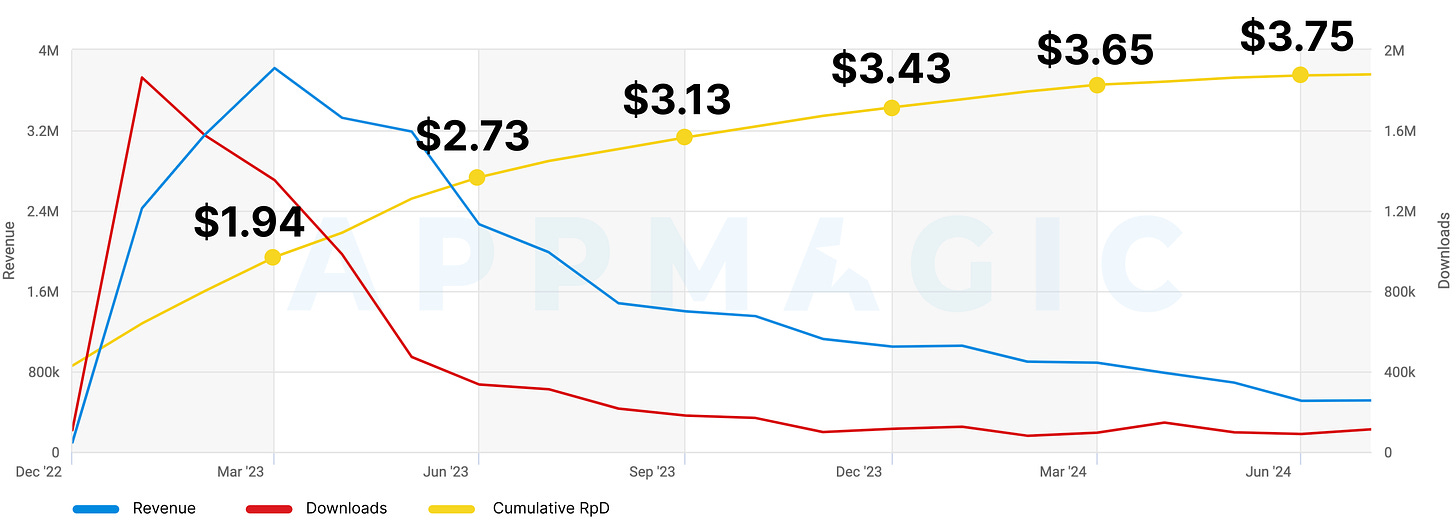
❗️AppMagic analysts note that Frozen City has entered the operational stage. Both downloads and overall revenue for the game have dropped significantly, but RPD continues to rise. In June 2024, the game earned $3.75 per acquired user.
- According to AppMagic, the Idle Tycoon genre is overheated. There is intense competition, and leaders don’t stay at the top for long, while no one has yet managed to reach a significant revenue plateau.
Casual Casino (Social Casino)
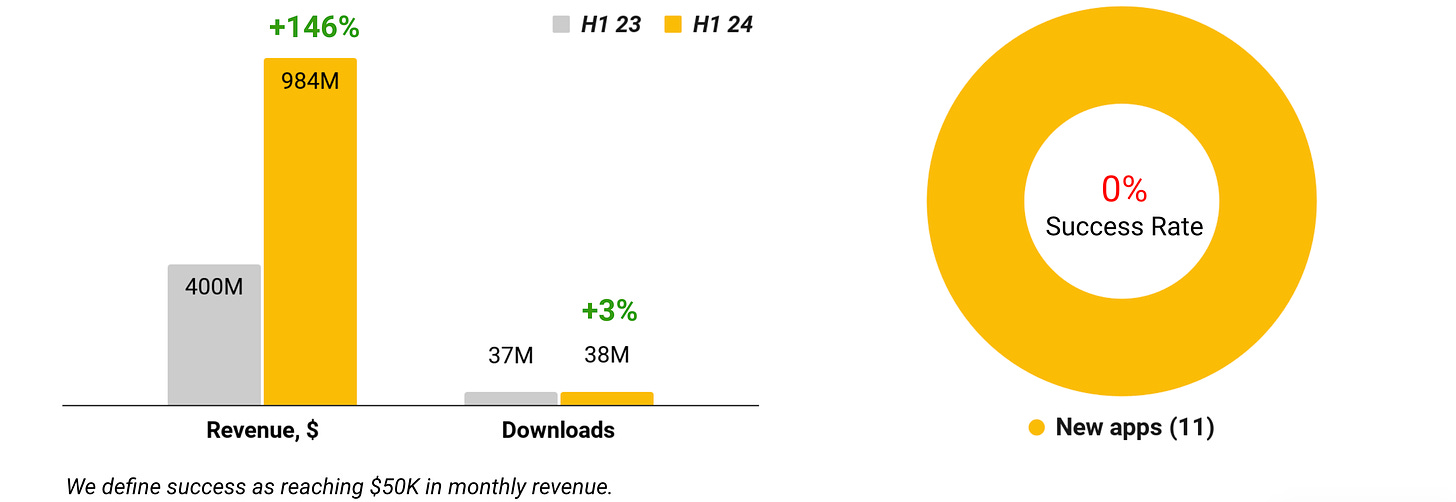
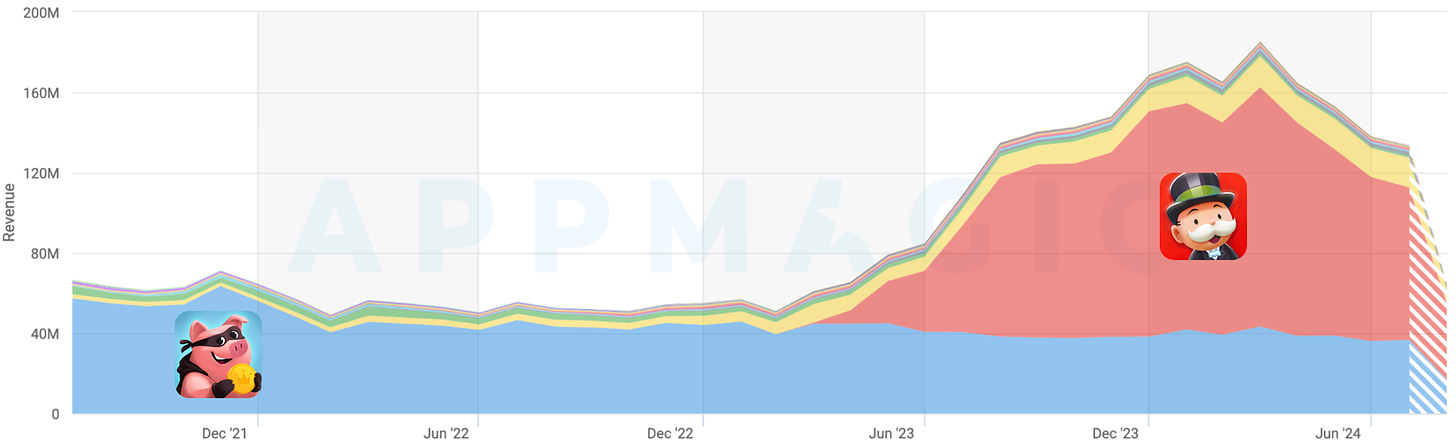
This genre includes Coin Master, MONOPOLY GO!, Dice Dreams, and similar projects.
- Genre revenue grew by 146% in H1'24 – to $984 million from $400 million the previous year. This is largely thanks to MONOPOLY GO!. Downloads grew by 3% – from 37 million to 38 million.
- In the first half of 2024, 11 games were released in the genre. None have yet reached the success criteria.
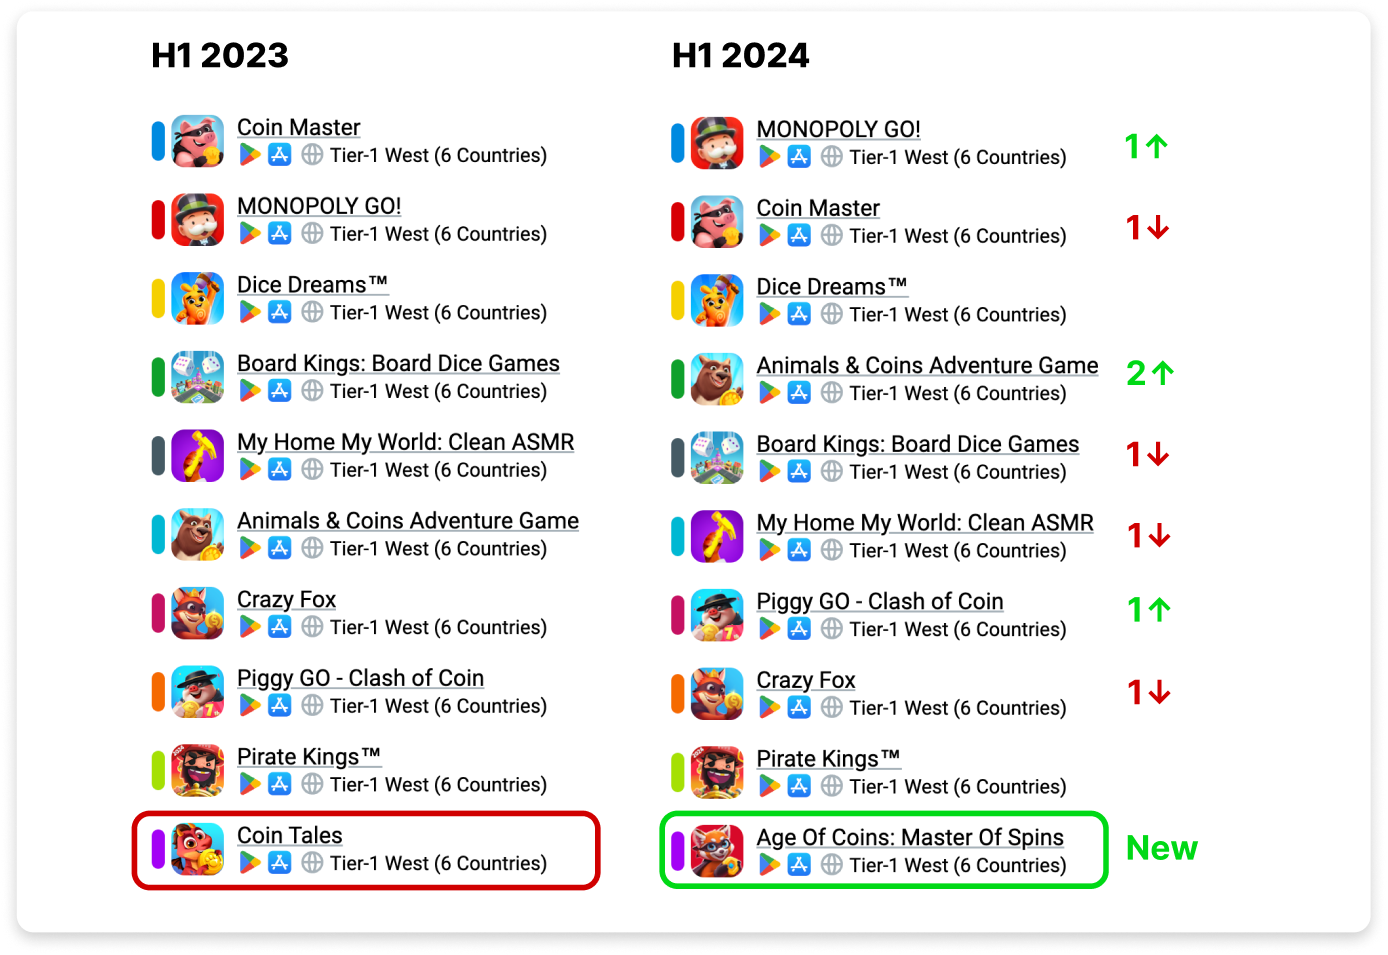
- MONOPOLY GO! accounted for 63% of the genre’s revenue in H1'24, Coin Master for 24%, and Dice Dreams for 9%. The remaining 4% was shared among other games. One newcomer to the top 10 in the first half of the year is Age of Coins: Master of Spins.
Sort Puzzle
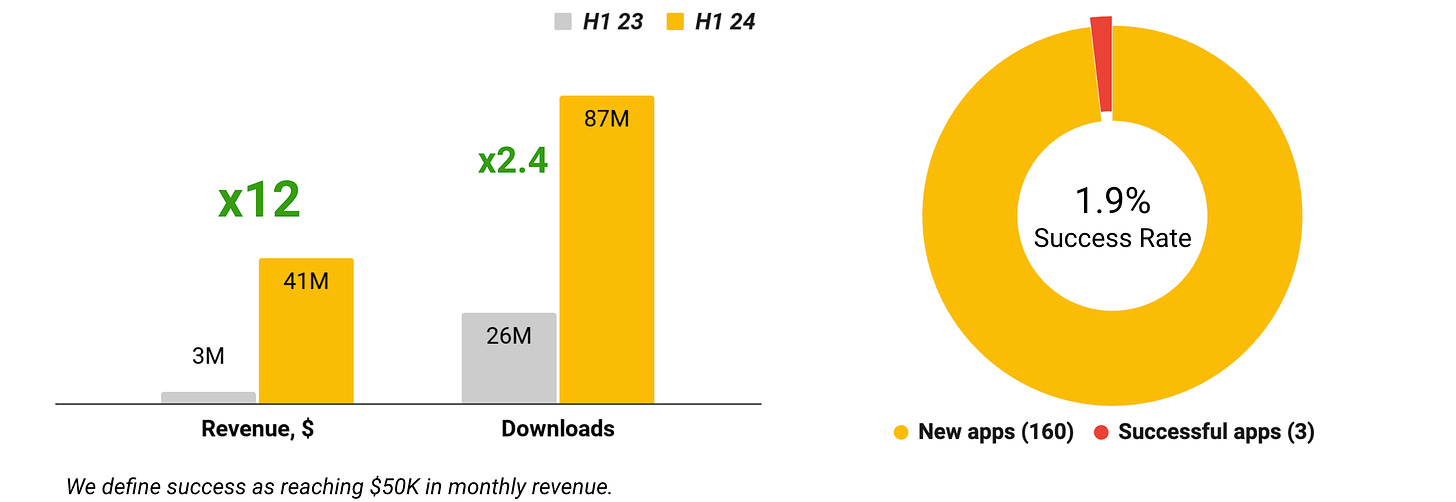
- Genre revenue grew 12-fold in H1'24 – from $3 million to $41 million. Downloads increased 2.4 times – from 26 million to 87 million.
- 160 new games were released in the genre in the first half of the year, three of which crossed the $50,000-per-month revenue mark. Success Rate – 1.9%.
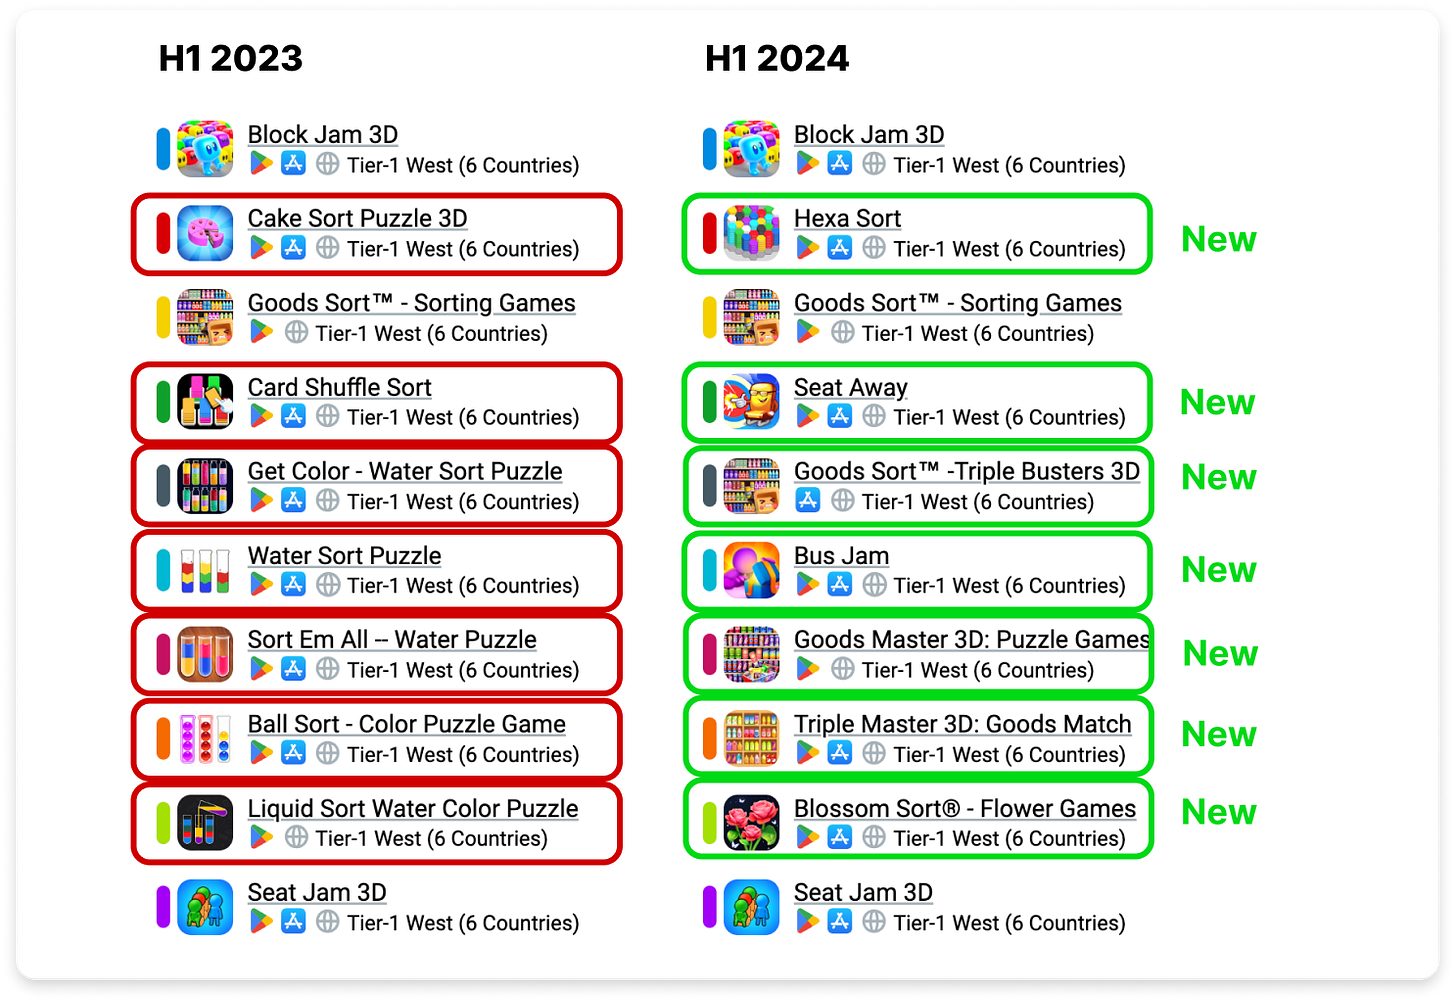
- The genre emerged relatively recently. In H1'24, seven new projects entered the top 10. The genre is at the intersection of hyper-casual and casual genres, and the data shows that downloads have started to fall while IAP (In-App Purchase) revenue has sharply increased.
Unity: Mobile User Acquisition and Monetization trends in 2024

Data was collected from ironSource, Unity Ads, and Tapjoy.
Trend 1: Advertisers are diversifying their UA campaign optimization
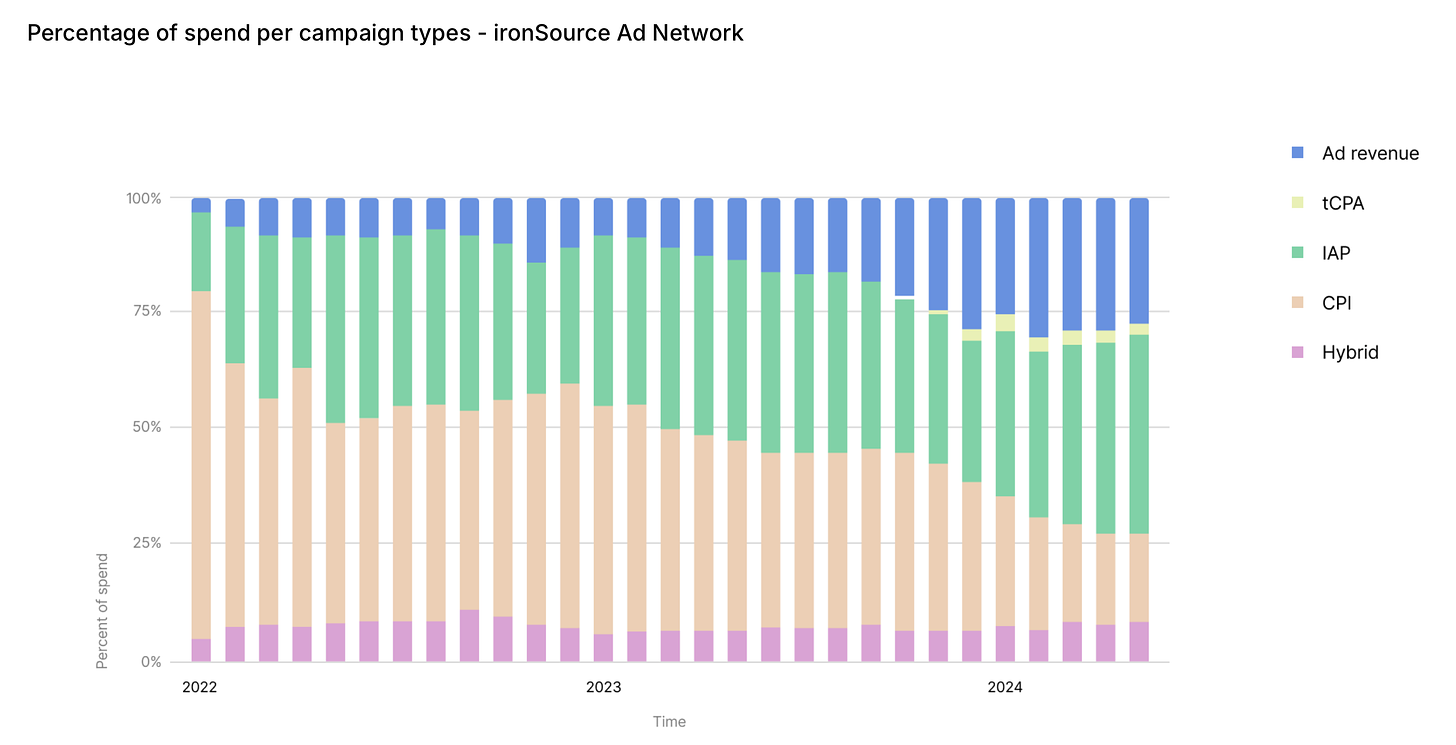
- Over the past two years, advertisers have increased their spending on campaigns optimized for ad revenue, IAP (in-app purchases), and hybrid ROAS (return on ad spend). There's also a rise in campaigns with tCPA (target cost per action) and tCPE (target cost per event), while interest in CPI (cost per install) campaigns is declining.
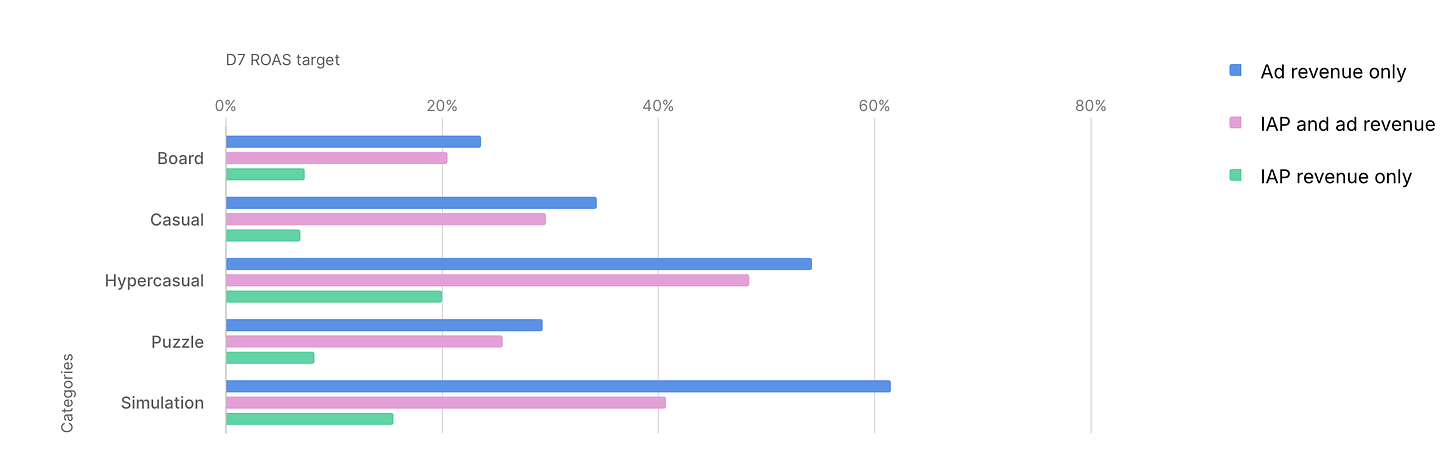
- When looking at D7 ROAS (7-day return on ad spend) targets, leaders in spending still primarily optimize for ad revenue, but optimization for IAP + ad revenue is gaining popularity.
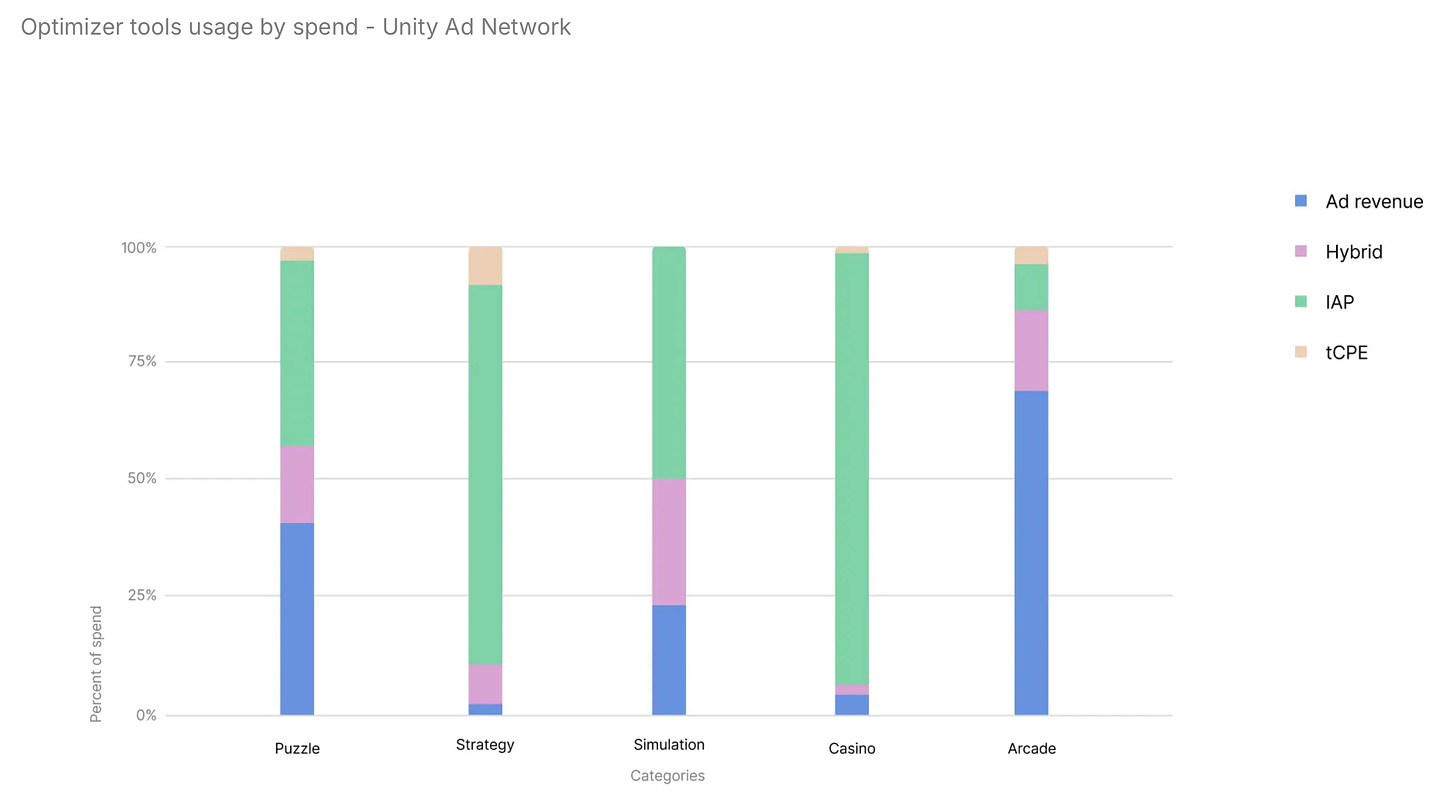
- In the top 5 game genres across countries, the mix of optimizations varies greatly. For example, puzzle games equally use optimizations for ad revenue and IAP, while IAP optimization dominates in casino games.
- Regarding event optimization, according to ironSource data, the most popular options include level completion, free trial registration, making an IAP, or watching a certain number of ads.
❗️Unity advises selecting an action performed by the top 5-20% of high-LTV users during their first seven days in the game. However, the company notes that the more complex the action, the lower the conversion rate, and the longer the campaign will take to learn.
- Benchmarks for IPM (installs per mille) by genre: Arcade (24 IPM), Simulation (14.9 IPM), Action (10.9 IPM), Puzzle (10.3 IPM), Strategy (7.1 IPM).
Trend 2: It’s difficult to convert users into payers

- On average, only 1.83% of users make an IAP. However, 26.5% of users who made a purchase once will make at least one more purchase within 30 days. Another 1.37% will do so within 60 days, and 0.46% within 90 days.
❗️Unity recommends adapting offers to the user’s stage in the game.
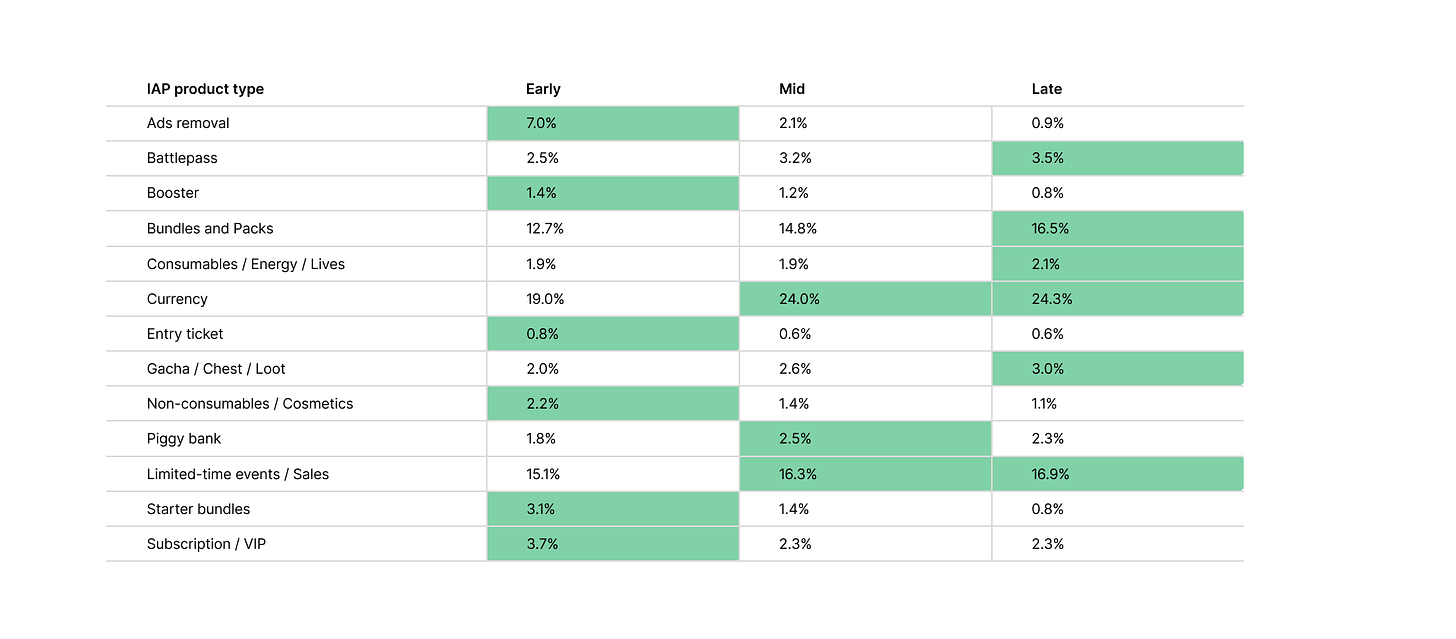
- In-game currency sells well at all stages of the user’s lifecycle, with limited-time offers and bundles being particularly effective.
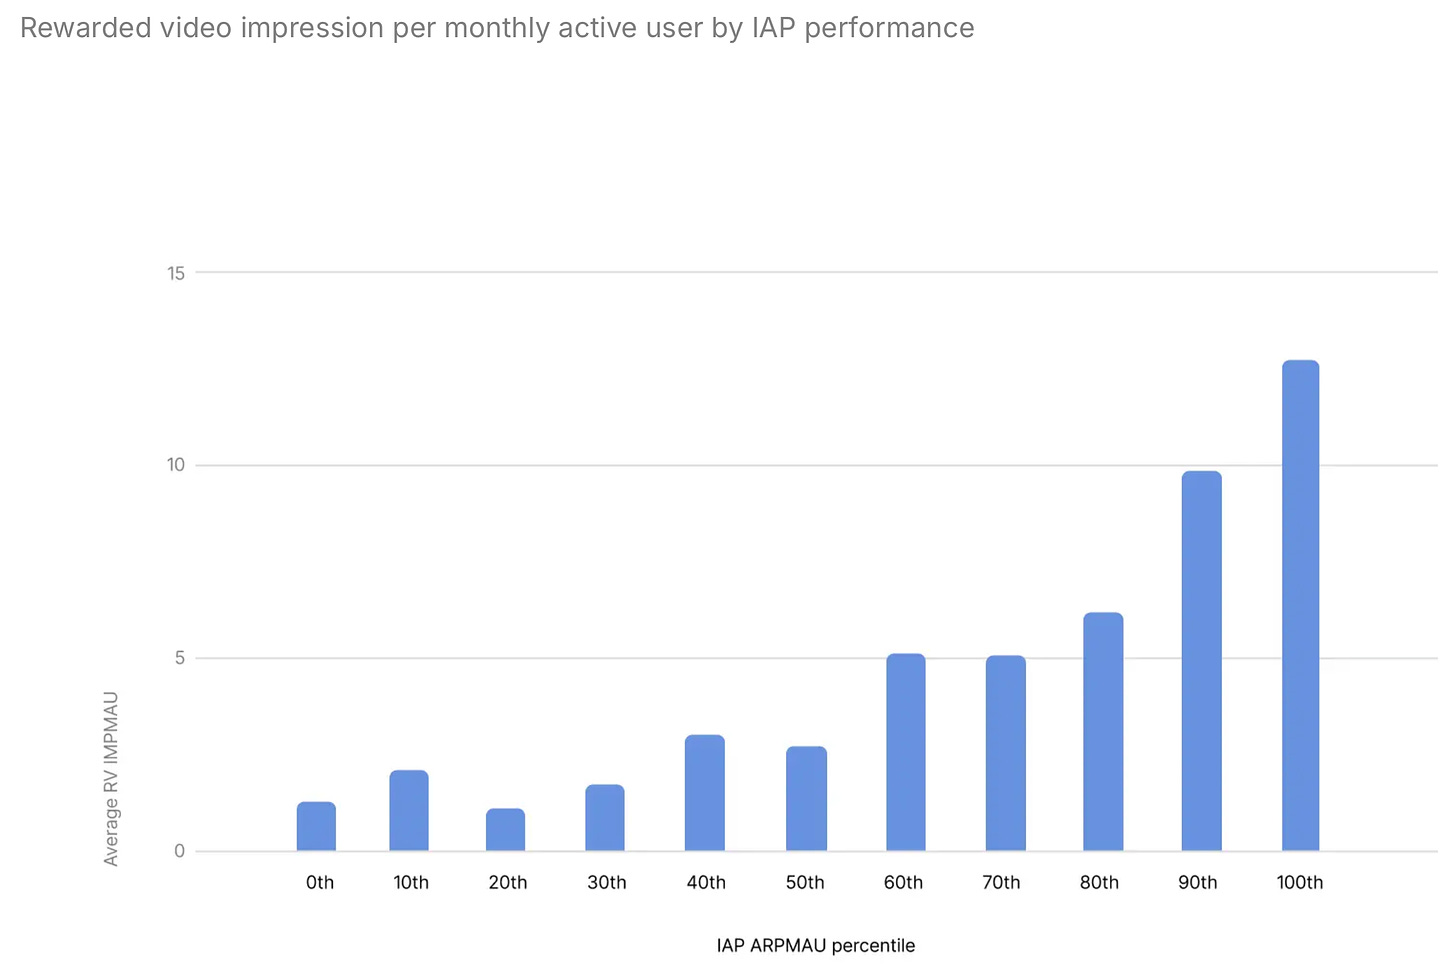
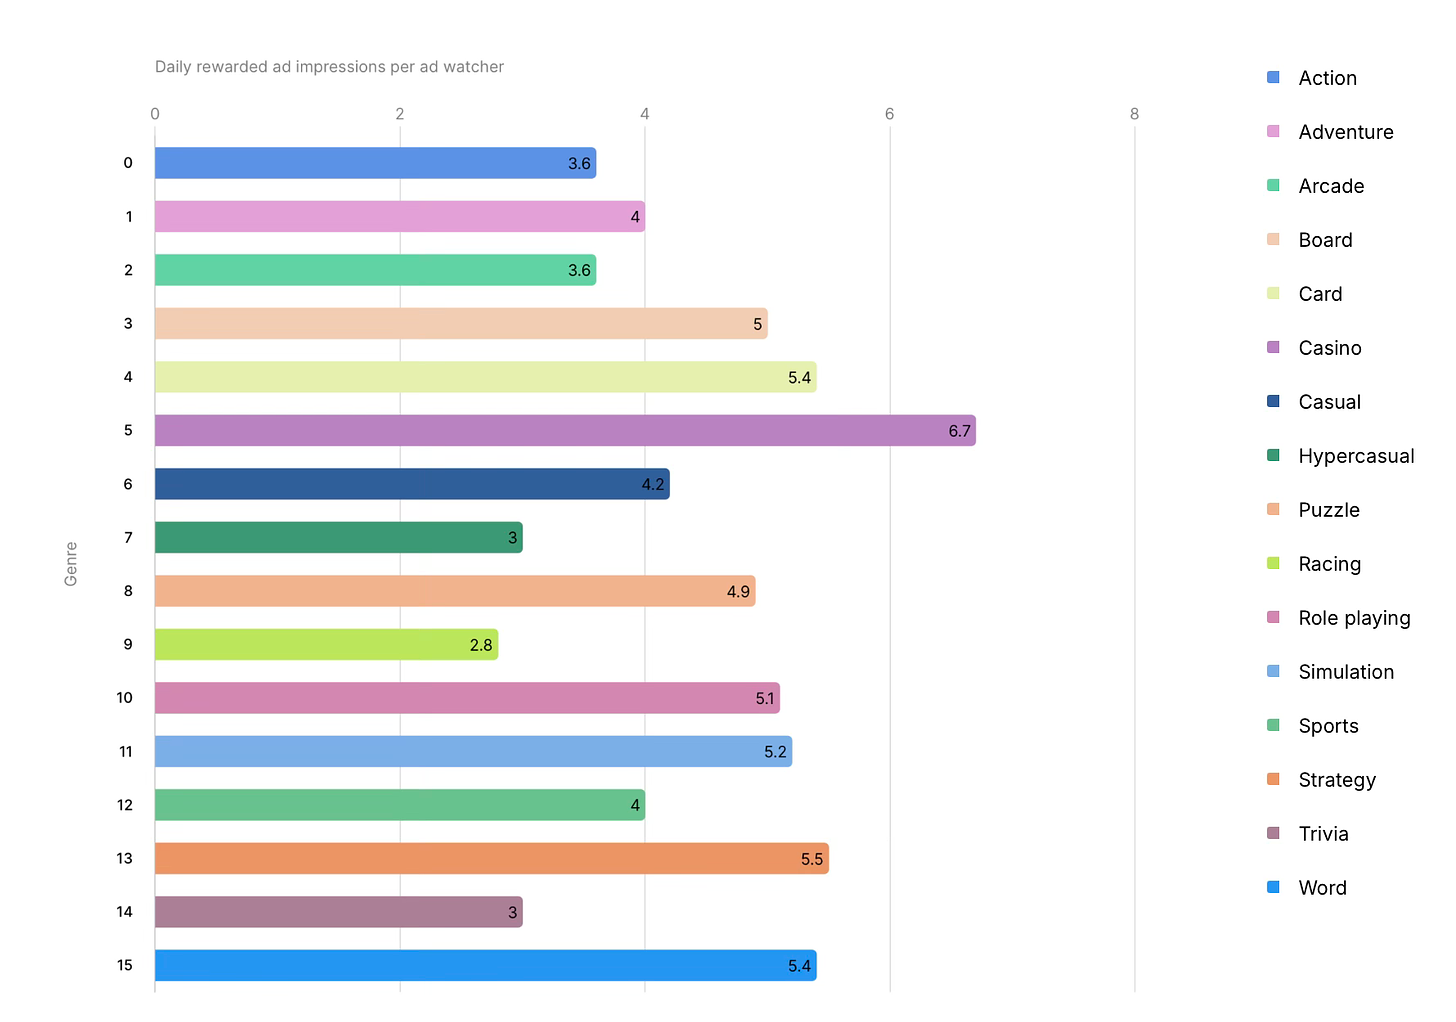
- Games with high IAP revenue also see higher views of Rewarded Video ads.
Trend 3: More users are watching ads
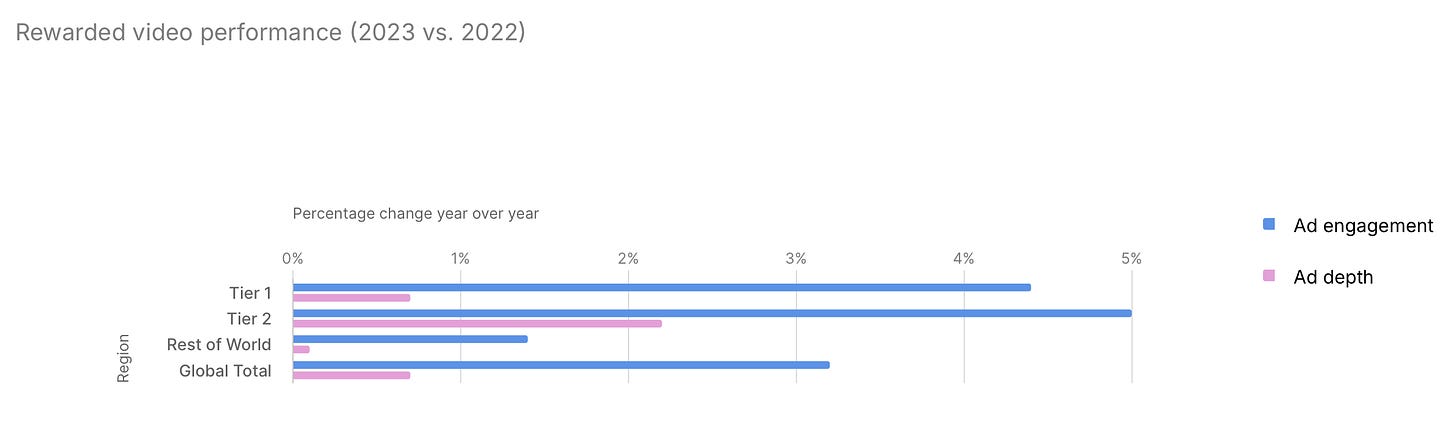
- User interaction with ads increased by 3.2% in 2023, with Tier 1 and Tier 2 countries leading the growth. This is likely due to worsening economic conditions, prompting users to seek other ways to gain in-game bonuses.
- Rewarded Video ads are most popular in RPGs, casual, and word games.
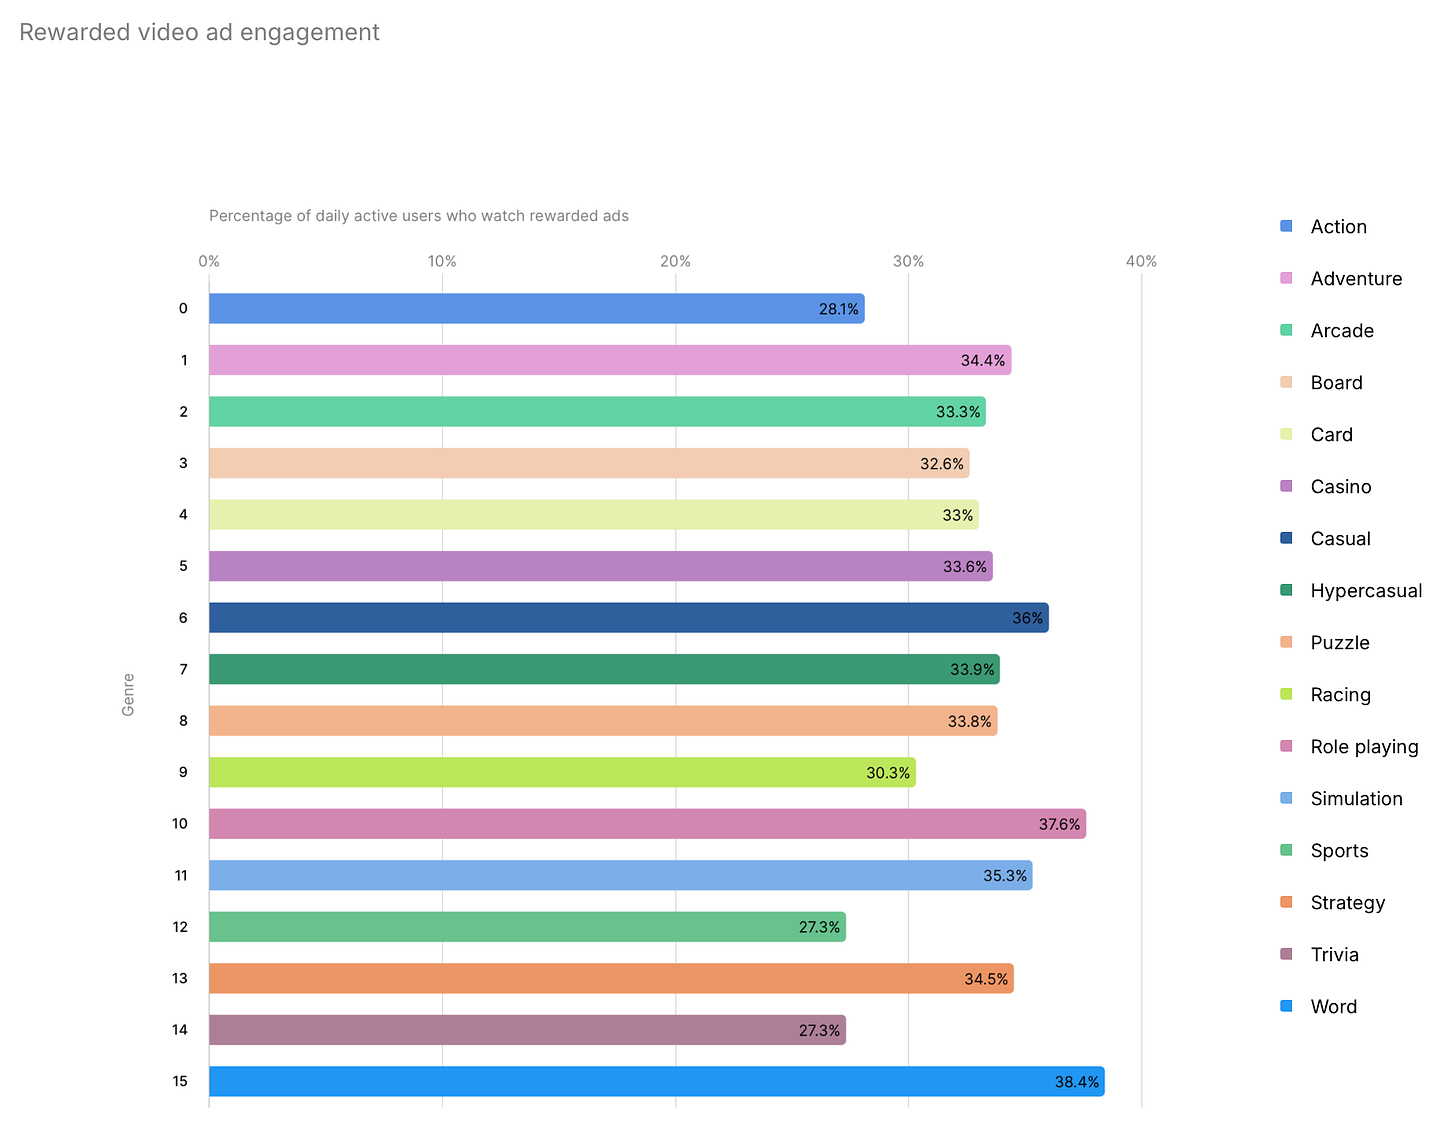
- The most ad views are seen in casino, strategy, and word games.
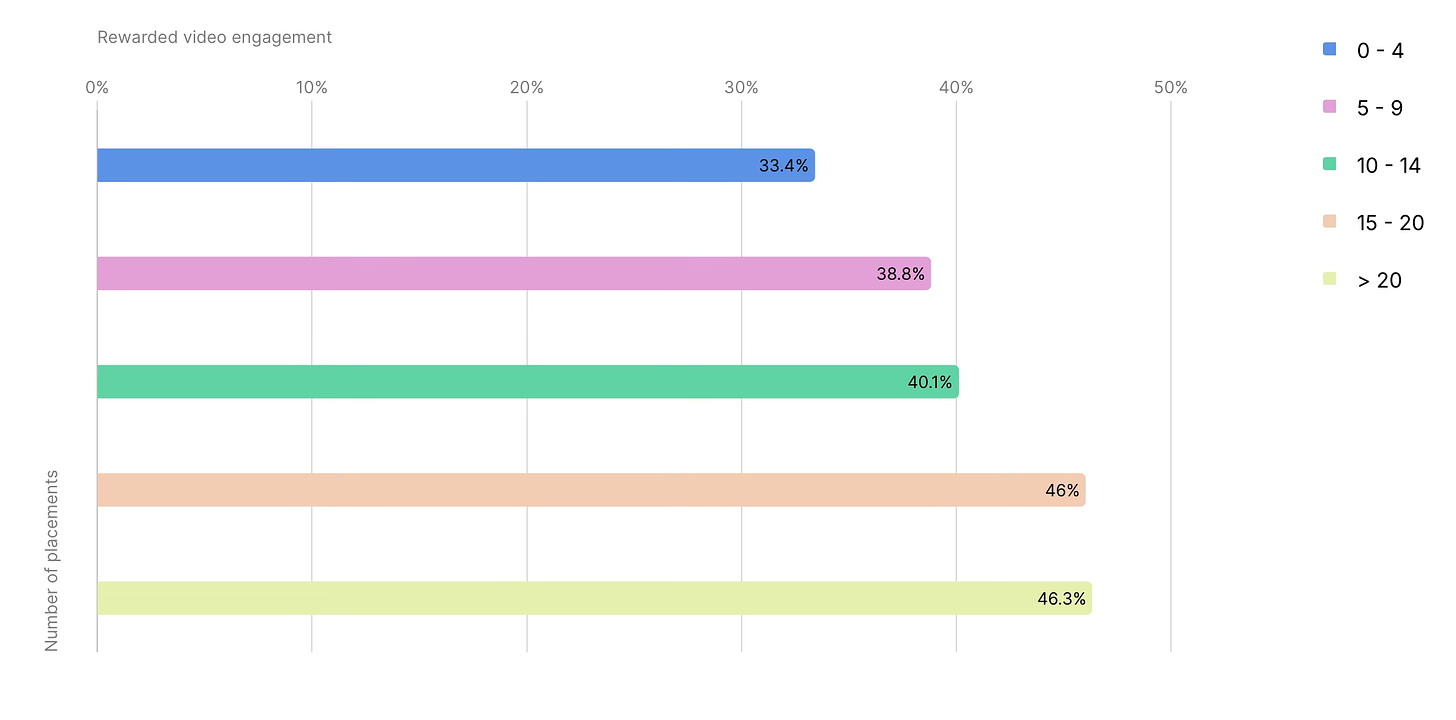
- The right placement of Rewarded Ads increases views. Offering ads when the user runs out of resources results in a 38.1% conversion rate, while the conversion rate for ad views between levels is 23.8%.
- There’s a direct correlation between the number of Rewarded Ad placements and conversion rates. However, after 15-20 placements, conversion growth almost stops.
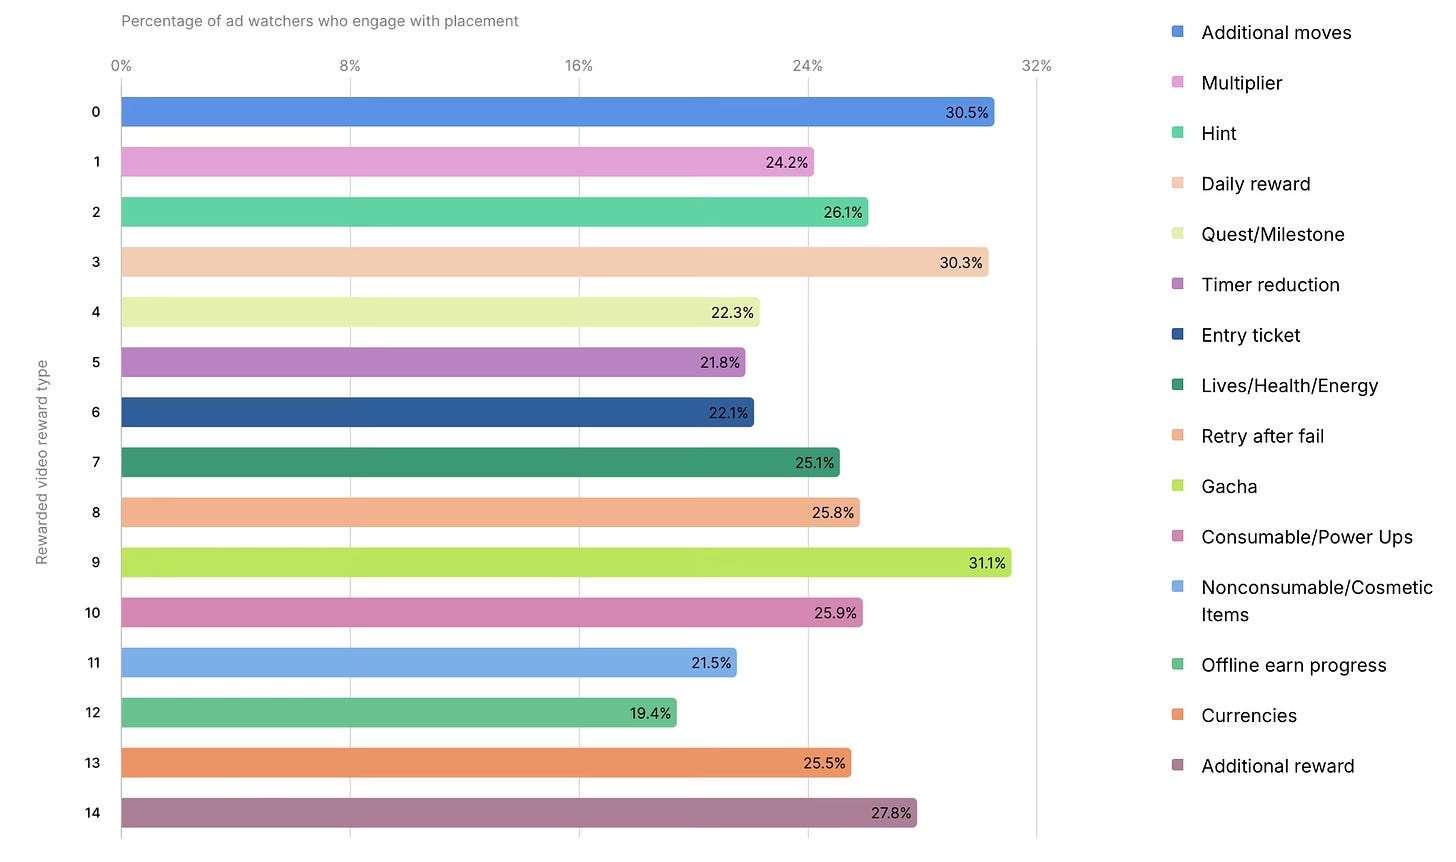
- Gacha (31.1% conversion), extra moves (30.5%), and daily rewards (30.3%) are the top motivators for watching Rewarded Ads.
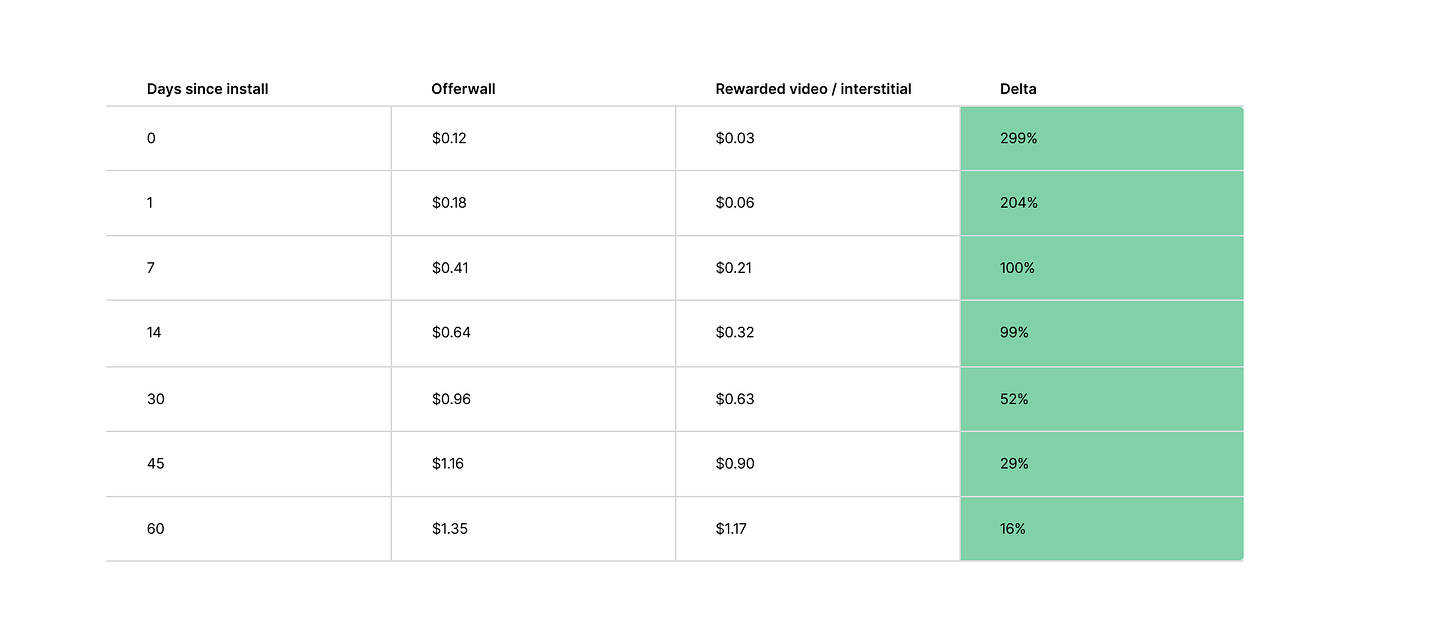
Trend 4: Offerwalls can attract highly motivated users
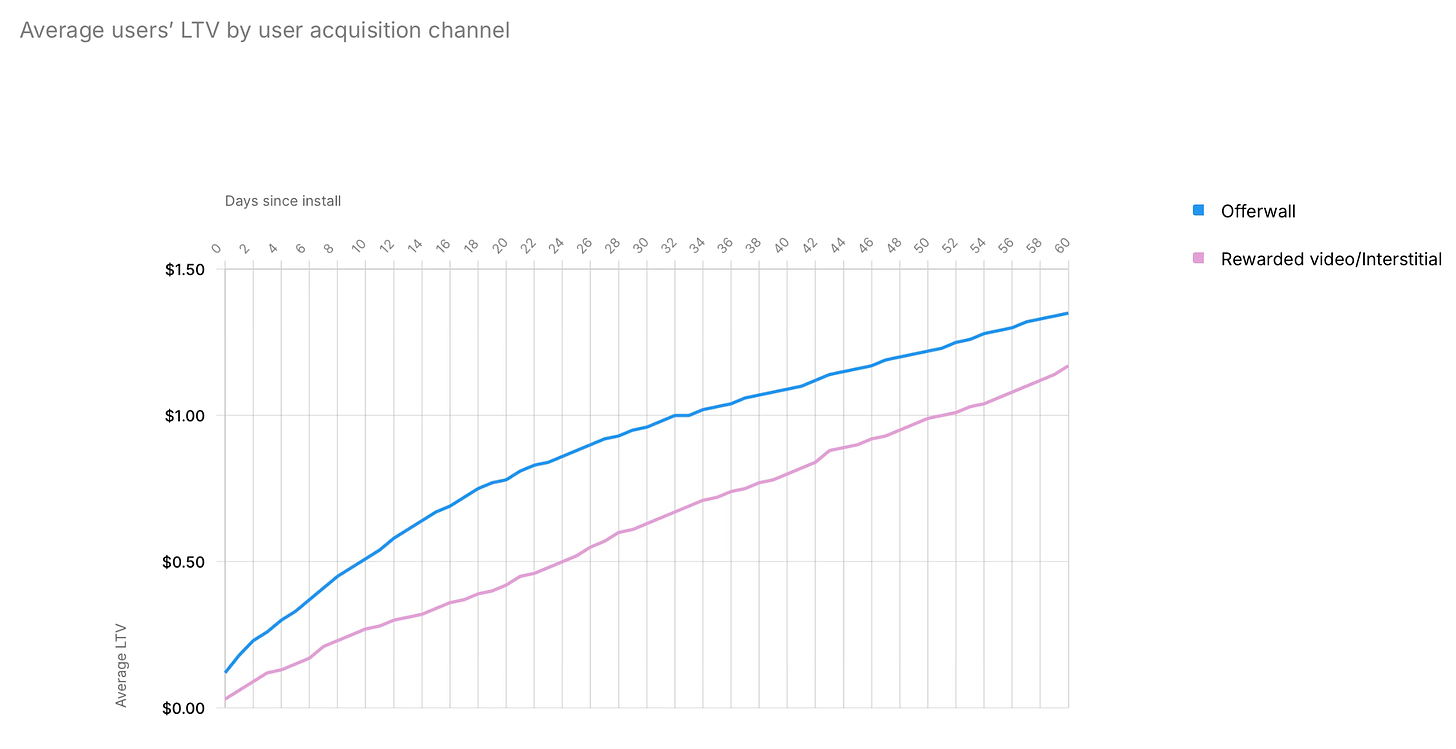
- Users who come through offerwalls tend to have a higher LTV than those who come after watching other types of ads. The difference on the day of installation is 299%, decreasing to 16% by day 60.
❗️In the long run, users' motivation might not be as high.
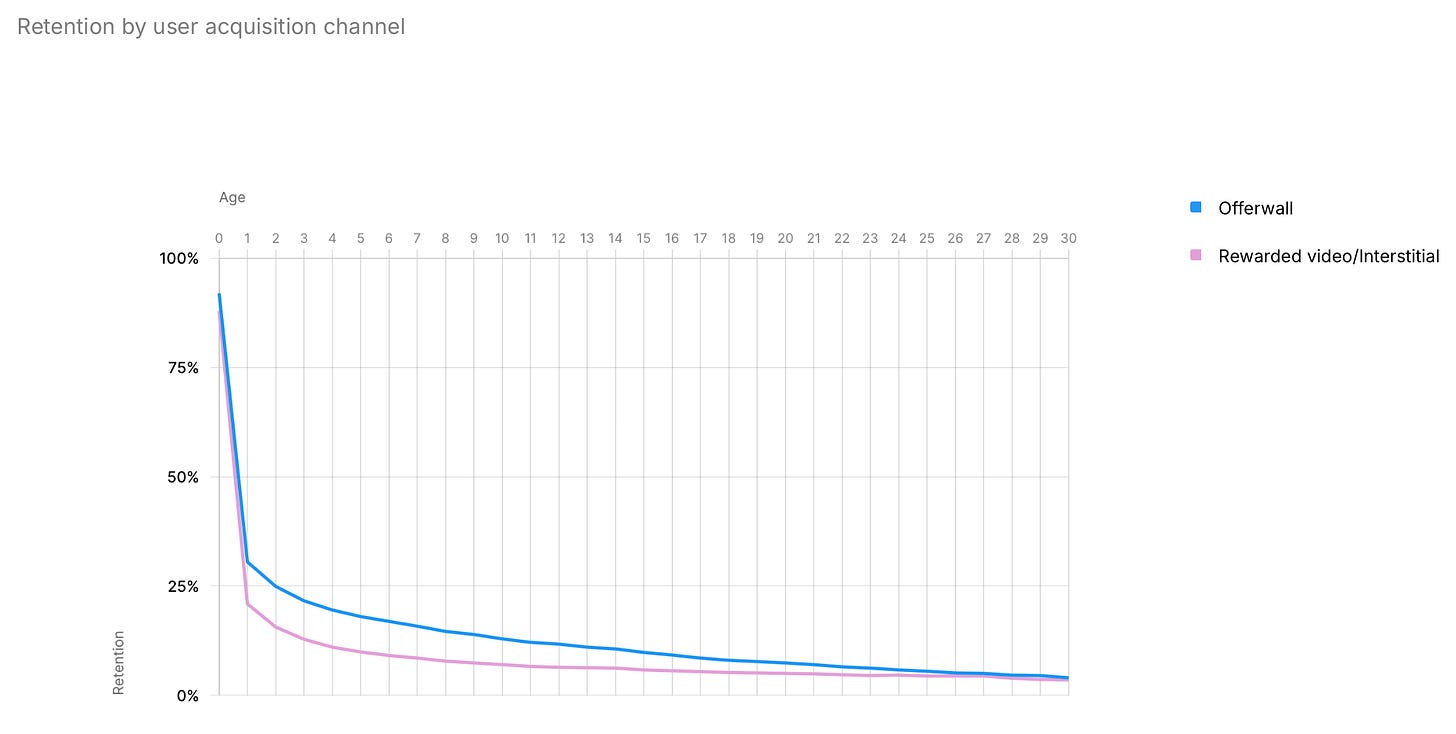
- Retention rates for users acquired through offerwalls are generally higher than for users who came through Rewarded Video or interstitial ads. The D7 difference is 71.7%, but it decreases to 12% by D30.
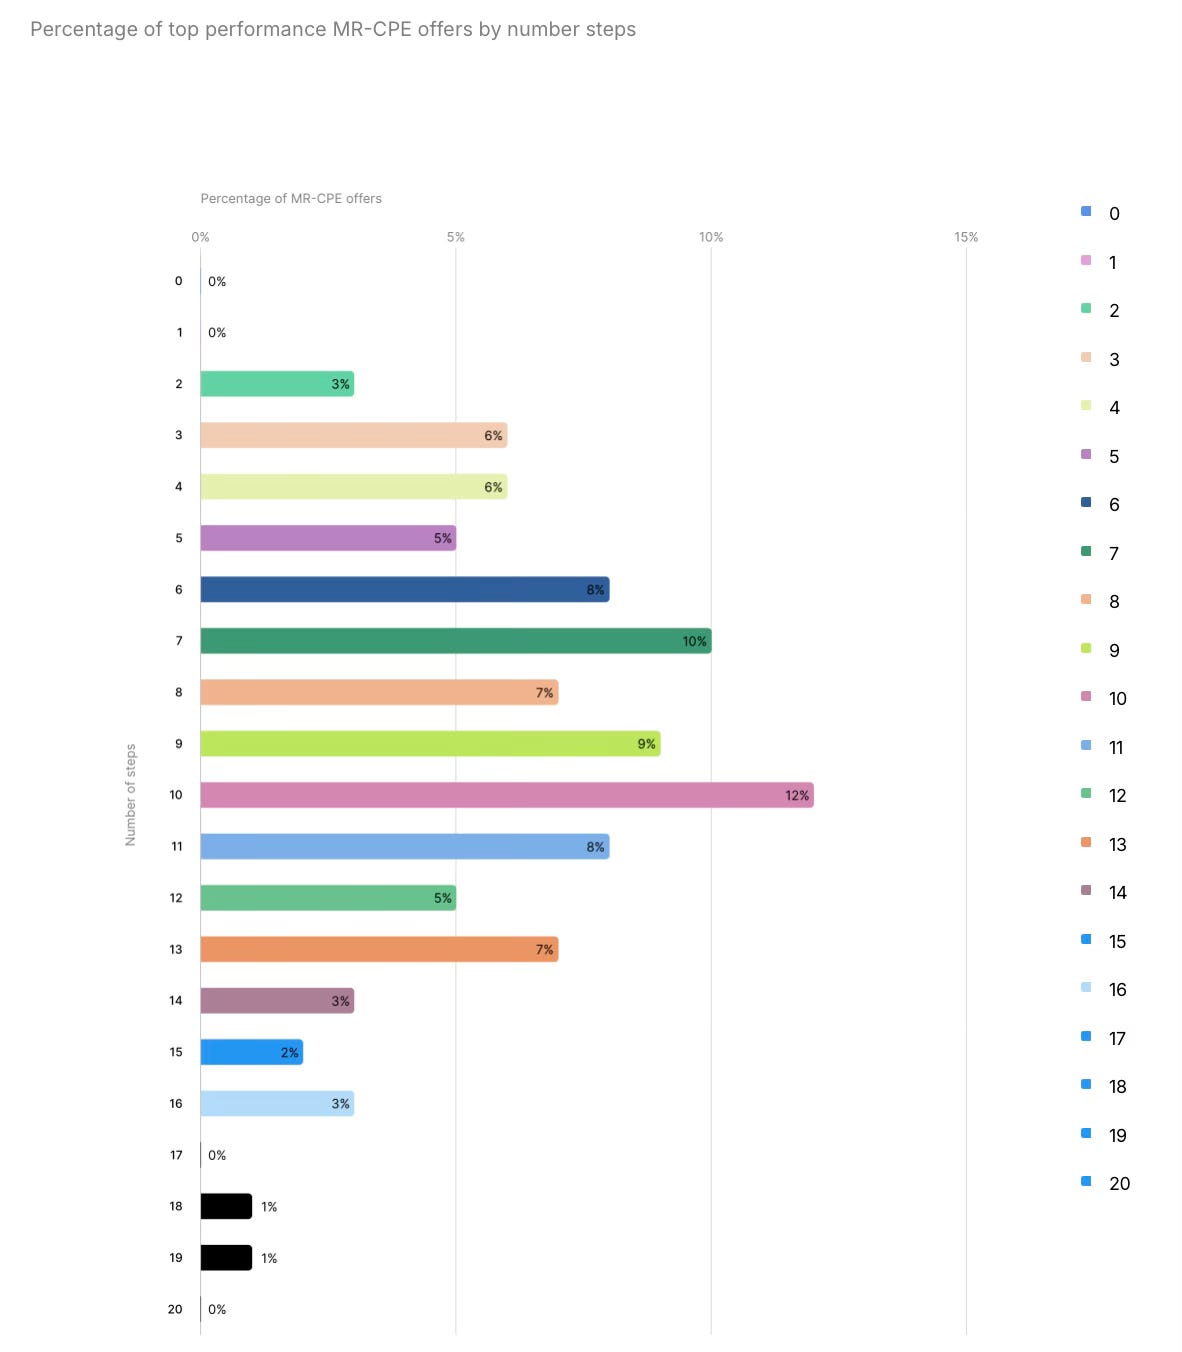
- MR-CPE (Multiple Reward Cost Per Engagement) campaigns are some of the best in terms of results. In 24.2% of these campaigns, there are 3 to 6 steps; 37.3% have 7 to 10 steps; and 23.2% have 11 to 14 steps.
- MR-CPE campaigns allow setting time limits. 63.5% of advertisers tie level completion to a time limit, 45% tie certain tasks, 30.2% tie IAP completion, and 26.4% tie tutorial completion to time limits.
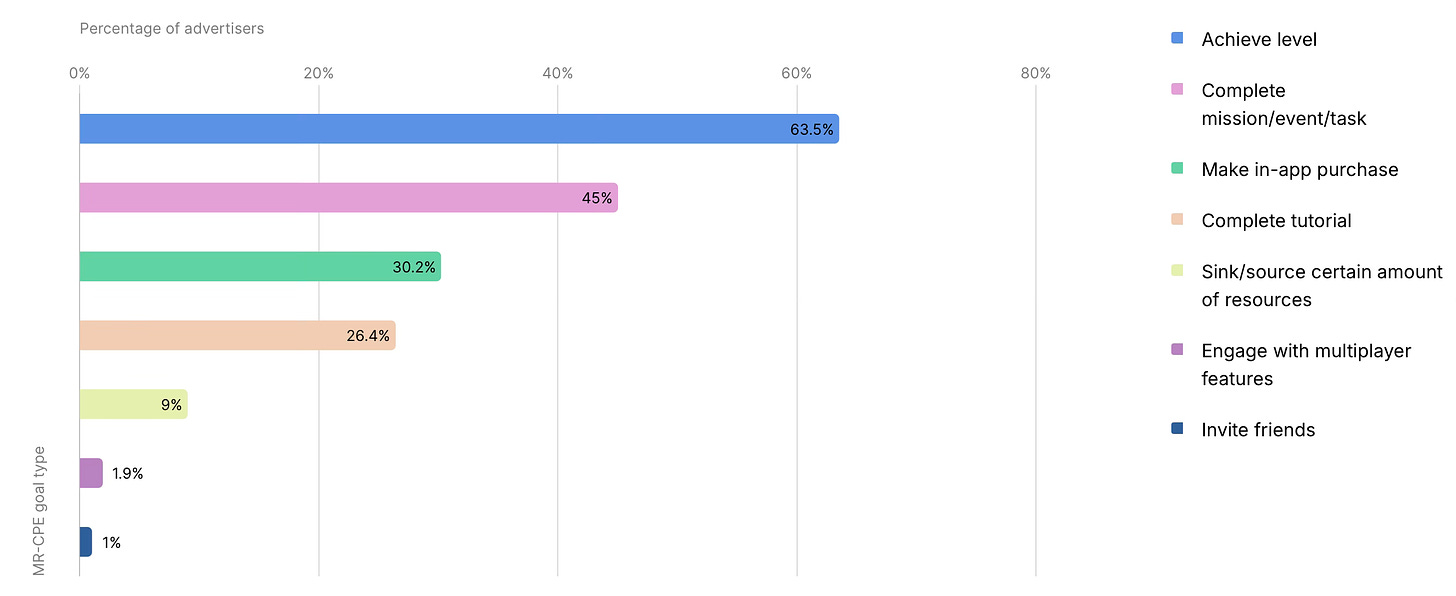
- The more complex the task, the lower the conversion rate. Almost 100% of users complete tasks tied to tutorial completion, but only 4.2% complete tasks related to IAP purchases.
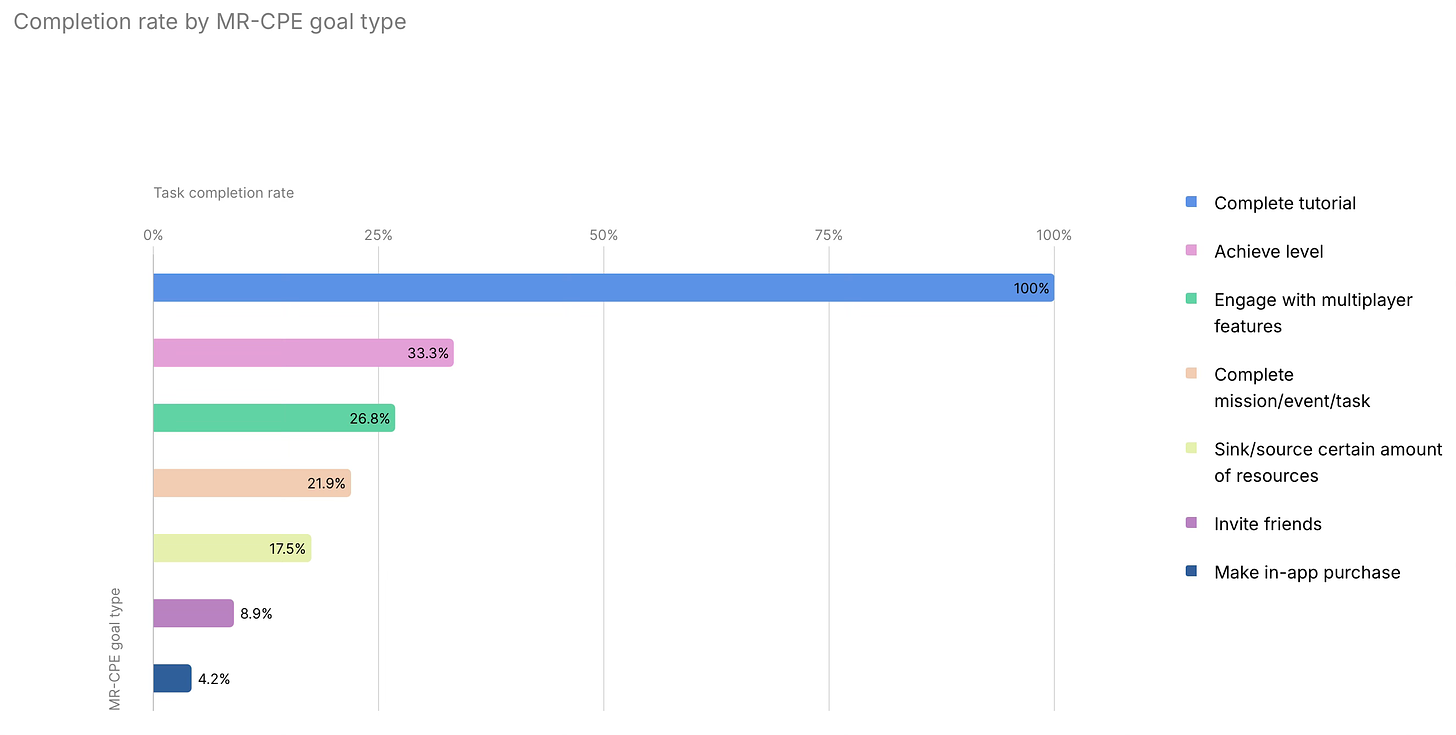
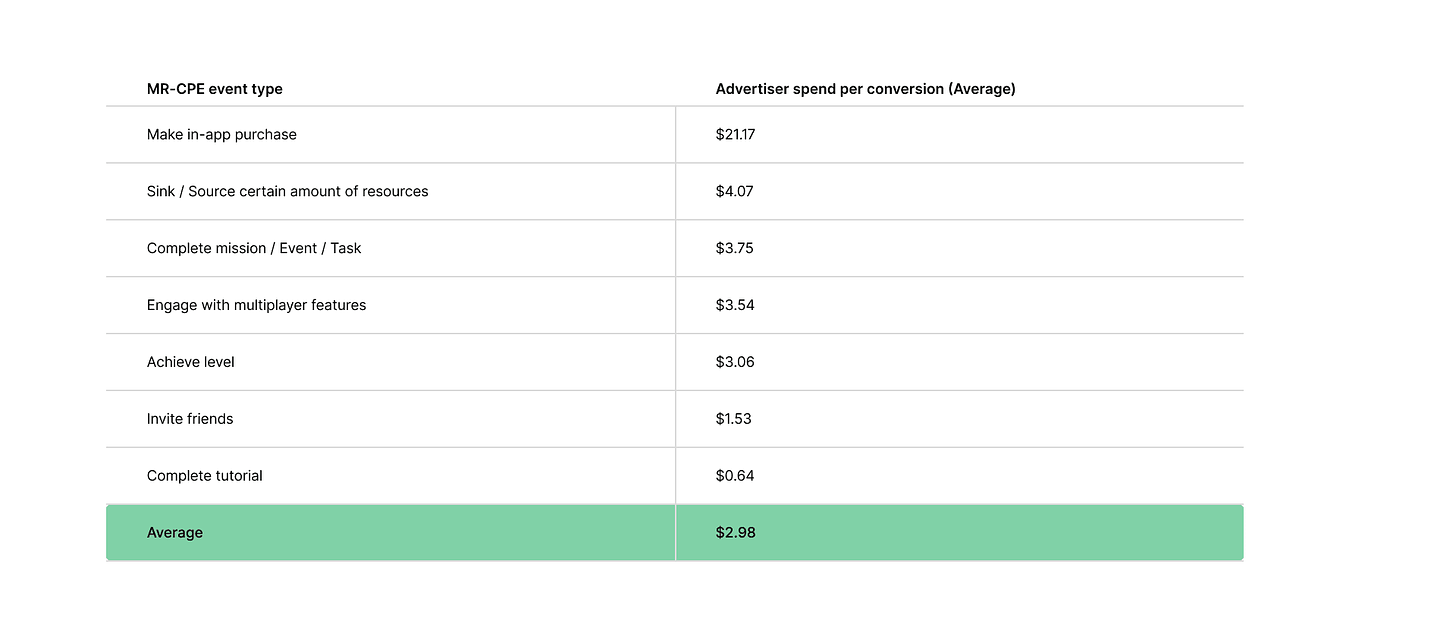
- The average cost per paying user in the MR-CPE model is $21.17. A user who completes the tutorial is much cheaper at $0.64.
Trend 5: Offerwalls complement IAP revenue
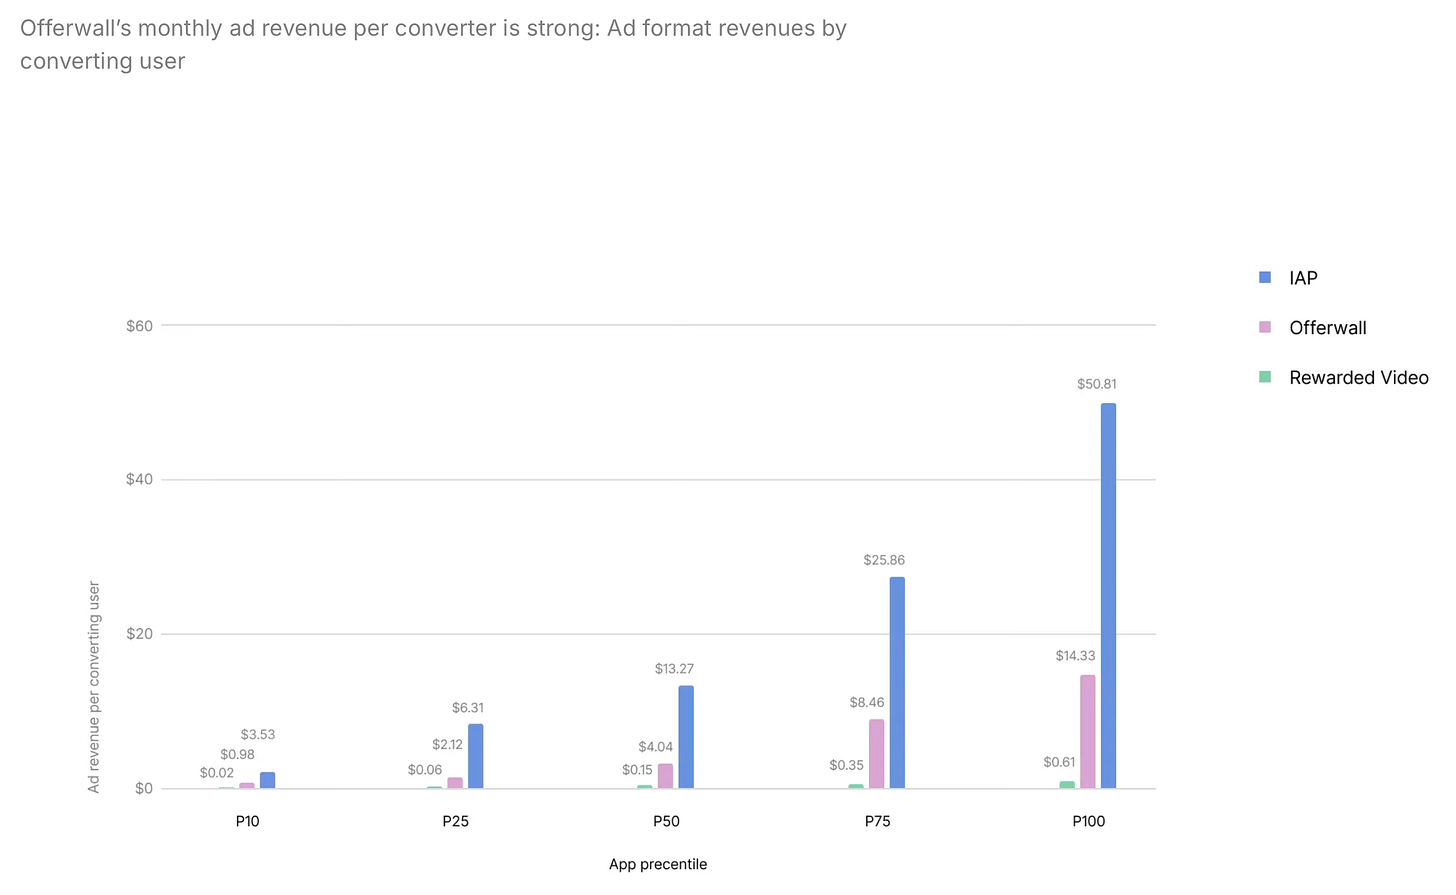
- According to Unity, monthly ad revenue from offerwalls exceeds average ad revenue from Rewarded Videos. For the 50th percentile, monthly IAP revenue per paying user is $13.27, revenue from the same user via offerwalls is $4.04, and revenue from Rewarded Video is $0.15.
- Offerwalls located in the lobby or on the main screen of a game are opened more often. The same goes for pop-ups.
GSD & GfK: August'24 PC/Console sales in the UK dropped by 1.5%

Analytical platforms report only actual sales figures obtained directly from partners. The mobile segment is also not included.
Game Sales
- 1.74 million games were sold in the UK in August 2024. This is 1.5% less than a year earlier.
- Grand Theft Auto V took first place; Hogwarts Legacy was second; Borderlands 3 ranked third.
❗️Star Wars: Outlaws did not make the chart because the data was collected before August 24th.
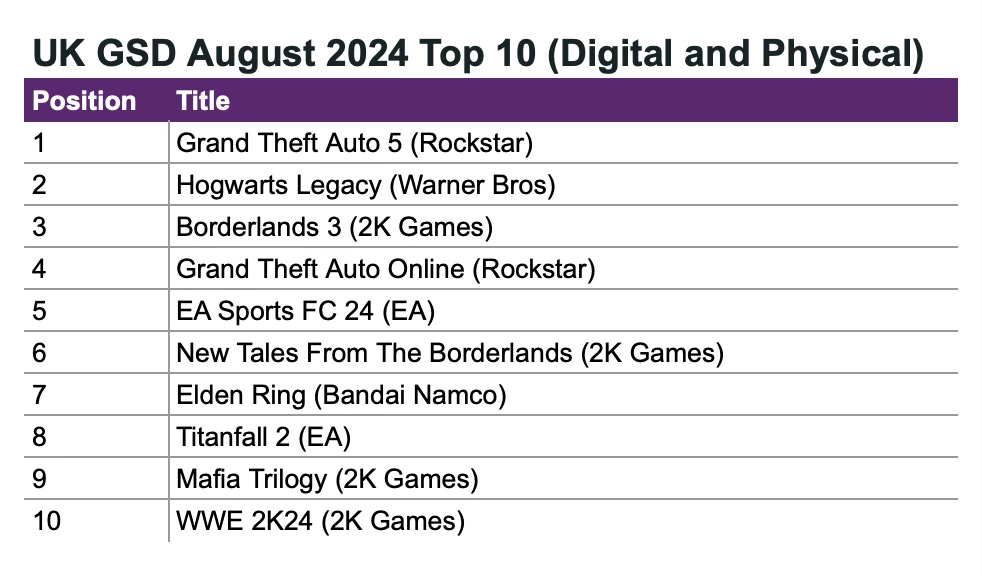
- Among new games, Madden NFL 25 performed best. The game debuted at 41st place on the chart, with sales 31.5% lower than the previous game in the series.
- 75% of sales recorded by companies in August 2024 were digital. This is 10 percentage points higher than in August 2023.
Hardware Sales
- Fewer than 75,000 consoles were sold in the UK in August. This is 3% less than in July and 45% less than in August last year.
- The PlayStation 5 remains the leader in sales. In August, numbers increased by 4% compared to July. But compared to last August, the drop is over 57%.
- Nintendo Switch sales fell by 10% in August compared to July, and by 30% compared to last year.
- Xbox Series S|X sales in August repeated July’s results but dropped 22% compared to last year. However, in terms of units sold, it surpassed the Nintendo Switch.
- 516.7 thousand accessories were sold in the UK in August. This is a 4.5% drop compared to July and a 9.6% drop compared to August 2023.
- DualSense was the best-selling accessory in August (and for the whole year). PlayStation Portal ranked first in revenue (and sixth in units sold).
Tenjin: Ad Monetization in Mobile Games in Q2'24
The data for the report was collected by Tenjin and Clever Ads Solutions.
General data
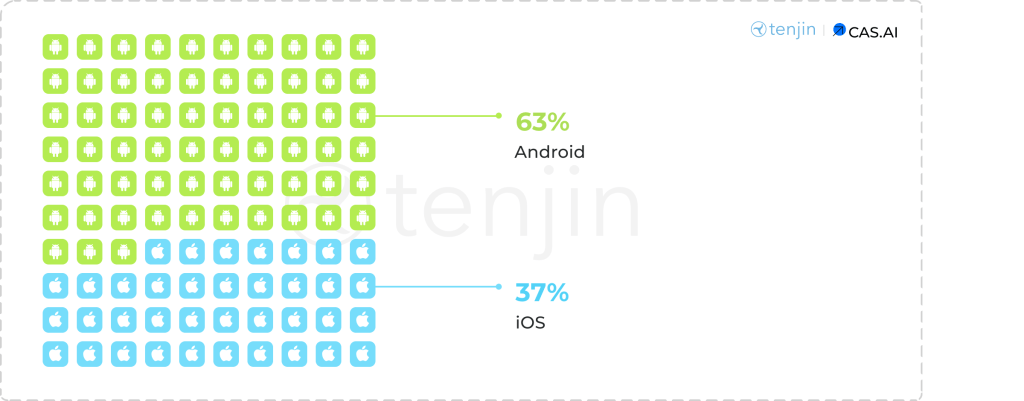
- 63% of ad revenue recorded in Q2'24 came from Android. In Q1’24 it had 59%.
- Ad revenue on iOS in the US accounted for 55% of the total volume.
- Countries outside the top 10 on Android generate 29% of total ad traffic.
- Japan, the US, and Australia are leaders in eCPM across different formats on iOS.
- The US is the clear leader in eCPM on Android across all formats.
iOS Numbers
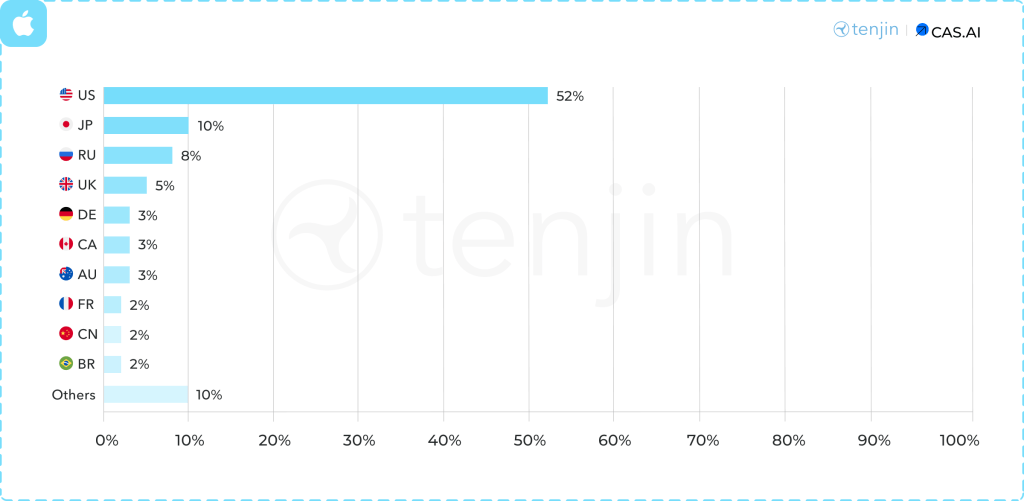
- The US (52%), Japan (10%), and Russia (8%) were the leaders in ad revenue on iOS in Q2'24.
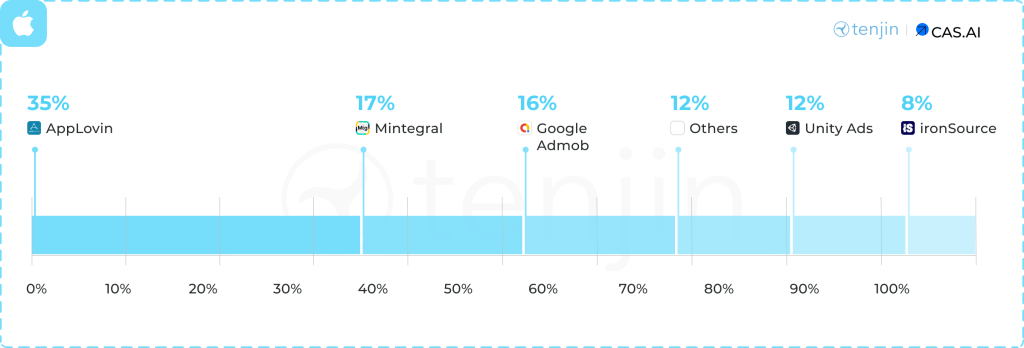
- Looking at ad networks, 35% of ad traffic comes from AppLovin; 17% from Mintegral; 16% from Google Admob; 12% from Unity Ads; and 8% from ironSource. Other networks make up the remaining volume.
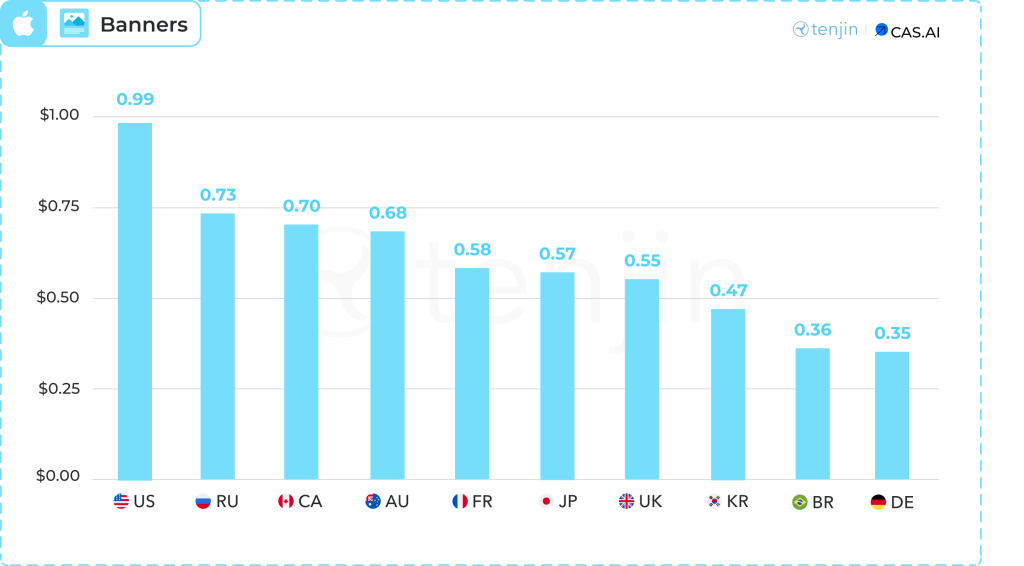
- The average eCPM for banners in Q2'24 was $0.99 in the US, $0.73 in Russia, and $0.70 in Canada.
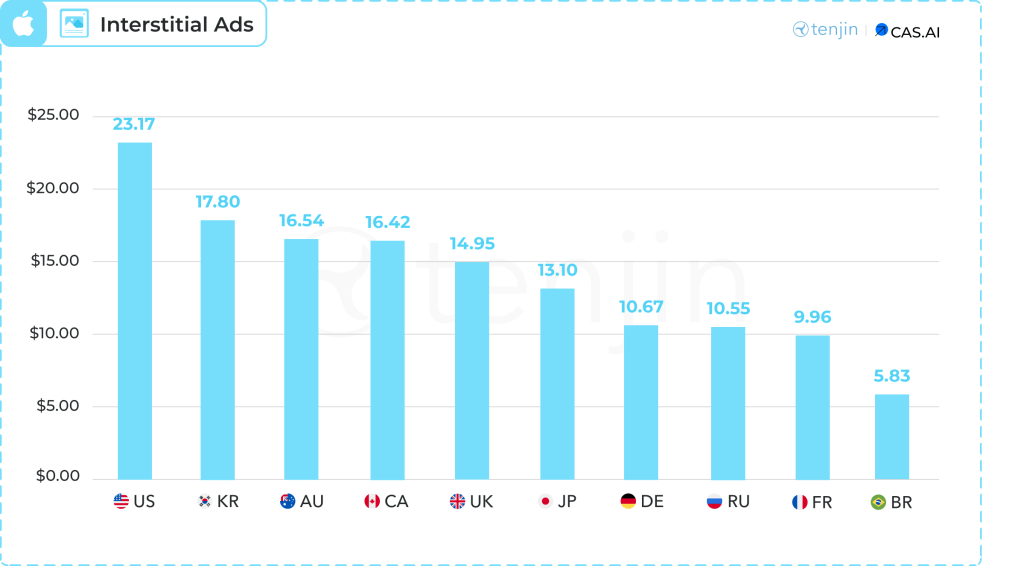
- The leaders in average cost for Interstitial Ads were the US ($23.17), South Korea ($17.8), and Australia ($16.54).
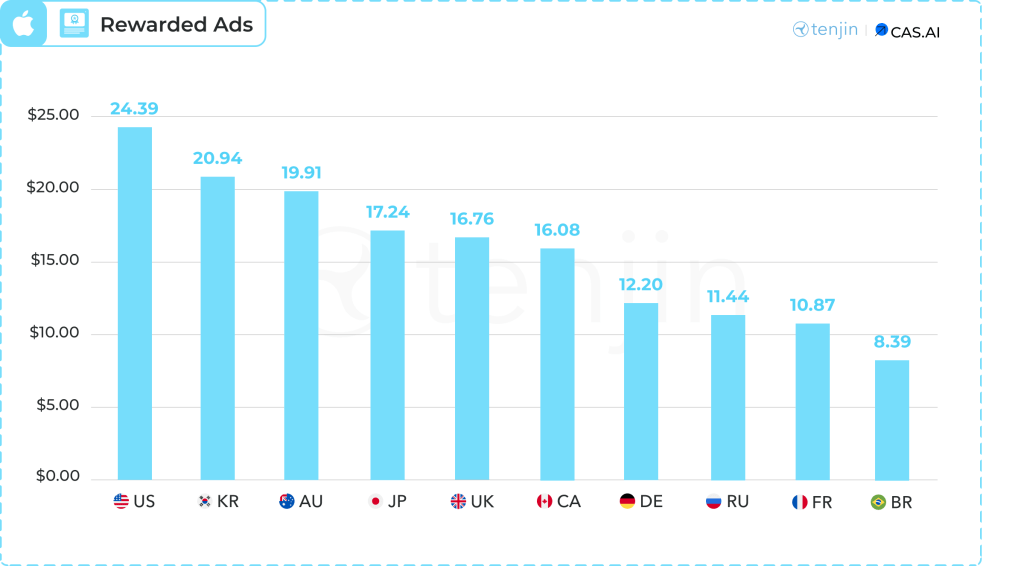
- The average eCPM for Rewarded Ads in the US was $24.39; in South Korea, $20.94; and in Australia, $19.91.
Android Numbers
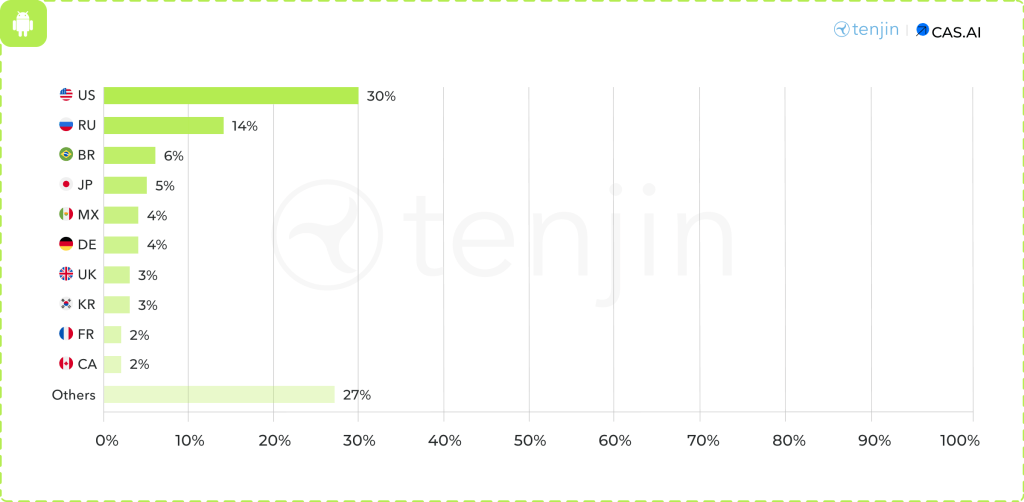
- The US (30%), Russia (14%), and Brazil (6%) were the leaders in ad revenue on Android in Q2'24.
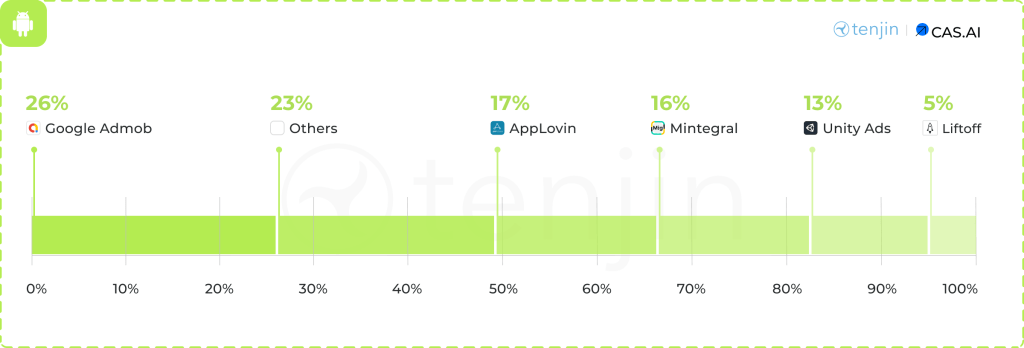
- Google Admob leads on Android with 26%. It is followed by AppLovin (17%), Mintegral (16%), Unity Ads (13%), and Liftoff (5%).
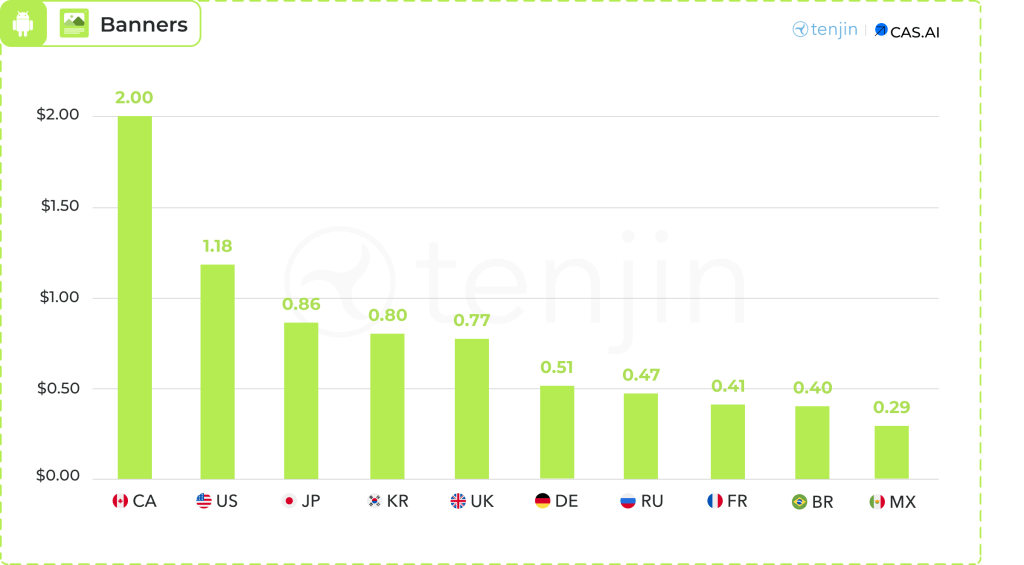
- The average eCPM for banners in Q2'24 was $2 in Canada, $1.18 in the US, and $0.86 in Japan.
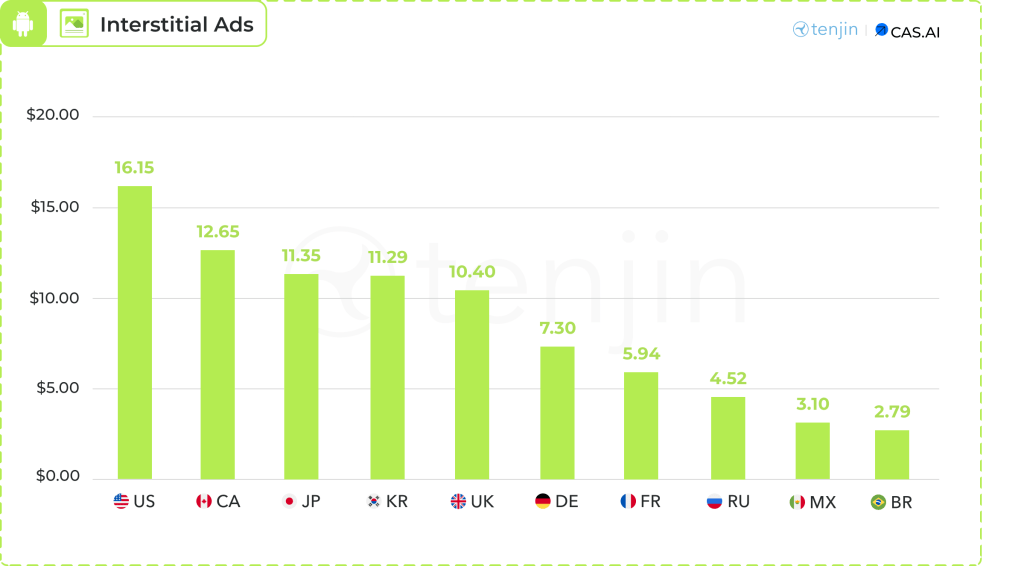
- The leaders in average eCPM for Interstitial Ads were the US ($16.15), Canada ($12.65), and Japan ($11.35).
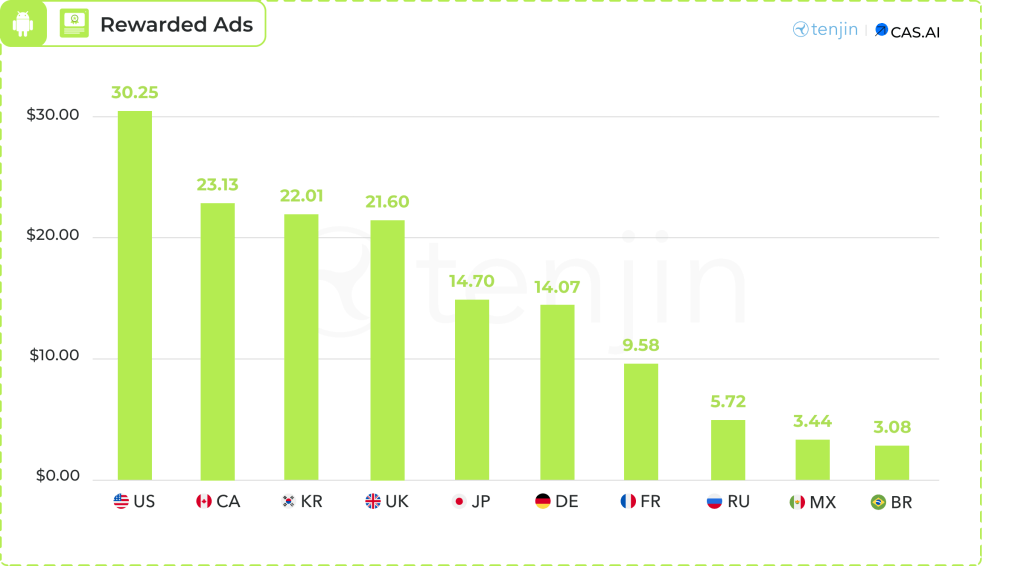
- The average eCPM for Rewarded Ads in the US was $30.25; in Canada, $23.13; and in South Korea, $22.01.
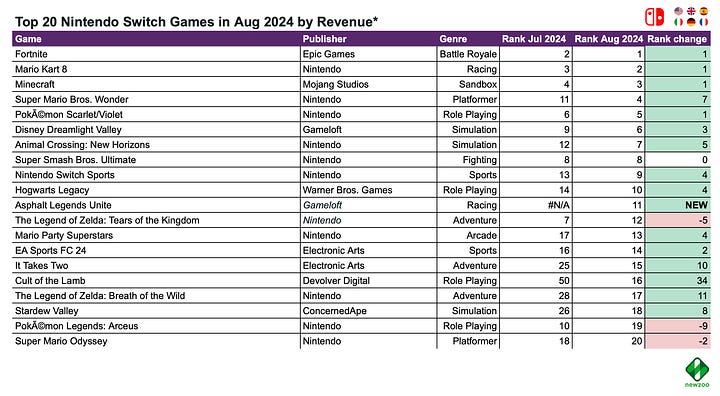
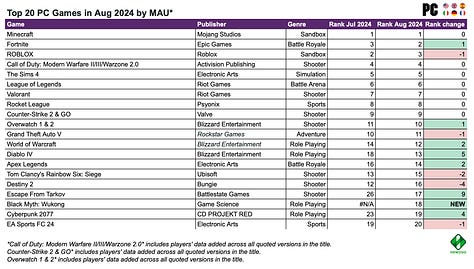
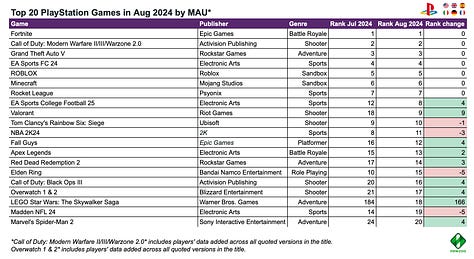
Newzoo: Top-20 PC/Console Games of August 2024 by Revenue and MAU

Newzoo tracks markets in the USA, UK, Spain, Germany, Italy, and France.
Revenue - All Platforms
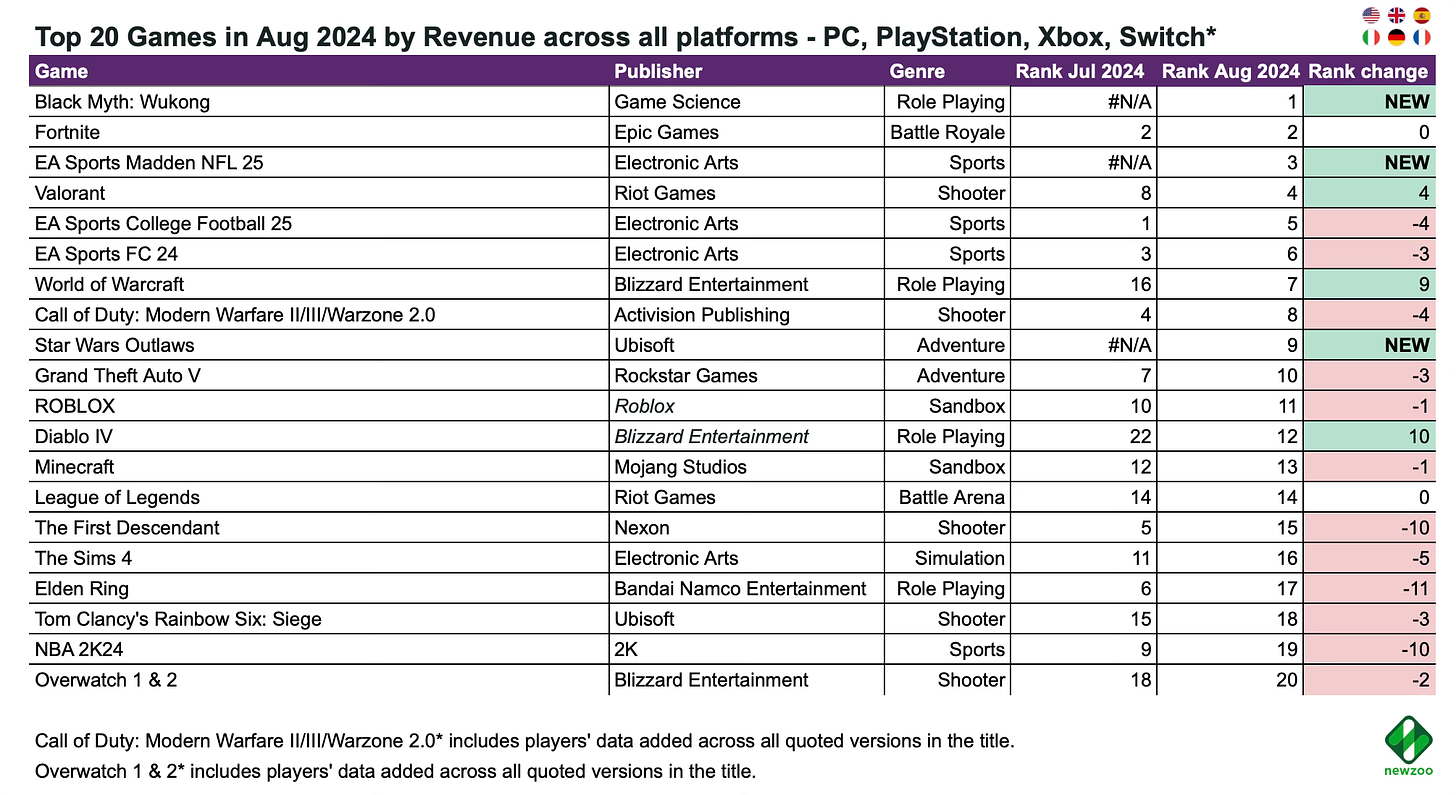
- Black Myth: Wukong was the clear leader in August, far ahead of the competition. The game outpaced another major release, EA Sports Madden NFL 25. Most of the game's sales came from PC, while it ranked 3rd on PlayStation in August.
- Star Wars Outlaws had a modest start, debuting at 9th place. Ubisoft has already acknowledged that the game's launch sales did not meet the company's expectations.
- The First Descendant couldn't hold its place at the top and fell to 17th in the ranking.
Revenue - Individual Platforms

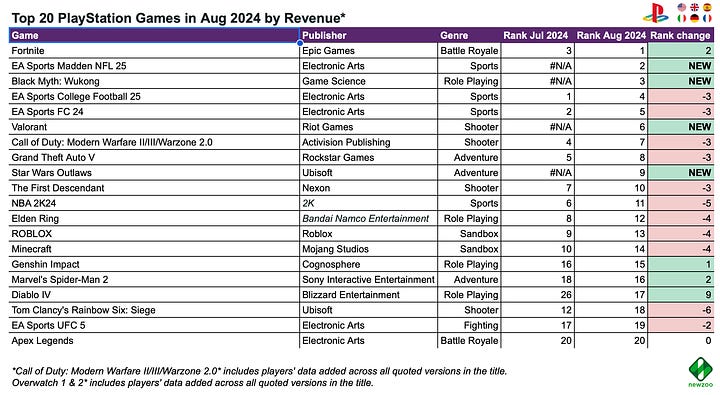
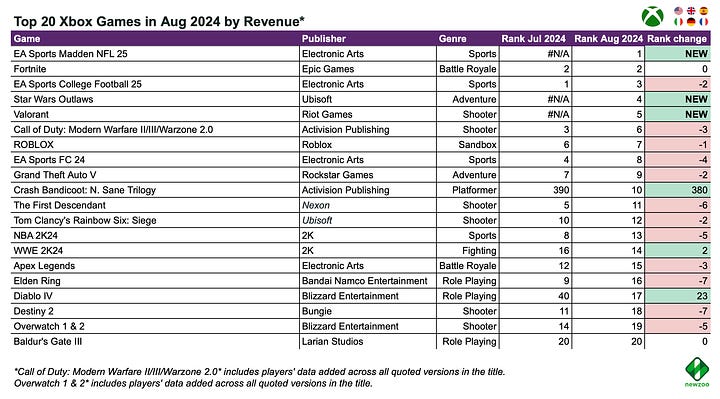
- Valorant launched well on consoles, securing 5th place in revenue on Xbox and 6th place on PlayStation.
- Crash Bandicoot: N. Sane Trilogy showed significant revenue growth on Xbox, but the game was actually added to Game Pass. The algorithms may have miscalculated this.
MAU - All Platforms
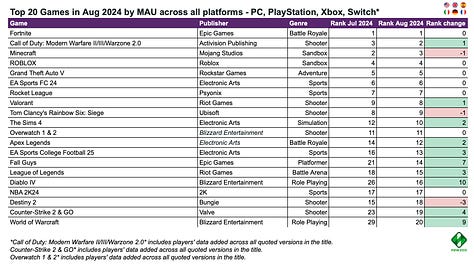
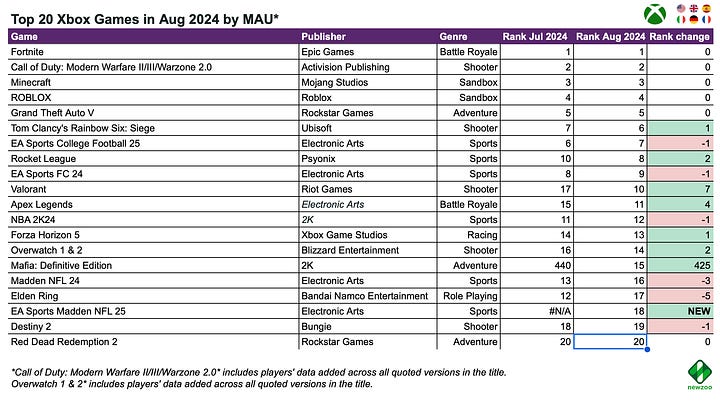
- There were a few changes in the overall MAU ranking. However, Fall Guys jumped by 7 positions, Diablo IV by 10, and World of Warcraft by 9.
- Black Myth: Wukong entered the top 20 on PC by MAU. It didn’t make it on PlayStation, but this could be due to its late release (August 19).
- The free-to-play game Asphalt Legends Unite debuted in 11th place by MAU. The game is also available on mobile platforms.
GSD & GfK: Sales of PC/console games in Europe increased in August'24; GTA V is the best-selling game of the month

The analytics platforms report only the actual sales figures directly received from partners. The mobile segment is not included.
Game Sales
- 11.8 million PC and console games were sold in Europe in August. This is 7% more than in August 2023.
- Grand Theft Auto V is the month's best-selling game, with its sales growing by 5.7% year-over-year (YoY).
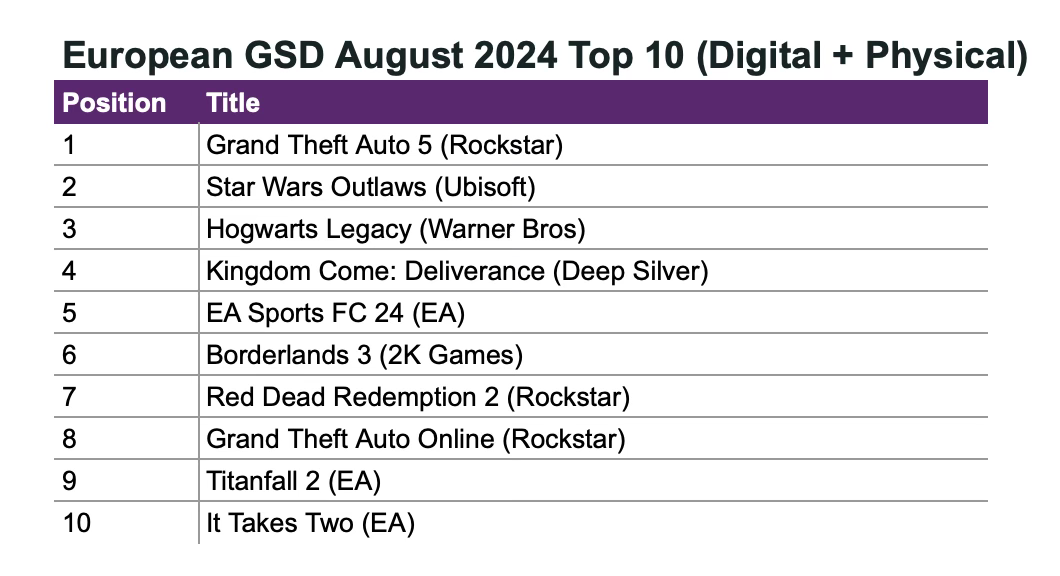
- In second place is Star Wars: Outlaws. The game's sales can be described as disappointing, as in the first week it sold only half the number of copies that Star Wars Jedi: Survivor sold in the same period in 2023. However, sales are higher than in Star Wars: Squadrons.
❗️Black Myth: Wukong ranked 68th on the chart. However, this is due to the fact that the company did not share data on digital sales.
- The infamous Concord ranked 347th in sales in Europe.
Hardware Sales
- More than 300,000 consoles were sold in Europe in August 2024. This is 42% less than in August 2023, but 12% better than July 2024. In monetary terms, sales dropped 29% compared to last year.
- The PlayStation 5 holds first place by a large margin, despite a 50% YoY sales decline.
- The second place is held by the Nintendo Switch (-25% YoY).
- 1.1 million accessories were purchased by European users in August 2024. This is 17% less than in August 2023.
Stay tuned for more updates next month!
Meanwhile, you can check out our free demo to see how devtodev can help your game project succeed.


: The Basics")
: The Basics")


 in Mobile Games")
 in Mobile Games")


")
")


")
")


")
")


 Tactics for Mobile Games")
 Tactics for Mobile Games")


