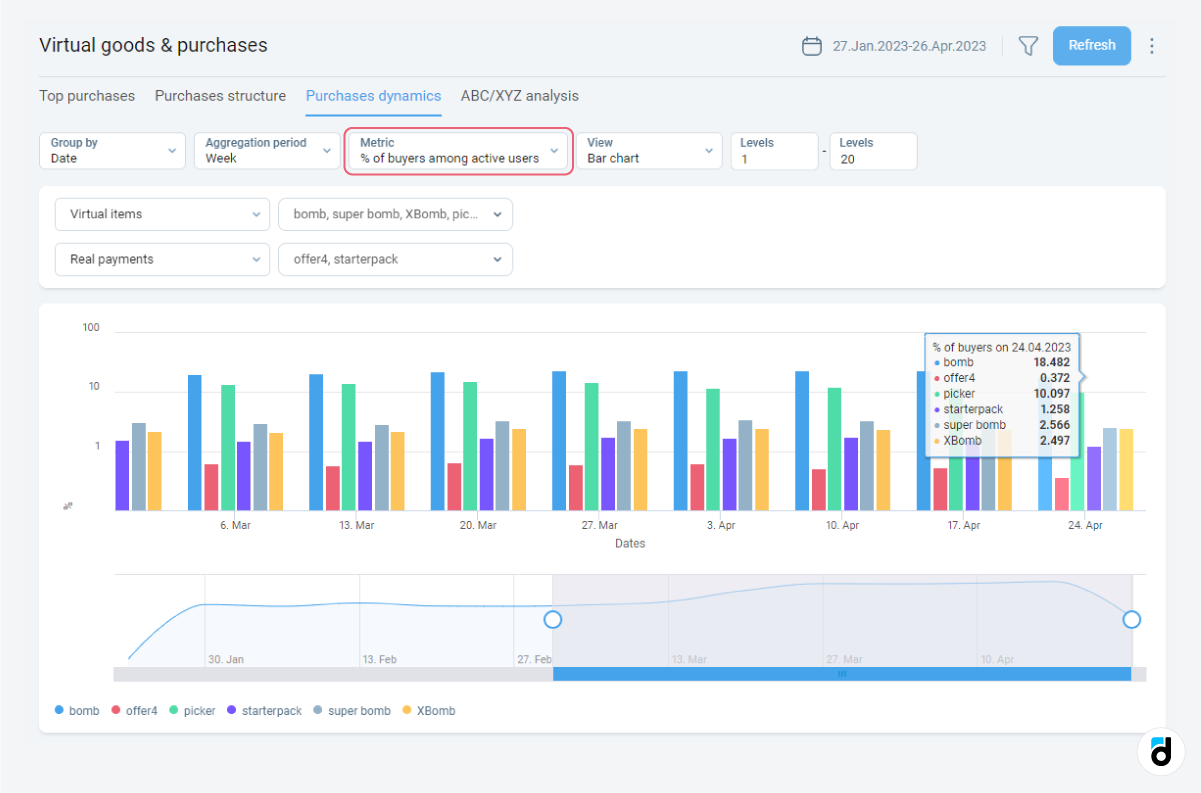
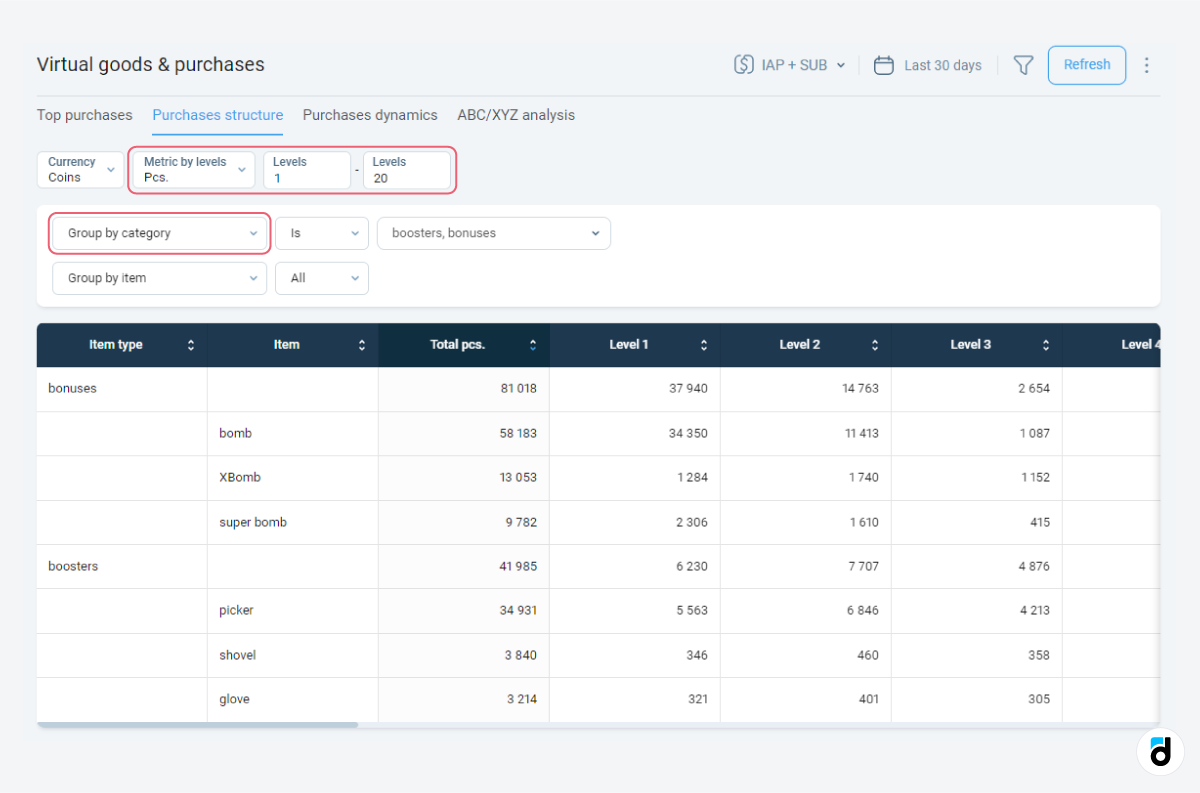
devtodev takes another step in perfecting our ‘In-game analysis’ report, making it better cater to data-driven teams’ needs and providing more options for them. This time we added several great features to the report’s ‘Virtual goods and purchases’ section. They allow for a much deeper analysis of in-game currency, purchases, and real money spends.
What We Did
- Added display of item groups. The groups may come in handy in case you have too many items.
- Added breakdown by levels.
- Introduced a number of purchases divided by the DAU metric value (“% of active”, as in the ‘Custom events’ report).
- Improved mean value. After the update, we calculate it as the number of items purchased at a level divided by the number of users.

How to Use the New Features
- If you have a wide range of in-game items (e.g. 1,000 or more), you can attribute each of them to a separate group and then view their dynamics over time and all the reports for groups. If necessary, you can click at a specific item and get its details.
- Find the most purchased items on different levels using the ‘Virtual Goods and Purchases’ report section. Then build cohorts of users who have just reached those levels and send them a push notification with a juicy offer.

If you have any questions about these features, feel free to contact us.

