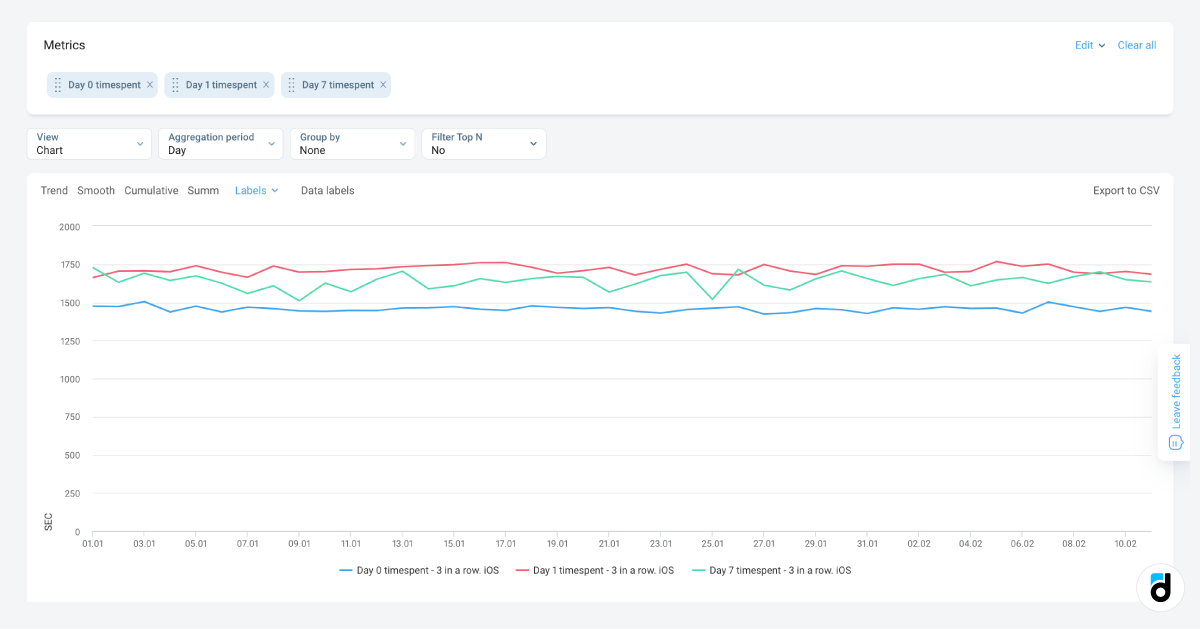
As part of a recent update, we’ve added a new metric to our Basic Metrics report – the Cohort Timespent. Previously, you may have known this metric as “Cohort Playtime,” which was created specifically to evaluate user engagement in the Sessions report. And now this metric is also available in Basic Metrics for both game projects and applications.
Cohort Timespent is a powerful form of cohort analysis tailored to product development. It provides you with crucial insights into user engagement by tracking the average time users spend in your game or app on a certain day after installation. This metric helps you understand how each cohort of users engages with your project on a daily basis following their initial installation.
In the Basic Metrics report, the metric is available for 4 time cohorts: Day 0, Day 1, Day 7, and Day 28 after the installation.
Calculation Method
Just like the same metric in the Sessions report, Cohort Timespent in Basics Metrics is calculated by averaging the session lengths of individual users within a specific cohort. It differs from cumulative metrics by presenting the average of all session lengths at a specific date rather than a cumulative value from previous days.

How do you Use it in a Real Project?
With this update, you can:
-
identify there is a drop in session time on a certain day since installation;
-
find out that loyal users spend more time in the app over time;
-
track the dynamics of metrics among different cohorts and clearly see whether anything has changed in the product or user behavior;
-
conveniently view it alongside other project metrics.
Stay tuned for more updates!
We are always happy to answer your questions. Feel free to share your feedback via email.

