Analyzing your projects has just become even more intuitive and efficient! Our latest updates to the Custom Events report are designed to enhance information clarity and provide seamless access to the tools you need for in-depth data analysis.
What’s New:
Effortless Total Insights
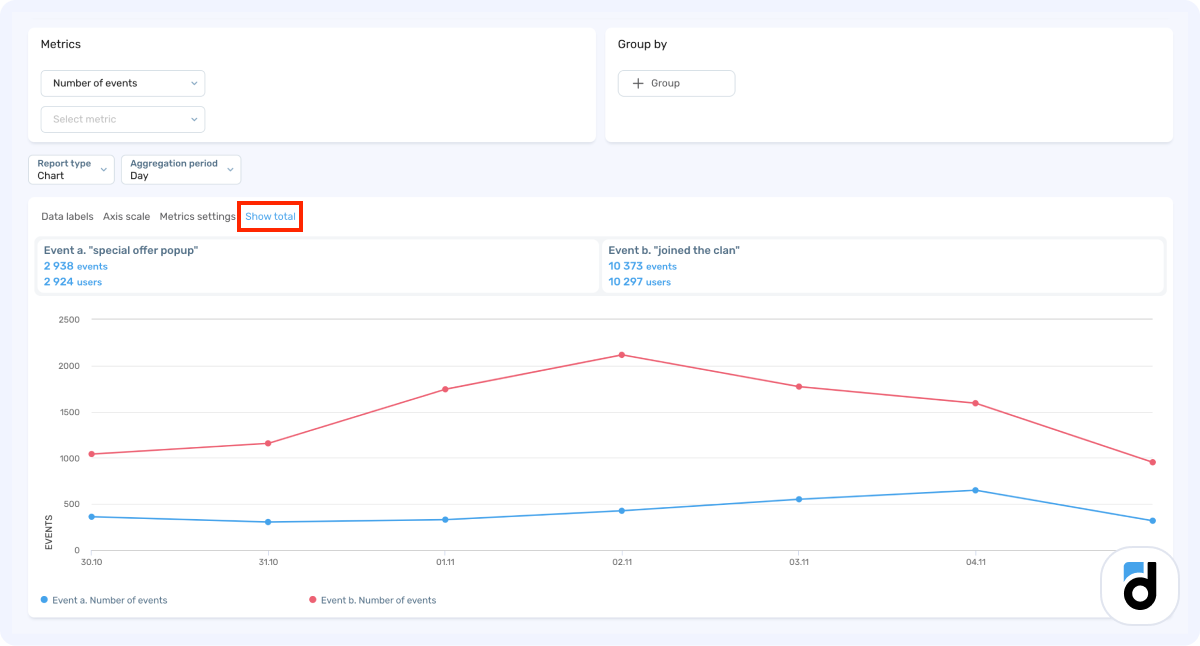
The new "Show Total" button, now placed above the report results, lets you instantly view total metric values. Whether you’re analyzing a graph or table, this feature provides quick, actionable insights without additional clicks. By default, this option is enabled to ensure you always have an overview of the metrics at a glance.

Streamlined Layout for Easy Navigation
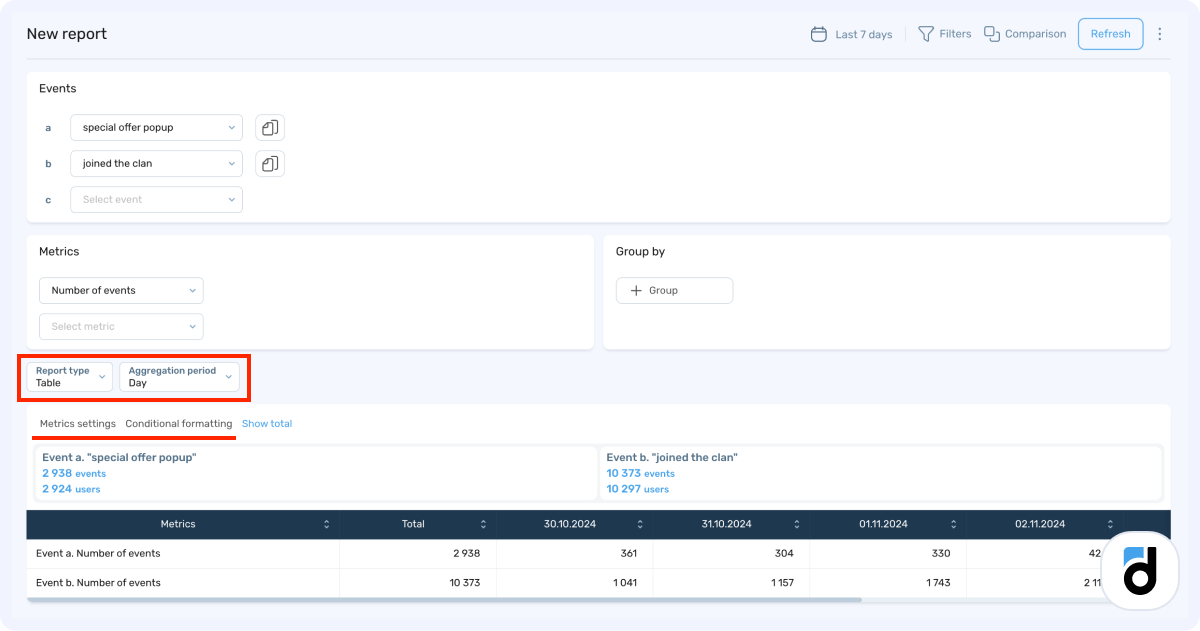
Key controls, including "Report Type," "Aggregation Period," "Metric," and "Event," are now conveniently located above the report results. This reorganization puts the most important settings at your fingertips, reducing time spent searching and improving report usability.

Unified Customization Panel
We've grouped the Metrics Settings and Conditional Formatting into a single left-hand panel. This layout makes it easier to customize your report's visualization and keep everything you need in one place.
These updates reflect our commitment to simplifying your analytics experience and ensuring that every feature works to save you time and effort.
Start exploring the enhanced Custom Events report today and discover how these changes can help you extract actionable insights faster!
Let us know what you think!
Check out our demo to see how it works in action!
