Written by: Anastasia Bogapova, Growth Product Manager at devtodev, ex-Lead Product Analyst with 5 years experience in data.
Author’s note: As someone who’s been working in product analytics for years, I’ve spent a lot of time diving into user data to make smart, growth-focused decisions. For me, A/B testing isn’t just another tool; it’s a clear, organized way to see what actually works and measure the impact of changes. Typically in companies A/B testing is a constant cycle, with teams running multiple tests and analyzing dozens of results weekly. In this environment, a mistake in the test design or data analysis can be costly - if you miss a detail or misinterpret the data, you risk questioning the product team’s work and the value of new features.
That’s why it’s so important to get A/B testing right, and why I wanted to write this article. It’s a guide to help beginner analysts and managers understand how to set up tests, avoid common pitfalls, and get reliable results.
Here, I break down the key steps and the work involved to draw accurate conclusions from experiments, so teams can make confident, data-backed decisions that drive their products forward.
Contents
Introduction to A/B Testing
A/B testing helps measure how small changes impact product metrics. It’s useful for all types of products: websites, mobile apps, interfaces, and marketing campaigns. For instance, you might change the color of a button, the text on a page, or the layout of interface elements to see how it affects user behavior. By running A/B tests, you can make decisions based on actual user behavior instead of guesswork.
Example: A dating app tests if showing “message suggestions” like “Hi there!” on profiles boosts conversation rates. The hypothesis is: “Displaying message suggestions will encourage more users to start conversations.” One group sees profiles without suggestions, the other with them. Comparing the number of conversations in each group helps determine if the suggestions are effective.
Let's go through the steps and learn how to create successful A/B tests. This guide will cover the basic concepts so you can confidently set up and run experiments that bring valuable results.
Read more: A/B Testing in LiveOps
Stage 1: Planning and Preparing for an A/B Test
Formulating a Hypothesis
Formulating a hypothesis is the first and most important step. A hypothesis is an assumption about how a specific change will affect user behavior. A good hypothesis is clear, specific, and testable, allowing you to interpret the test results easily. A strong hypothesis is based on data analysis, research, or user feedback.
A good hypothesis should:
-
Be specific — describe the exact change you want to test (e.g., color, text, or position of an element).
-
Have a measurable metric — include a clear metric that you can track.
-
Be justified — rely on data or observations so that testing has a clear purpose.
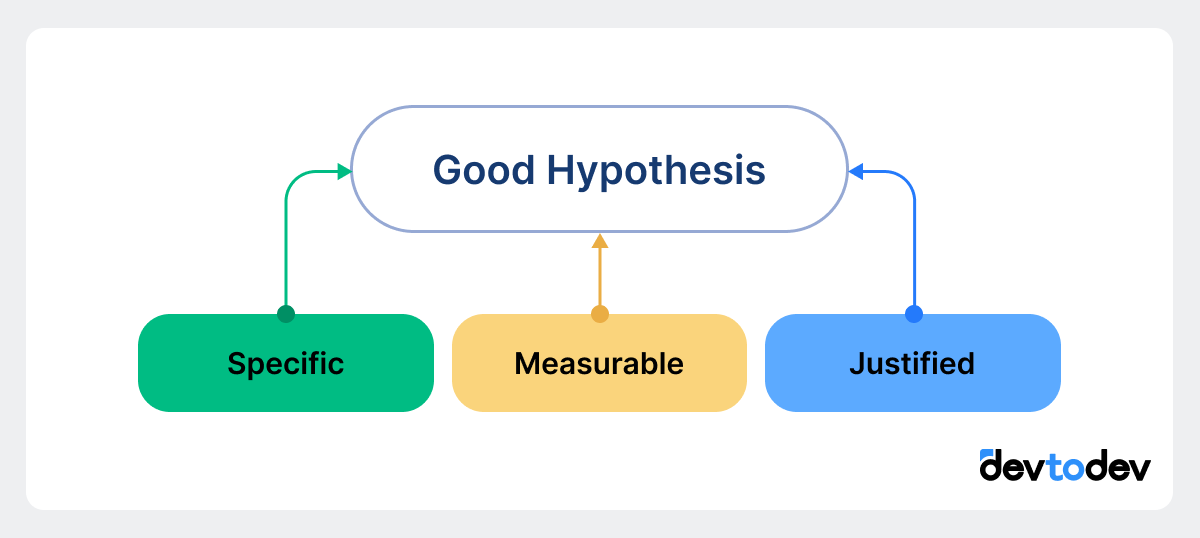
Hypothesis example: “Adding a ‘See Who Liked You’ feature will increase the number of premium subscriptions by 10%.” This example clearly defines the change (new feature addition), the metric (premium subscription rate), and the expected outcome (a 10% increase).
💡 Tip: Before starting the test, make sure your hypothesis is backed by data and clearly formulated. This will make analyzing and interpreting results easier.
Choosing a Metric
The metric is the indicator you’ll use to measure the test’s outcome. Choosing the right metric is crucial, as it will help you see how effective the changes are and avoid misleading conclusions.
Read more: Top 12 User Engagement Metrics for Mobile Apps
Core Metrics for A/B Tests
Key metrics for A/B testing vary by app type and feature goals. Here are focused examples across different apps:
-
Social Media App
-
Feature: “Follow Topics” option
-
Metric: Time spent per session – tracks if users stay longer when they follow topics of interest.
-
-
Dating App
-
Feature: Suggested “message shortcuts” on profiles
-
Metric: Message initiation rate – evaluates if shortcuts lead to more conversations.
-
-
Finance App
-
Feature: Savings goal tracker
-
Metric: Feature adoption rate – gauges how many users actively set and track savings goals.
-
-
Education App
-
Feature: Daily learning challenges
-
Metric: Daily engagement rate – measures if challenges boost daily logins and learning activity.
-
-
Health and Fitness App
-
Feature: Workout streak tracker
-
Metric: Retention rate – assesses if streak tracking improves return rates by encouraging daily workouts.
-
Additional Metrics
Additional metrics can help you understand user behavior in more detail and spot side effects. For instance, if the goal is to increase conversions, you could also track time on page to see if the conversion process is too complicated.
Read more: CEO’s Guide to devtodev Metrics
Metric selection example:
If your goal is to increase sign-ups, the main metric would be the conversion rate on the sign-up page. Additional metrics could include the average time spent on the page and the bounce rate to understand why some users don’t complete sign-up.
💡 Tip: Always choose a metric that reflects the main goal of the test, and consider adding secondary metrics for a more detailed analysis. Don’t forget to include guardrail metrics as well: they’ll help you catch any negative impact on other processes in the app that might arise from optimizing your main metric.
Preparing the Sample and Randomization
To ensure the test results are accurate, users need to be randomly divided into two groups: a control group and an experimental group. The control group sees the current version, while the experimental group sees the modified version. Randomization minimizes the impact of external factors and reduces bias.
Methods of Randomization
-
Simple random sampling works for smaller audiences where additional factors don’t need to be accounted for.
-
Stratified sampling is helpful for larger audiences when it’s important to account for user differences, such as demographic factors, device type, and more. Stratification allows you to distribute users evenly across groups, leading to more reliable results.
Example of preparing a sample:
Let’s say a task-planning app is testing a new feature and wants to account for users of different ages. If one group has too many younger users, it might affect the results. Stratified sampling ensures both groups have similar age distributions, helping to get more accurate results.
Stage 2: Running an A/B Test and Collecting Data
Determining Sample Size and Test Duration
To get accurate results, it’s essential to determine the right sample size and test duration. An inadequate sample or a test that’s too short can lead to random outcomes.
-
Sample size depends on how large a difference you expect between the control and experimental groups. The smaller the expected difference, the larger the sample size should be.
-
Test duration — the test should cover a full user activity cycle, including weekends and weekdays, to account for seasonal fluctuations and ensure data accuracy.
Example of determining sample size and duration:
If your site gets 10,000 unique visitors daily, and you want to detect a 5% difference in conversion, you might need about 5,000 users in each group for the test to be accurate and meaningful.
Read more: Populations and Samples in Data Analysis
Technical Implementation of an A/B Test
There are many platforms available for A/B testing, including devtodev, which provides robust tools to automate test launches, track key metrics, and analyze results in one streamlined environment. devtodev’s platform simplifies the process by offering built-in tracking and reporting features, ensuring that both data accuracy and ease of use are prioritized. However, regardless of the platform, technical setup is crucial for reliable results, as errors in implementation can completely distort findings.
-
Check user distribution across groups — every user should stay in the same group throughout the test. For example, if a user saw the new button on their first visit, they should see the same version on future visits.
-
Verify data collection — make sure the metrics you need are tracked accurately. It’s helpful to run test launches to confirm data accuracy before the experiment begins.
Example of a data check:
For instance, if an e-commerce app tests a new cart design, it’s important that the analytics system consistently tracks items added to the cart in both control and experimental groups, with no data gaps. devtodev’s system makes it easy to monitor such interactions, ensuring no inconsistencies in the data that could affect result interpretation.
Stage 3: Data Analysis and Statistical Methods
After running an A/B test, analyzing the data correctly is essential to understand whether your changes had a real effect. This part will cover how to assess statistical significance, interpret results, and choose the best statistical methods.
Understanding Statistical Significance and p-value
Statistical significance tells us if the observed difference between the control and experimental groups is likely real or due to random chance. To determine significance, we use a metric called p-value.
P-value measures the likelihood that the observed difference happened by chance. Typically, if p-value is less than 0.05, the result is considered statistically significant. A p-value of 0.05 means there’s a 5% chance the difference is random. The lower the p-value, the more confident we are that the change caused the effect.
Example of p-value usage:
Suppose you’re testing a new sign-up page and find that the conversion rate increased by 3% in the experimental group with a p-value of 0.03. This means there’s a 97% chance that the increase is due to your change, not random variation, so we can be confident in this result.
Confidence Intervals (CI) and Their Importance
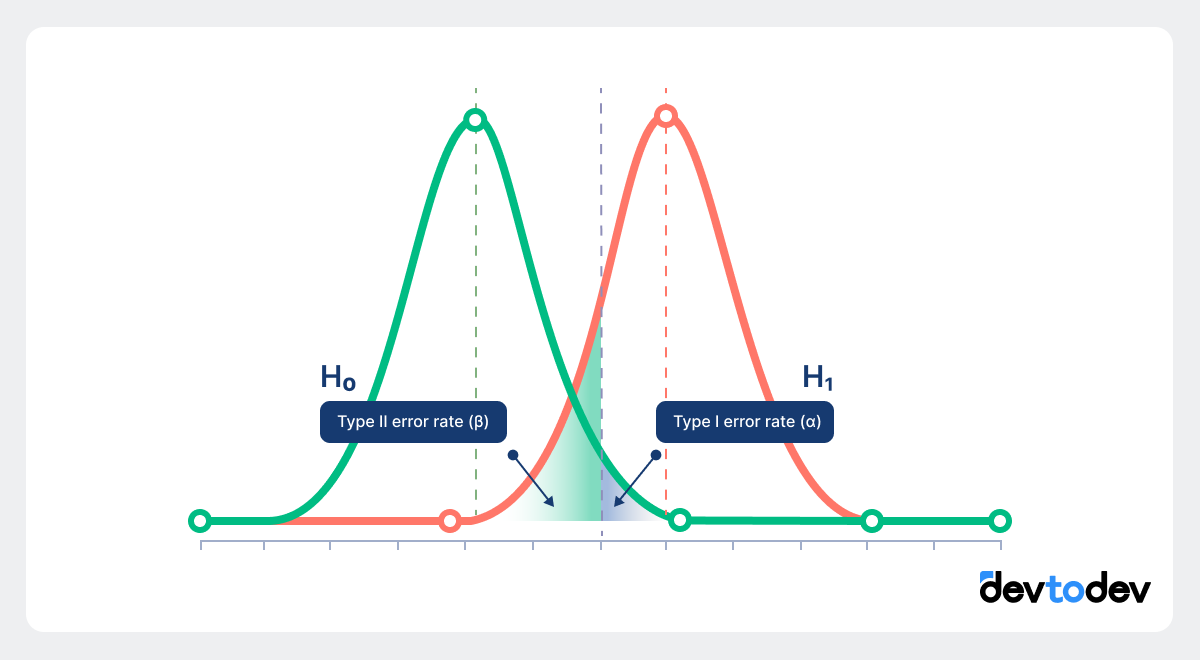
A confidence interval (CI) shows the range within which the true effect lies, giving more context to the results. A 95% CI means that if you repeated the test multiple times, the result would fall within this range in 95 out of 100 tests.
Why CIs matter: They help avoid overconfidence in results. A significant p-value with a wide CI suggests that the effect may vary, whereas a narrow CI indicates more reliable results.
Example of CI interpretation:
If your CI for the conversion rate difference is 4% ± 1%, you can say with 95% confidence that the real difference lies between 3% and 5%. This narrows down the true effect, which can be useful for business predictions.
Choosing the Right Statistical Method
The choice of method depends on the data type and distribution. Here are some common methods:
-
t-test
-
Usage: Compares the means of two groups (e.g., average order value in the control vs. experimental group).
-
Assumptions: Data should be normally distributed, with roughly equal variance in both groups.
-
Example: If you want to check if the new checkout page increases average order size, the t-test can determine if there’s a statistically significant difference between the groups.
-
-
Z-test
-
Usage: Analyzes proportions, such as conversion rates, in large samples (usually over 30 observations).
-
Assumptions: Works best with larger samples and normally distributed data.
-
Example: For comparing the click-through rate (CTR) of a banner between two versions, the Z-test will show if the difference is statistically significant.
-
-
χ² (Chi-square) test
-
Usage: Tests relationships between categorical variables, like device type or demographic categories.
-
Assumptions: Counts of each category should be sufficient; works well for categorical (non-numeric) data.
-
Example: You can use the chi-square test to analyze if desktop users and mobile users respond differently to a feature.
-
💡 Tip for beginners: Start by checking assumptions (e.g., sample size, data type) before choosing a test. Incorrect tests can lead to inaccurate results.
Avoiding False Positives and False Negatives
Errors can occur in hypothesis testing:
-
False Positives (Type I Error): Concluding that there’s an effect when there’s not.
-
Example: Assuming a new homepage layout increases conversions based on a significant p-value when, in fact, the result is due to random fluctuations.
-
-
False Negatives (Type II Error): Missing a real effect.
-
Example: If your test shows no significant difference, but the sample size was too small to detect an actual effect.
-
To reduce these errors:
-
Use the right sample size: Small samples increase the chance of false negatives.
-
Follow the planned test duration and sample size, without stopping early when results seem favorable.
Stage 4: Improving Sensitivity and Methods for Small Samples
In A/B testing, small sample sizes can limit your ability to detect significant results. To improve sensitivity and make the most of limited data, the following methods are highly effective.
Enhancing Sensitivity with CUPED (Controlled Use of Pre-Experiment Data)
CUPED adjusts your primary metric by accounting for pre-test data, thereby reducing variance and isolating the impact of the tested feature. This method is particularly useful if you have pre-existing user data related to your test metric.
How to use CUPED:
-
Collect a baseline metric (covariate) based on past user behavior.
-
Run a linear regression on the pre-test metric against the post-test metric.
-
Adjust the primary outcome metric based on the relationship with the covariate.
Learn mode about CUPED here.
Difference-in-Differences (DiD) for Observational Data
DiD is ideal when randomization isn’t possible. It compares the changes in both test and control groups before and after the experiment, adjusting for any external factors that affect both groups.
How to use DiD:
-
Measure the metric for test and control groups before and after the change.
-
Calculate the difference in metrics for each group.
-
Subtract the control group’s difference from the test group’s difference to isolate the feature’s effect.
Learn mode about DiD here.
Bootstrapping
Bootstrapping is a resampling technique that creates simulated samples by randomly selecting data with replacement. It’s especially effective for estimating reliable statistics with small or non-normally distributed samples.
How to use Bootstrapping:
-
Randomly resample your dataset multiple times to create "bootstrap" samples.
-
Calculate the metric of interest for each sample.
-
Use the distribution of these samples to estimate confidence intervals.
Learn mode about Bootstrapping here.
For practical implementation, you can find examples of CUPED, DiD, and bootstrapping in Python libraries like scikit-learn, statsmodels, and numpy.
Bayesian Methods: A Flexible Approach
Bayesian methods offer a dynamic, flexible way to analyze A/B test results, especially useful for smaller samples or ongoing tests. Unlike frequentist methods that rely on fixed sample sizes and p-values, Bayesian analysis updates probabilities based on new data, allowing for continuous interpretation.
How Bayesian analysis works: Bayesian analysis starts with a “prior” (an initial belief about the outcome) and updates it with new data to form a “posterior” probability. This approach allows you to adapt as more data comes in, providing a constantly refined understanding of the test’s effectiveness.
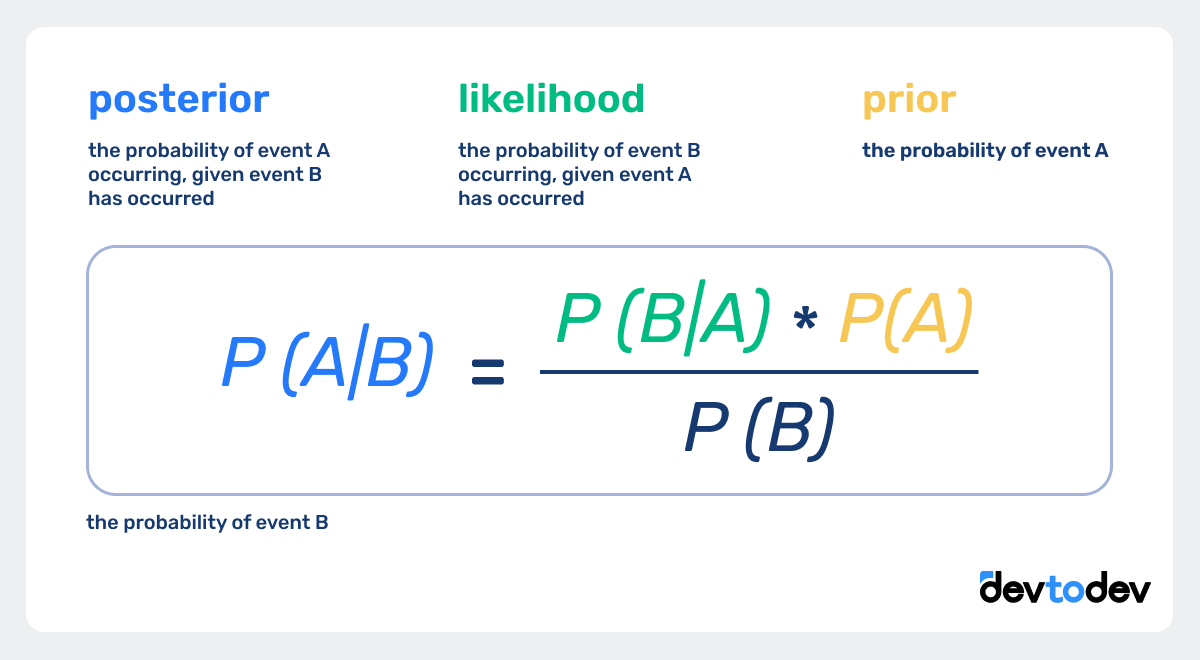
Example of Bayesian Analysis:
If you initially believe a new feature might increase conversions by 5%, but early results show a 3% increase, Bayesian analysis will adjust this estimate as more data arrives, rather than forcing a fixed conclusion based on a single test.
Choosing the Right Sensitivity Method
-
For small, balanced samples: CUPED or bootstrapping often provides effective results.
-
For observational or non-random tests: Consider using Difference-in-Differences.
-
For ongoing tests or where continuous interpretation is useful: Bayesian methods offer greater flexibility.
Read more: 70 Links to Become a Better Game Analyst
Common Mistakes and Pitfalls in A/B Testing
Even with careful planning, some common mistakes can impact the reliability of A/B test results. Here’s a look at the most frequent errors and how to avoid them:
-
P-hacking
This issue, known as "p-hacking," happens when you stop the test as soon as results appear significant, potentially leading to unreliable conclusions. To avoid this, set the test duration in advance and try not to stop early unless absolutely necessary. In devtodev, you can configure your test to automatically stop only when a stable, statistically significant result is detected. This feature helps ensure that your findings are solid and not influenced by temporary fluctuations, allowing for more reliable conclusions from your test. -
Small Sample Sizes
Running tests on small samples increases the likelihood of false negatives or random results. Use sample size calculators to determine the required sample before starting, ensuring your results are statistically sound. -
Seasonal and Random Factors
Testing during high-traffic periods, like holiday sales, can skew results. Try to schedule tests during “normal” periods, or account for seasonality when interpreting outcomes. -
Confounding Variables
External factors, such as user age or device type, can influence results. Balancing these factors across groups (stratified sampling) can help control for these variables and improve result accuracy.
Read more: Seasonality of the Project
PS: The Future of A/B Testing: AI and Advanced Technologies
As data-driven decision-making grows, A/B testing is advancing with AI, machine learning, and deep learning, making it faster, smarter, and more predictive. These technologies allow continuous testing, more personalized experiences, and real-time adjustments.
AI and Machine Learning: Automated Experimentation
AI-driven A/B testing automates experiment setup, targeting, and analysis, reducing manual work and human error while speeding up insights.
-
Dynamic Traffic Allocation: Unlike traditional A/B testing, AI can adjust traffic on the fly, increasing exposure to winning variations. This multi-armed bandit approach optimizes in real time, ensuring that users see better-performing content quickly.
-
Predictive Analytics: Deep learning models can predict test outcomes early, speeding up data-driven decisions. In devtodev, you can use payment status predictions (likelihood of user payment) and forecasted metrics like LTV and ROI to set up and interpret tests more strategically from the start.
Personalization: Moving to Adaptive Testing
AI enables adaptive testing where variations adjust based on individual behavior, creating a unique experience for each user. By identifying patterns in user data, machine learning serves personalized content in real-time, enhancing engagement.
AI-Powered Insights for Complex Analysis
AI can identify and interpret complex relationships in A/B tests, especially when multiple factors interact. Advanced models reveal deeper insights into what drives user behavior, going beyond traditional metrics to explain not just what worked, but why.
Read more: Benefits of AI in Data Analytics
Conclusion
A/B testing has become essential for making informed, data-driven product decisions, and when combined with AI and predictive analytics, it opens up even greater opportunities for precision and efficiency. To maximize the value of your tests:
-
Set Clear Goals and Metrics: Start with a specific hypothesis and primary metric that reflects your objective. Add guardrail metrics to spot any negative impacts.
-
Use Predictive Insights and Automation: Tools like devtodev’s predictive data (e.g., payment likelihood, LTV) and automated test-stopping on statistical significance help make tests more strategic and efficient.
-
Avoid Common Pitfalls: Plan test durations and sample sizes ahead, and avoid early stopping. Techniques like CUPED and DiD can improve accuracy in smaller samples.
-
Ensure Accurate Setup: Keep user groups consistent and verify data collection to prevent errors.
Following these steps helps ensure your A/B tests deliver actionable, reliable insights that support smart, data-driven decisions.
Ready to make data-driven decisions with confidence? At devtodev, we offer comprehensive tools to simplify your A/B testing process and ensure you’re extracting valuable, actionable insights. Reach out to us at info@devtodev.com for assistance or to learn how our solutions can elevate your analytics strategy.
Check out our demo to see how it works in action!


