Devtodev is helping you keep in touch with what’s happening in the game market. Every month we publish an overview of reports on the most popular games worldwide, top-grossing games, successful releases, favorite video game types, trends, etc. This overview was prepared by Dmitriy Byshonkov, the author of the GameDev Reports by the devtodev Telegram channel. You can also read the September and October reports.
Contents
- How to Market a Game: The number of Games Released on Steam in the first 3 quarters of 2024 is significantly higher compared to 2023
- Games & Numbers (October 16 - October 29; 2024)
- Newzoo: Top 20 PC/Console Games of September 2024 by Revenue and MAU
- Circana: Best-Selling PC/Console Games in the U.S. by Year in the 21st Century
- AppCharge: 72% of the top-earning Mobile Games in the U.S. have webshops
- Mistplay: Mobile Gaming Growth Report (2024)
- Sensor Tower: Mobile gaming market in Southeast Asia in 2024
- AppMagic: Top Mobile Games by Revenue and Downloads in October 2024
- SGDA: The Gaming Industry in Slovakia in 2024
- Ipsos & Video Games Europe: How children spend money in Games in 2024
- Circana: Gamers in the U.S. in 2024
- AppMagic & MY.GAMES: 4X Strategies in 2024
- SocialPeta: Mobile gaming marketing trends in Southeast Asia in 2024
- Chinese gaming market sets revenue record in Q3'24
- Unity: User preferences during Holiday season in the USA
- Moloco: Mobile market status and Growth opportunities in 2024
- Games & Numbers (October 30 - November 12; 2024)
- GSD & GfK: The UK gaming market grew by 3.2% YoY in October 2024
- Famitsu: Super Mario Party Jamboree leads Japanese physical sales chart in October 2024
- Values Value & inGameJob: European Gaming Job Market in 2024
- TIGA: The UK Gaming Industry stays resilient and continues to grow
- WKO: Austrian Gaming Industry in 2024
- Lumikai & Google: Indian Gaming Market to Grow to $9.2B by 2029
- Sensor Tower: Popularity of Puzzles is growing in the South Korean Market
- ESA: 76% of American children want gifts related to video games for the Holidays
- GSD & GfK: Game sales in Europe increased in October 2024
- Circana: The US gaming market returned to growth in October 2024
- Games & Numbers (November 13 - November 26; 2024)
- Dataspelsbranschen: The Swedish Gaming Industry in 2024
- Game7 Research & Naavik: Web3 Games in 2024
How to Market a Game: The number of Games Released on Steam in the first 3 quarters of 2024 is significantly higher compared to 2023

According to Chris Zukowski’s methodology, projects with over 1,000 reviews on Steam can be considered successful.
- With three months left in the year, 13,065 games have already been released in 2024, only 870 fewer than in 2023. If the trend continues, the total number of games on the market by the end of 2024 will increase by 28.92% compared to 2023.
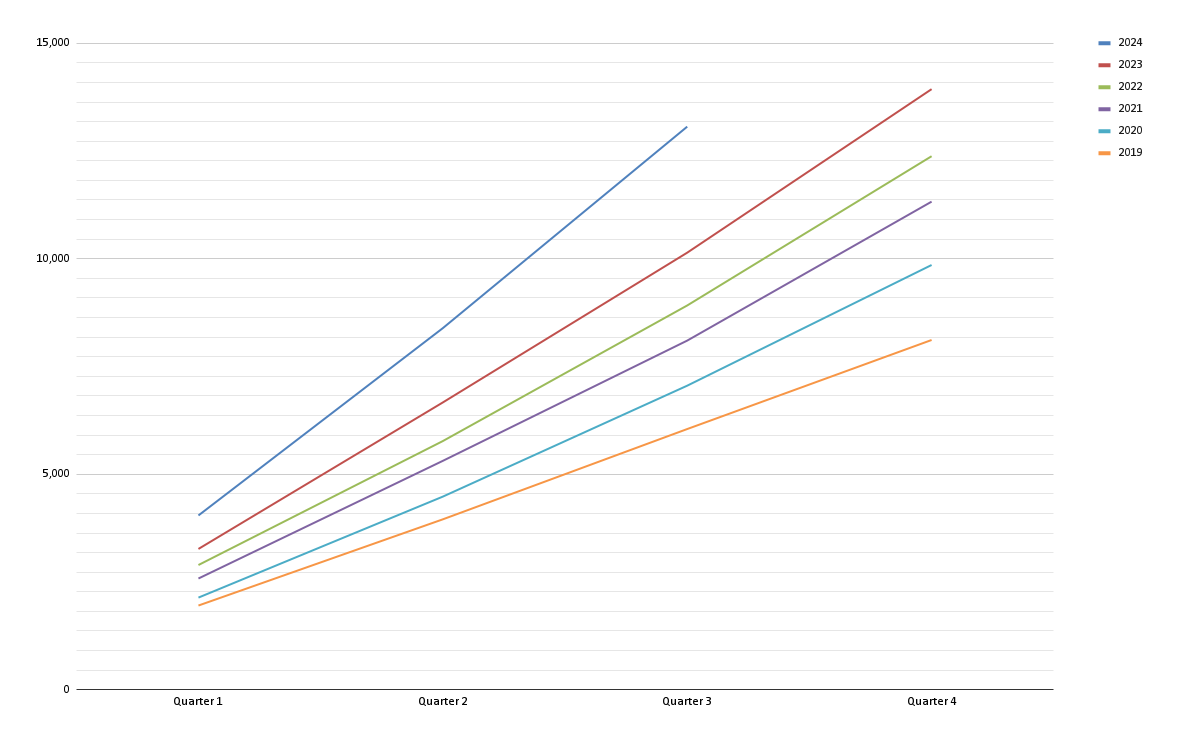
- As of October 1, 2024, 348 games have surpassed 1,000 reviews, 267 of which are considered indie projects.
- In 2023, 415 indie titles crossed the 1,000-review mark. So far, the likelihood of success has decreased when comparing the number of “successful” projects to the total number of games released.
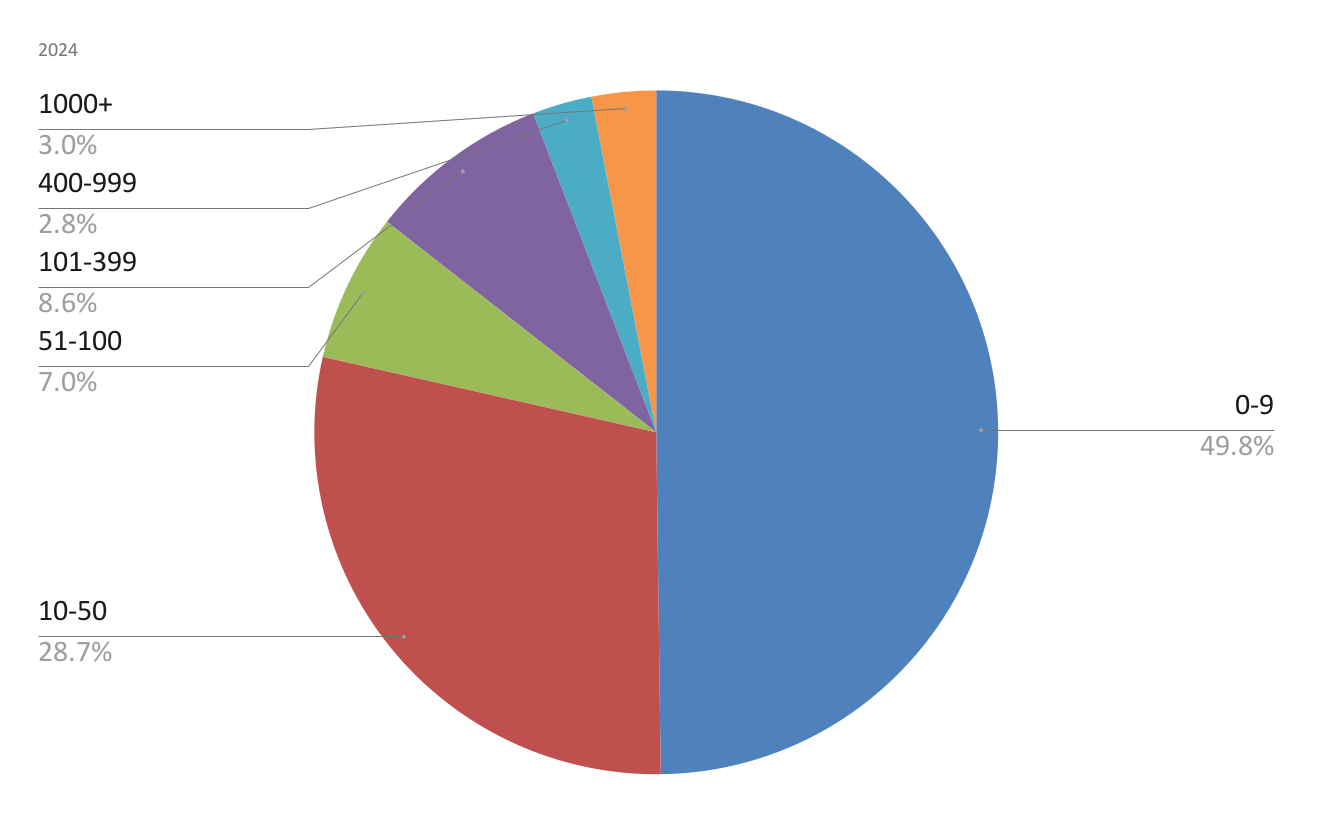
- 49.8% of games received fewer than 10 reviews. 78.5% have fewer than 50 reviews, likely meaning sales of less than 1,500 copies.
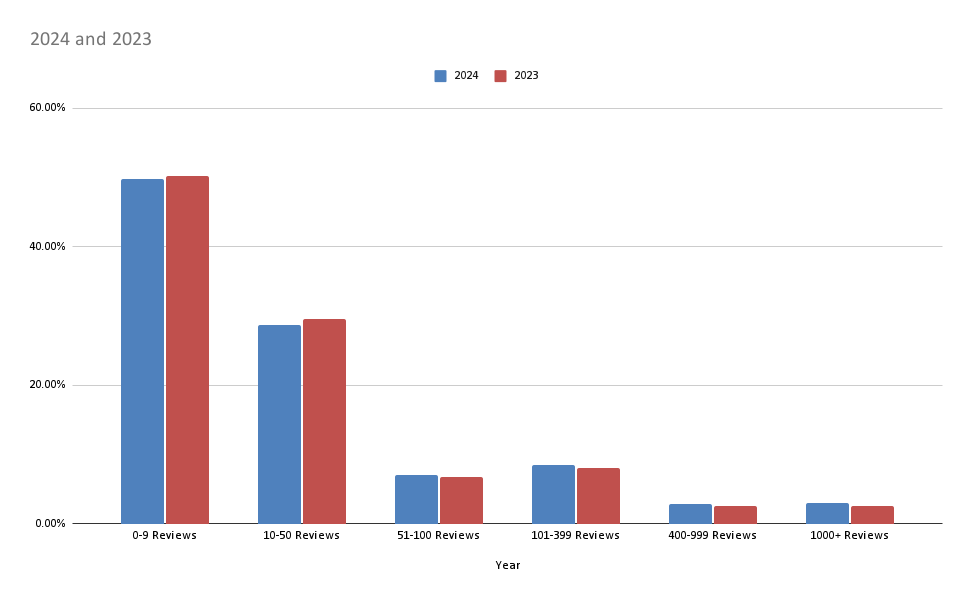
- In 2024, the number of projects achieving some level of success (50+ reviews) is higher.
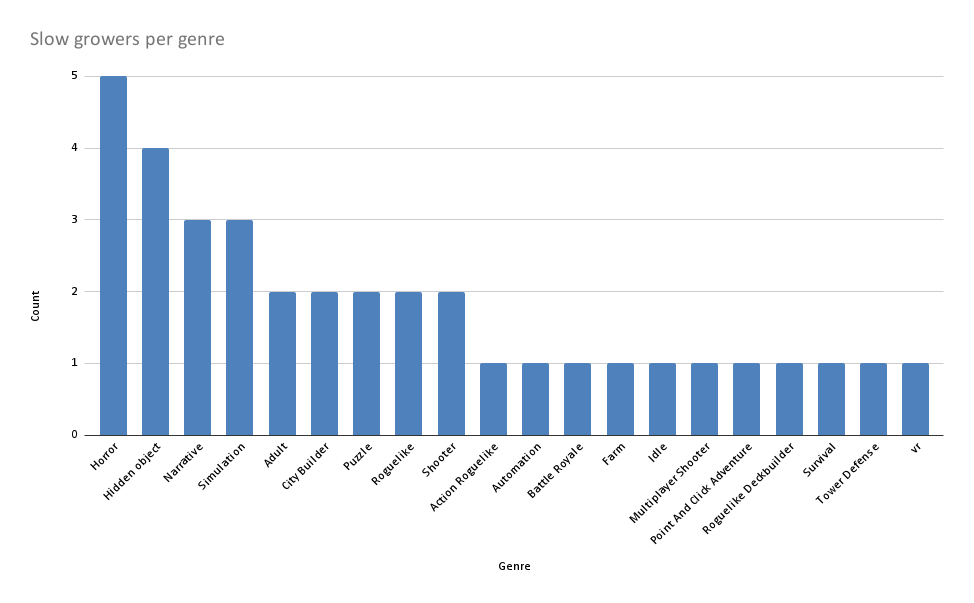
- 36 games released in Q1-Q2’24 reached the 1,000-review mark in Q3’24. Generally, the first month sets the sales trend, but among these “late-blooming” successes, most are horror games, followed by simulators and hidden object games.
❗️Chris notes that if you’ve gathered a large number of wishlists but they didn’t convert to sales at launch, there’s a high chance that commercial success isn’t likely. Similarly, for projects with low initial sales and few wishlists, success is also unlikely.
Games & Numbers (October 16 - October 29; 2024)

PC/Console Games
- Bohemia Interactive games have sold over 47 million copies, with almost 41 million sold on Steam.

- It Takes Two has been purchased more than 20 million times.
- Over 10 million people have played Dead Island 2, though this includes users from subscription services, not only direct sales.
- Total sales for the Resident Evil 4 remake have exceeded 8 million copies, achieving this in a year and a half.

- Dragon Ball: Sparking Zero sold 3 million copies within 24 hours of its October 7 release.
- Warhammer 40,000: Space Marine II has surpassed 4.5 million copies sold. The id Software veterans who led the development reported this as their most successful launch.
- Silent Hill 2 sold over 1 million copies in its first week, with higher sales in Europe than The Callisto Protocol and Alan Wake 2. In European countries, 78% of sales were for the PS5 version.
- According to Insider Gaming, Prince of Persia: The Lost Crown sold around one million copies, below management’s expectations. Rumor has it that the development team faces layoffs.
- The indie boxing game Undisputed, created by a team with no prior video game experience, has sold over 1 million copies.
- Sonic x Shadow Generations sold more than 1 million copies since its release, counting both physical and digital copies.
- The indie horror game Crow Country sold 100,000 copies.
- Peak CCU for the indie project Liar’s Bar exceeded 100,000 players.
Mobile Games
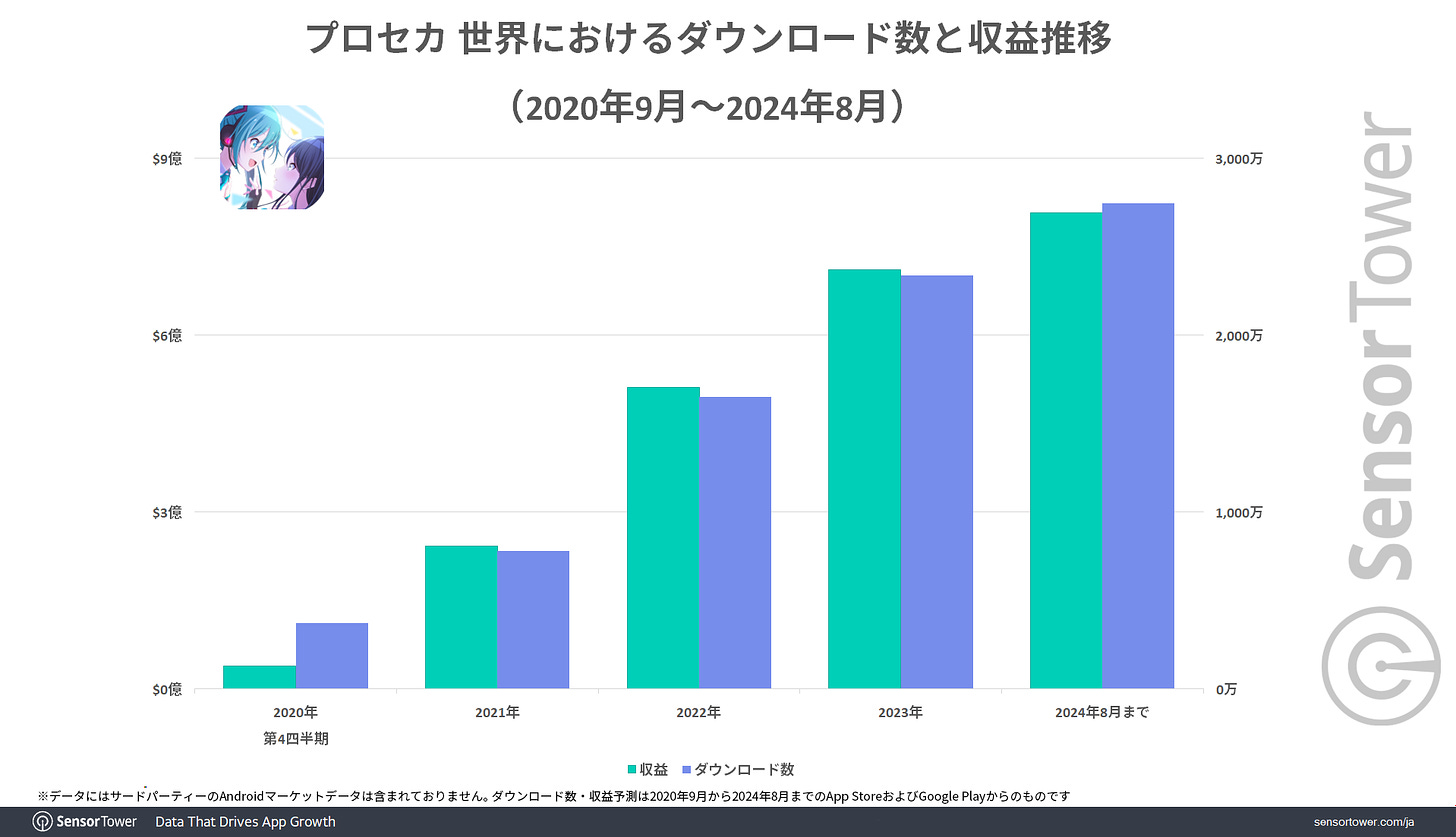
- According to Sensor Tower, Hatsune Miku: Colorful Stage! has generated over $800 million in revenue over four years, contributing more than 50% of SEGA’s mobile revenue. The iPad version alone accounts for a significant 18% of total revenue.
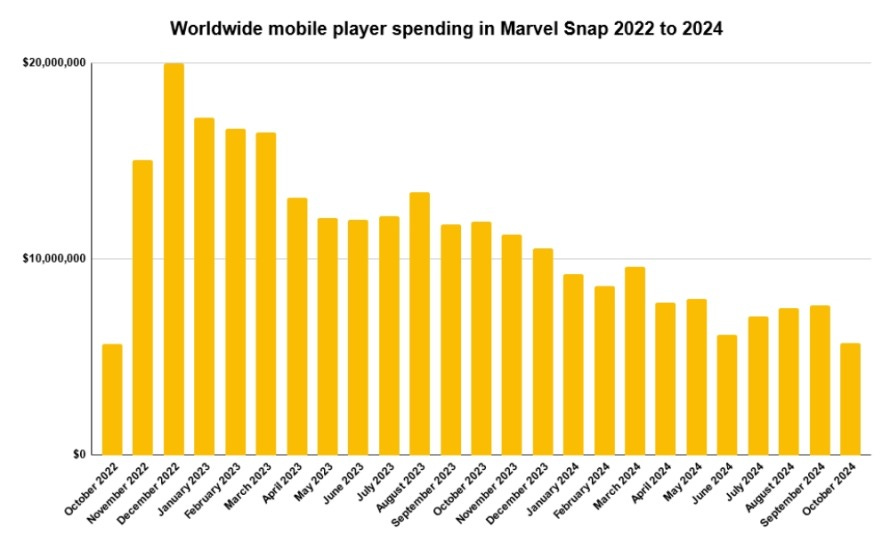
- In its two years, Marvel Snap has earned over $275 million solely on mobile devices, though its second-year revenue dropped by 40% from the first.
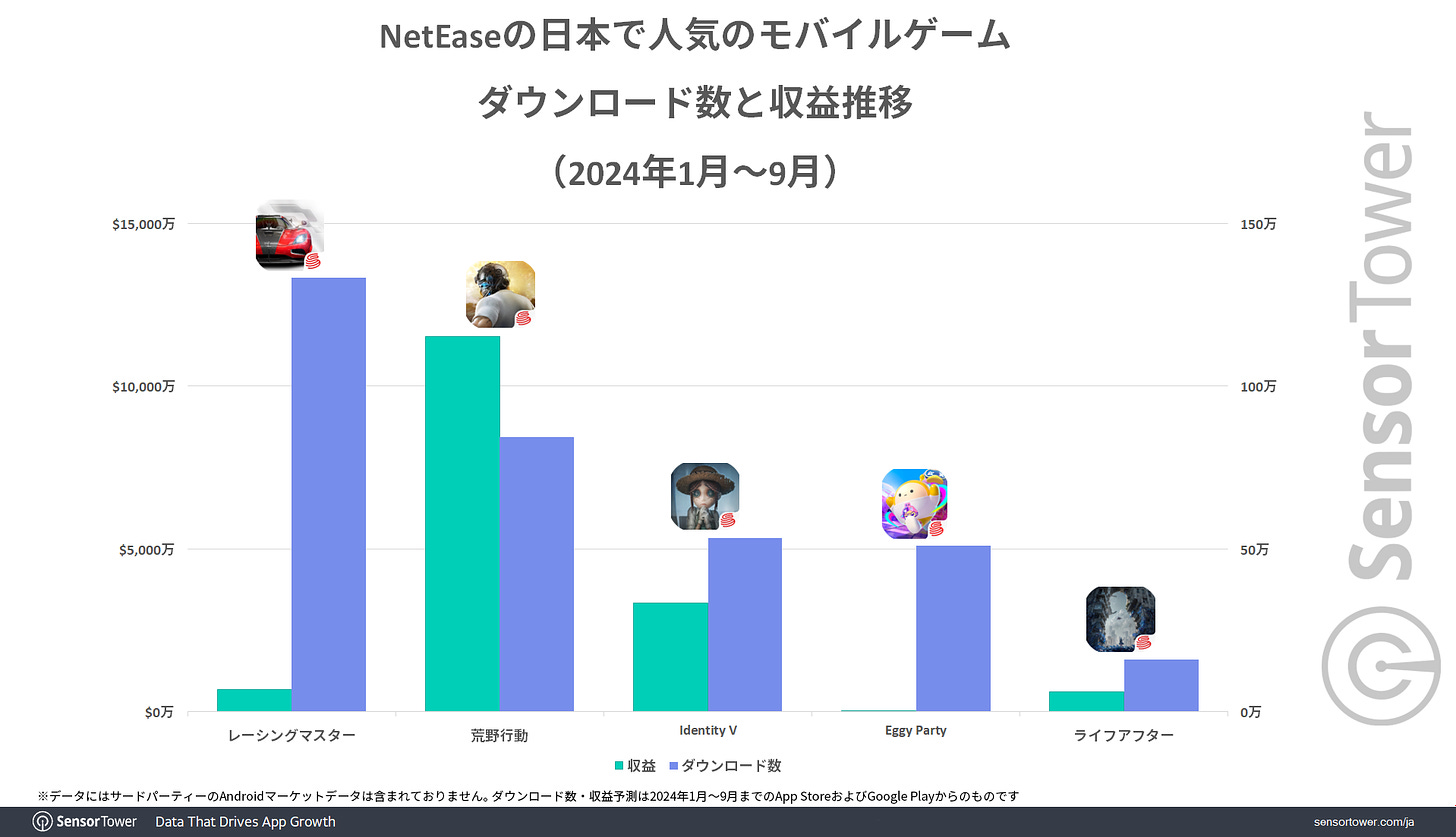
- Racing Master by NetEase, launched in Japan in August, has already surpassed $100 million in revenue. It ranks as NetEase’s top-downloaded game in Japan but remains below top revenue records.
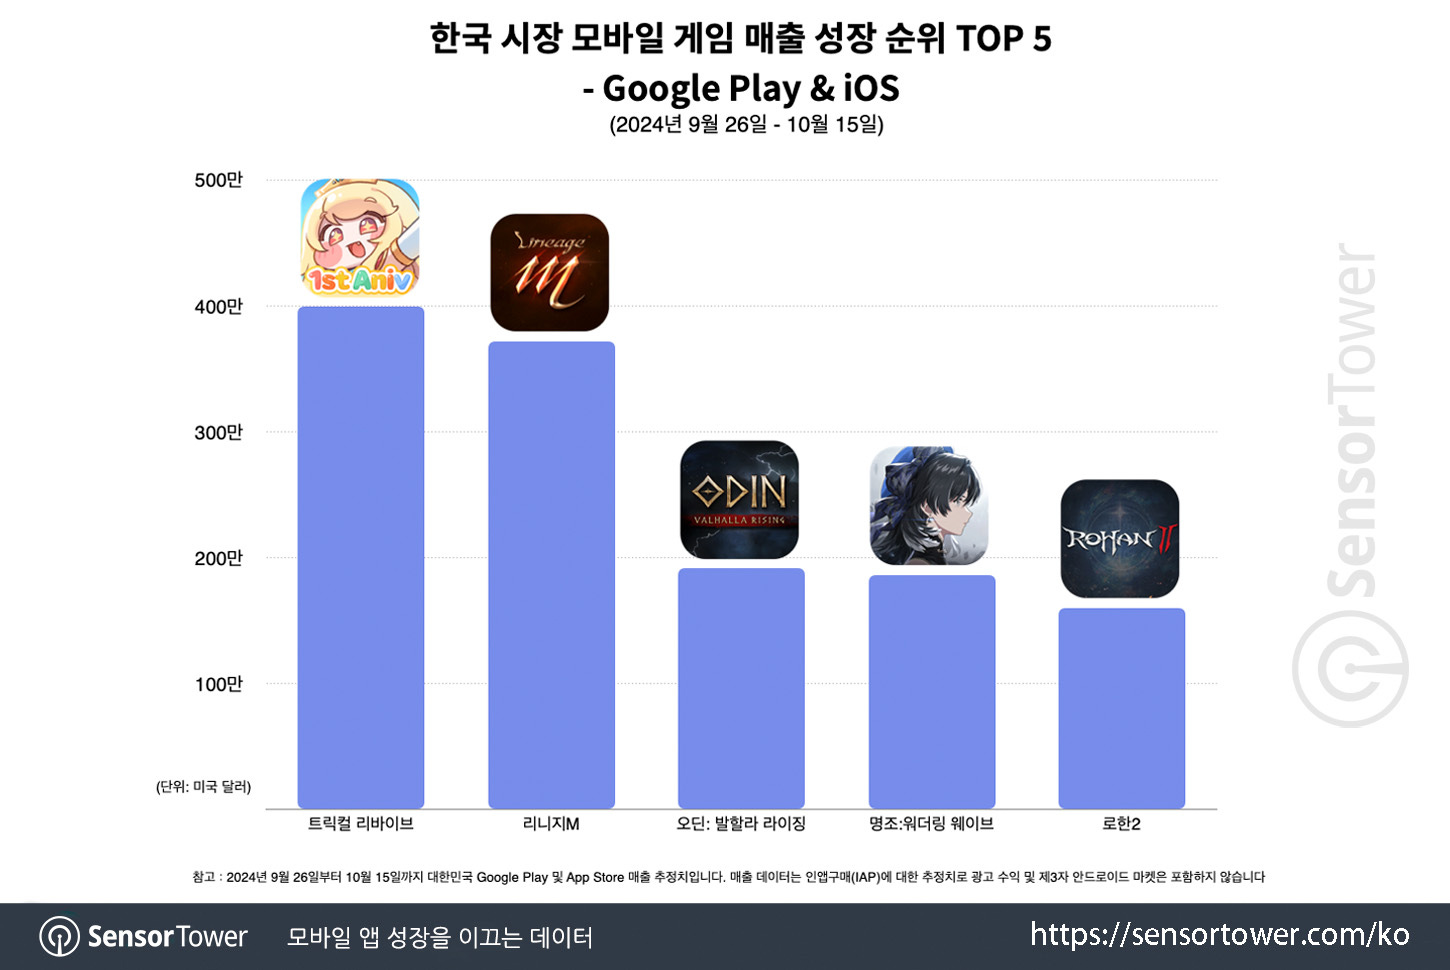
- Trickcal Re: VIVE, initially launched in 2021 and re-released in 2023, shows promise in the Squad RPG market. The game has generated over $15 million in South Korea alone, with $4.5 million (30% of its total revenue) earned between September 26 and October 15. BiliBili is currently working on an international version.
Newzoo: Top 20 PC/Console Games of September 2024 by Revenue and MAU

Newzoo tracks the markets of the United States, United Kingdom, Spain, Germany, Italy, and France.
Revenue - All Platforms
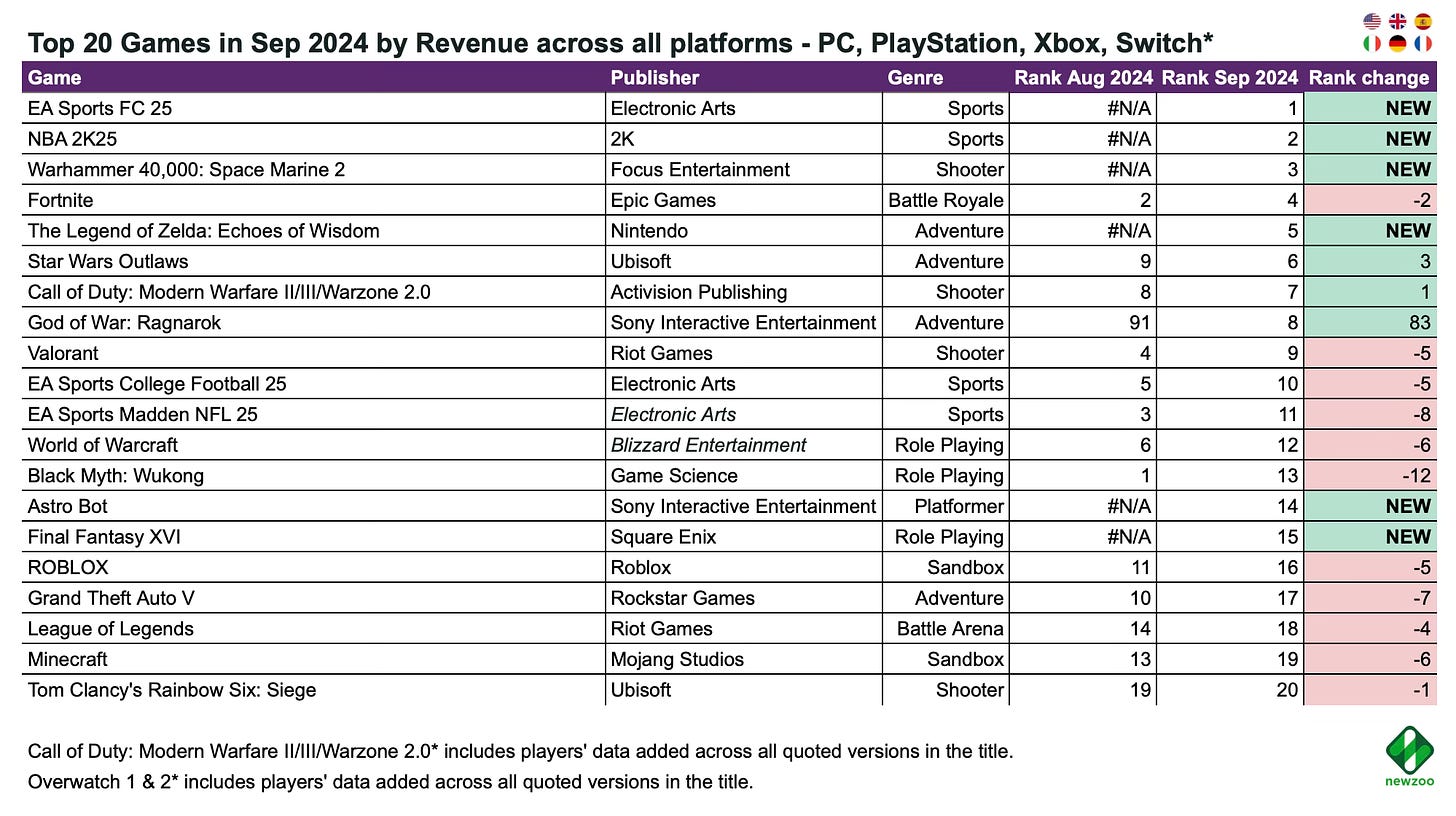
- Five new releases entered the chart in September: EA Sports FC 25, NBA 2K25, and Warhammer 40,000: Space Marine 2 (top three spots). The Legend of Zelda: Echoes of Wisdom took 5th place, and Astro Bot reached 14th. Final Fantasy XVI ranked 15th after launching on PC following a period of exclusivity on PlayStation.
- God of War: Ragnarok climbed to 8th in revenue after its release on PC.
- Black Myth: Wukong, the breakout hit of August, started strong in 3rd place.
Revenue - Platforms
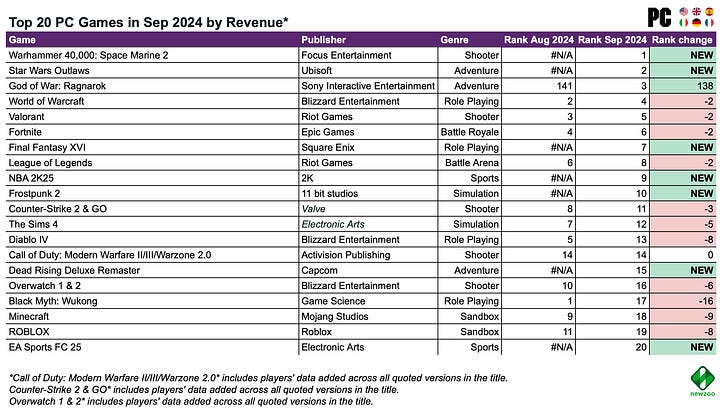
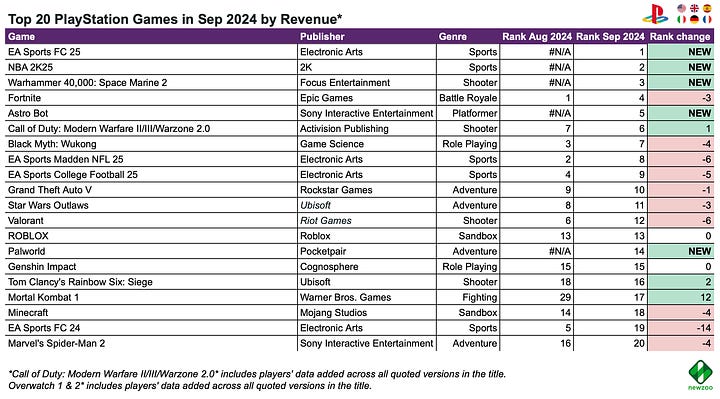
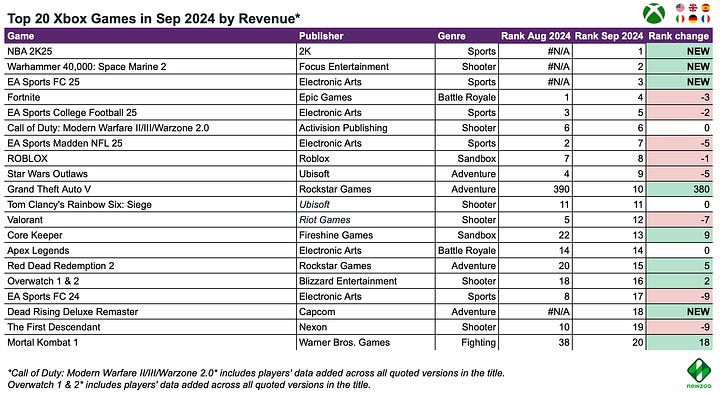
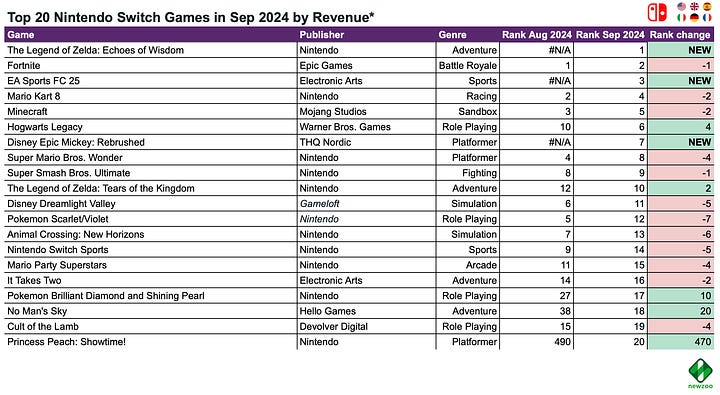
- Warhammer 40,000: Space Marine 2 and surprisingly Star Wars Outlaws led sales on PC (Steam). This is notable, given the news of weaker sales for Star Wars Outlaws. Other strong performers on PC included Final Fantasy XVI (7th), Frostpunk 2 (10th), and Dead Rising Deluxe Remaster (15th).
- Astro Bot secured 5th place in PlayStation revenue. Palworld, debuting on PlayStation, came in at 14th.
- On Nintendo Switch, The Legend of Zelda: Echoes of Wisdom held the top sales position, typical for Nintendo games. Interestingly, Disney Epic Mickey: Rebrushed ranked 7th on Switch but didn’t make the top 20 on other platforms.
MAU - All Platforms
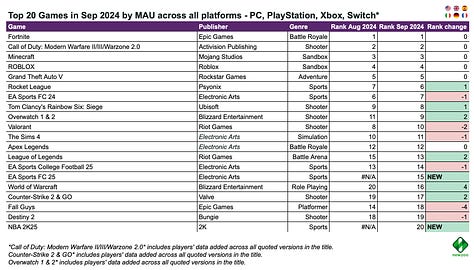
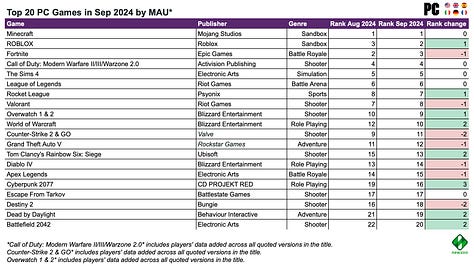
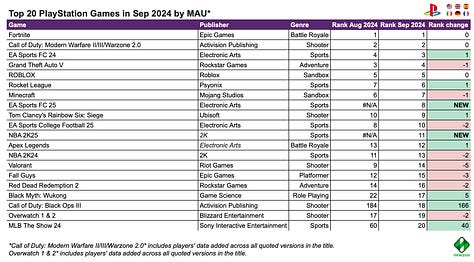
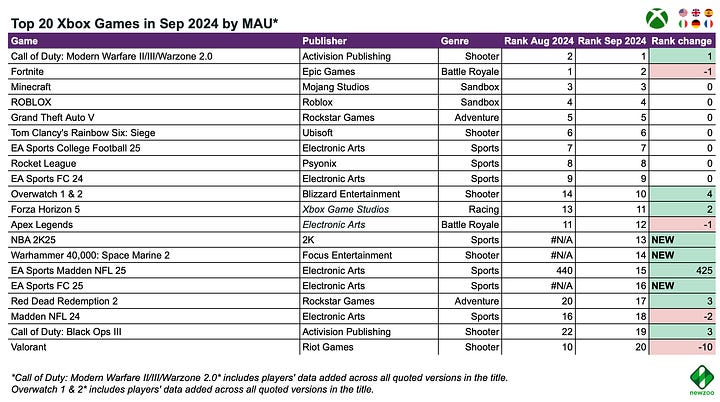
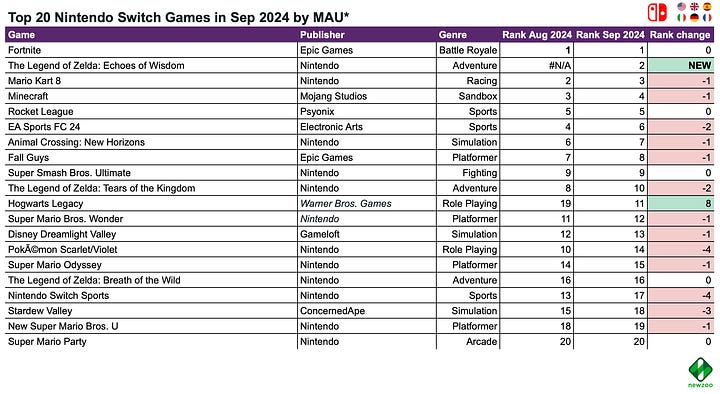
- Two new titles appeared in the MAU ranking: EA Sports FC 25 and NBA 2K25, with annual franchise turnover.
- Call of Duty: Black Ops III re-entered PlayStation’s top 20 MAU list, likely as players revisit it ahead of a new series installment.
- On Xbox, Warhammer 40,000: Space Marine 2 made the top 20 for MAU, although it didn’t achieve this on other platforms.
Circana: Best-Selling PC/Console Games in the U.S. by Year in the 21st Century
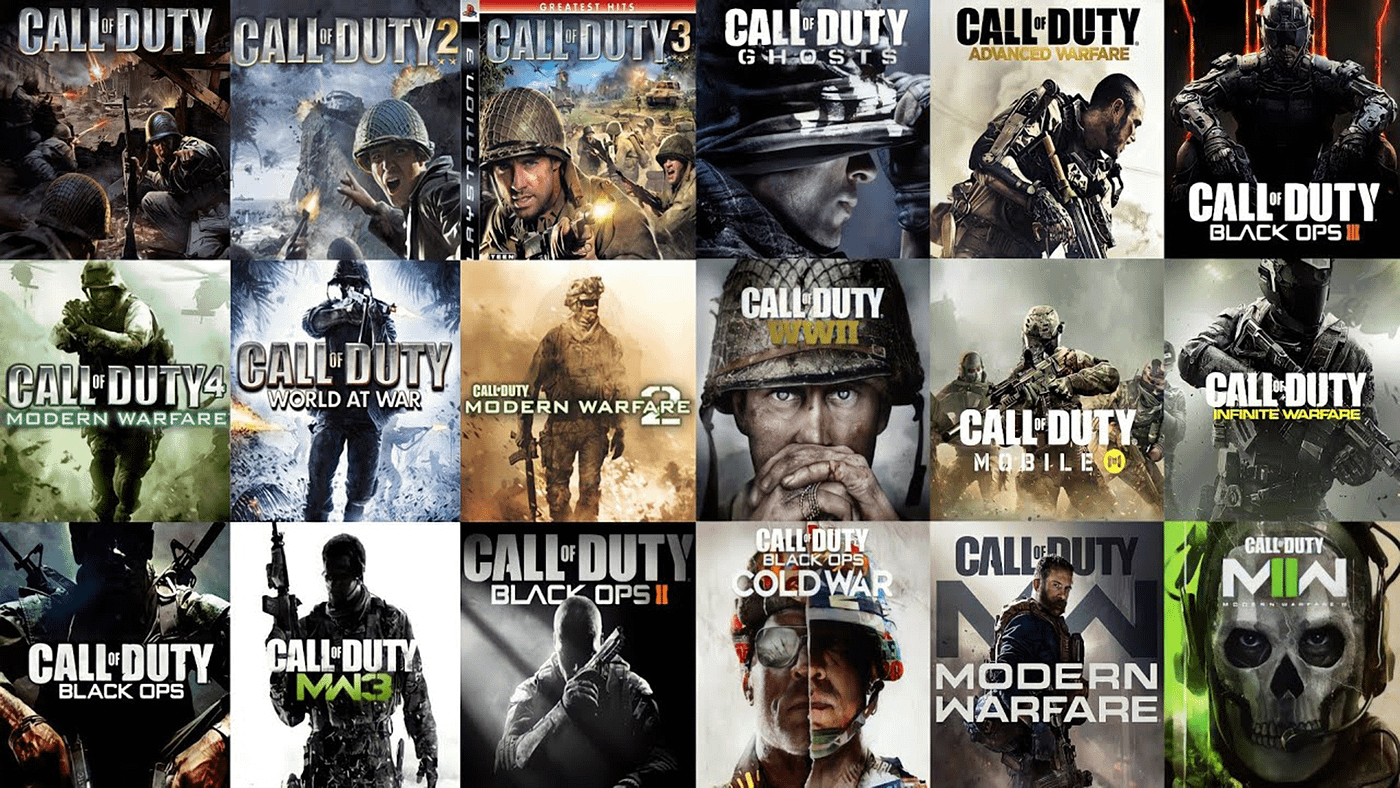
- The Call of Duty series has topped the charts most frequently, claiming the first spot 12 times over the last 23 years.
- Madden NFL is another standout series. Since the beginning of the century, its games have been in the top spot four times and have never fallen out of the top 20 in sales. Moreover, for the past 22 years, Madden NFL games have not dropped below the fifth spot in the charts.

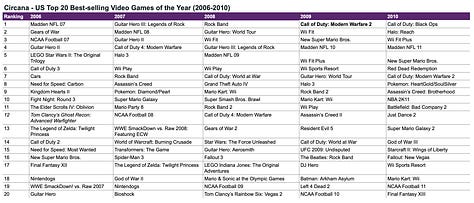
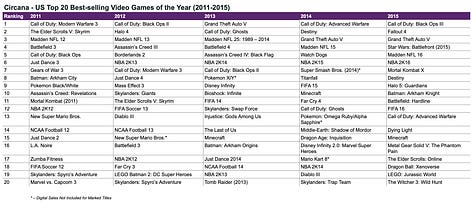
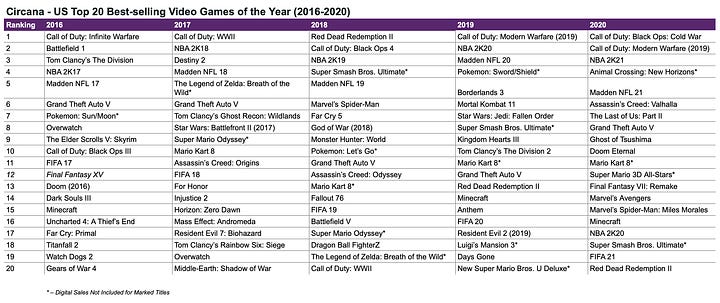
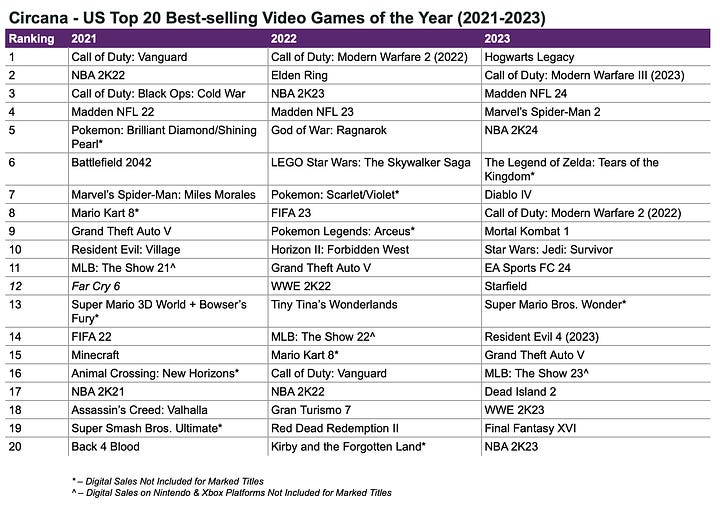
- Grand Theft Auto games have claimed the top spot three times: Vice City (2002), San Andreas (2004), and GTA V (2013).
- Call of Duty games haven't managed to hold the top chart spot for more than four consecutive years. The series topped the charts from 2009 to 2012, until GTA V broke the streak. Red Dead Redemption II interrupted in 2018, and in 2023, Hogwarts Legacy took the lead. If history repeats, Call of Duty should return to the top in 2024—unless adding the game to Xbox Game Pass affects its sales.
- From 2007 to 2009, music games thrived, with several entries from Guitar Hero and Rock Band in the charts—even the niche DJ Hero made it into the top 20. Those were the days!
AppCharge: 72% of the top-earning Mobile Games in the U.S. have webshops
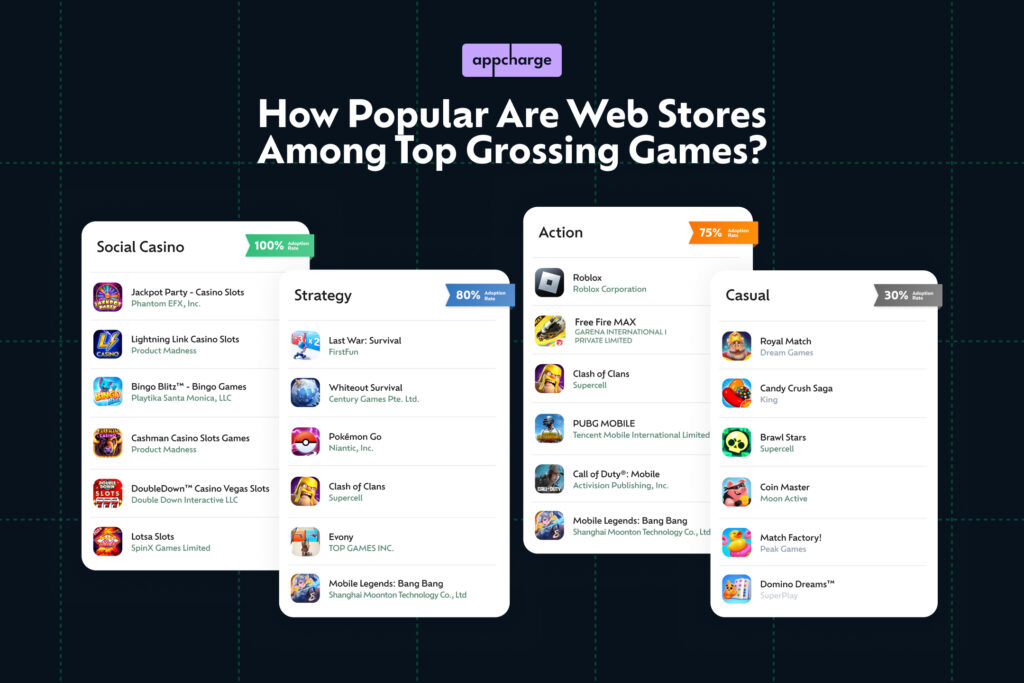
The company identified the top-earning games on iOS in the U.S. using Sensor Tower.
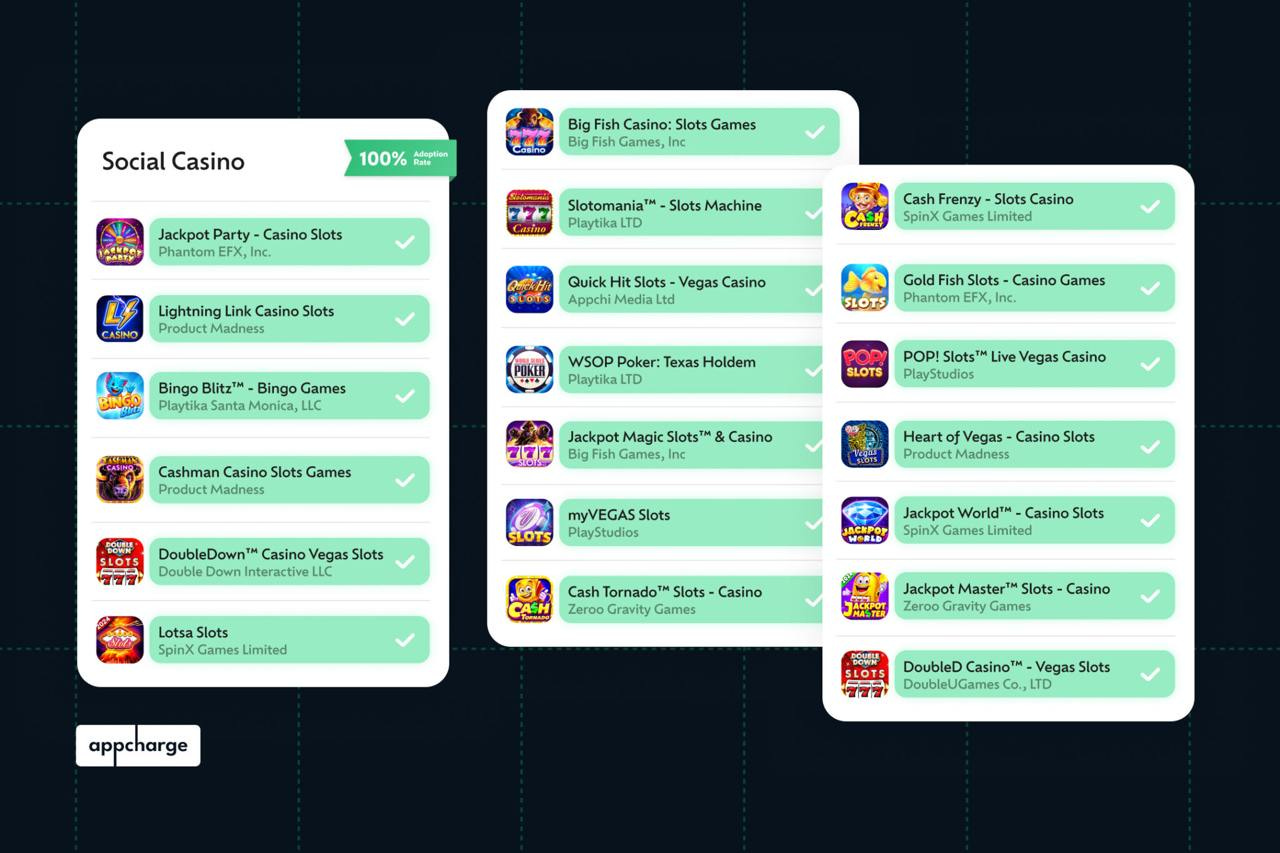
- 100% of social casino games in the top 20 by revenue in the U.S. on iOS use web stores. High ARPU in these projects and an established VIP support system contribute to this penetration.
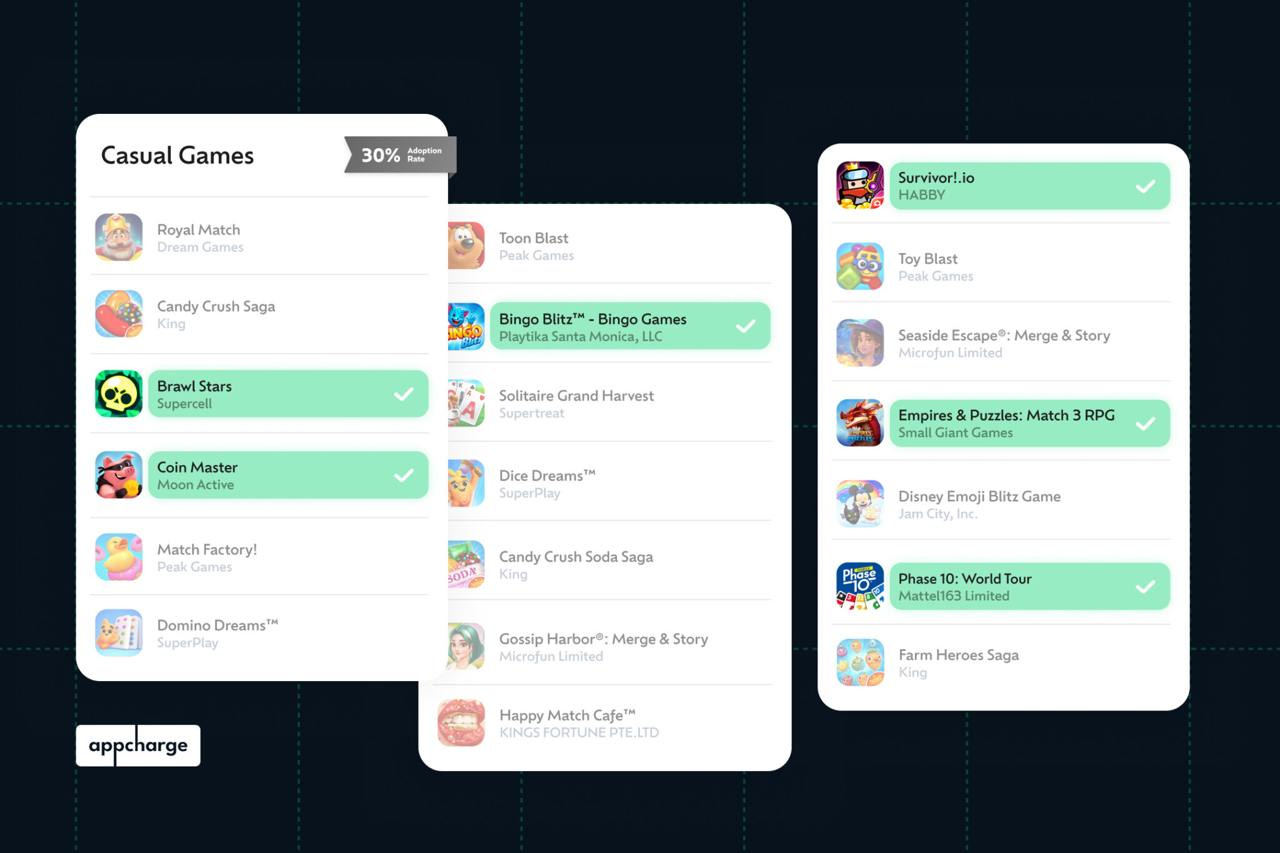
- 30% of casual games in the top 20 have web stores. Compared to social casinos, AppCharge attributes the lower penetration to the impulsive nature of purchases in the casual genre and the lower ARPU.
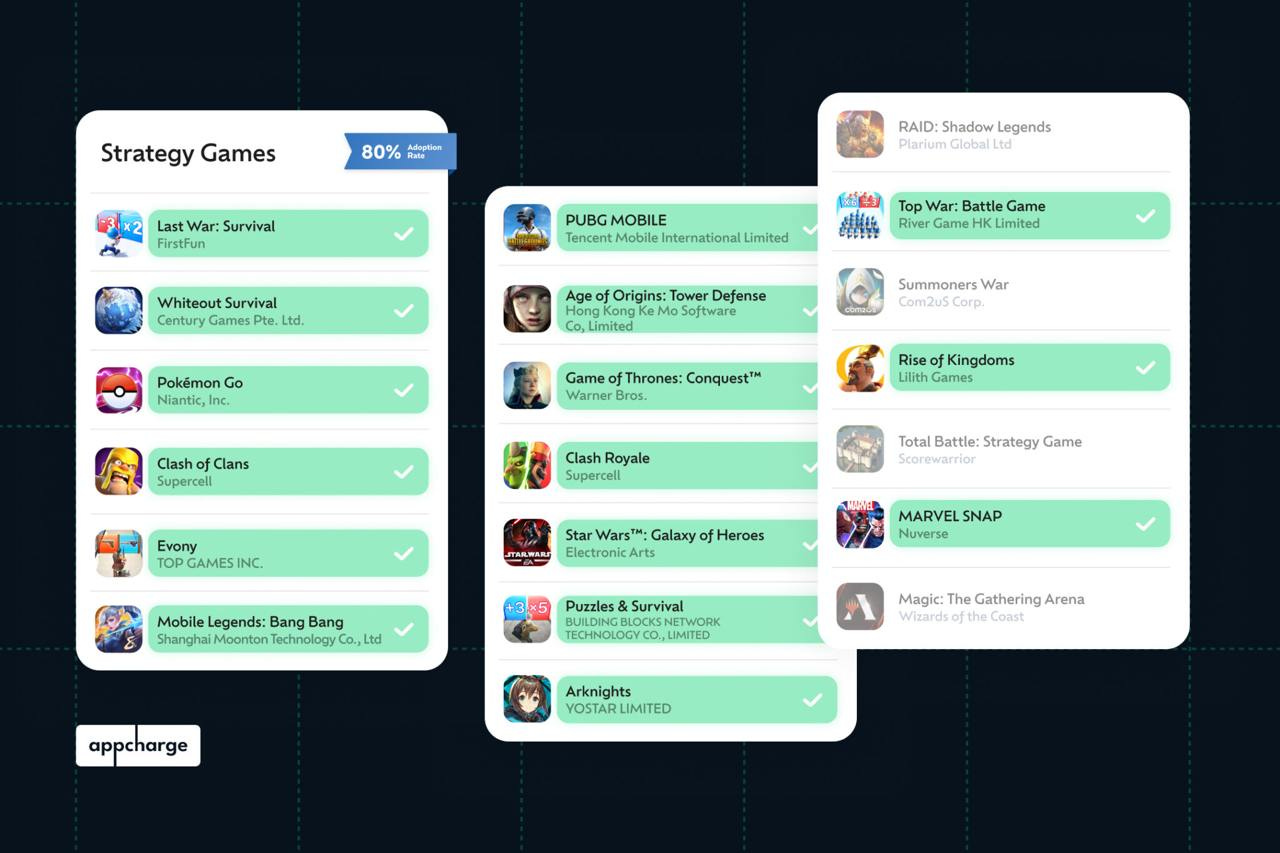
- 80% of strategy games in the U.S. top 20 have web stores.
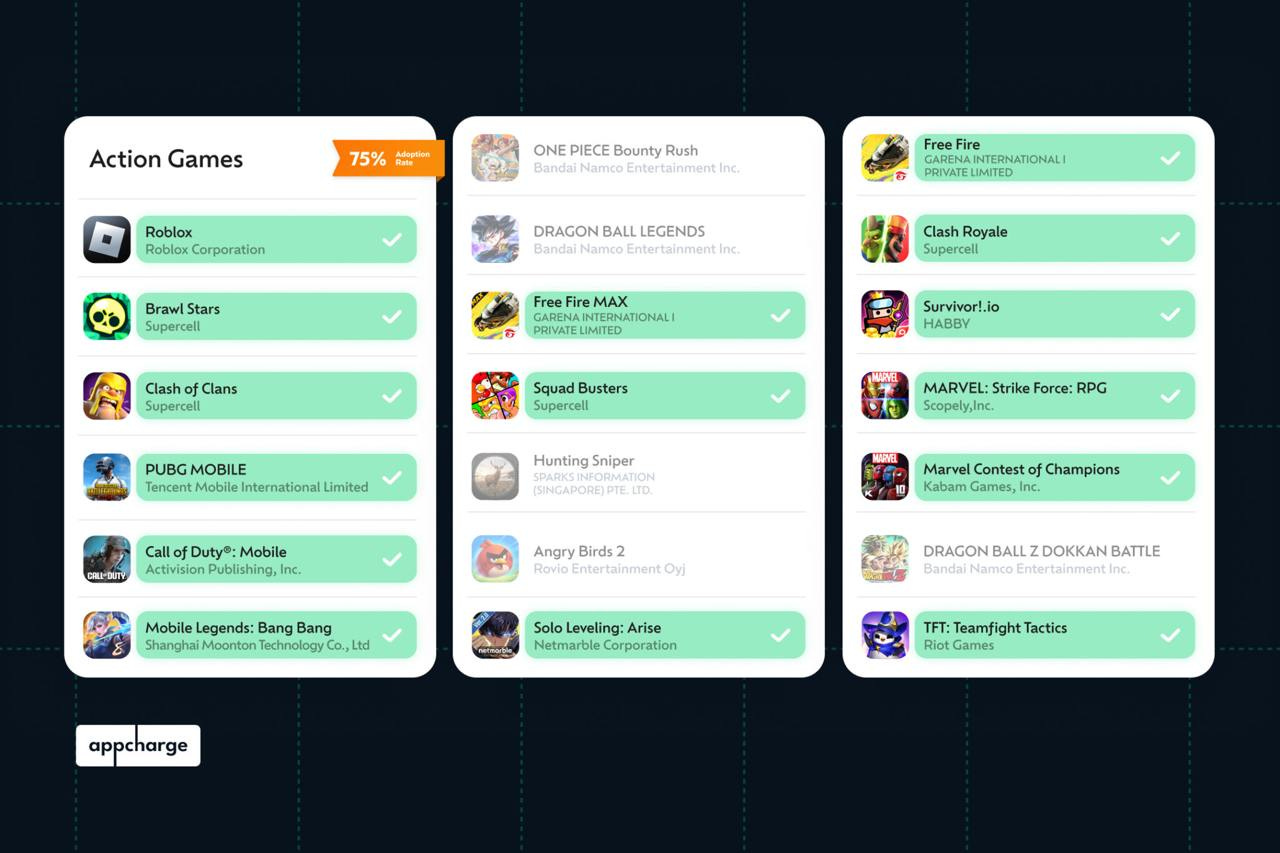
- 75% of action games in the U.S. top 20 have launched web stores for their players.
Mistplay: Mobile Gaming Growth Report (2024)
Mistplay analyzed 3,000 users from Tier-1 Markets (US, Canada, United Kingdom) in Q2 2024 who used Mistplay. Paying users are defined as players who purchased within the last 30 days at the time of the survey.
Mistplay studies user behavior during the early days of their engagement with a game, specifically from discovery up to the 7th day.
How users discover games
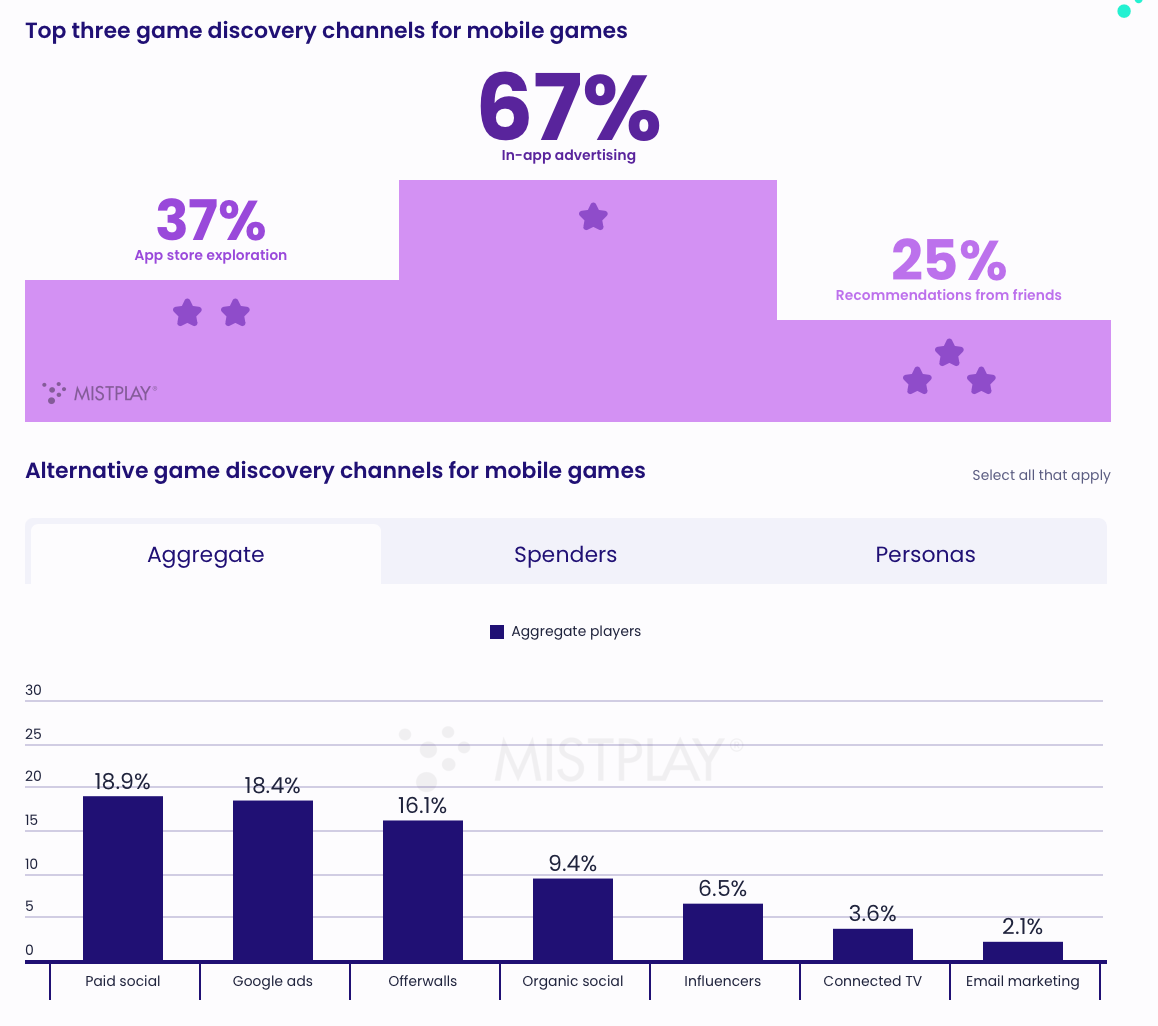
- The top source (67%) is in-game ads. Second (37%) is searching in app stores, and third (25%) is recommendations from friends.
- The most popular alternative channels include social media ads (18.9%), Google Ads (18.4%), and offerwalls (16.1%).
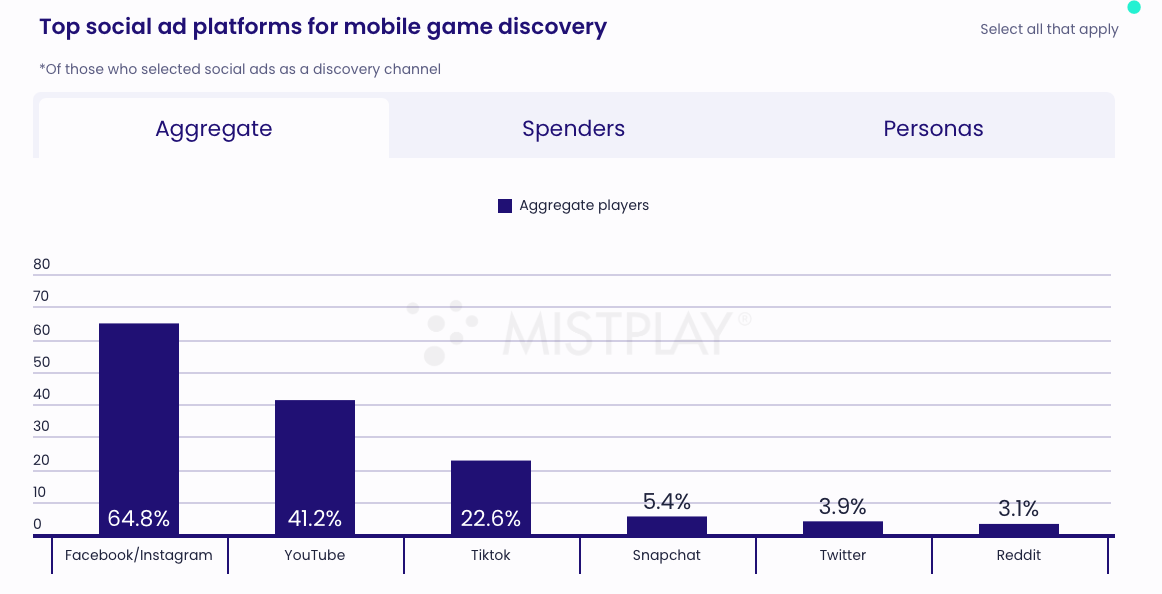
- The most popular social platforms where users discover games are Facebook/Instagram (64.8%), YouTube (41.2%), and TikTok (22.6%).
Ad Creatives
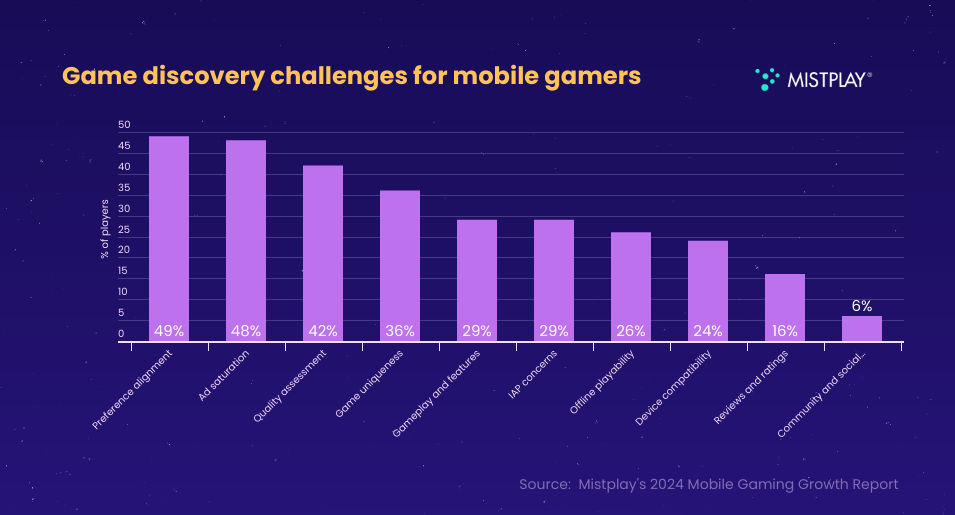
- Users report encountering several issues with ads: they don’t like the ads (48.5%); there are too many ads (48.26%); ads are of poor quality (41.69%); and the games are not unique (36.39%). These are the most common problems.
- The preferred ad formats are ones that showcase real gameplay (47.5%) and interactive ads (35.5%). Other types of ad creatives are less popular with audiences.
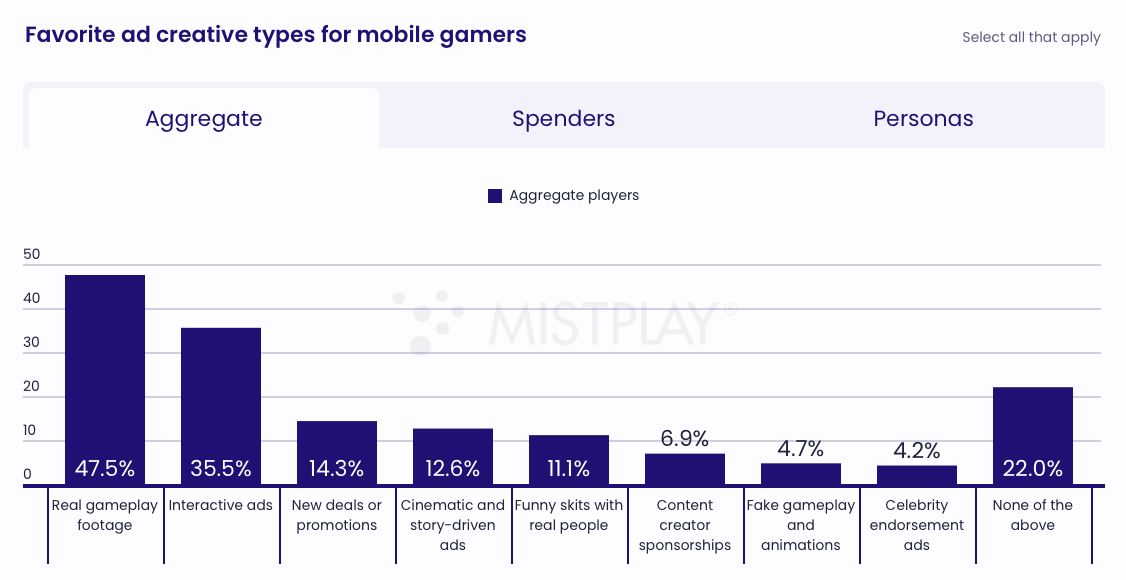
- Brand collaborations appeal to only 1/5 of users. They are the least interesting to casual players but most appealing to fans of sports games.
ASO Optimization
- 75% of users check the game’s page before installing it. 48.6% look at the ratings, and 42.4% read the description.
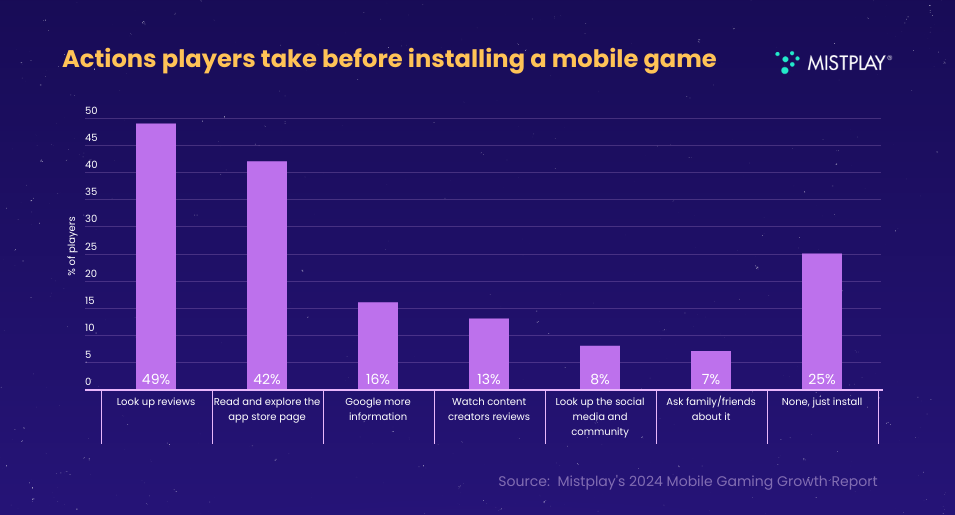
- Around a quarter of users say that the developer’s brand and the game’s brand influence their decision to install the game.
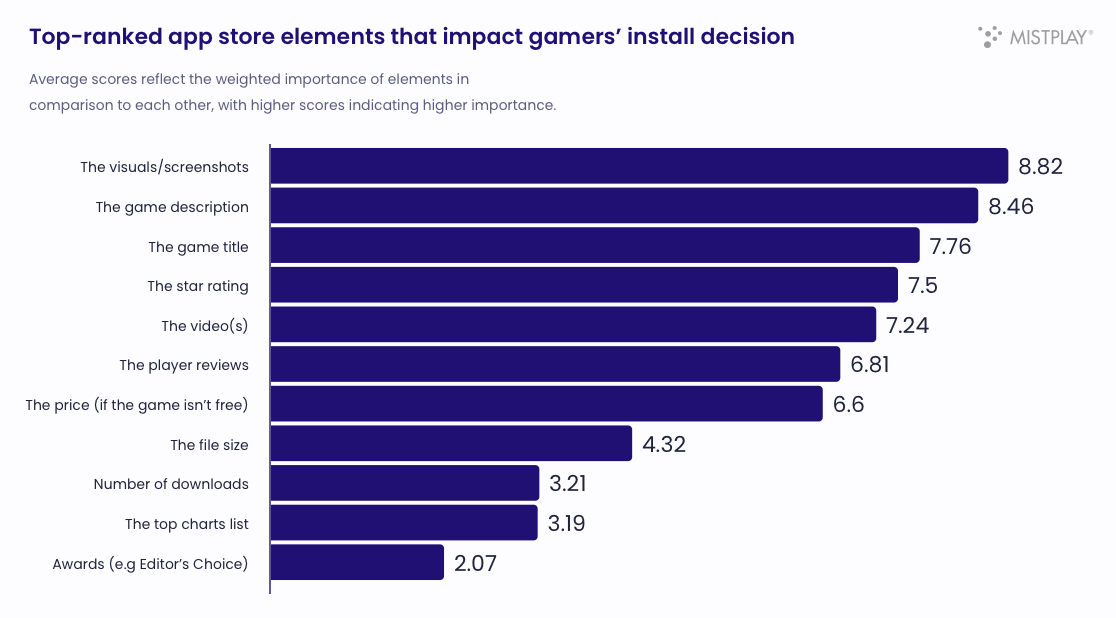
- Visuals and screenshots are the most important elements users consider. Following that (in descending order of importance) are the game description, title, rating, trailer, user reviews, price (if the app isn’t free), app size, number of downloads, chart position, and awards.
Player Behavior in the First Days of Gameplay
- The main reasons players stay after their first session include enjoying the gameplay mechanics (69.2%), a strong sense of progression and rewards (67.1%), appealing visual style (45.2%), ads matching the gameplay (40.6%), and a well-balanced experience (39.8%).
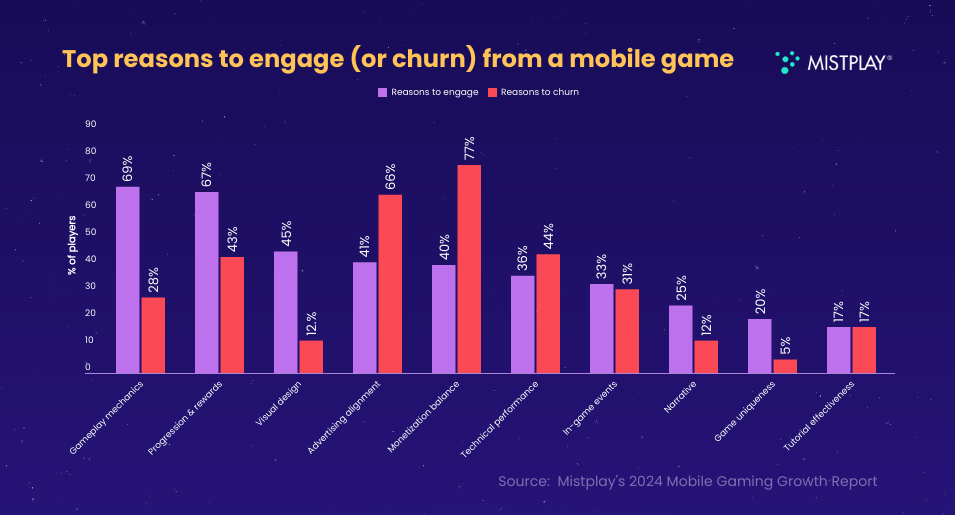
- The main reasons for leaving a game are pay-to-win mechanics (77.18%), too many ads (71.85%), and misleading ad creatives that don’t reflect real gameplay (66.17%).
- The key mechanics for bringing back lapsed users are rewards or discounts for returning users (51.96%) and releasing new content (49.18%).
Alternative User Monetization Methods
- 17.19% of paying users have bought subscriptions in the last six months; 12.87% have purchased paid games; and 8.1% of users bought in-app purchases (IAP) via web shops. 3.37% bought merchandise, 2.08% supported developers through crowdfunding, and 1.68% purchased NFTs.
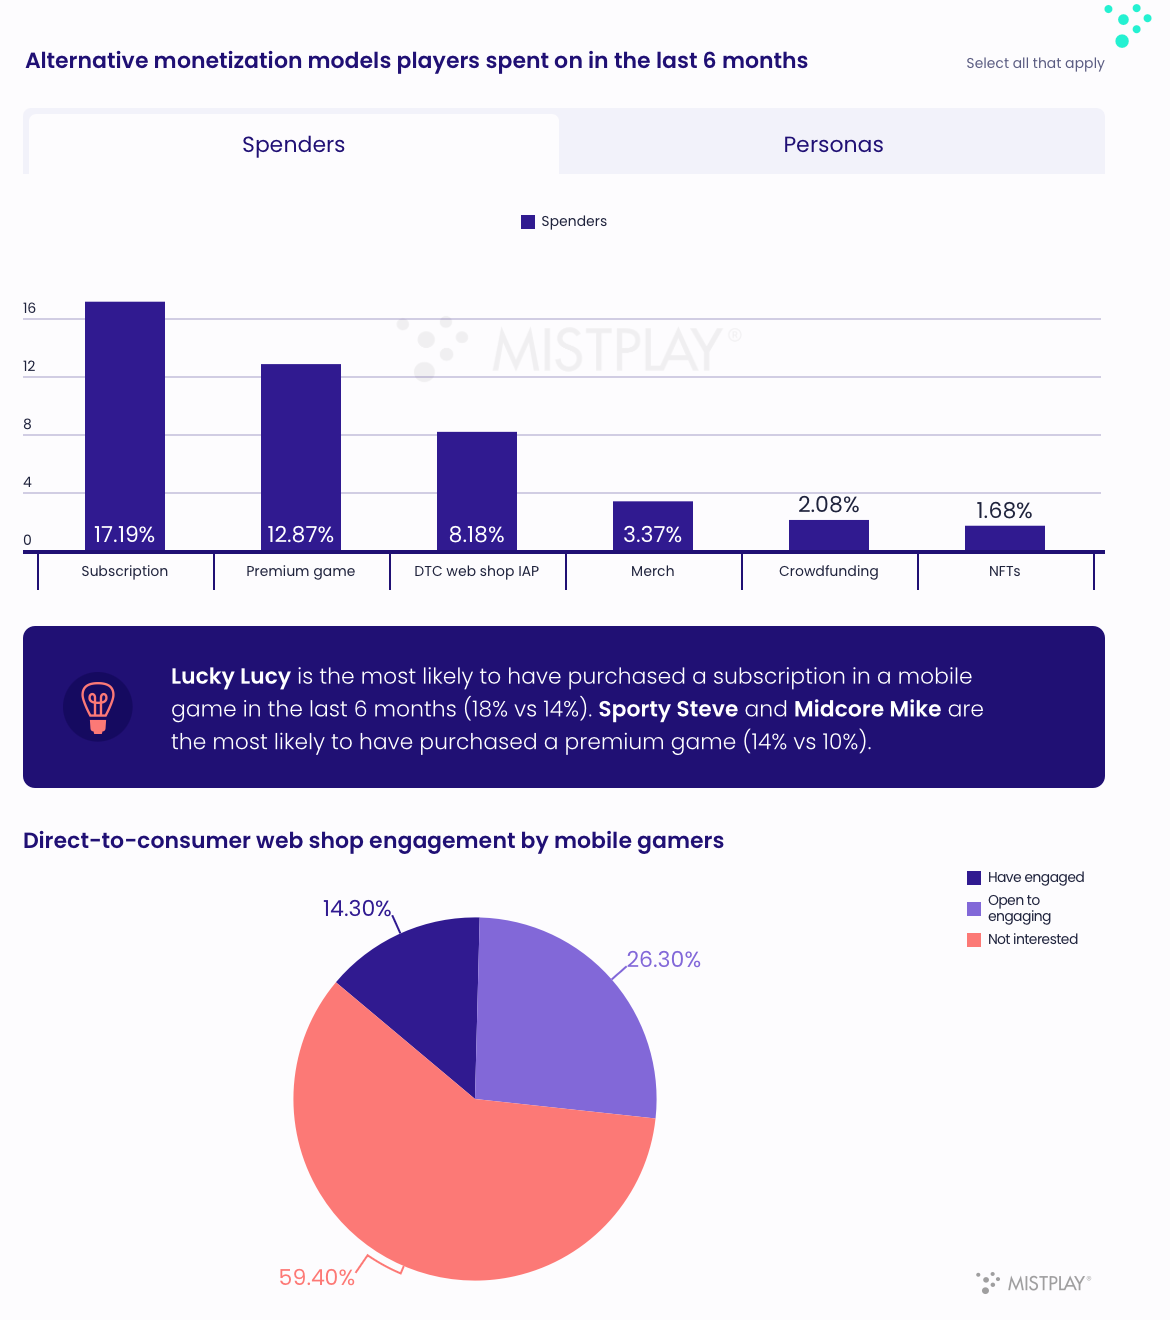
- Most users (59.4%) are not interested in web shops. 14.3% have used them before.
- 42.2% of users have played games based on IP, and 53.5% of players made purchases in games because of brand collaborations.
Sensor Tower: Mobile gaming market in Southeast Asia in 2024

Market Overview
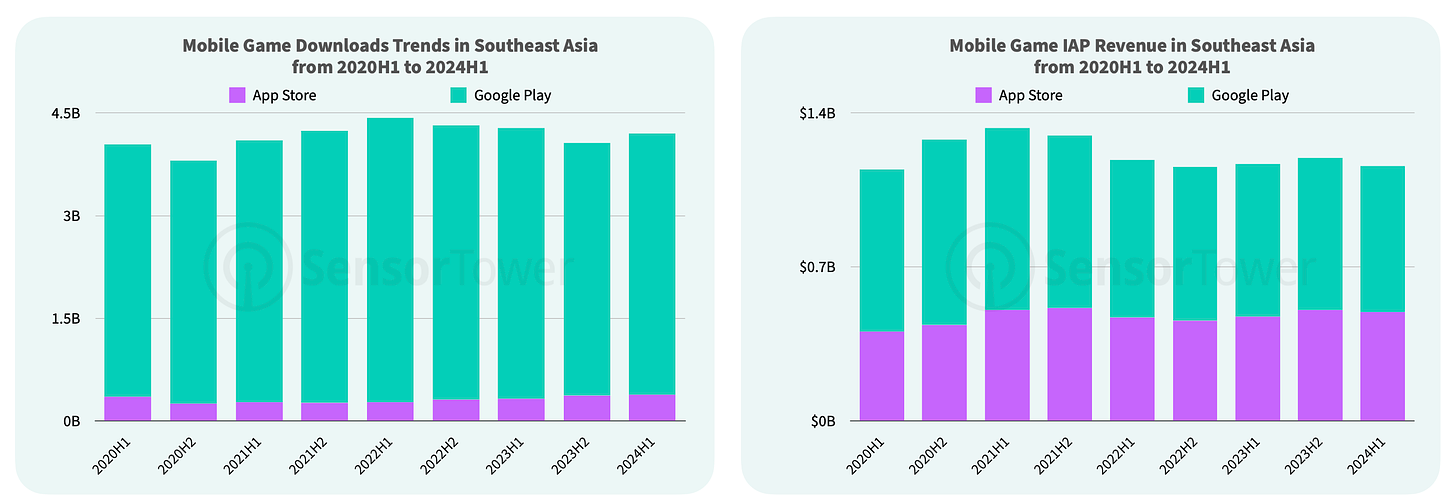
- Game downloads in Southeast Asia increased by 3.4% in the first half of 2024 compared to the second half of 2023, though they decreased year-over-year. The total volume reached 4.2 billion installs, with 91% coming from Google Play.
- Revenue declined by 3% compared to H2 2023, amounting to $1.16 billion—similar to the first half of 2020. Out of the total revenue, 57% was generated by Google Play.
Genres and Countries
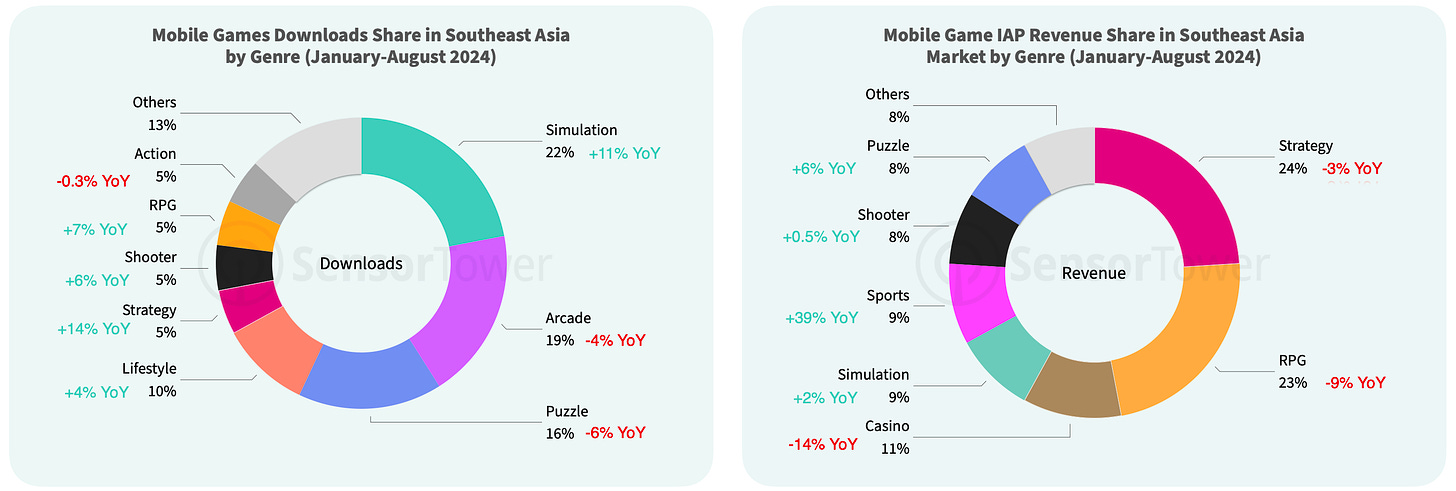
- From January to August 2024, downloads grew most in the strategy (+14% YoY), simulation (+11% YoY), RPG (+7% YoY), and shooter (+6% YoY) genres in Southeast Asia.
- Sport games (+39% YoY) and puzzle games (+6% YoY) shown the largest revenue growth. Core genres declined, with strategy dropping by 3% and RPG by 9%.
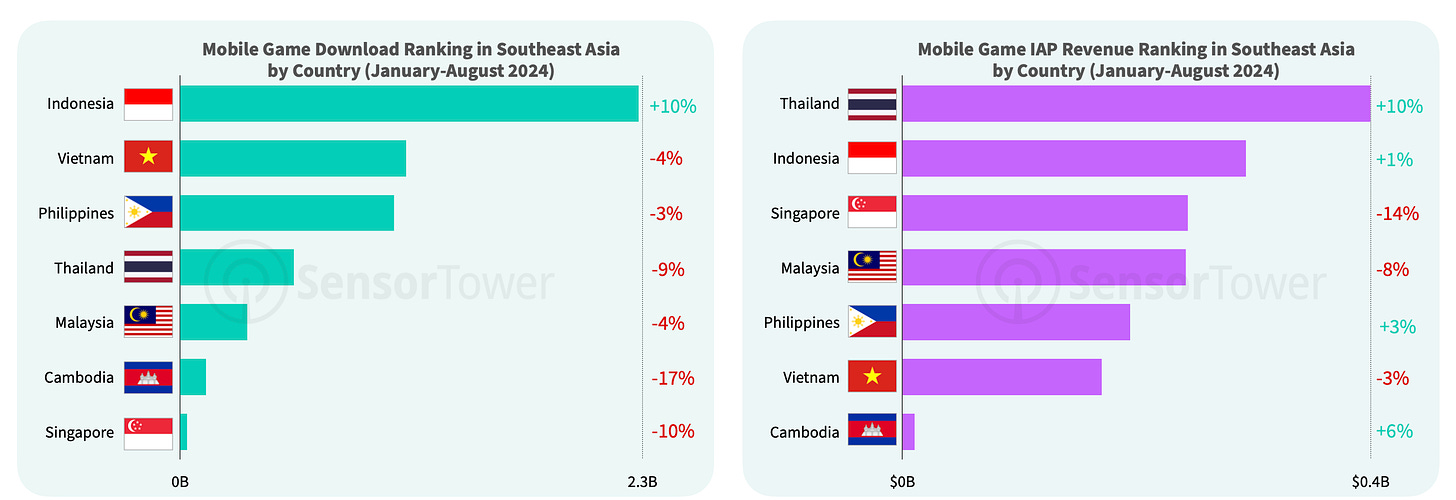
- Indonesia was the only Southeast Asian country to see download growth from January to August 2024, with a 10% increase, leading also in absolute installs.
- For in-game revenue, Thailand (+10% YoY), Indonesia (+1% YoY), the Philippines (+3% YoY), and Cambodia (+6% YoY) showed growth, while Singapore (-14% YoY) and Malaysia (-8% YoY) faced significant declines.
Most Popular Games
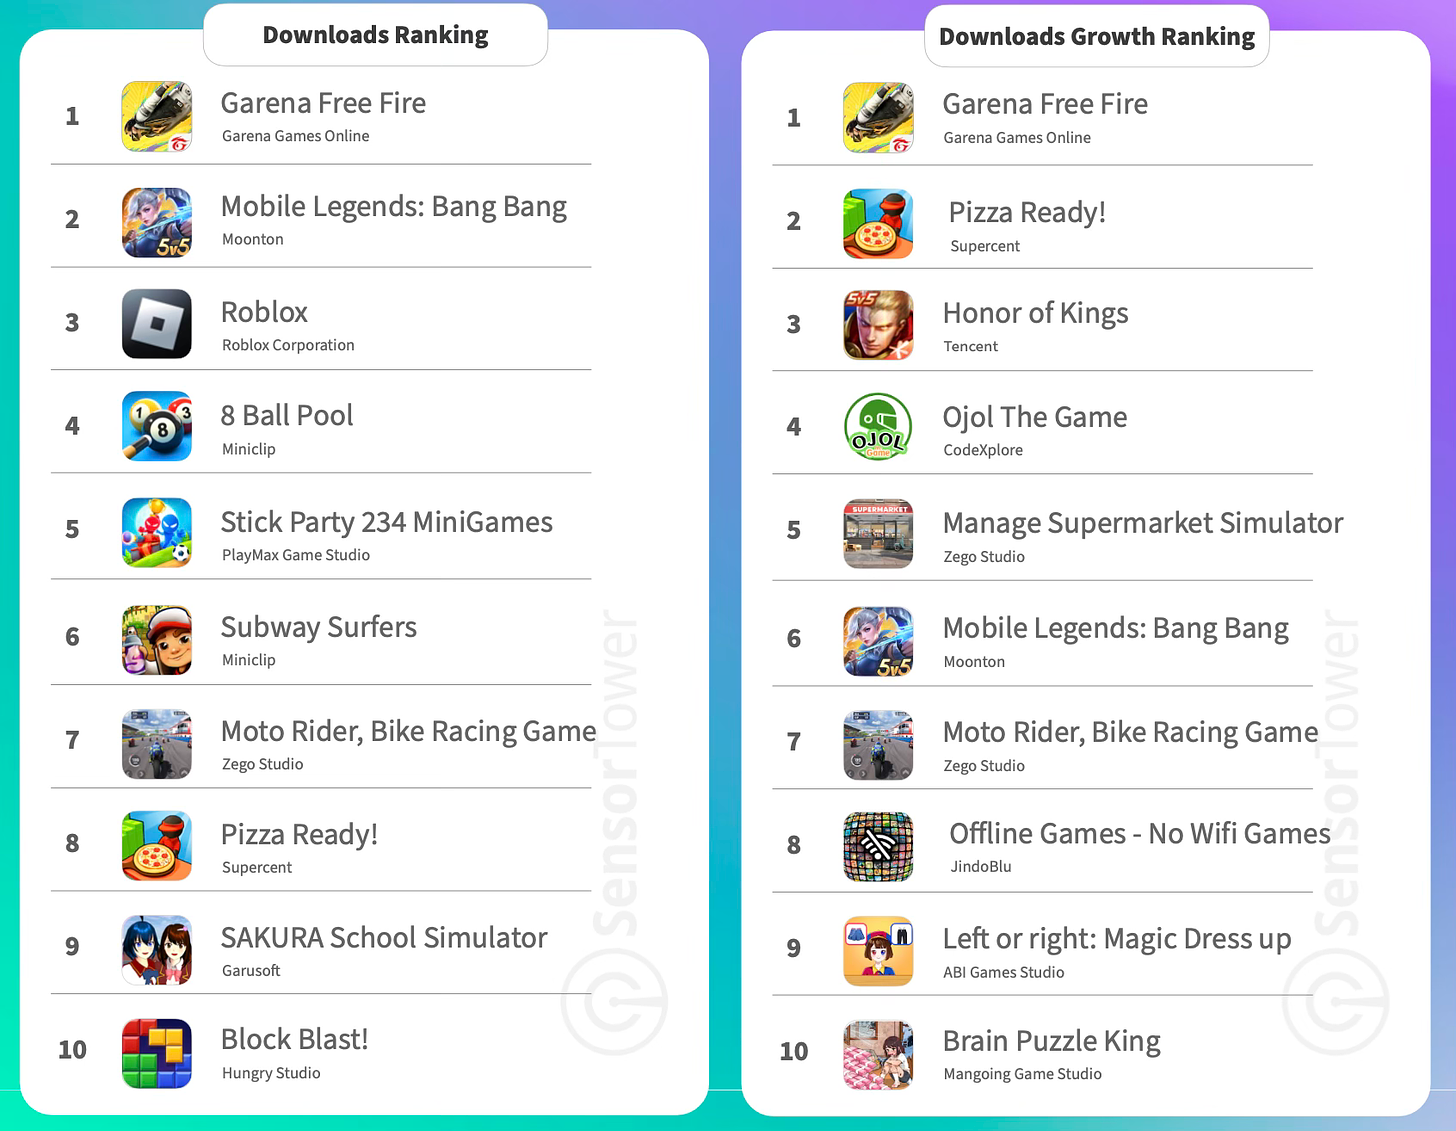
- The top games by downloads include Garena Free Fire (+54% YoY from January to August 2024), Mobile Legends: Bang Bang (+45% YoY over the same period), and Roblox.
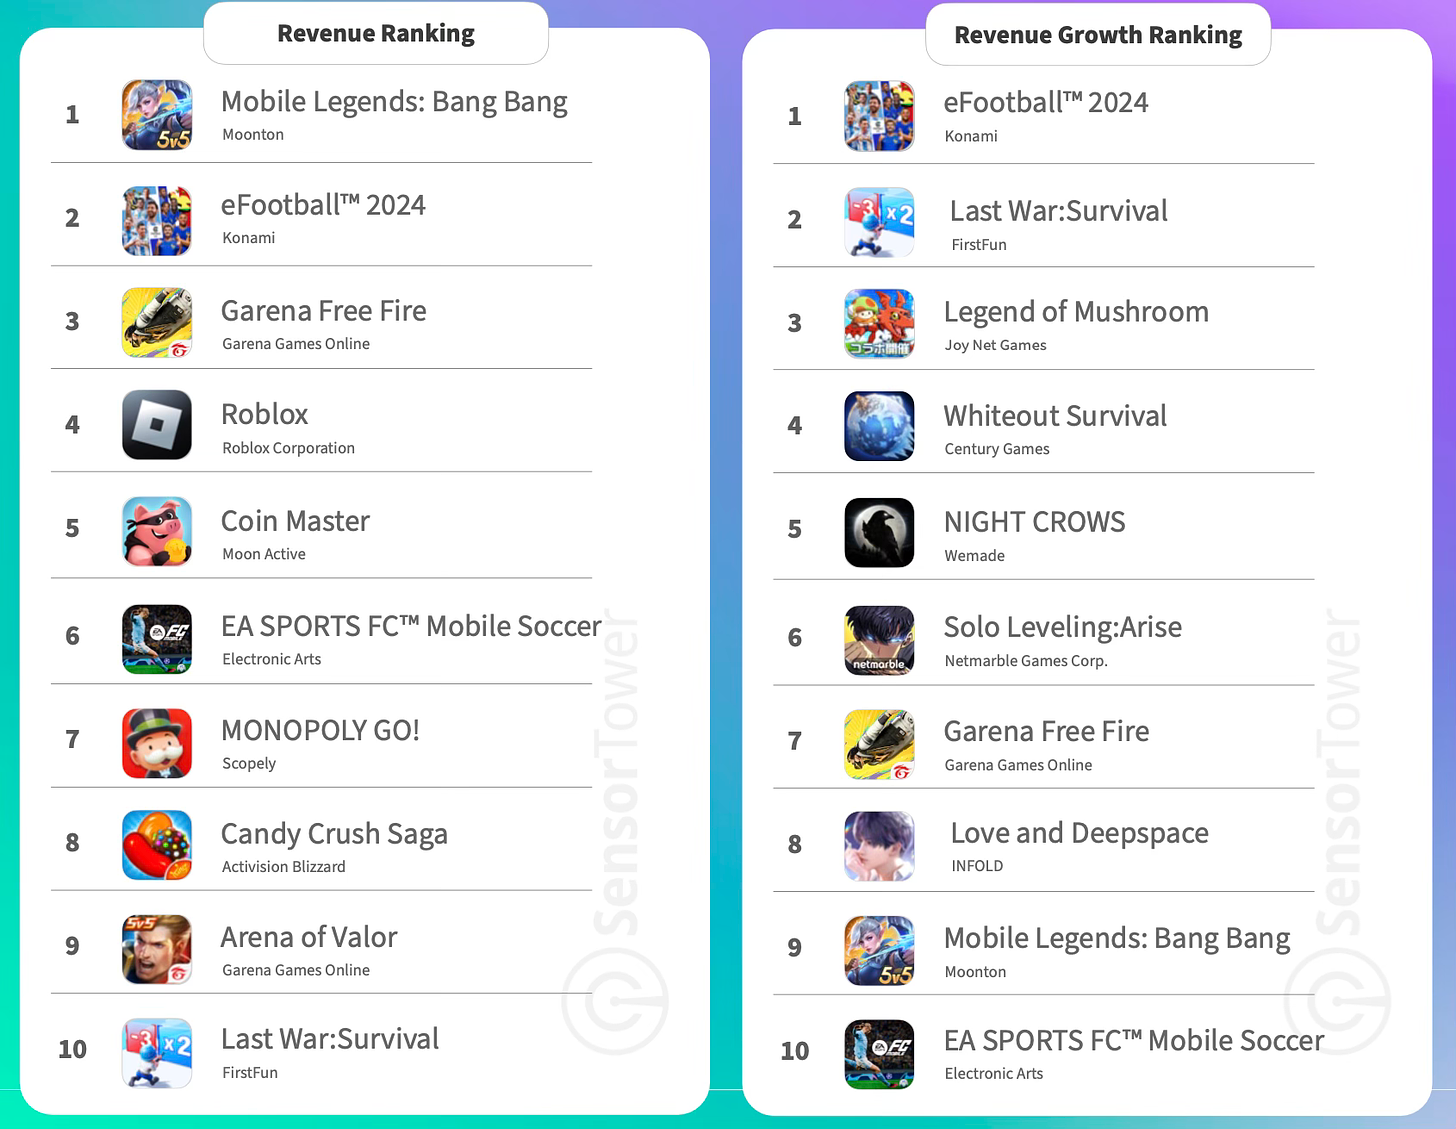
- Leading in revenue are Mobile Legends: Bang Bang (+6% YoY from January to August 2024), eFootball 2024 (+90% YoY for the same period), and Garena Free Fire.
- Legend of Mushroom is one of the top performers in revenue growth, earning $11 million in the region from January to August.
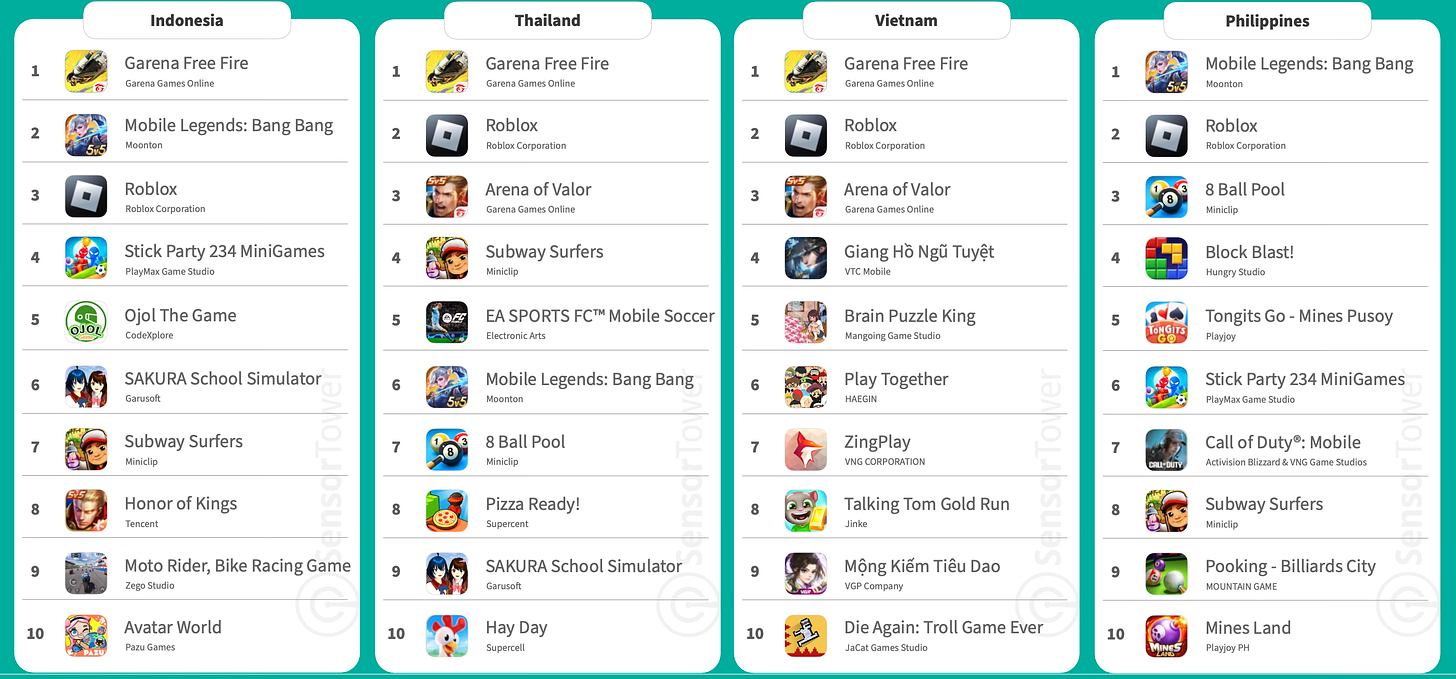
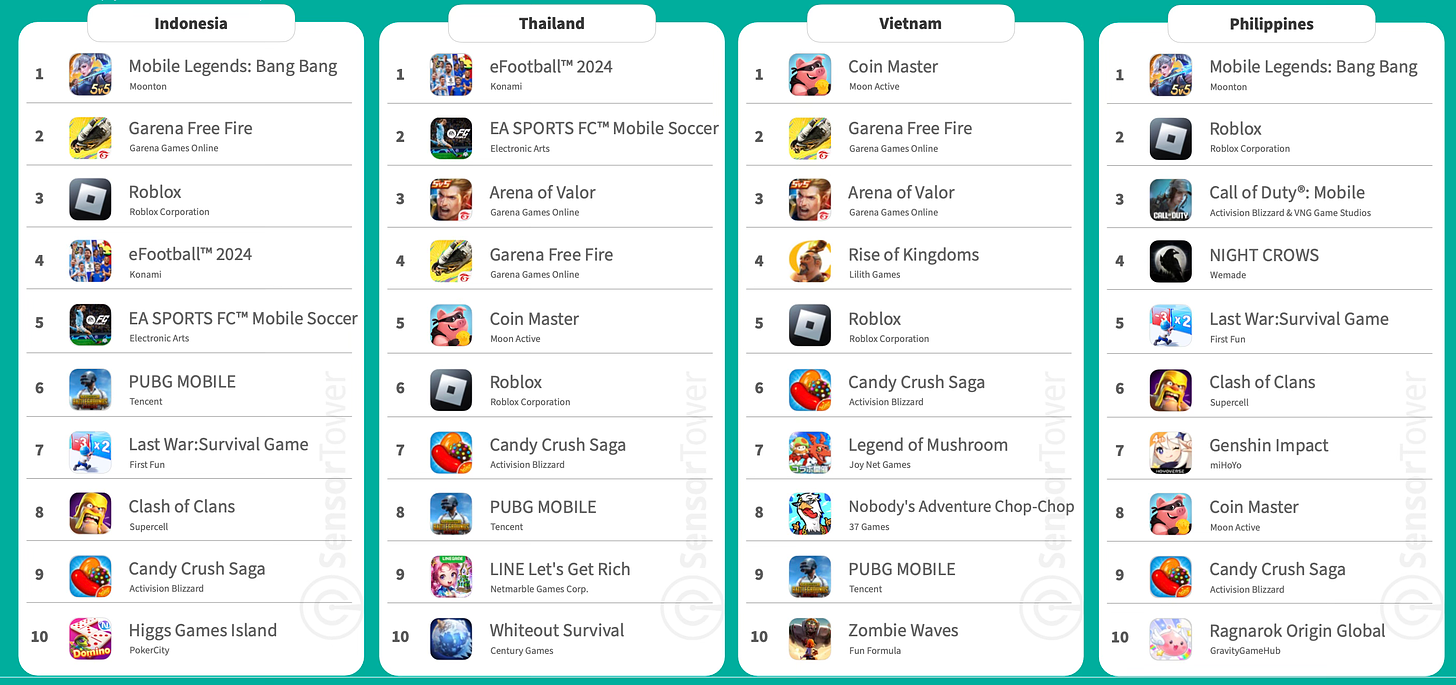
- Examining download and revenue rankings highlights the diversity within Southeast Asia. While shooters and MOBA are popular throughout, there are unique preferences; for instance, Coin Master is a revenue leader in Vietnam, while two MMORPGs dominate in the Philippines.
Case Study: Honor of Kings
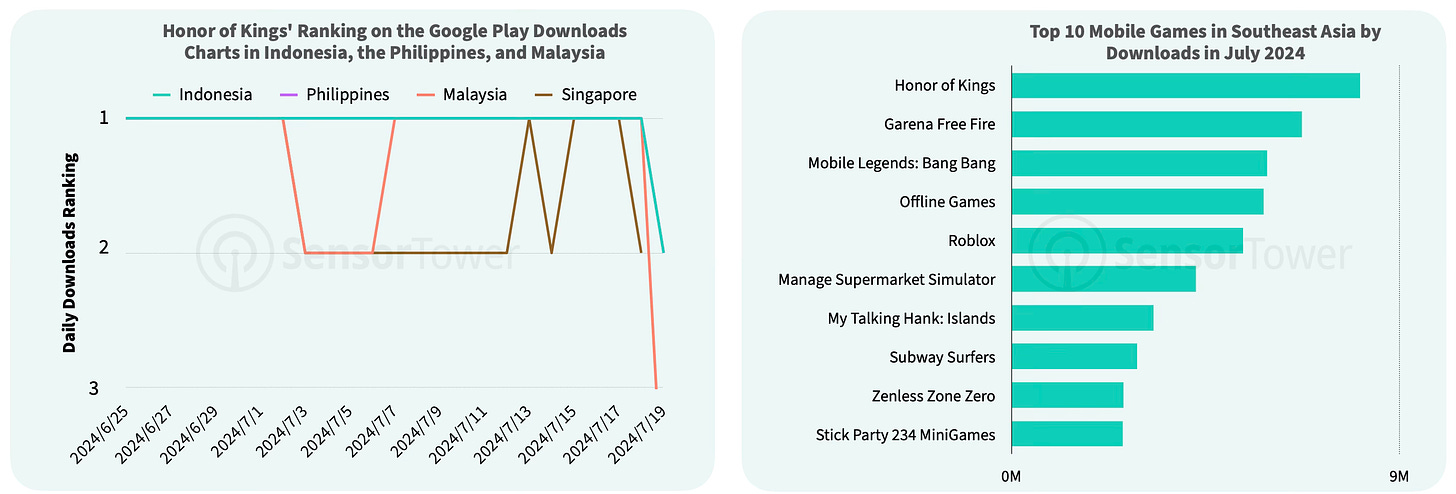
- In mid-June, Honor of Kings launched a renewed push for global expansion, specifically targeting Southeast Asia. By July, it had become the most downloaded game in the region.
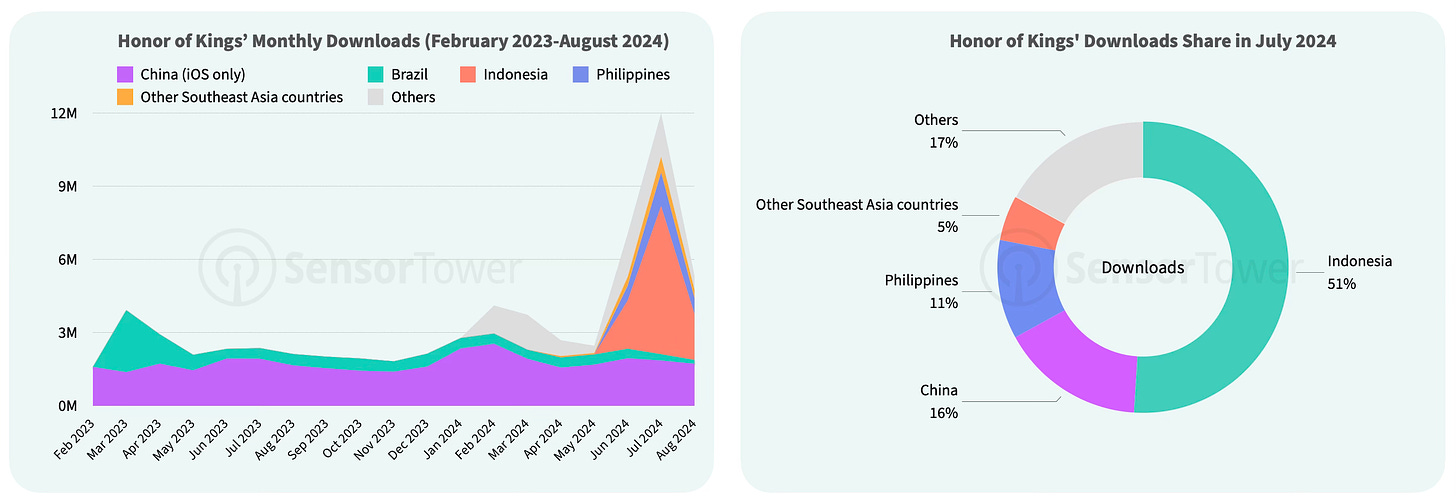
- In July, 51% of the game’s downloads came from Indonesia, with an additional 11% from the Philippines. Marketing materials were localized for the region's countries.
AppMagic: Top Mobile Games by Revenue and Downloads in October 2024
AppMagic provides revenue data after store fees and taxes.
Revenue
- Honor of Kings returned to a stable first place in revenue, earning $152.9 million in October after store fees and taxes. Historically, all revenue came from China, but now it’s 97%, with the second-highest revenue market being the U.S. ($660,000).
- Royal Match had its best month ever, earning $123.9 million. Last War: Survival is third with slightly over $117 million.
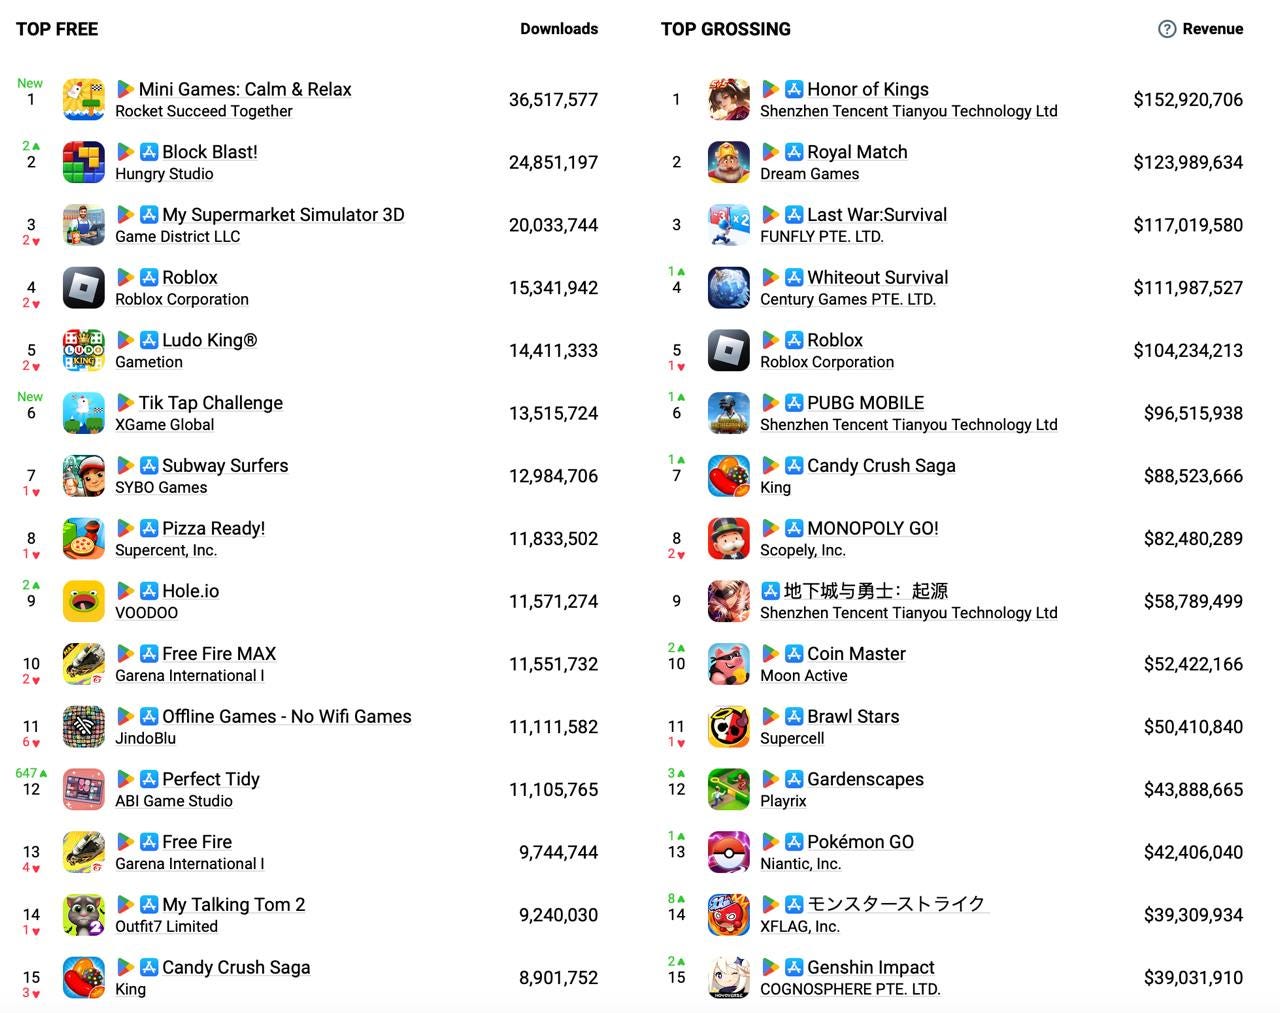
- Interest in MONOPOLY GO! is declining, with the project’s revenue hitting its lowest point since August 2023. It fell to 8th place in the charts.
Downloads
- The new downloads chart leader is Mini Games: Calm & Relax from Vietnamese studio Rocket Succeed Together, with 36.5 million downloads. The game went viral on TikTok. The studio’s previous successful project was Stick Hero: Tower Defense.
- Consistently high in downloads are Block Blast! (24.8 million), My Supermarket Simulator 3D (20 million), and Roblox (15.3 million).
- At 6th place, the Tik Tap Challenge by Pakistan’s XGame Global launched with 13.5 million downloads.
- Perfect Tidy by Vietnam’s ABI Game Studio saw significant growth in downloads, with 11.1 million in October.
SGDA: The Gaming Industry in Slovakia in 2024
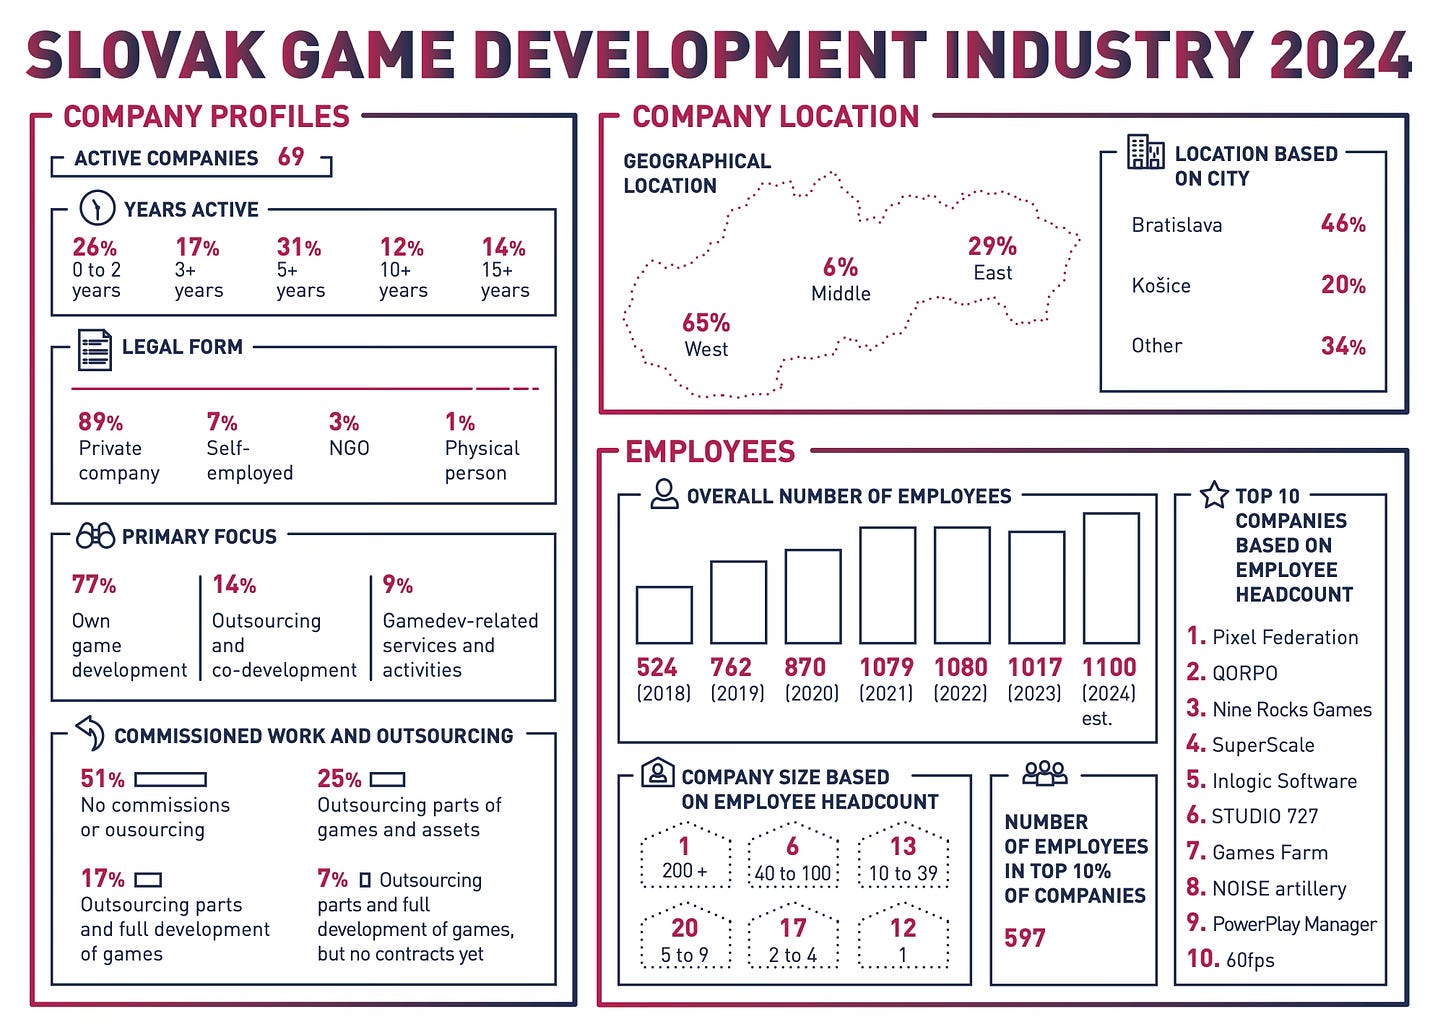
- Revenue for Slovak gaming companies decreased to €70 million in 2023 from €77.1 million in 2022.
- A modest growth is expected in 2024, with revenue projected to reach €70.3 million.
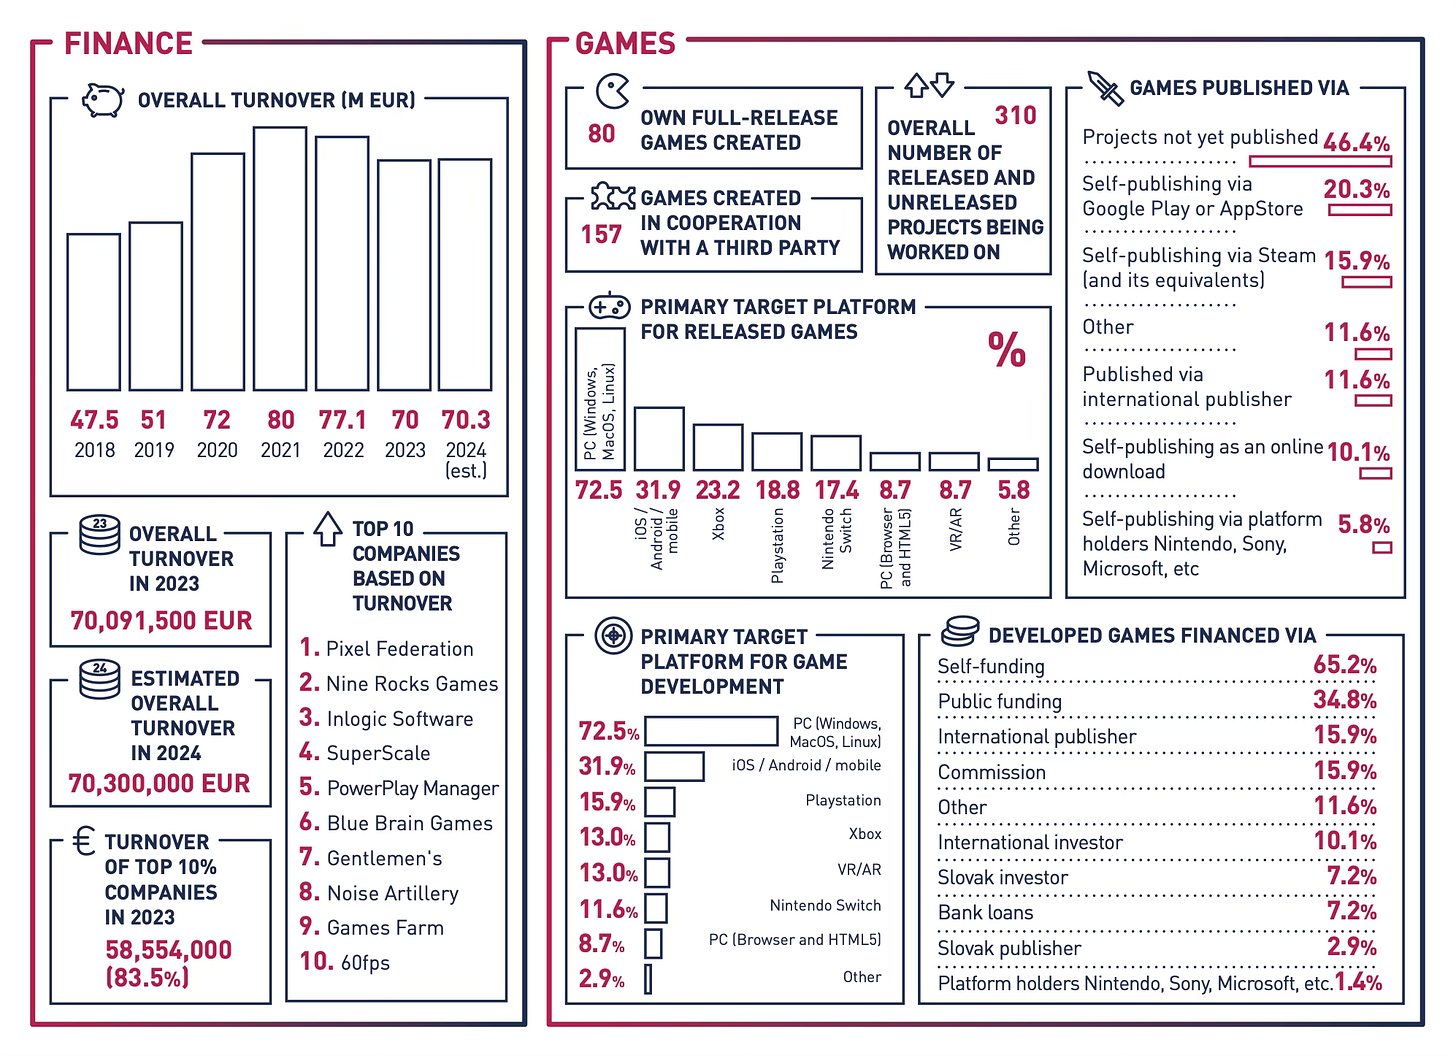
- The number of industry employees also fell from 1,080 in 2022 to 1,017 in 2023, with 69 gaming companies currently operating in the country.
- Women make up 21% of employees. 9% of the workforce are foreigners.
- Among respondents, 30.4% reported the most difficulty in hiring programmers, 15.9% in finding game designers, 14.5% in finding artists, and 13% in locating PR and marketing specialists.
- The top 10 largest Slovak companies account for €58.6 million in revenue, about 83.5% of the country’s total. The largest company is Pixel Federation; significant contributions from QORPO, Nine Rocks Games, Superscale, and STUDIO 727.
- 46% of the country’s gaming companies are based in Bratislava, while 20% are in Košice.
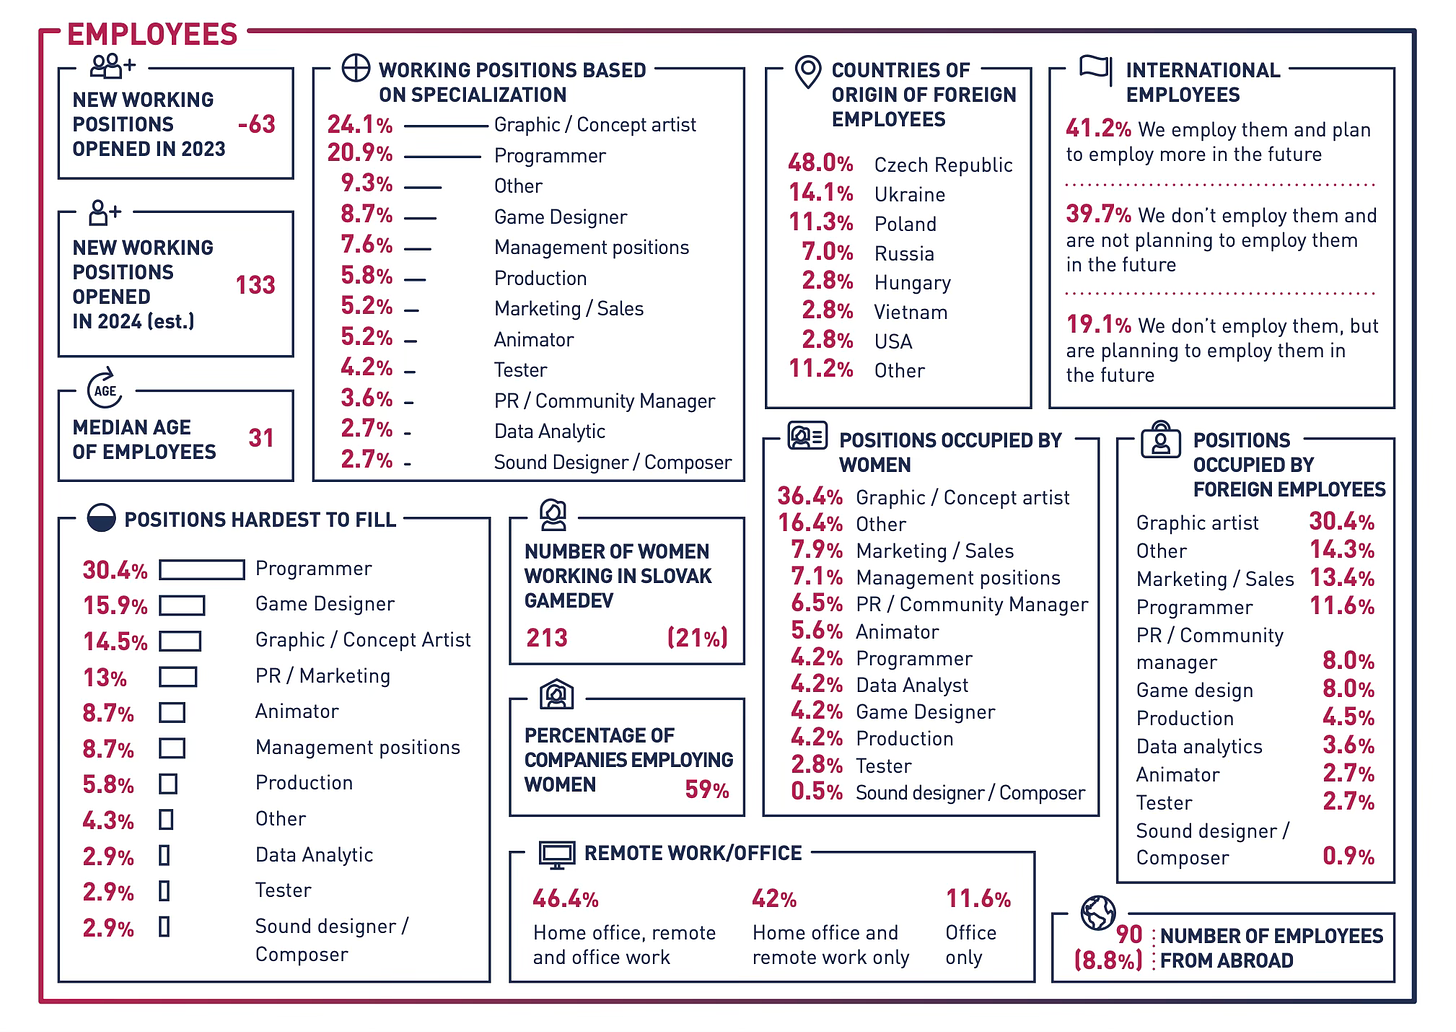
- In 2023, local developers released 80 proprietary games and contributed to 157 external projects.
- Currently, 310 games are in development, with most targeting PC (72.5%), followed by mobile (31.9%). Approximately 23.2% of projects are planned for Xbox and 18.8% for PlayStation.
Ipsos & Video Games Europe: How children spend money in Games in 2024
Ipsos conducted a survey of 2,772 parents or guardians on the topic of children’s spending on games, focusing on Europe.
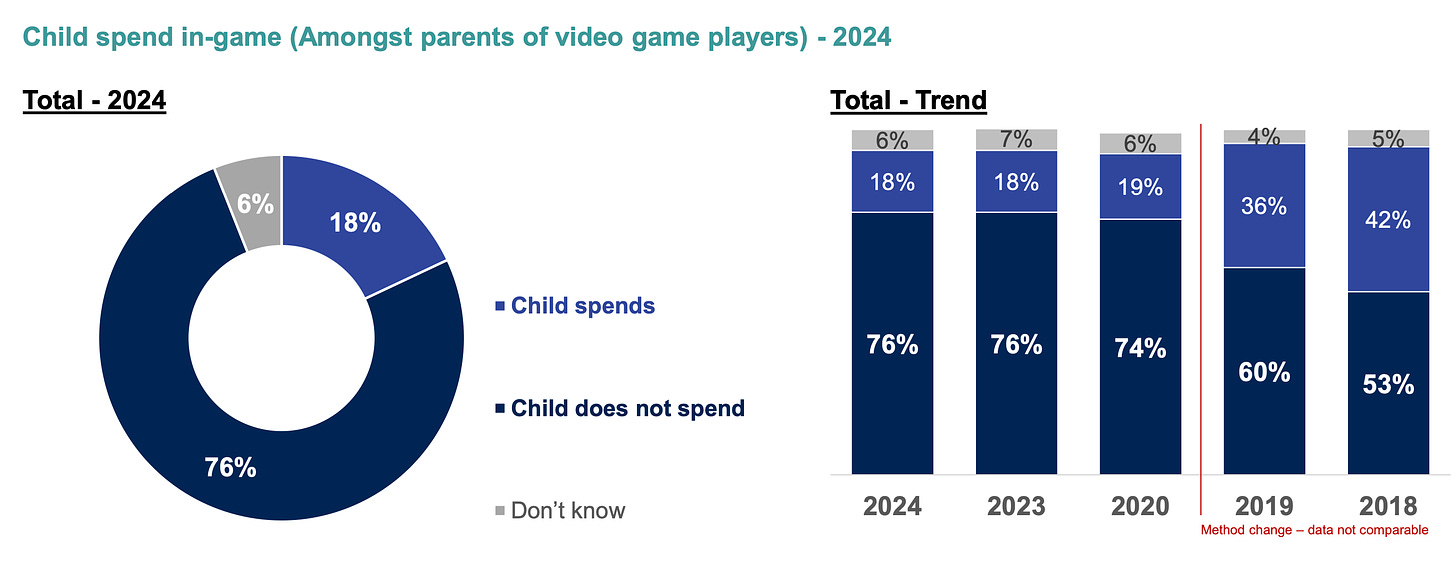
- As of 2023, 76% of parents reported that their children do not make in-game purchases. 18% know that their children make purchases, and 6% do not monitor this aspect.
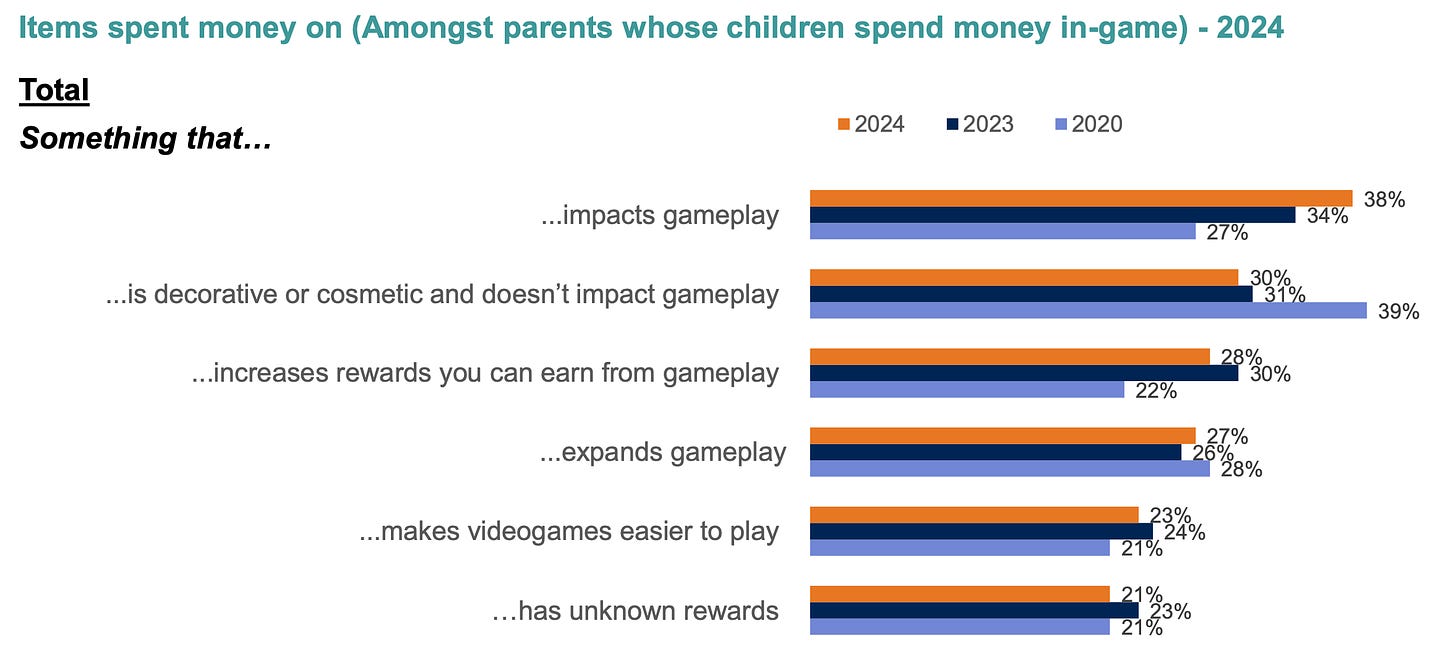
- The most popular purchases, at 38%, are items that directly impact gameplay, making this the top category of purchases. Following this are cosmetic items, which account for 30%. Loot boxes, under regulatory scrutiny in many countries, are less popular.
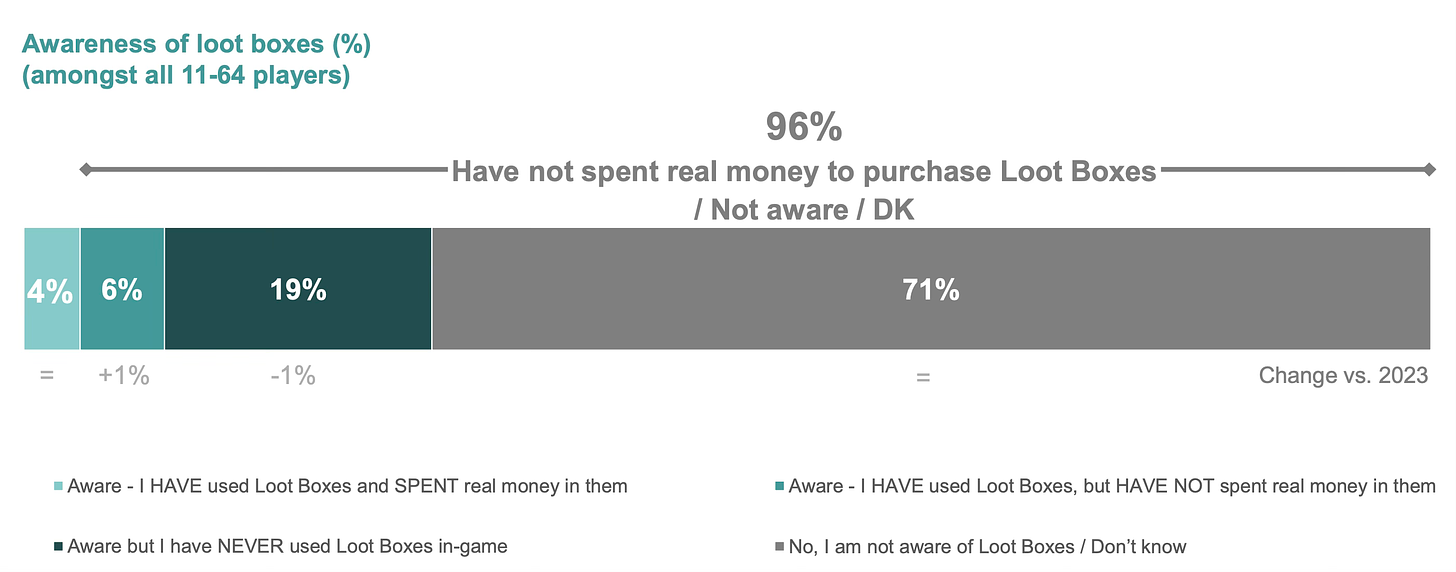
❗️There is a methodological question here: some parents may not realize that items affecting gameplay or cosmetic items are often sold through loot boxes. This is supported by the fact that 71% of respondents are unaware of loot boxes.
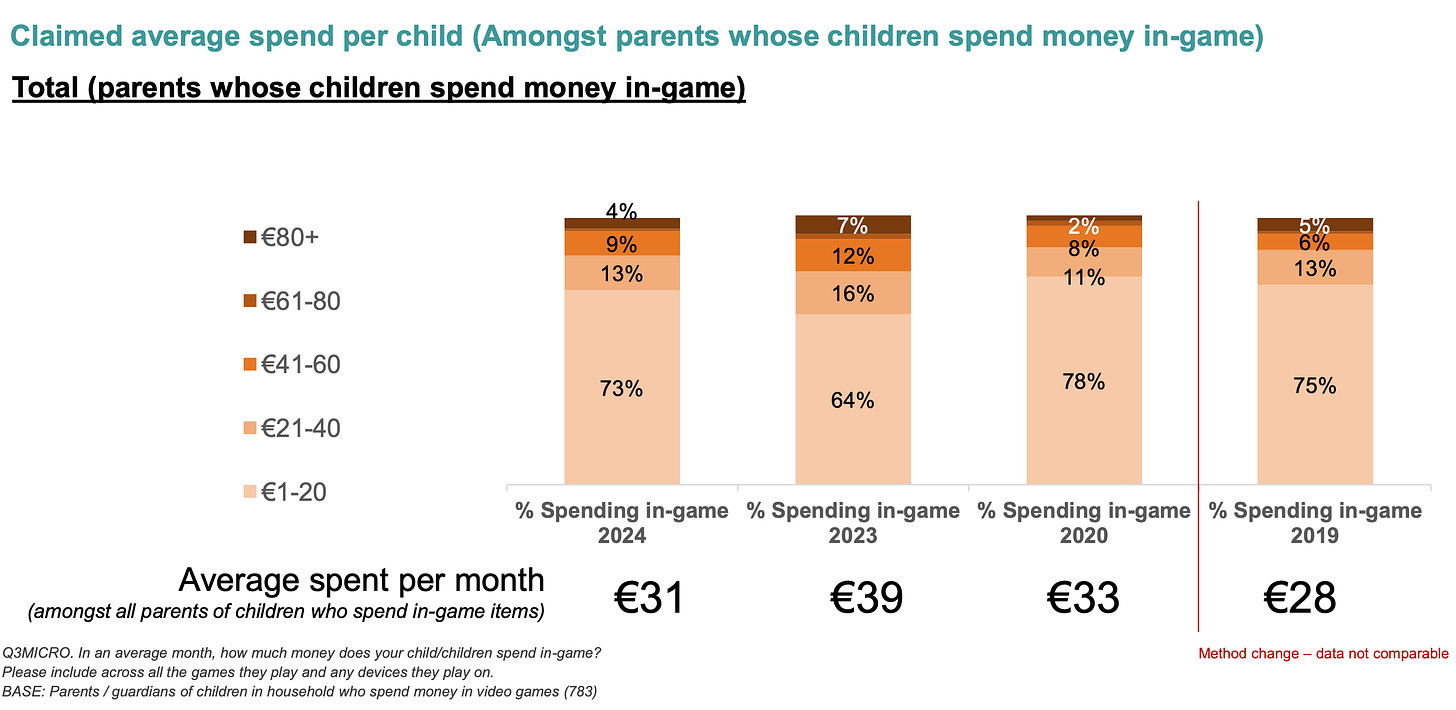
- Parental spending on children’s in-game purchases has dropped to €31 per month, down from €39 the previous year. The study did not investigate the reasons behind this decrease.
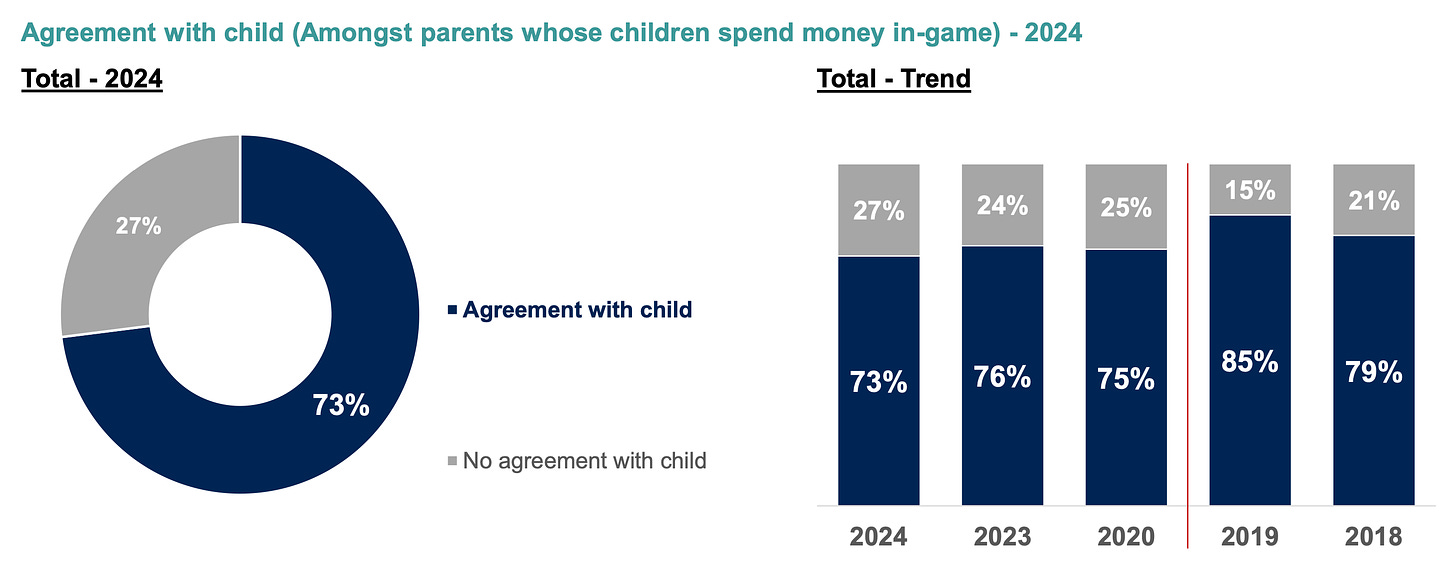
- The percentage of parents with an agreement with their children regarding in-game spending has slightly decreased from 76% in 2023 to 73% in 2024.
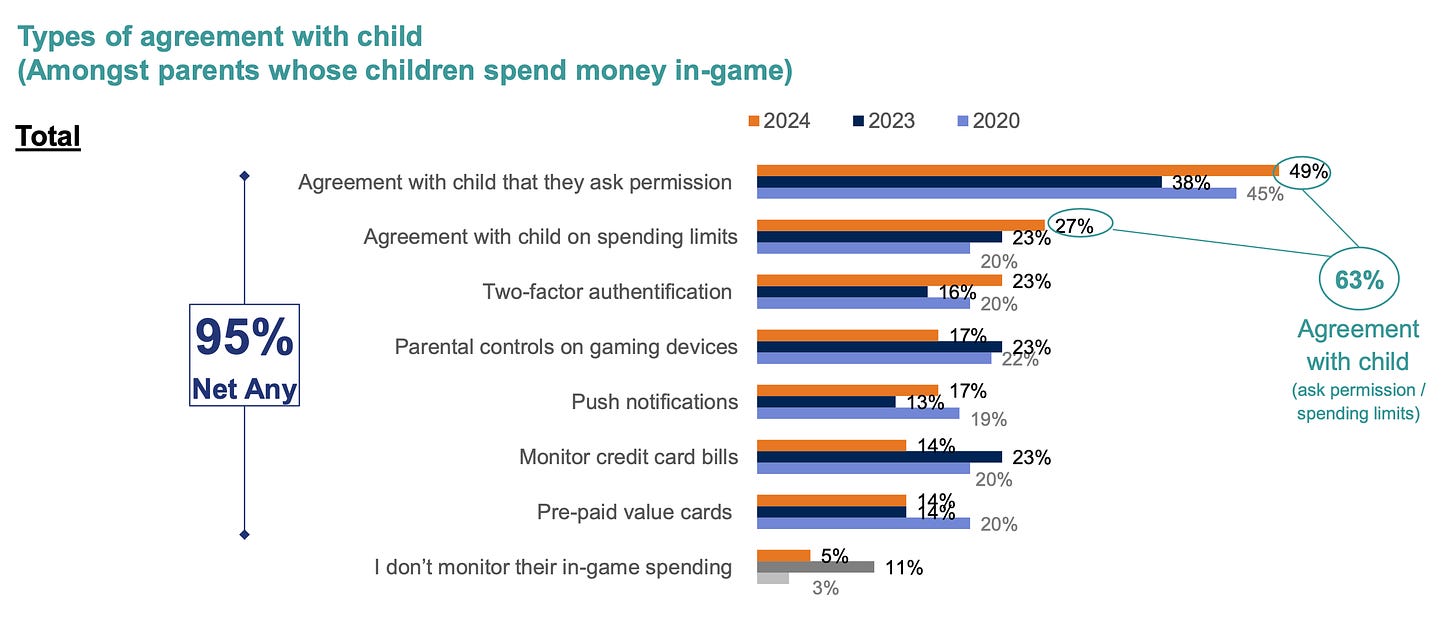
- 95% of parents actively monitor how their child spends money on games.
Circana: Gamers in the U.S. in 2024
The company surveyed 5,100 active gamers in the U.S., aged two and older. For minors between 2 and 10, parents or guardians responded with assistance from the children. Gamers were defined as individuals who had played on any device in the past month, with the survey conducted in May–June this year.
- 71% of U.S. residents play games, a decline from 74% in 2020 but still higher than 67% in 2018.
- There are a total of 236.4 million players in the country.
- On average, gamers spend 14.5 hours per week playing, an increase of 1.8 hours from 2022, with more time dedicated to mobile and console gaming.
- People over 45 represent the largest gaming demographic in the U.S., accounting for 37% of all players. This segment has the highest proportion of women and a growing interest in console gaming. Although engagement has decreased, spending in this group remains on the rise.
- Generation Alpha (ages 2 to 12) is playing games less than before, down 6% from 2022. However, Circana analysts note that this group remains highly valuable in terms of both engagement and spending.

- 65% of the population plays on mobile devices (unchanged from 2022); 36% play on PCs (a decrease of 4% from 2022); 35% play on consoles (unchanged from 2022); and 13% play on other devices, such as VR or handheld systems, which have increased by 2% since 2022.
- Among active gamers, 92% play mobile games; 51% play on PCs; and 50% play on consoles.
- 16% of all U.S. gamers are “super gamers,” totaling 38.3 million (up from 36 million in 2022). This highly active group, primarily aged 13 to 34, plays on the largest number of platforms and spends the most money.
- The average American gamer spent $56.20 on games in the past six months, although 46% of gamers made no purchases during this period.
AppMagic & MY.GAMES: 4X Strategies in 2024

Market Overview
- By the end of 2023, 4X games earned $5.8 billion after store commissions and taxes. This represents 10.2% of the total volume.
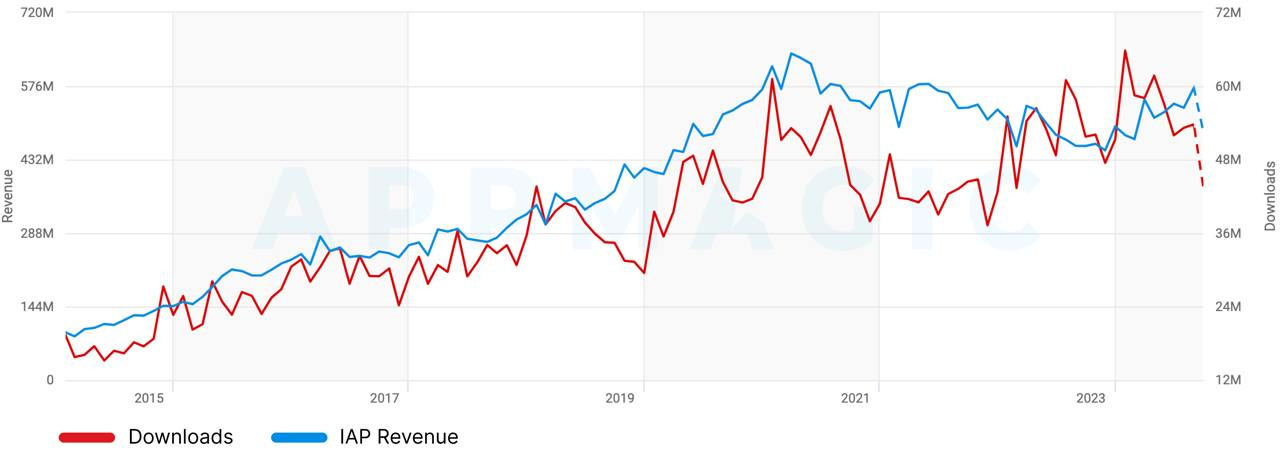
- 4X strategies were downloaded 632 million times in the same year. The Revenue per Download (RPD) was $9.2.
- As of September 2024, two 4X strategies are in the top 5 by revenue - Last War: Survival ($105 million in September) and Whiteout Survival ($90 million in September).
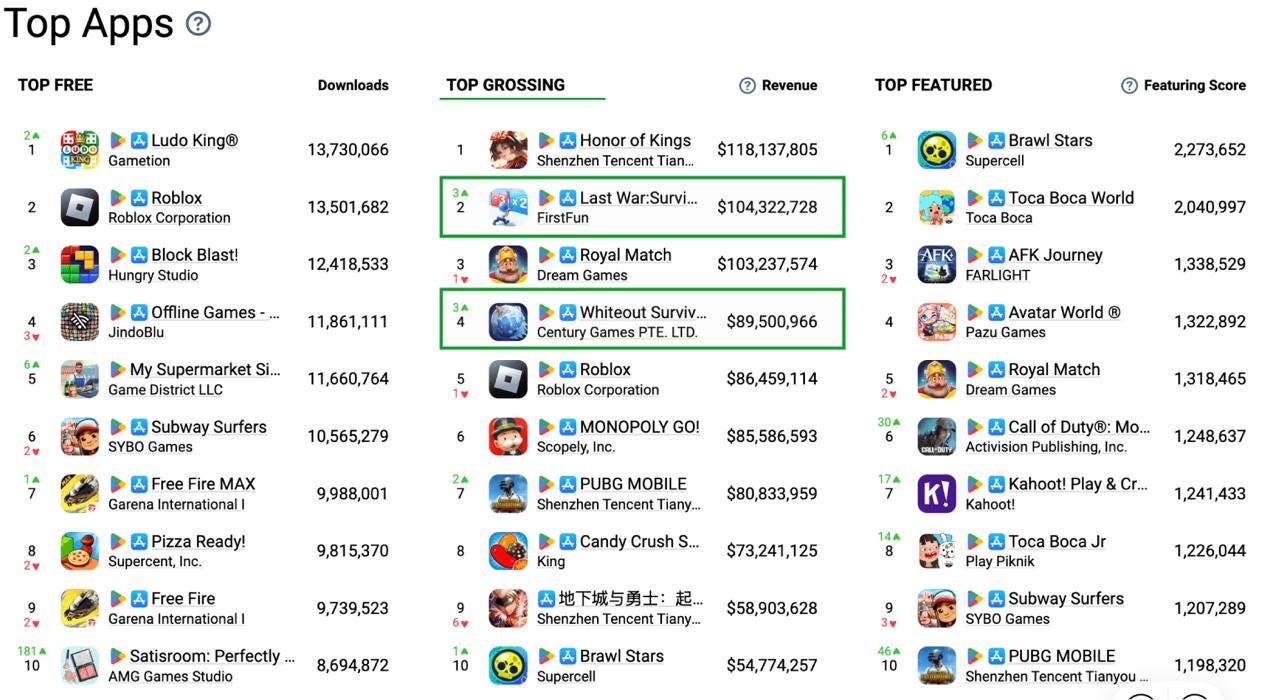
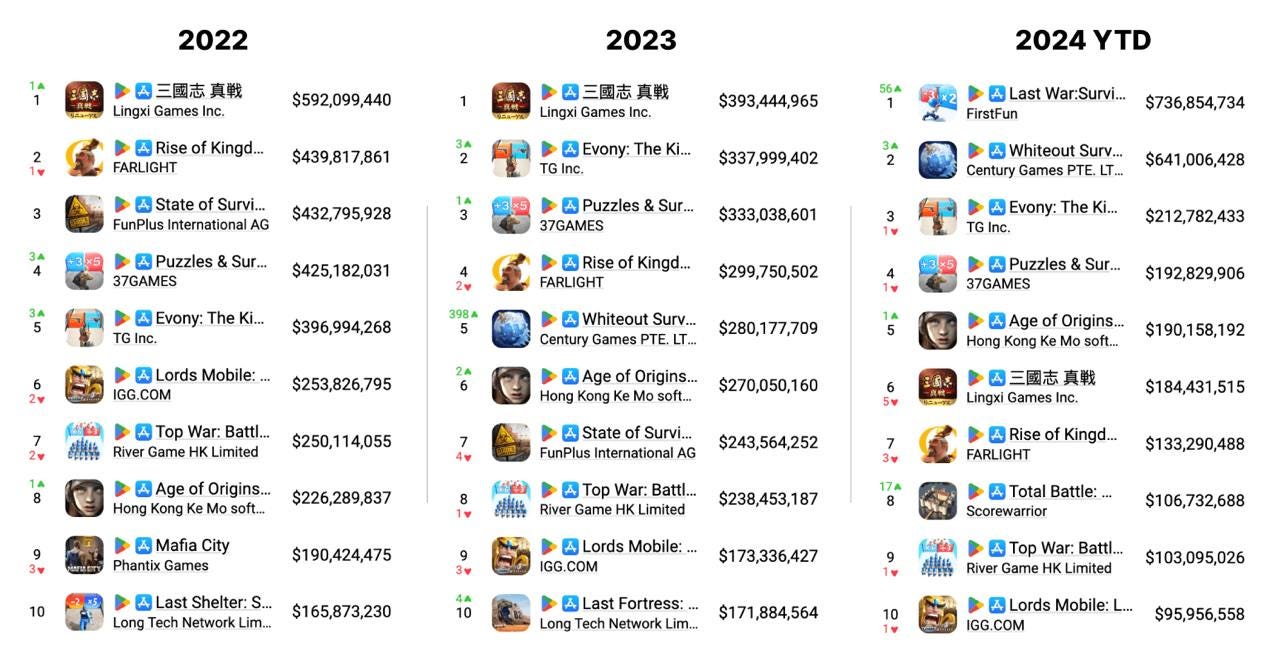
- AppMagic and MY.GAMES analysts specifically note that the 4X strategy market is dynamic. Firstly, there is constant rotation in the top 10 by revenue. Secondly, in the first 3 quarters of 2024, 58% of revenue came from games outside the top 5.
- The genre, however, is not without its problems. The main issues are long development times, high CPIs, and difficulty in user retention.
Changes in 4X Strategies in Recent Years
- Projects have started choosing more popular settings more often. There are more games in zombie and post-apocalyptic settings.
- Developers have updated their approach to visual style. The graphics have become more casual, and the UI/UX has been simplified.

- There’s a greater focus on the female audience. This is manifested in adding social mechanics, customization, and less focus on violence.
- Casualization. Hypercasual and casual mechanics are used in UA and FTUE to make the player onboarding process easier.
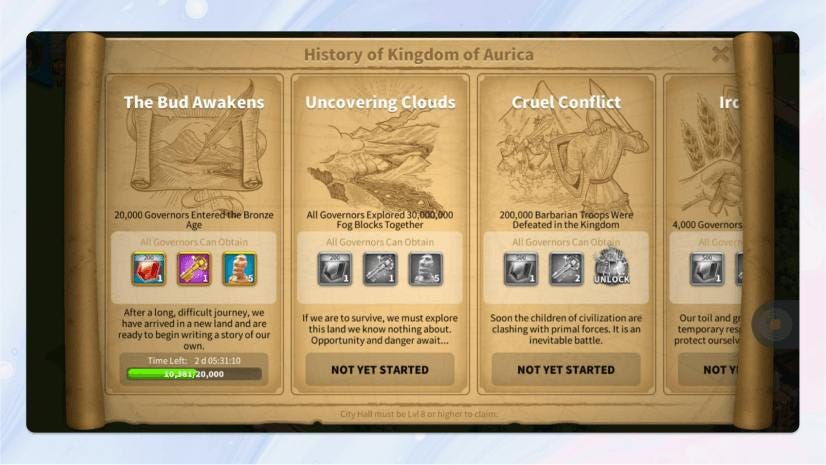
The authors of the material highlight 7 signs of a more casual approach:
- Simplification of combat mechanics - less focus on individual units, and more on the overall strength of the army.
- Reduced focus on PvP and minimizing punishment for attacks by other players.
- Clear goal-setting for users - the player is guided step by step.
- Accelerated dynamics - manifested, for example, in the speed of marches.
- Greater focus on socialization. To the extent that in Last War: Survival, a message is automatically written for a new alliance member.
- Moving away from serious tones to casual graphics. The trend started with Lords Mobile and Rise of Kingdoms; now it’s harder to find a 4X strategy with a serious visual style.
- Greater focus on personalization.
SocialPeta: Mobile gaming marketing trends in Southeast Asia in 2024

- The number of active advertisers increased by 9.5% in 2024 compared to the previous year.
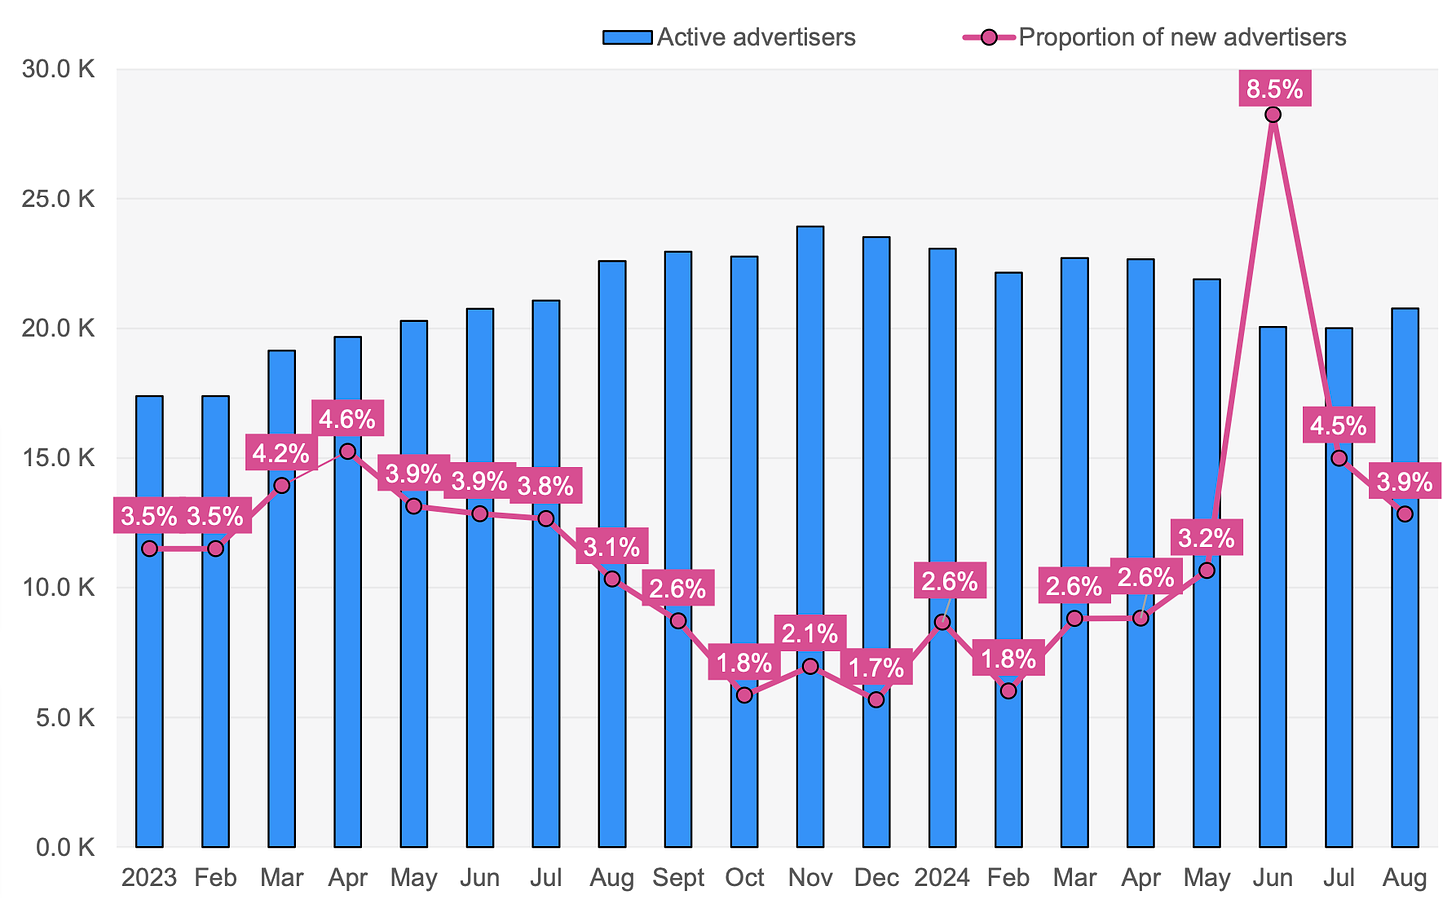
- 63.8% of advertisers in 2024 released new creatives every month. This is 0.8% less than the year before.
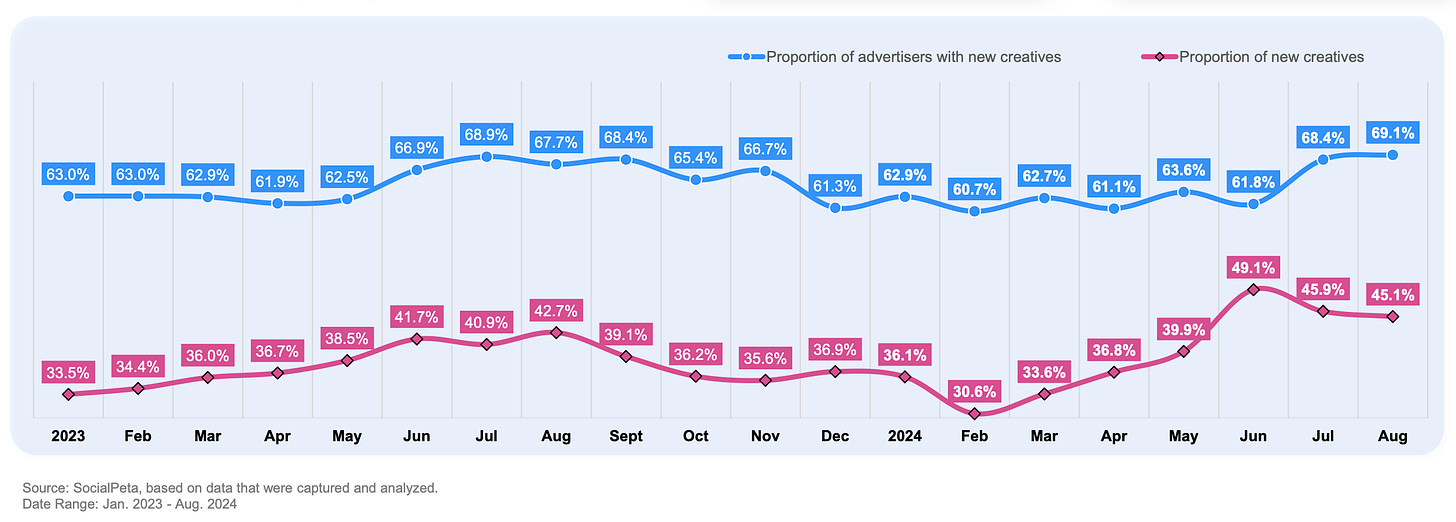
- The average monthly share of new creatives is 39.6%. This is 1.5% more than the previous year.
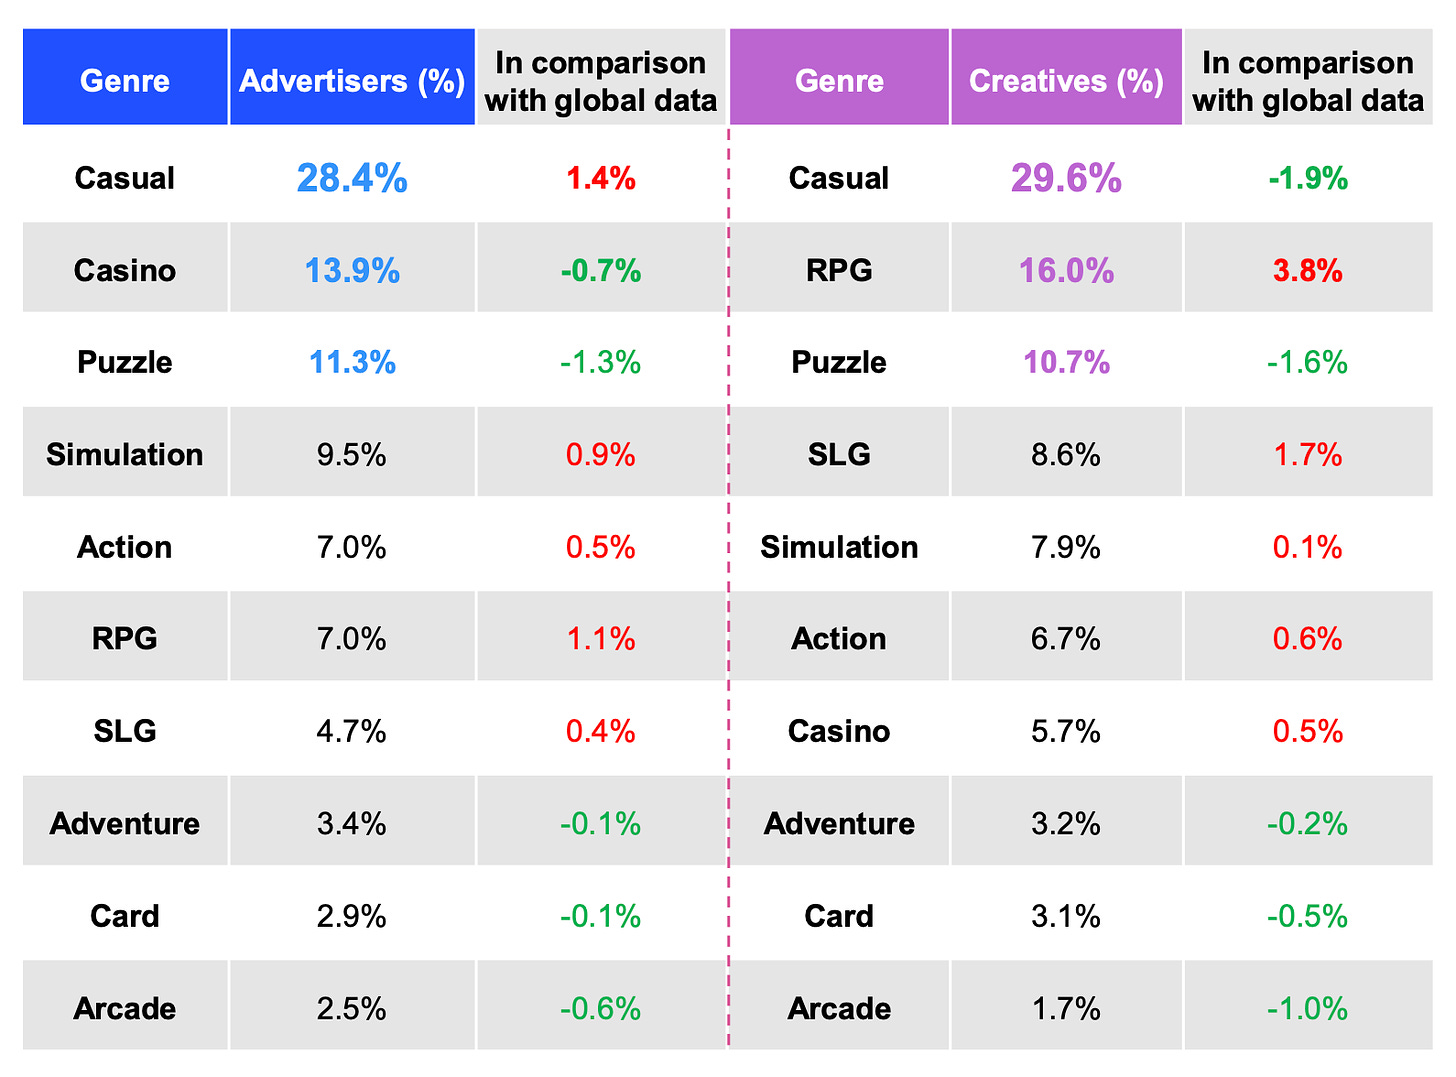
- The largest number of advertisers in the Southeast Asian market are in casual games (28.4%), casino (13.9%), and puzzles (11.3%). The fastest-growing categories in terms of advertisers are casual games (+1.4% YoY) and RPG (+1.1% YoY). Most creatives are for casual games (29.6%), RPG (16%), and puzzles (10.7%). The highest growth is shown by RPG (+3.8% YoY) and SLG (+1.7%).
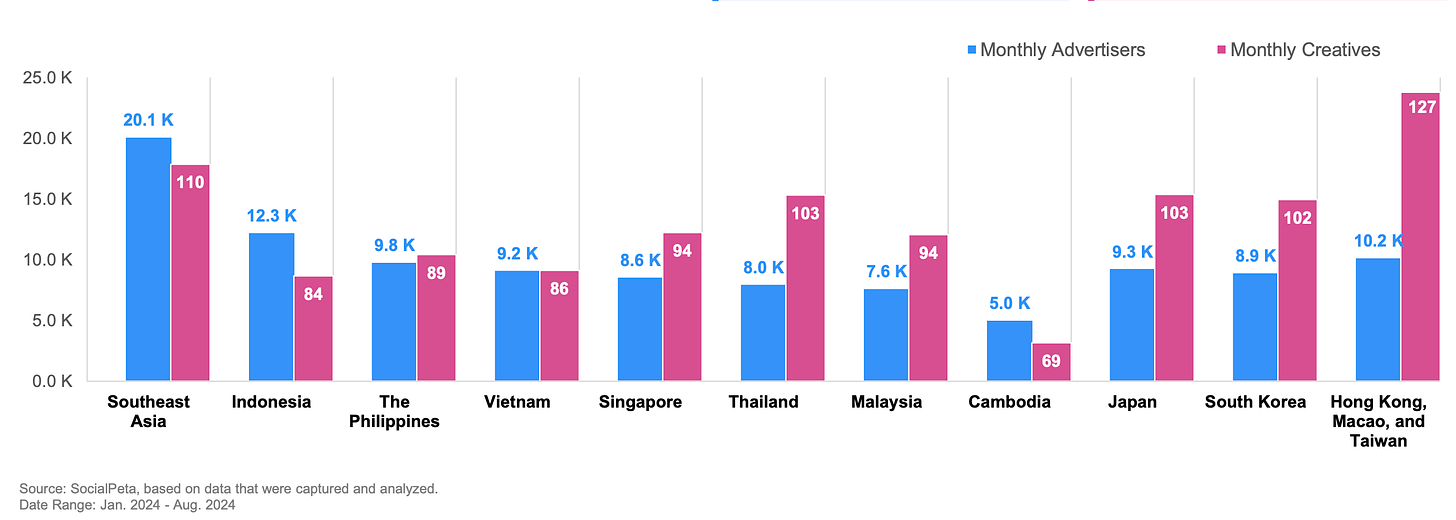
- The largest number of advertisers are in Indonesia, the Philippines, and Vietnam. The highest average monthly number of creatives is in Thailand, Singapore, and Malaysia.
- 75.5% of advertisers are on Android; significantly fewer on iOS - 24.5%. In some countries (Indonesia), the share of iOS advertisers has fallen below 20%.
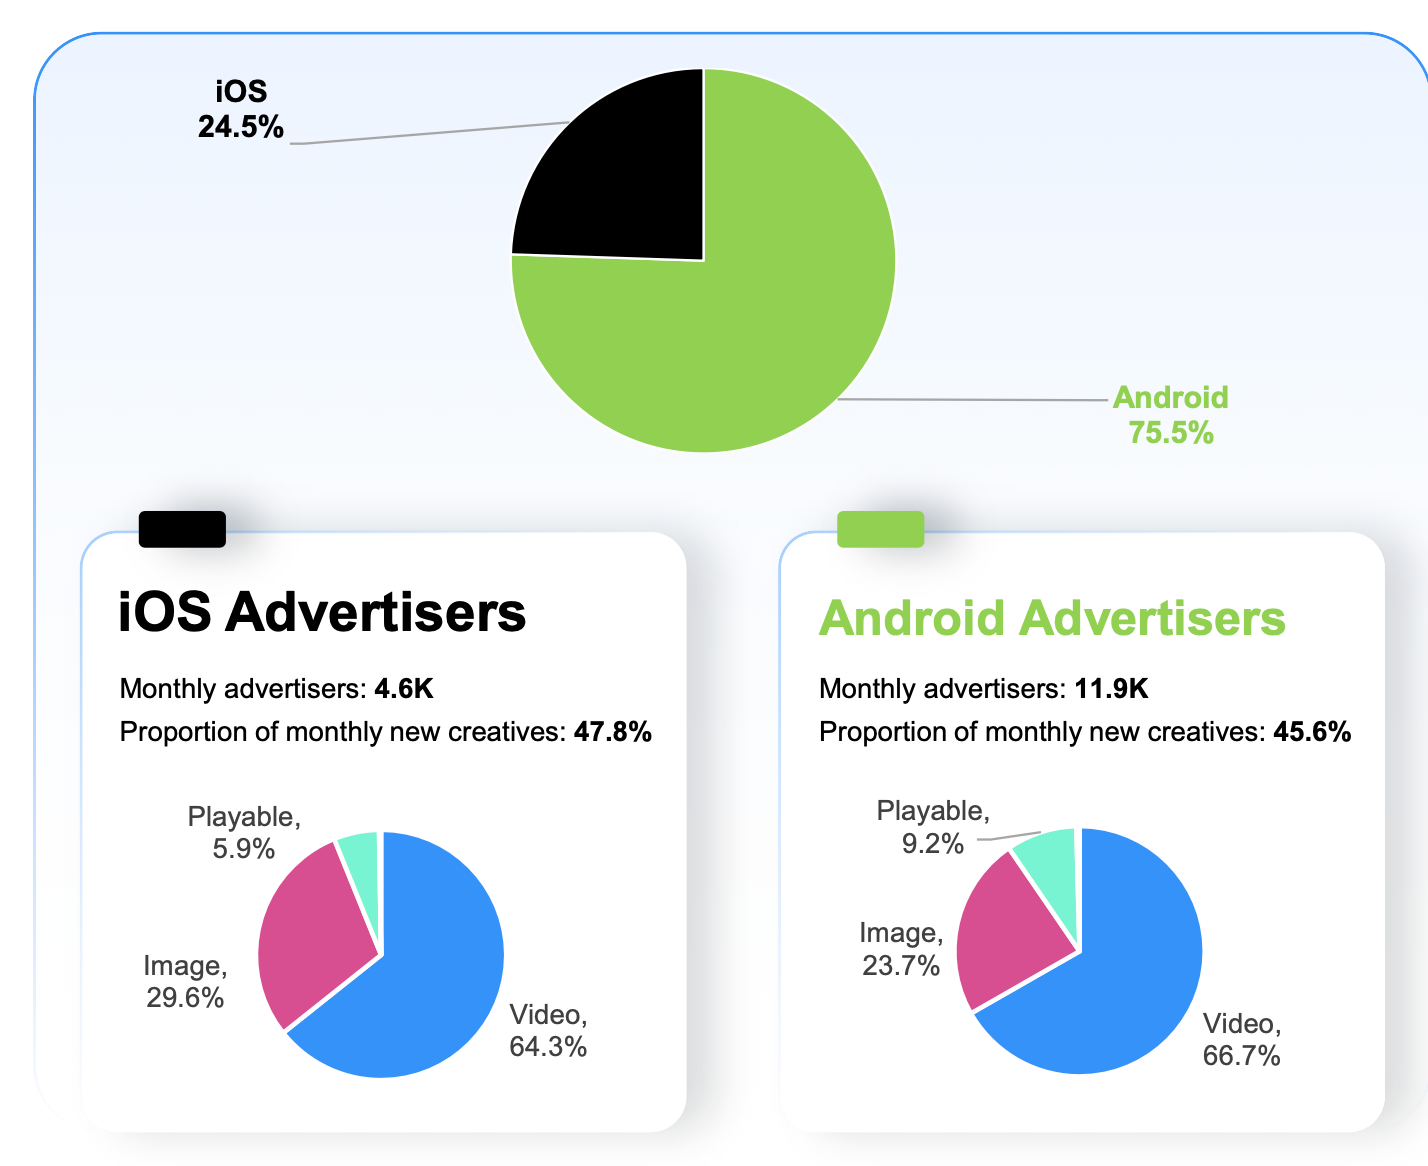
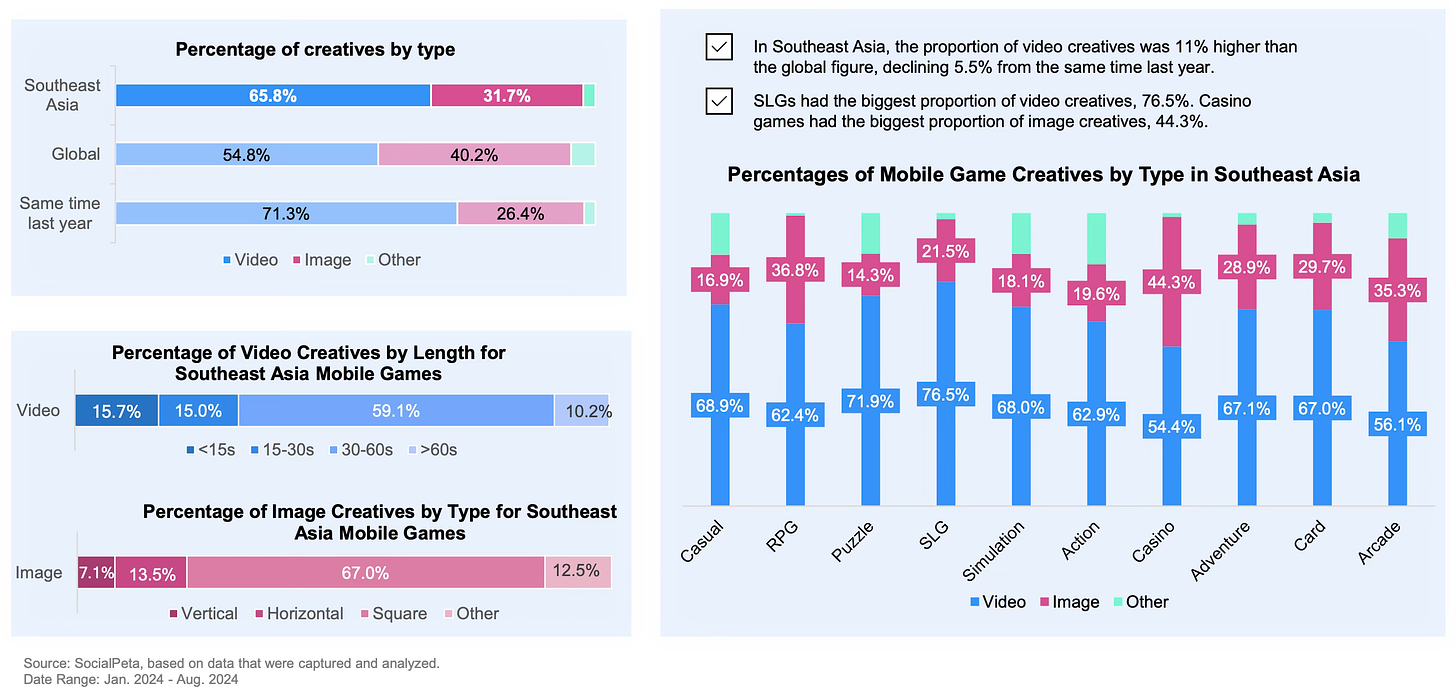
- 65.8% of creatives in the region are video; 31.7% are static images. Compared to the world, the popularity of video creatives in Southeast Asia is higher.
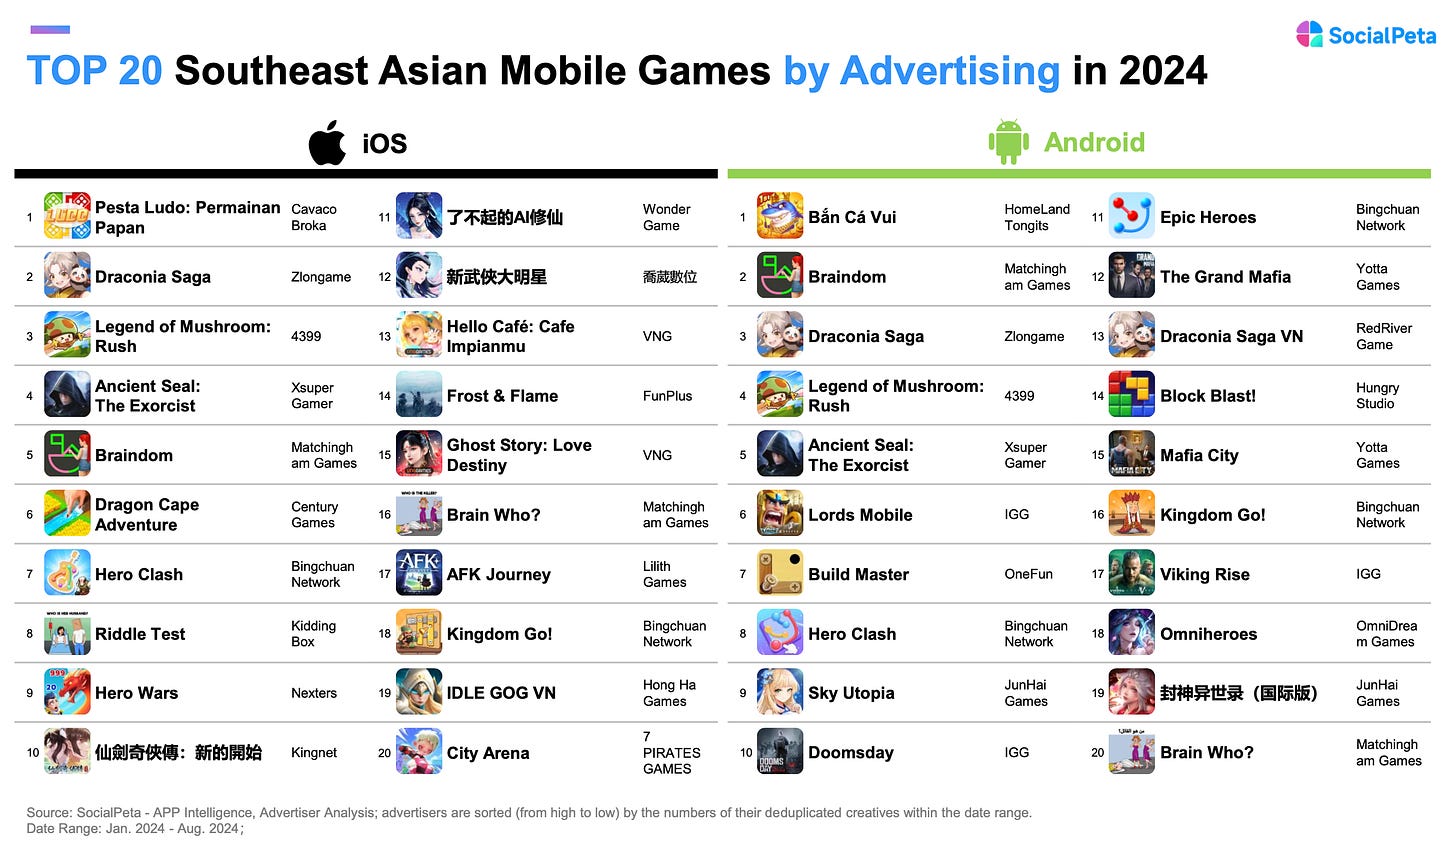
- The leaders in advertising activity on iOS are Pesta Ludo: Permainan Papan; Draconia Saga and Legend of Mushroom. On Android - Bắn Cá Vui, Braindom and Draconia Saga.
- In creatives, companies actively use AI; make references or collaborations with IP; use mini-games; show gameplay with comments from real people or actors. The use of cosplayers is also popular.
Chinese gaming market sets revenue record in Q3'24

The state-affiliated Gaming Publishing Committee of the China Audio-Video and Digital Publishing Association reported on the success.
- Gaming market revenue in Q3’24 in China reached $12.9 billion (91.8 billion yuan). This is 8.95% more than in Q3’23.
- $10.2 billion in Q3’24 was earned by games made by Chinese developers.
- Mobile games earned $9.24 billion - +1.2% YoY.
- The growth is associated with the release of Black Myth: Wukong, which gained wide popularity in the country.
- Chinese developers in Q3’24 earned $5.17 billion in foreign markets. Thanks to Black Myth: Wukong, this figure grew by 21% YoY.
Unity: User preferences during Holiday season in the USA

The company surveyed 4,094 people in the US over 18 years old. I’m publishing only the part related to games.
- 44% of respondents noted that games help relieve stress associated with the holiday season.
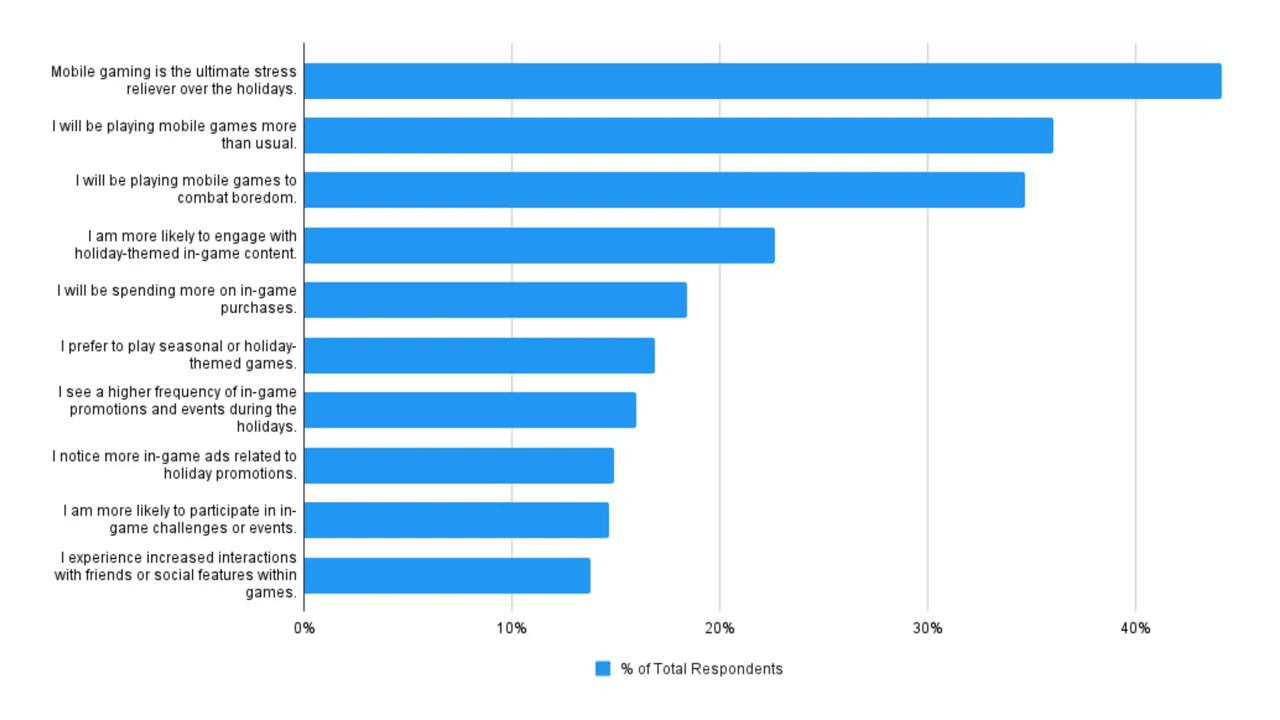
- 35% of users indicated that they will play mobile games during the holidays to avoid boredom.
- The younger the person, the more likely they are to play more during the holiday season. 37% of Generation Z representatives stated plans to play more. Among baby boomers, this figure is 12%.
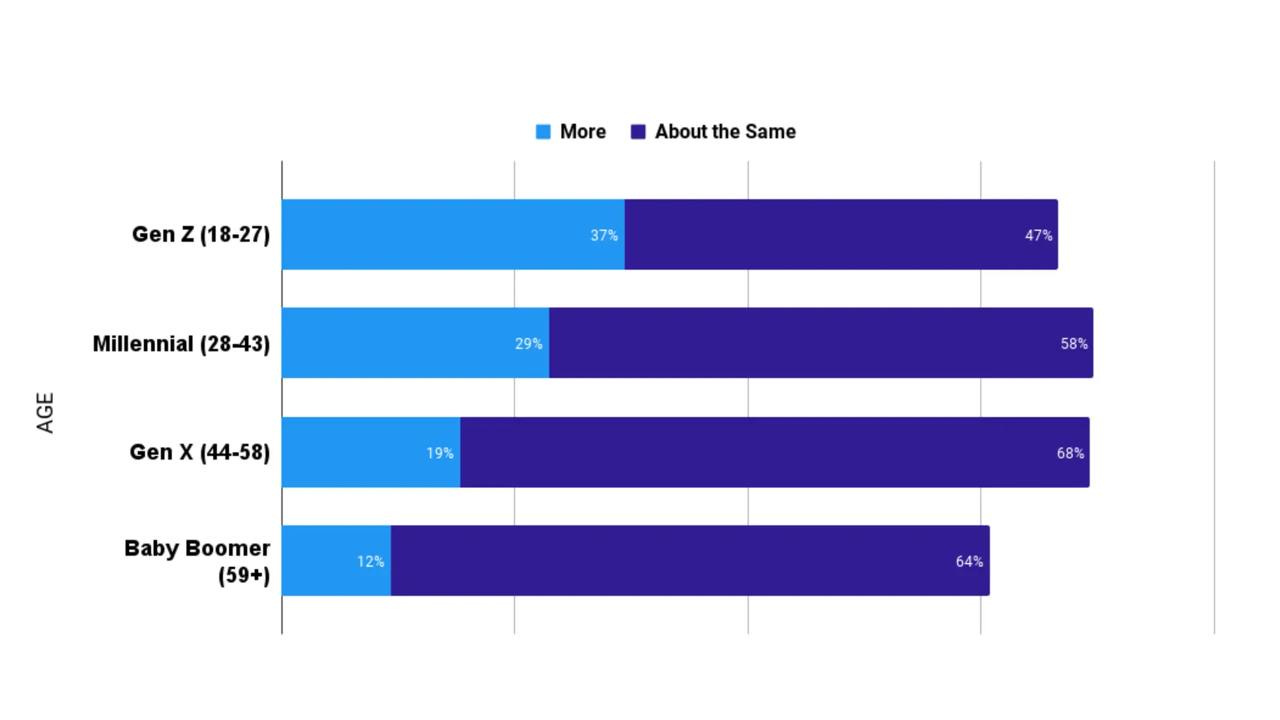
- 33% of Generation Z; 44% of millennials; 46% of Generation X and 37% of baby boomers indicated that they will play 3 or more hours during the holiday season.
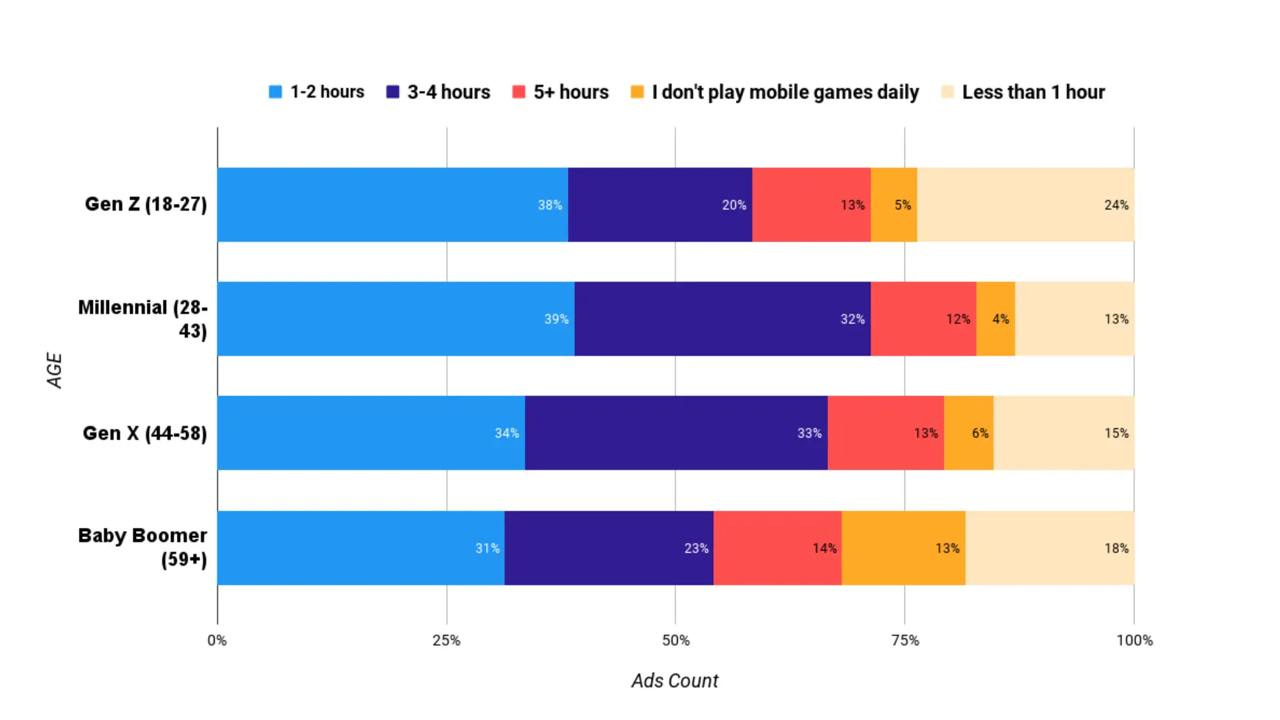
- 18% of respondents noted that they plan to make more purchases during the holiday season.
Moloco: Mobile market status and Growth opportunities in 2024
The company collected data on user acquisition for over 4,000 mobile games in 195 countries from September 2023 to September 2024. The study does not include spending in mainland China.
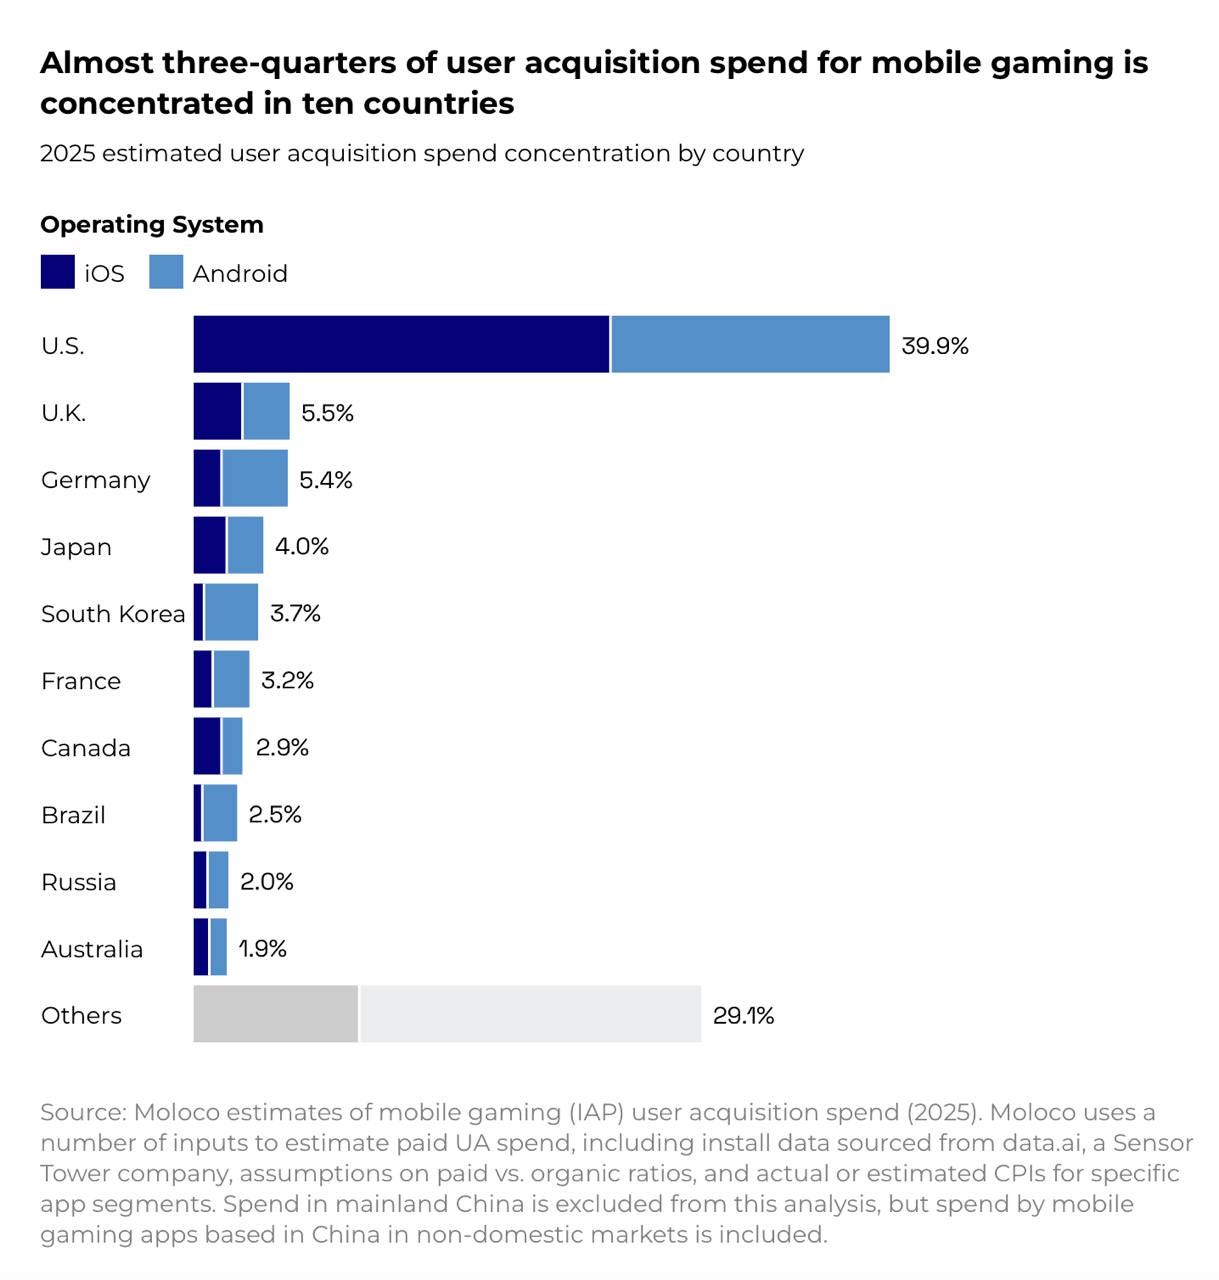
- Gaming companies are expected to spend $29 billion on UA in 2025.
- 71% of this volume will be concentrated in 10 countries. 39.8% of all spending will be in the USA.
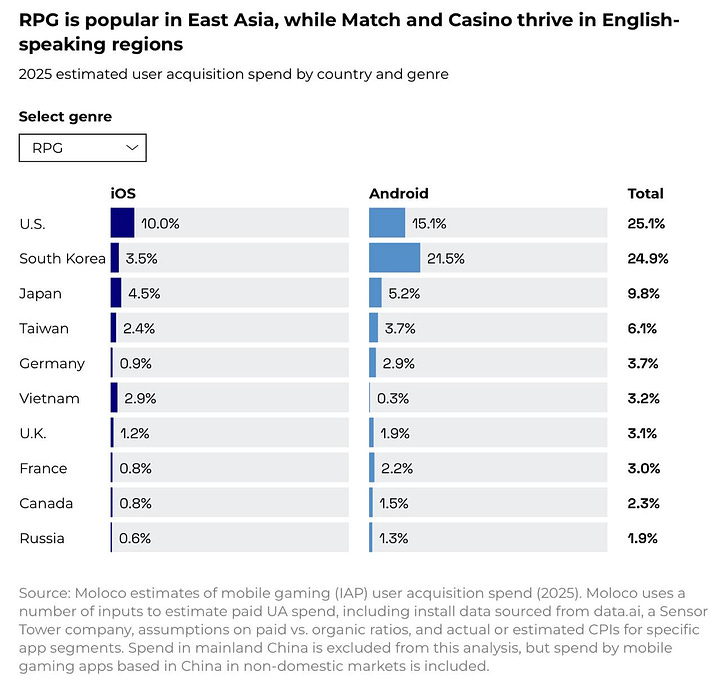
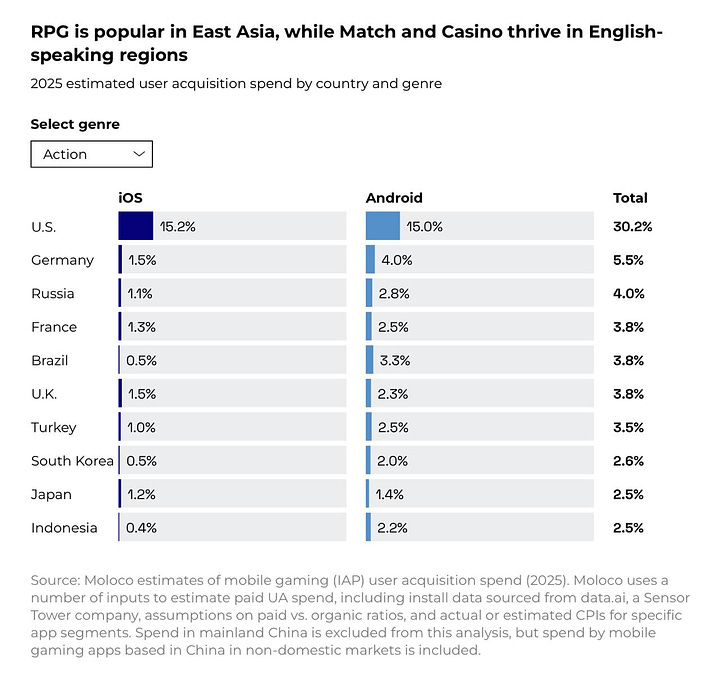
- Region’s revenue is highly dependent on genre. For example, 65.5% of casino user acquisition is in the USA. However for RPGs, the USA accounts for 25.1%, while South Korea accounts for 24.9%.
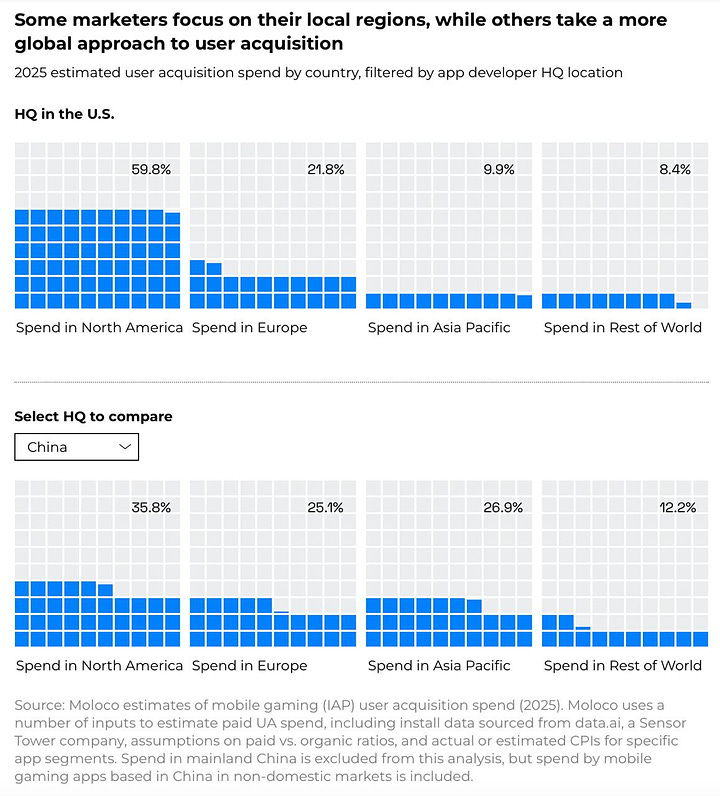
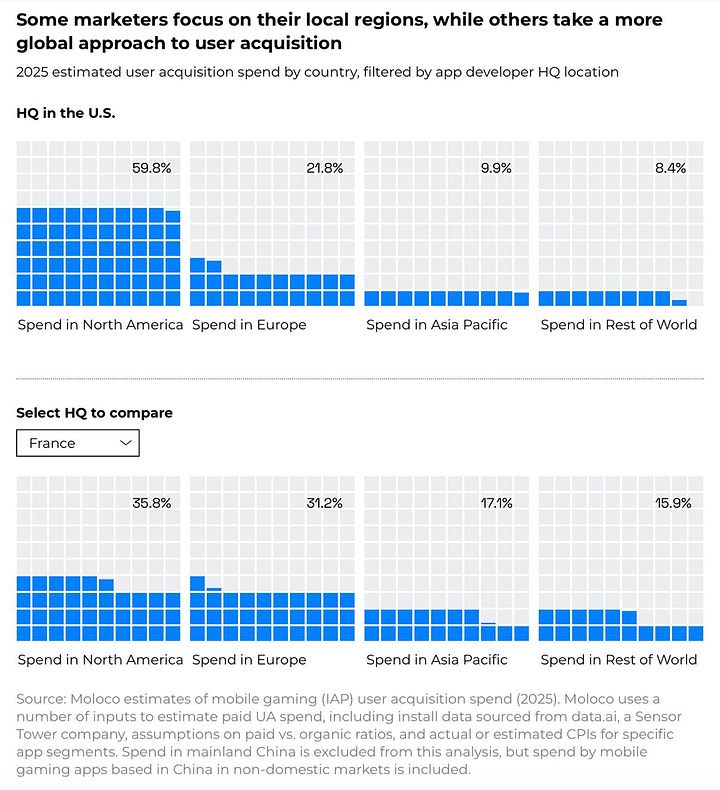
- Moloco notes an interesting trend - companies spend more money on local or culturally close markets. For instance, American companies spend most of their budget on Western markets (81.6% of the total volume). Chinese companies spend almost 3 times more on Asian markets than American companies.
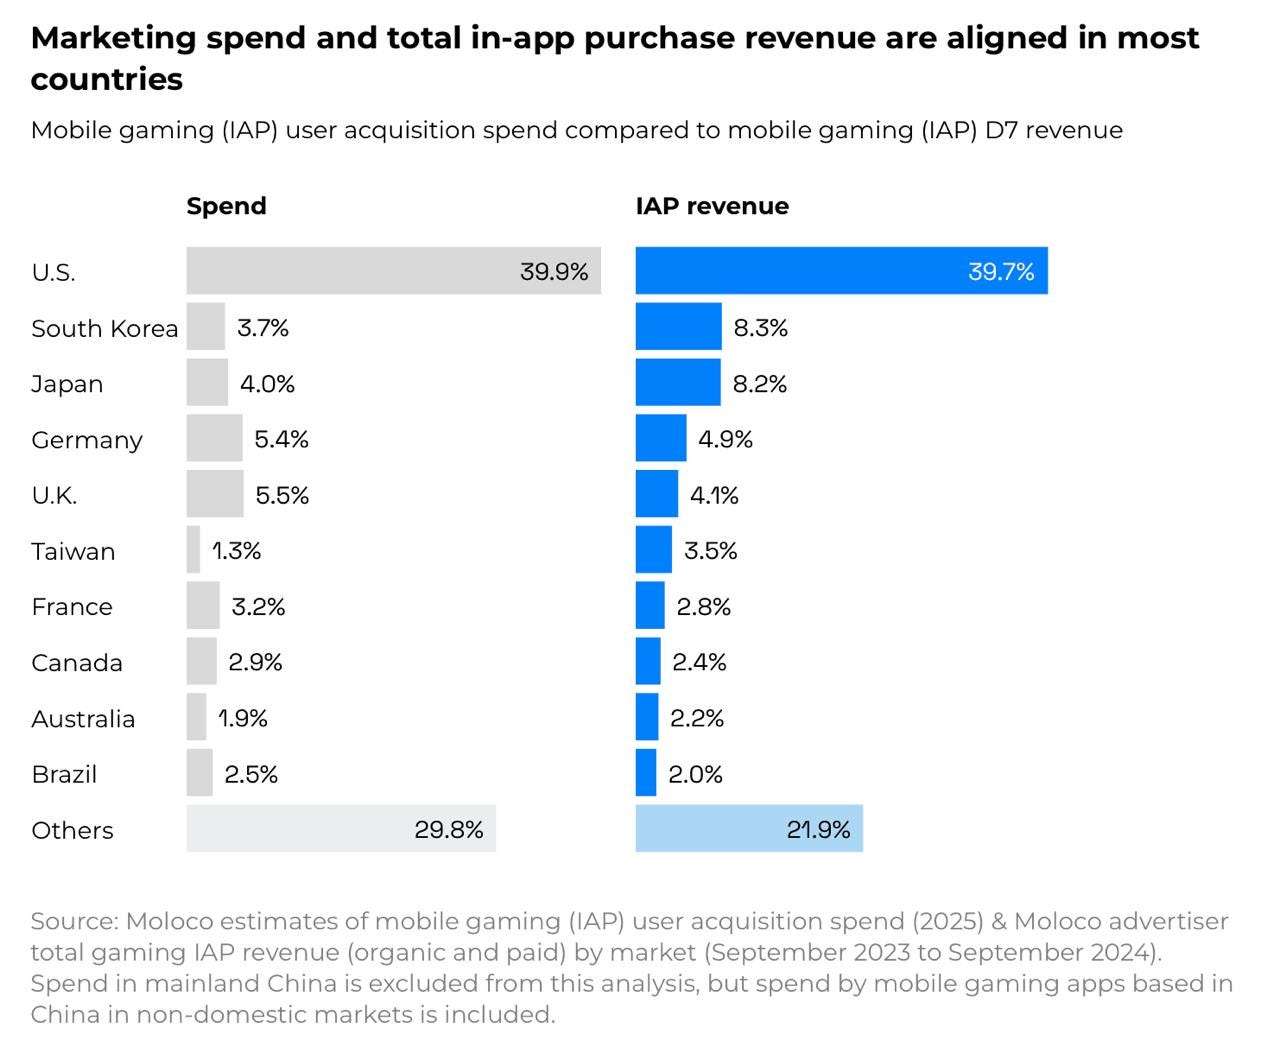
- The general trend is that the higher the UA spending in a specific market (e.g., the USA), the higher the IAP revenue. However, this correlation “breaks” in Asian markets like South Korea and Japan. In these countries, IAP revenue is higher than UA spending. Moloco analysts note that this may indicate that many advertisers don’t understand how to work in local markets.
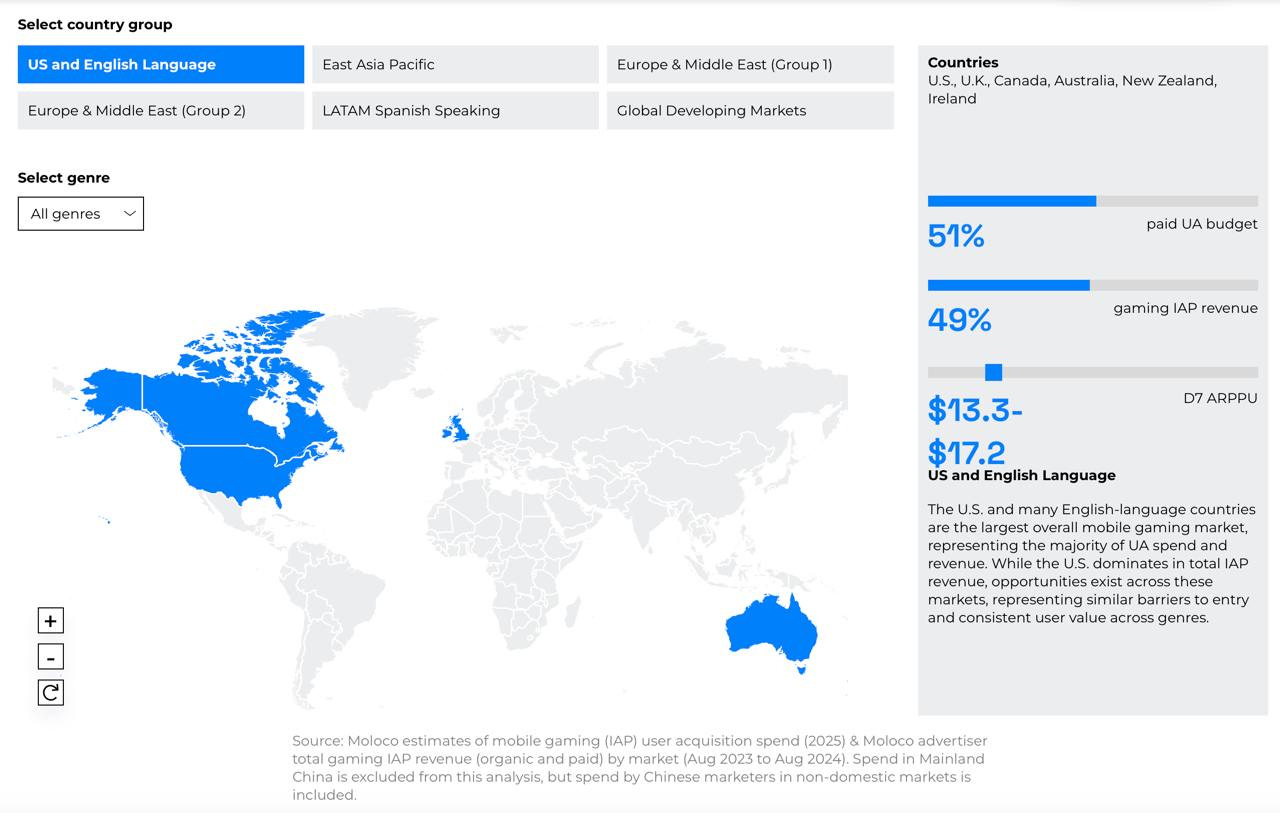
- Moloco also offers an interesting framework for working with markets, highlighting several main blocks. These include English-speaking Tier-1 markets; East Asian countries; Latin American Spanish-speaking countries, and so on.
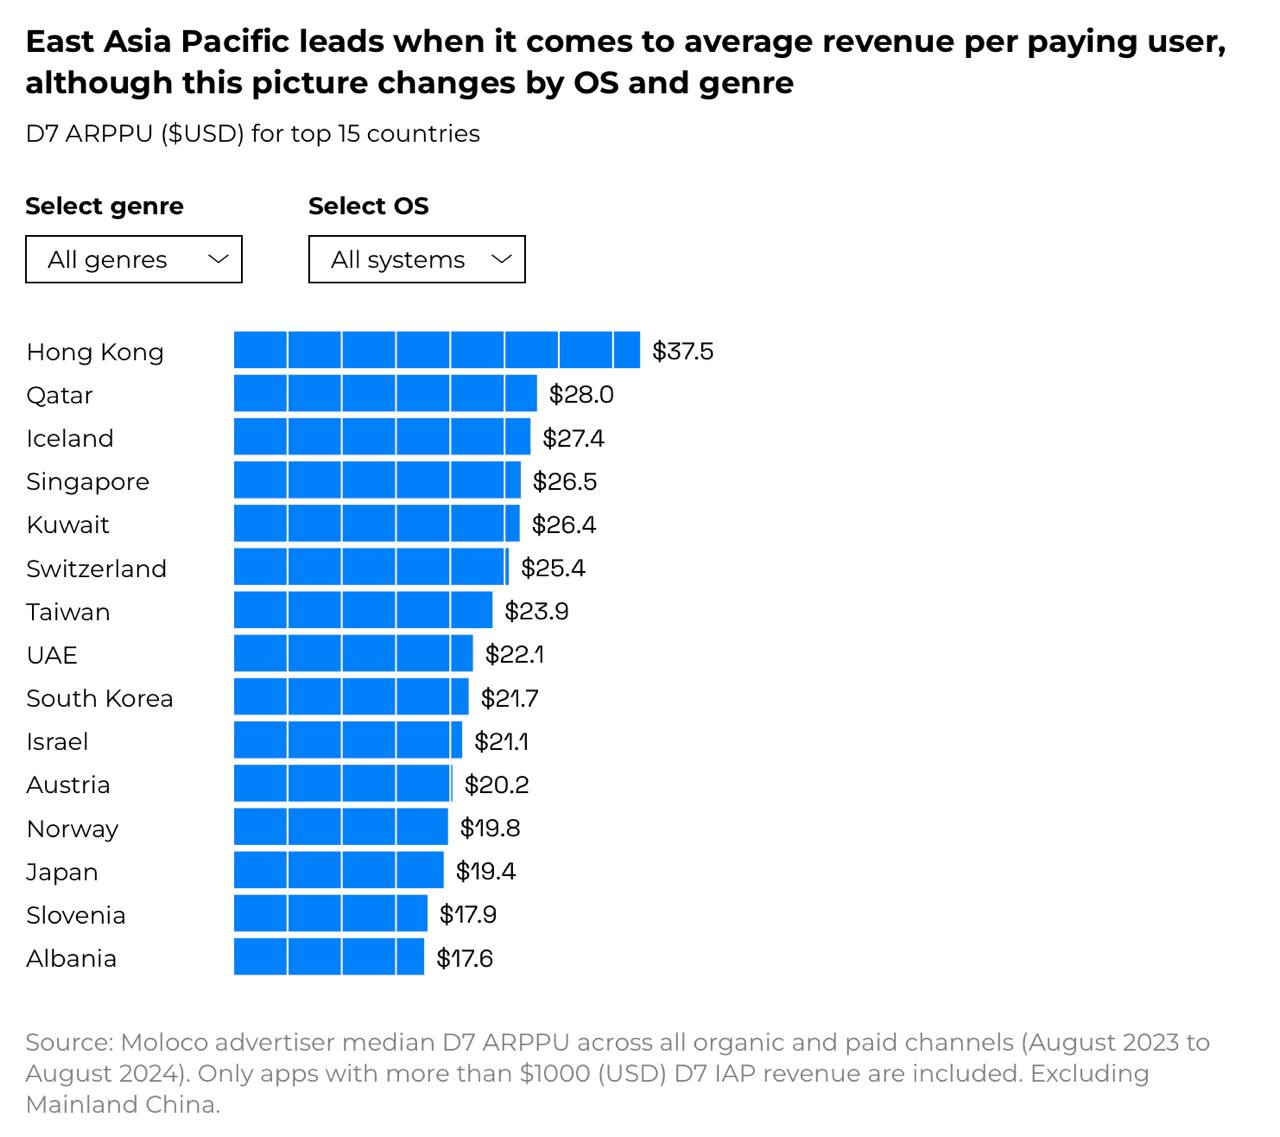
- The highest D7 ARPPU, on average, is in Hong Kong ($37.5); Qatar ($28) and Iceland ($27.4).
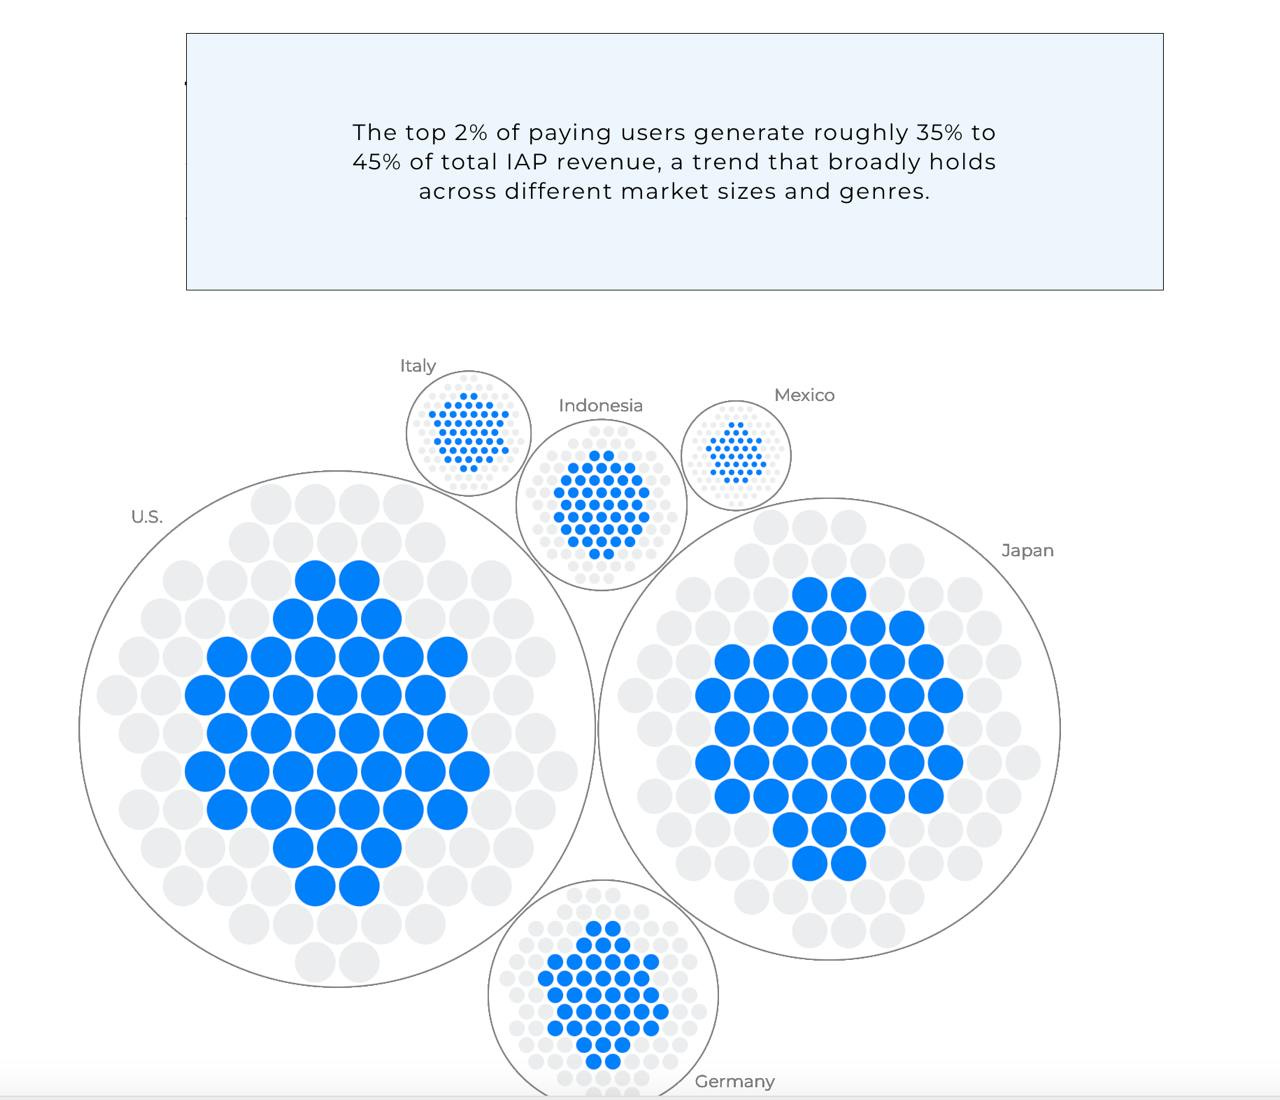
- 70-85% of all IAP revenue is generated by 10% of users. The most valuable 2% of players generate 35% to 45% of all IAP revenue.
- In its methodology, Moloco identifies as promising those markets with a low cost of acquiring a paying user (CPP) but high (relatively) ARPPU.
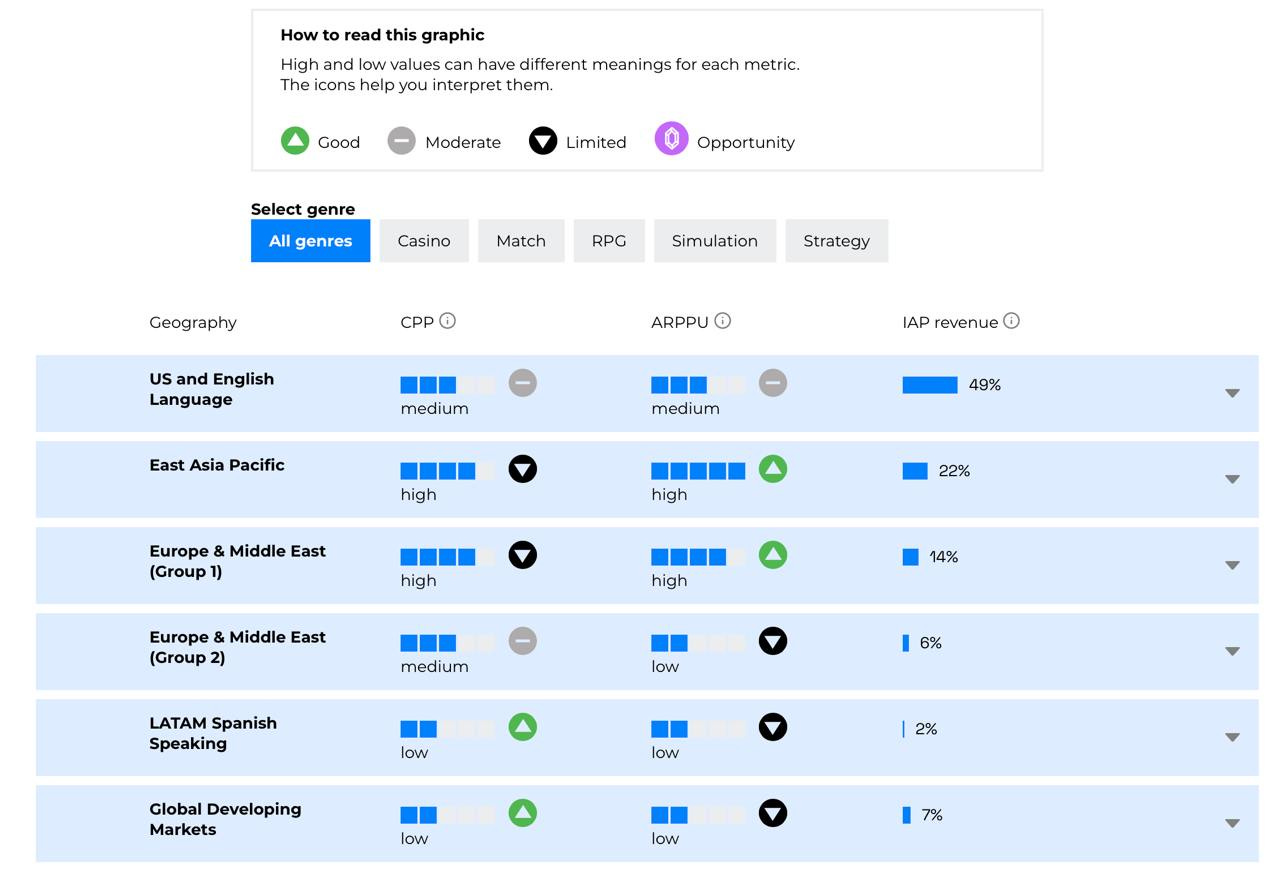
❗️However, it’s strange that the list of “promising” markets includes those that have long been considered “base” markets - the USA, South Korea, Japan, leading European countries.
Source - interactive tables by country and genre are available by the link.
Games & Numbers (October 30 - November 12; 2024)

PC/Console Games
- Call of Duty series games have been purchased over 500 million times. Only Mario has more (879.4 million copies).
- Hogwarts Legacy has been bought by more than 30 million players. It took less than two years to achieve this; Warner Bros. reported 22 million copies sold at the beginning of this year.
- Phasmophobia has been purchased more than 20 million times.
- Kingdom Come: Deliverance has been bought more than 8 million times. The game was released in 2018. The sequel is set to release on February 11, 2025.
- Over 19 million people have played Death Stranding. This doesn’t refer to sales, as the game was distributed for free through subscription services.
- Despite mixed player reviews, Dragon Age: The Veilguard showed the best concurrent user count among all EA’s story-driven games - 89,400 people. Only multiplayer games like Apex Legends, Battlefield, EA Sports FC, and The Sims 4 (after transitioning to the F2P model) had higher numbers.
- The Sims 4 has gained over 15 million new players in the last year.
- Mod support in Baldur’s Gate III was warmly received by the audience. Mods have been downloaded more than 50 million times.
- The open beta testing of Monster Hunter Wilds reached 463,000 concurrent users. It took place from November 1 to 4. The game will be released on February 28, 2025.
Mobile Games
- Call of Duty: Mobile has been downloaded over 1 billion times in 5 years.
- On October 26, Honor of Kings repeated its own DAU record. Over 100 million people logged into the game. This was due to the project’s ninth anniversary.
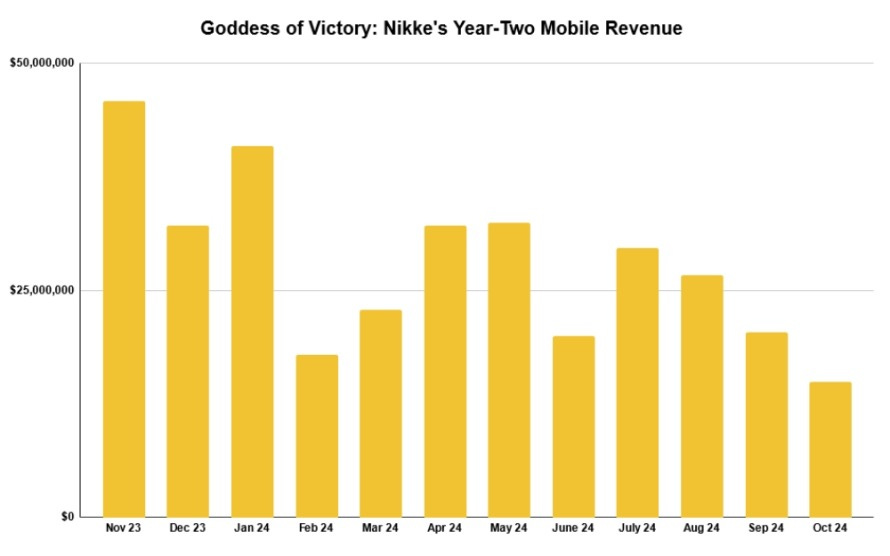
- Goddess of Victory: Nikke earned $890.6 million in Gross Revenue two years after release. 58.4% of all revenue was generated by Japanese users.
- GDEV reported that the browser game Hero Wars: Dominion Era has earned more than $650 million since its release in October 2016. This figure includes revenue from mobile platforms. Apparently, this is the highest-earning browser game in the world.
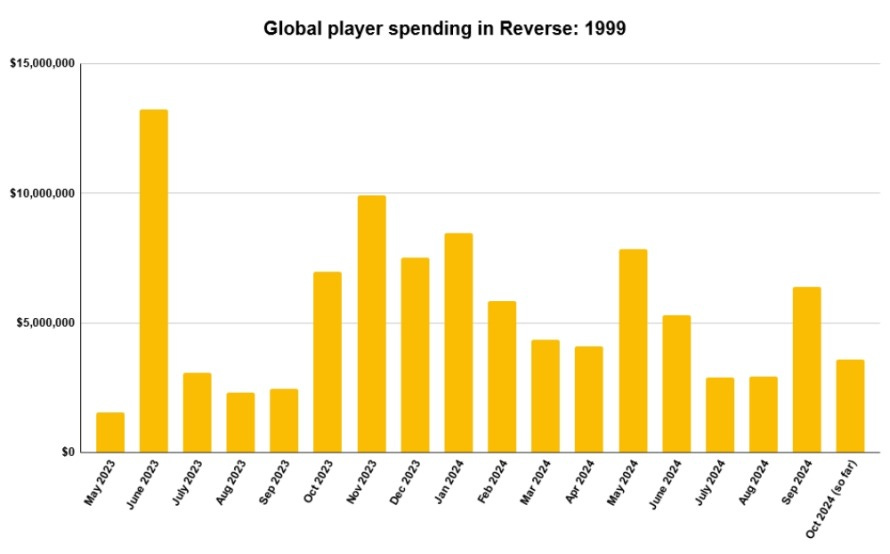
- Reverse: 1999 earned $98.7 million in Net Revenue in its first year after Western release, according to AppMagic. In reality, this figure is likely higher.
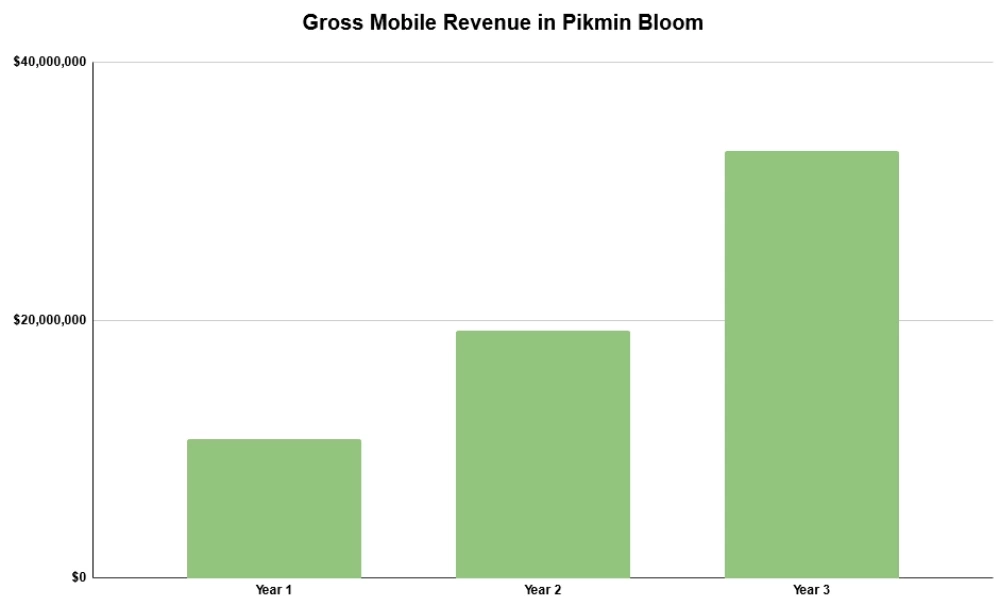
- Pikmin Bloom earned $63.1 million in Net Revenue over three years of operation, according to AppMagic. $33.1 million (53% of total revenue) was earned in the last year. 68% of revenue comes from Japan.
- Pokemon TCG Pocket, launched on October 30 this year, has already surpassed $50 million in Net Revenue, according to AppMagic. 43% of revenue comes from Japan, 27% from the USA. On November 9, the game’s daily revenue was $5.56 million. The game has been downloaded more than 17 million times. This is the second most successful mobile game launch in the franchise after Pokemon GO.
- Royal Kingdom has earned more than $20.5 million during its soft launch since April 2023. 74% of this amount was paid by British users. The game will be released worldwide on November 21.
- Since its release on October 17, the mobile Age of Empires has earned $13.89 million (as of November 11), reports Chinese publication GameLook. According to AppMagic, the game has more than 5 million installations worldwide.
- Ludus: Merge Arena from Cypriot Top App Games has reached a monthly revenue of $2 million. Since its release in October 2023, the game has been downloaded more than 3 million times.
- DAU in Roblox has exceeded 88.9 million people. The biggest growth is due to people over 13 years old.
GSD & GfK: The UK gaming market grew by 3.2% YoY in October 2024

GSD is reporting only the fact sales numbers were received from partners. There are partners (like Nintendo), who are not sharing the digital sales numbers, which might affect the overall picture.
Game Sales
- 2.9 million copies of games were sold in the country in October. It’s 3.2% higher than a year earlier.
- Call of Duty: Black Ops 6 holds a solid first place. Sales in the UK are 11% worse than Call of Duty: Modern Warfare III due to the game’s appearance on Game Pass. However, considering only PlayStation systems, the game is selling 24% better than its predecessor when comparing initial sales. 75% of all sales are on PlayStation; 15% on PC; 10% on Xbox.
- EA Sports FC 25 is in second place. Sales dynamics in October are 14% worse compared to the previous part.
- Dragon Ball: Sparkling! Zero in the UK is 80% higher than Dragon Ball Z: Kakarot for the same period. DBZ: Kakarot set a series record for sales in the first 4 weeks in 2020.
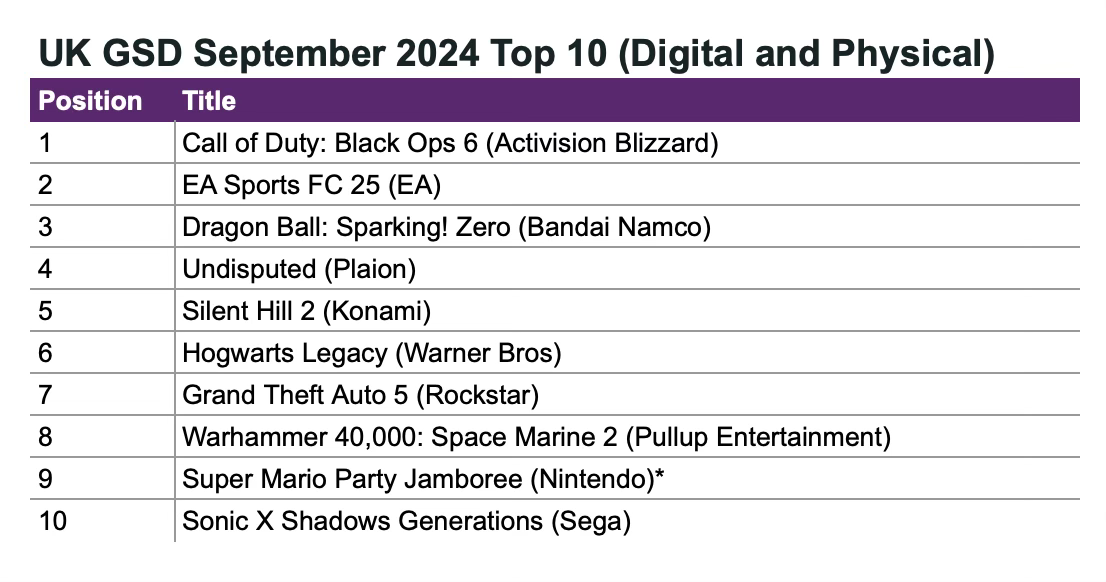
- Undisputed - a boxing simulator from independent Steel City Interactive - is in 4th place. It’s the second best-selling sports game in the UK this year (surpassing F1 24; NBA 2K25; EA Sports College Football 25), and it sold better than Tekken 8. The most surprising thing is that this is the studio’s first game, and the founders had no previous experience in game development.
- The Silent Hill 2 remake sold 32% worse than the Dead Space remake and 62% worse than the Resident Evil 4 remake.
- Among other new releases - Mario Party Jamboree (9th place); Sonic X Shadows Generations (10th place) - initial sales are 150% better than Sonic Superstars but 21% worse than Sonic Frontiers. One of the Game of the Year candidates - Metaphor: Refantazio - debuted at 12th place.
Hardware and Accessories Sales
- Console sales increased by 14% compared to last month - up to 144k systems sold. But this is still 18% less than in October last year.
- PlayStation 5 grew by 27% compared to last month, a decrease of 18% compared to last year. Nintendo Switch sales increased by 13% compared to last month, a decrease of 18% compared to last year. Xbox Series is doing worse - the console sold 7% worse in October than the previous month and 17% worse than the previous year.
- 681 thousand accessories were sold in the UK last month, which is 16% more than last year. The leader is DualSense.
Famitsu: Super Mario Party Jamboree leads Japanese physical sales chart in October 2024

Famitsu only accounts for physical sales.
Game Sales
- Super Mario Party Jamboree cartridges were purchased over 227,500 times in the first two weeks of October.
- Unusually for Japan, the top 10 includes 7 PlayStation 5 games. In second place is Metaphor: ReFantazio with 133,000 copies on PS4 and PS5. This is a record for disc version sales among all new IPs in 2024.
- Combined sales of Romancing SaGa 2: Revenge of the Seven on PS5, PS4, and Nintendo Switch total 115,000 copies.

- Nintendo accounts for 35.9% of all physical sales in October ($23.3 million); Atlus has 13.2% ($8.4 million).
- 976,500 boxed games for Nintendo Switch were sold in October. This represents 64.4% of the total sales volume.
Hardware Sales
- Nintendo Switch leads in sales - in October, the console was purchased 242,400 times in Japan.
- PlayStation 5 is far behind - 47,600 consoles.
Values Value & inGameJob: European Gaming Job Market in 2024
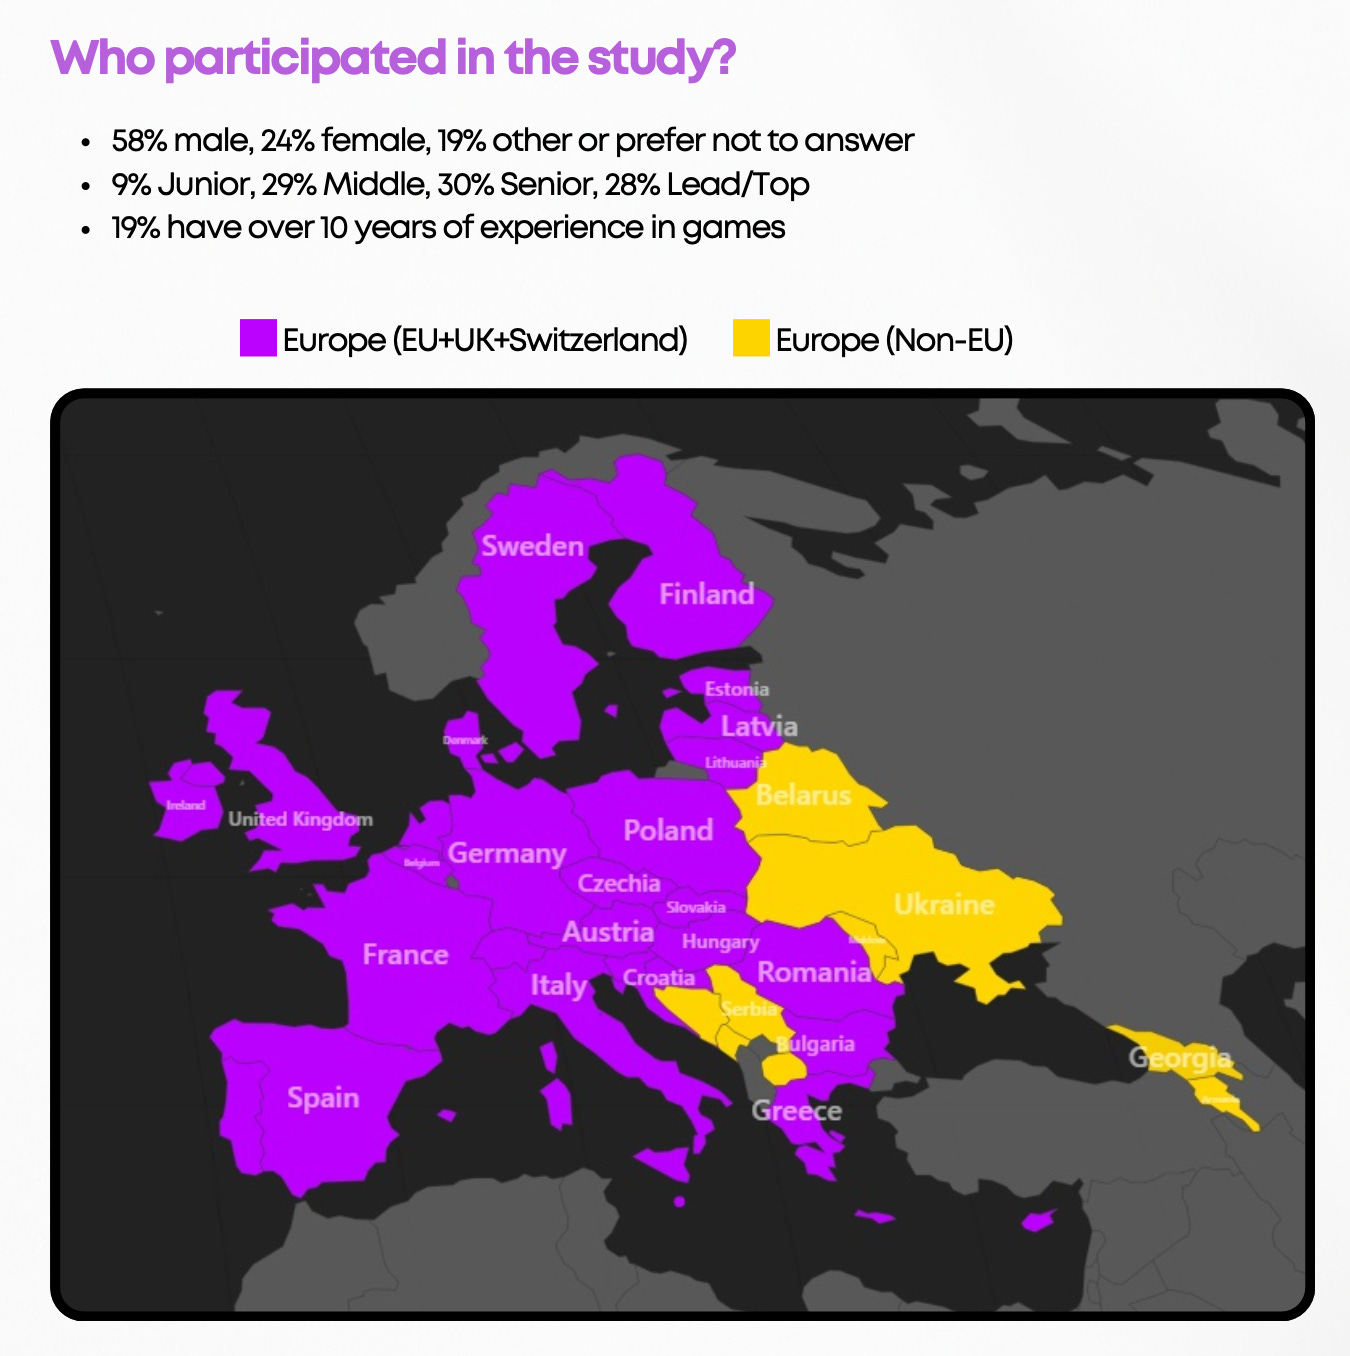
The survey involved 1,832 people from March to June 2024. The research regions were divided into two parts. The first included countries of the European Union, the United Kingdom, and Switzerland (for simplicity, I’ll name them the EU). The second included European countries not in the EU (I’ll name them as non-EU). More men participated in the survey (58%); the distribution by position level is even. 19% have over 10 years of experience in games.
Salaries
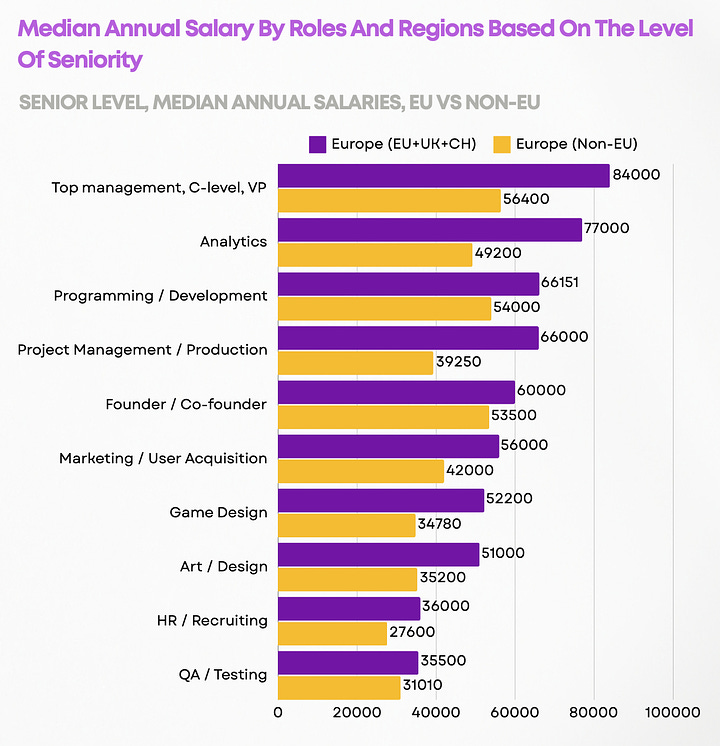
- The median annual gross salary for Senior specialists ranges from €31,000 to €84,000 per year. QA and testing specialists earn the least; top management earns the most.
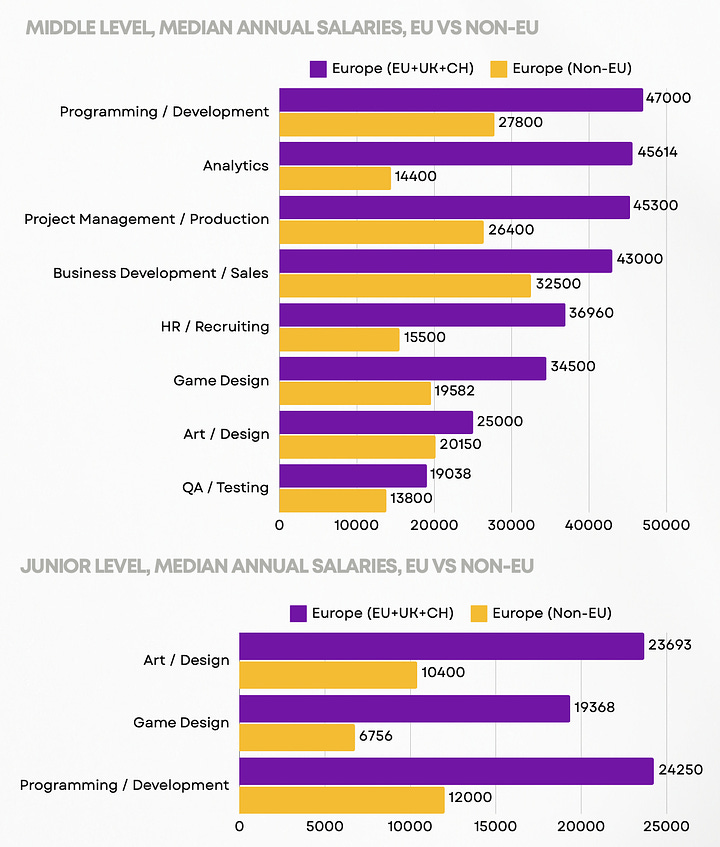
- For mid-level specialists, the salary ranges from €13,800 to €47,000 per year. Again, QA and testing specialists are paid the least, while programmers have the highest salaries.
- The median salary for Junior specialists ranges from €6,700 to €24,250 per year. Game designers from non-EU European countries earn the least. Programmers in EU countries, the UK, and Switzerland earn the most.
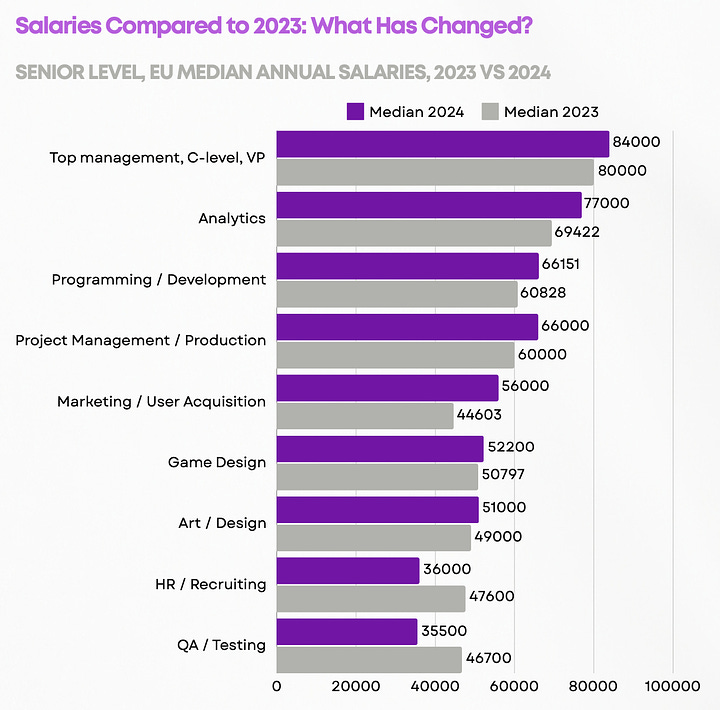
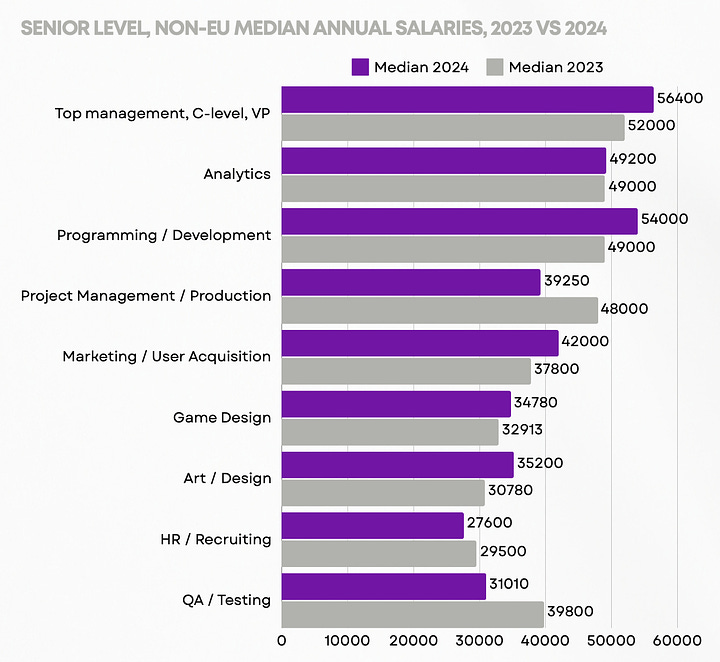
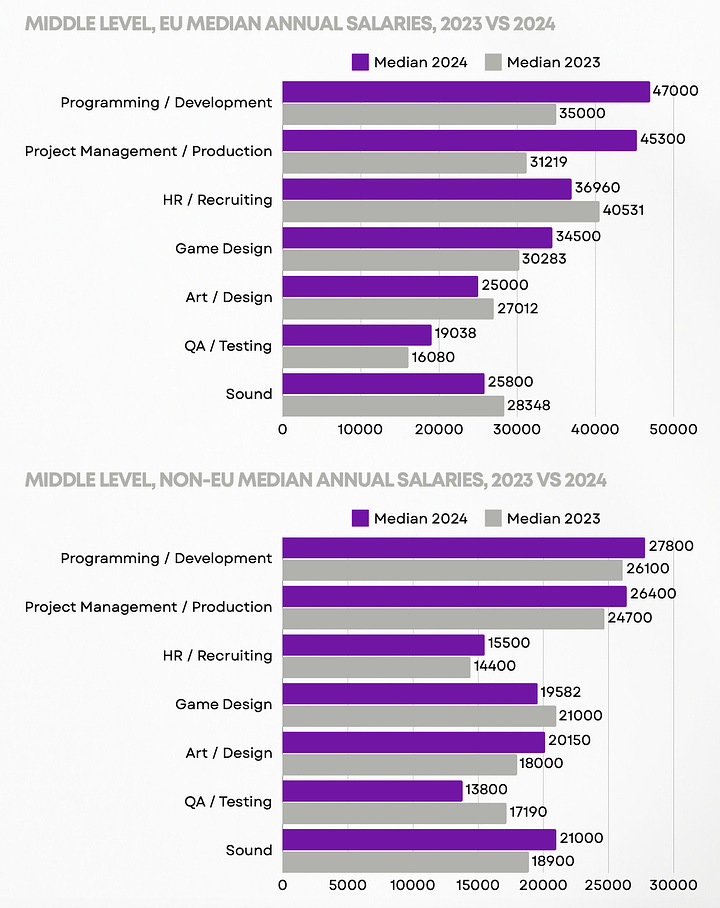
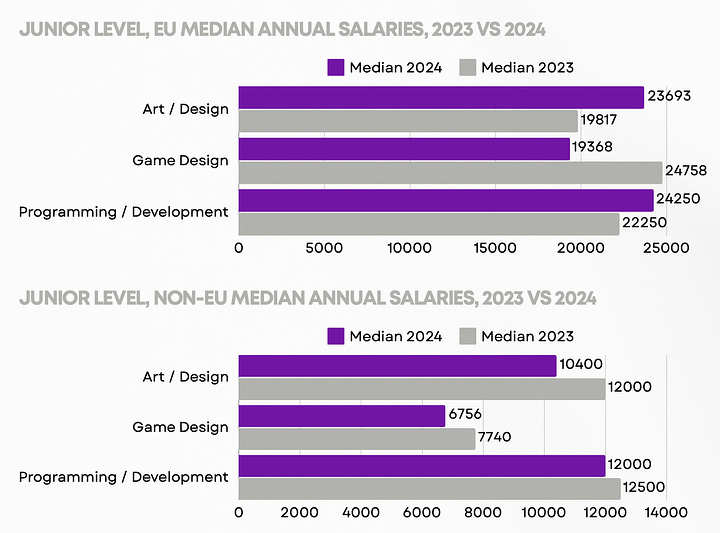
- The median salary in 2024 increased for all specialties except HR and recruitment, QA and testing, and project management specialists. In EU countries (+ UK and Switzerland), salaries also decreased for sound specialists and artists. In non-EU European countries, game designers' salaries also decreased.
- There is a noticeable decrease in salaries for almost all entry-level positions.
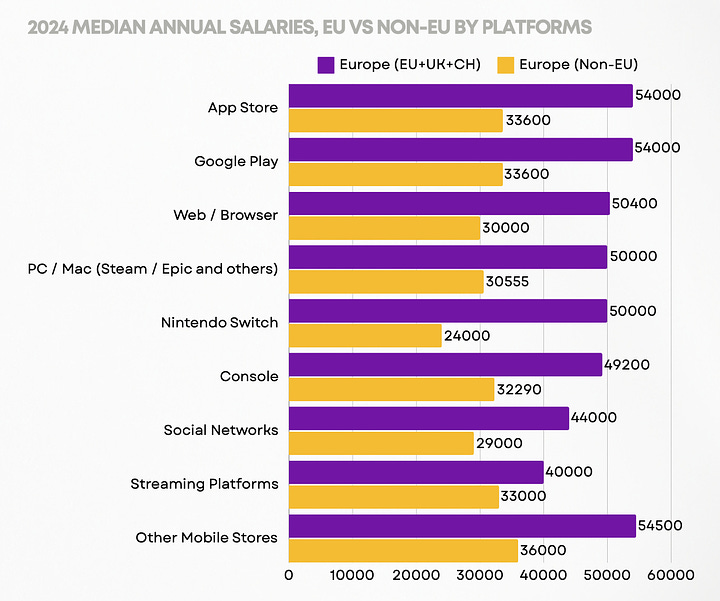
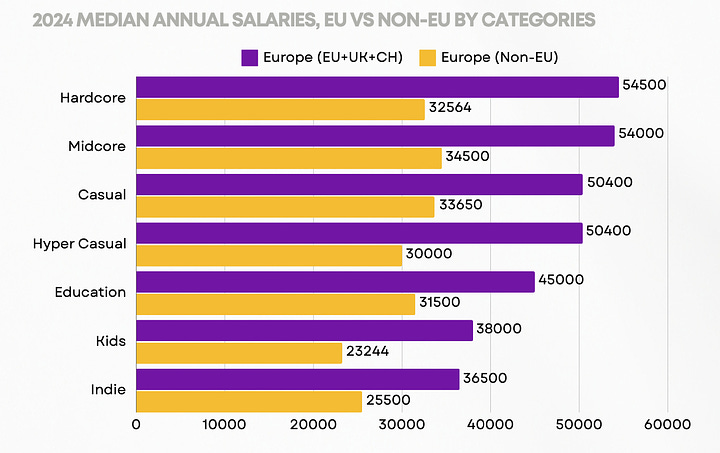
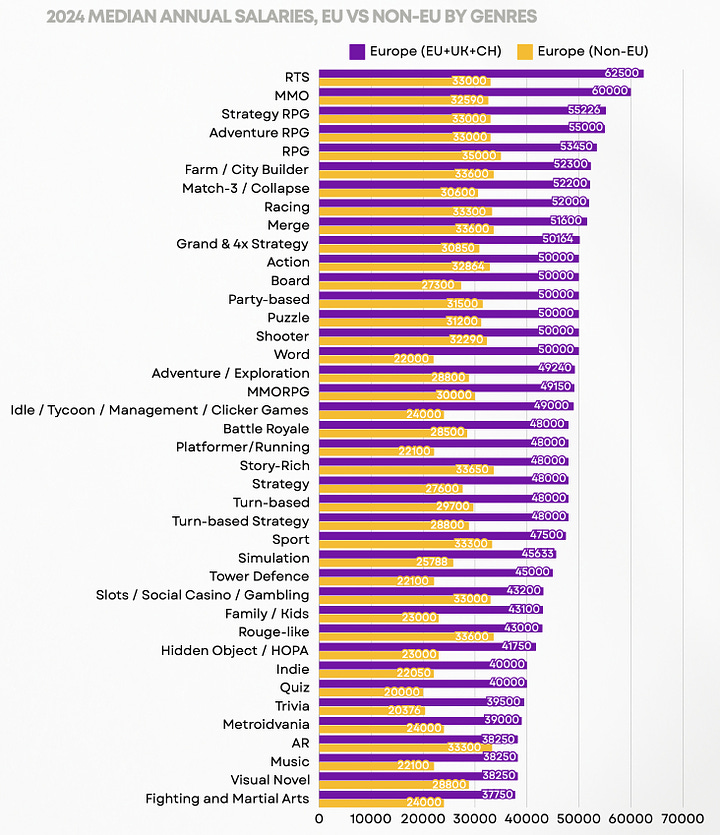
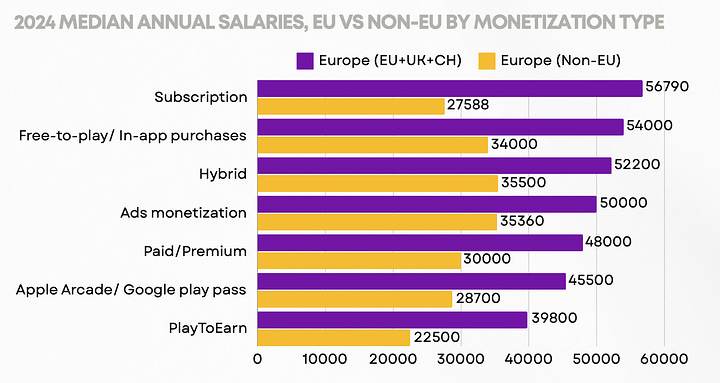
- Specialists working in mobile game studios, on average, earn more than their colleagues in premium game development.
Job and Salary Satisfaction
- Regarding financial bonuses, only 46% of companies offer paid sick leave; 29% of EU companies offer an annual bonus (only 18% among non-EU companies). Paid parental leave is available in 21% of EU companies and 9% of non-EU companies.
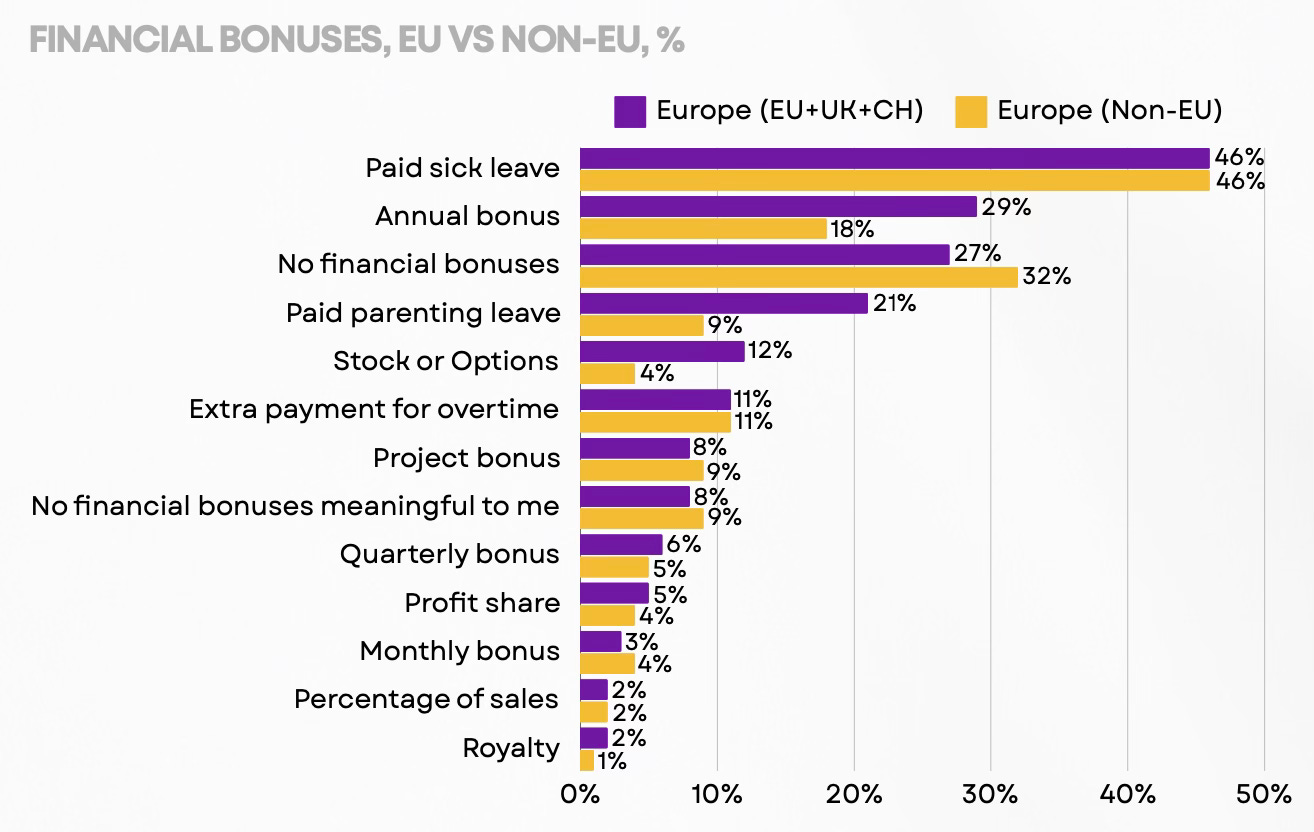
- The highest satisfaction comes from (in descending order) - revenue share, sales percentage, royalties, project bonus, and additional overtime pay.
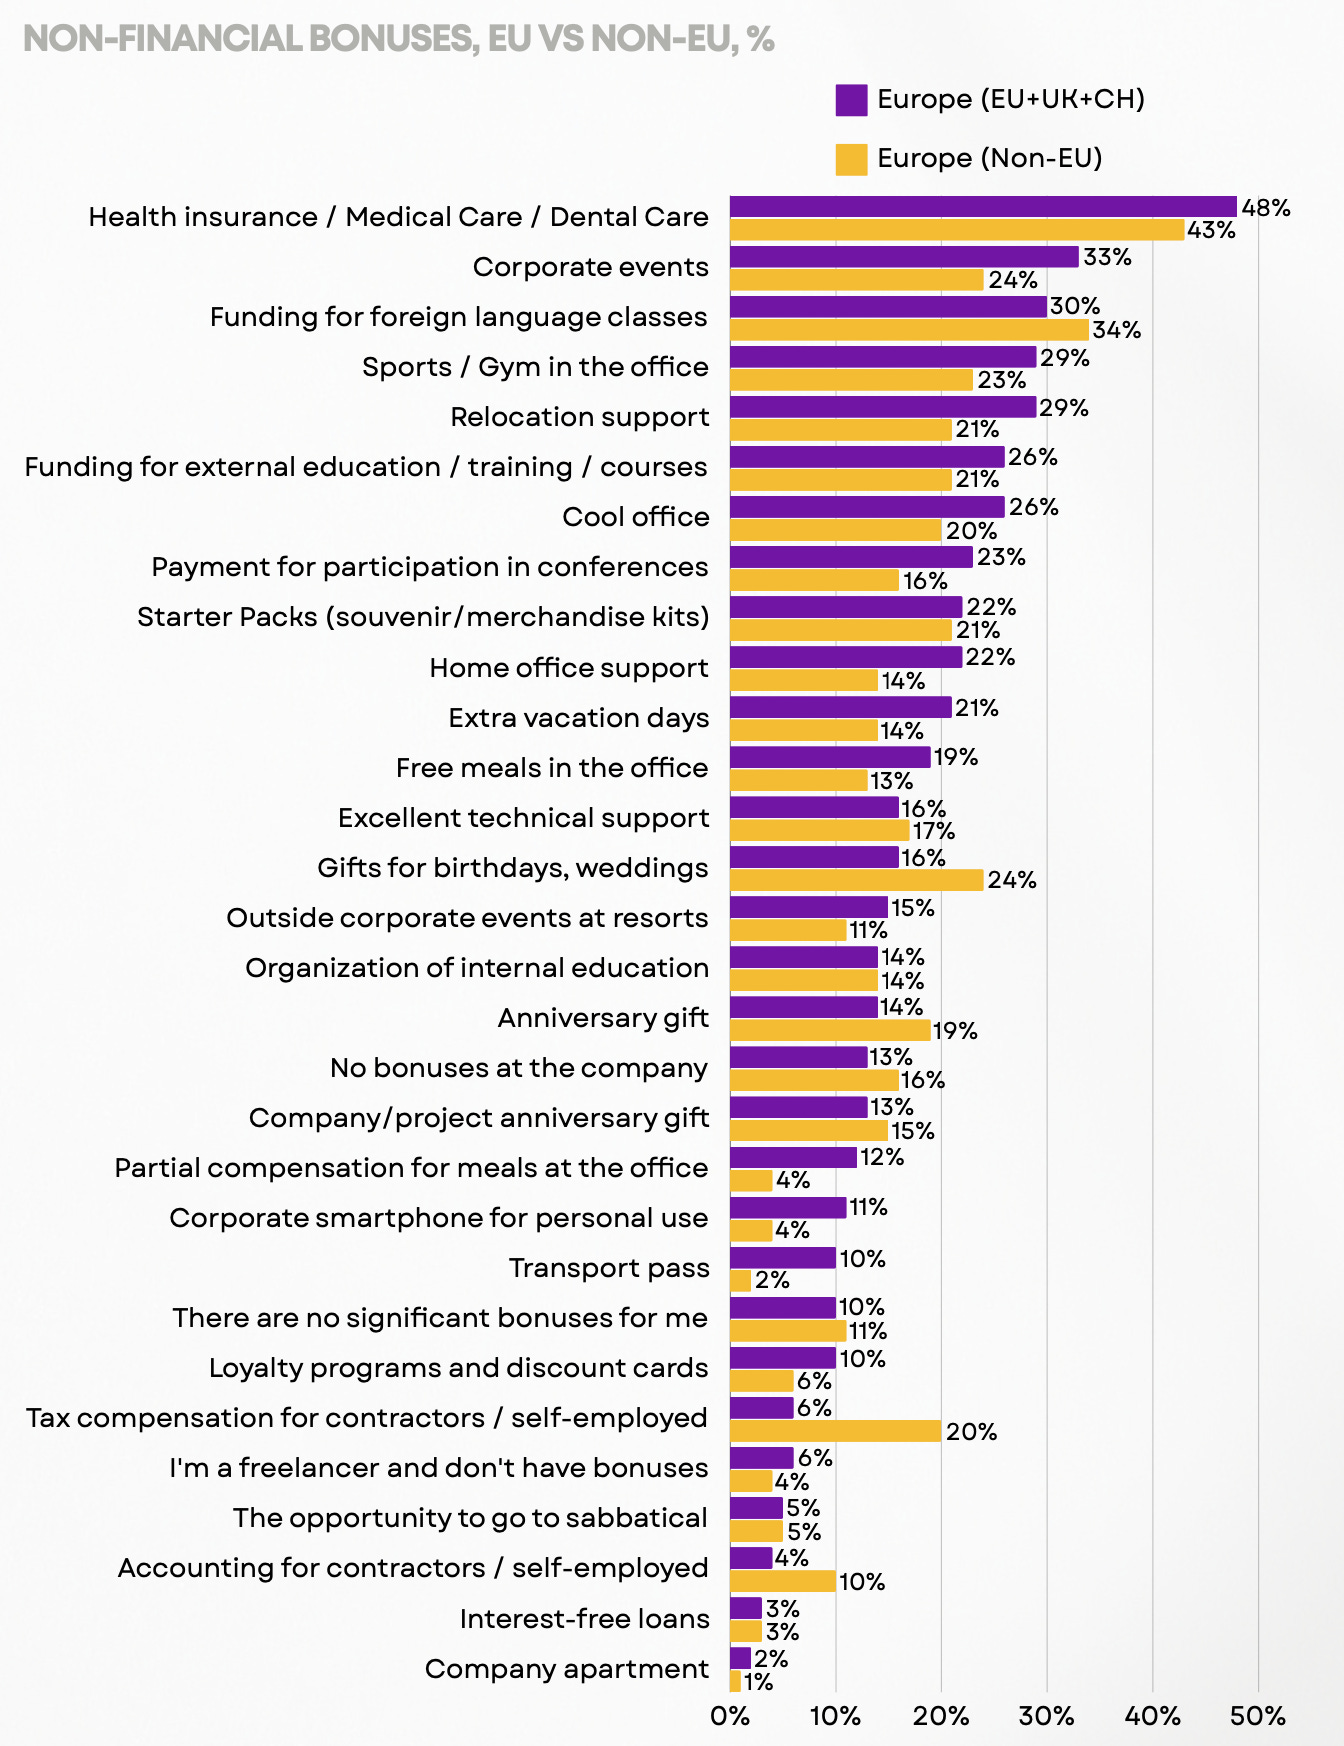
- Almost half of the companies offer health insurance; corporate events are held by 33% of EU companies and 24% of non-EU companies. Non-EU companies stand out with holiday gifts for colleagues (24%) and tax compensation for contractors and self-employed (20%).
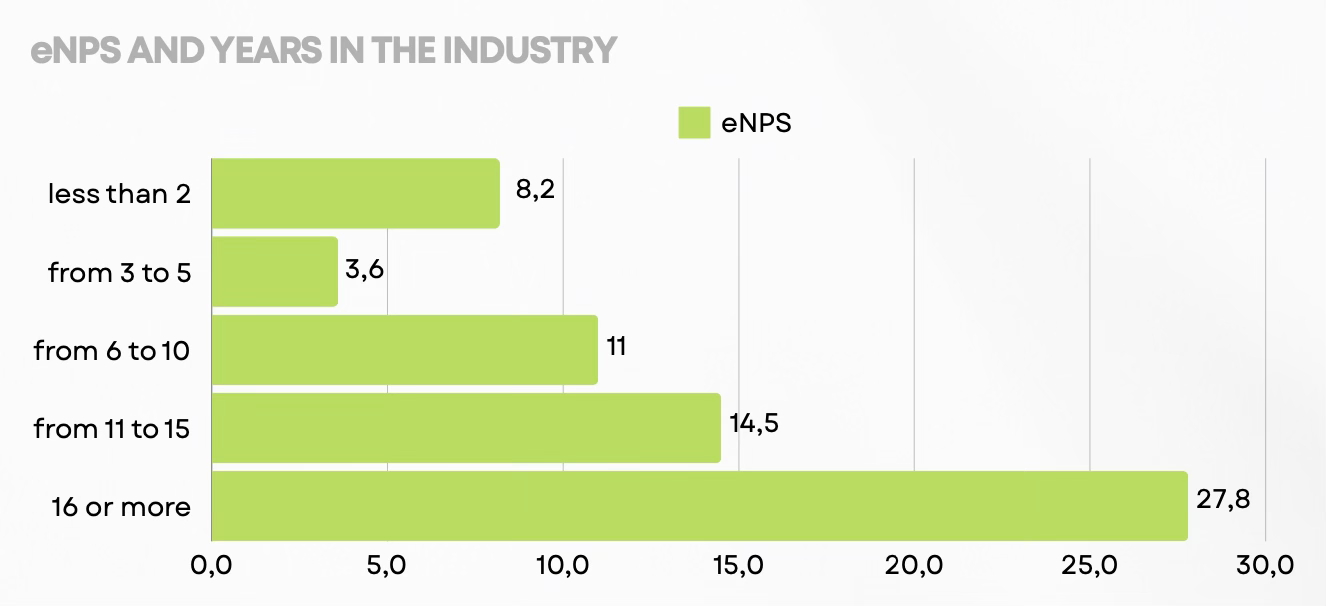
- There's a pattern - the longer a person works in the industry, the less likely they are to change jobs. Professionals who have been in the industry for more than 6 years are more loyal to their employers.
- The highest employee satisfaction with their workplace is in service companies by a large margin. Publishers and product companies, outsourcers follow. The lowest level of satisfaction is among indie developers and developers collaborating with publishers.
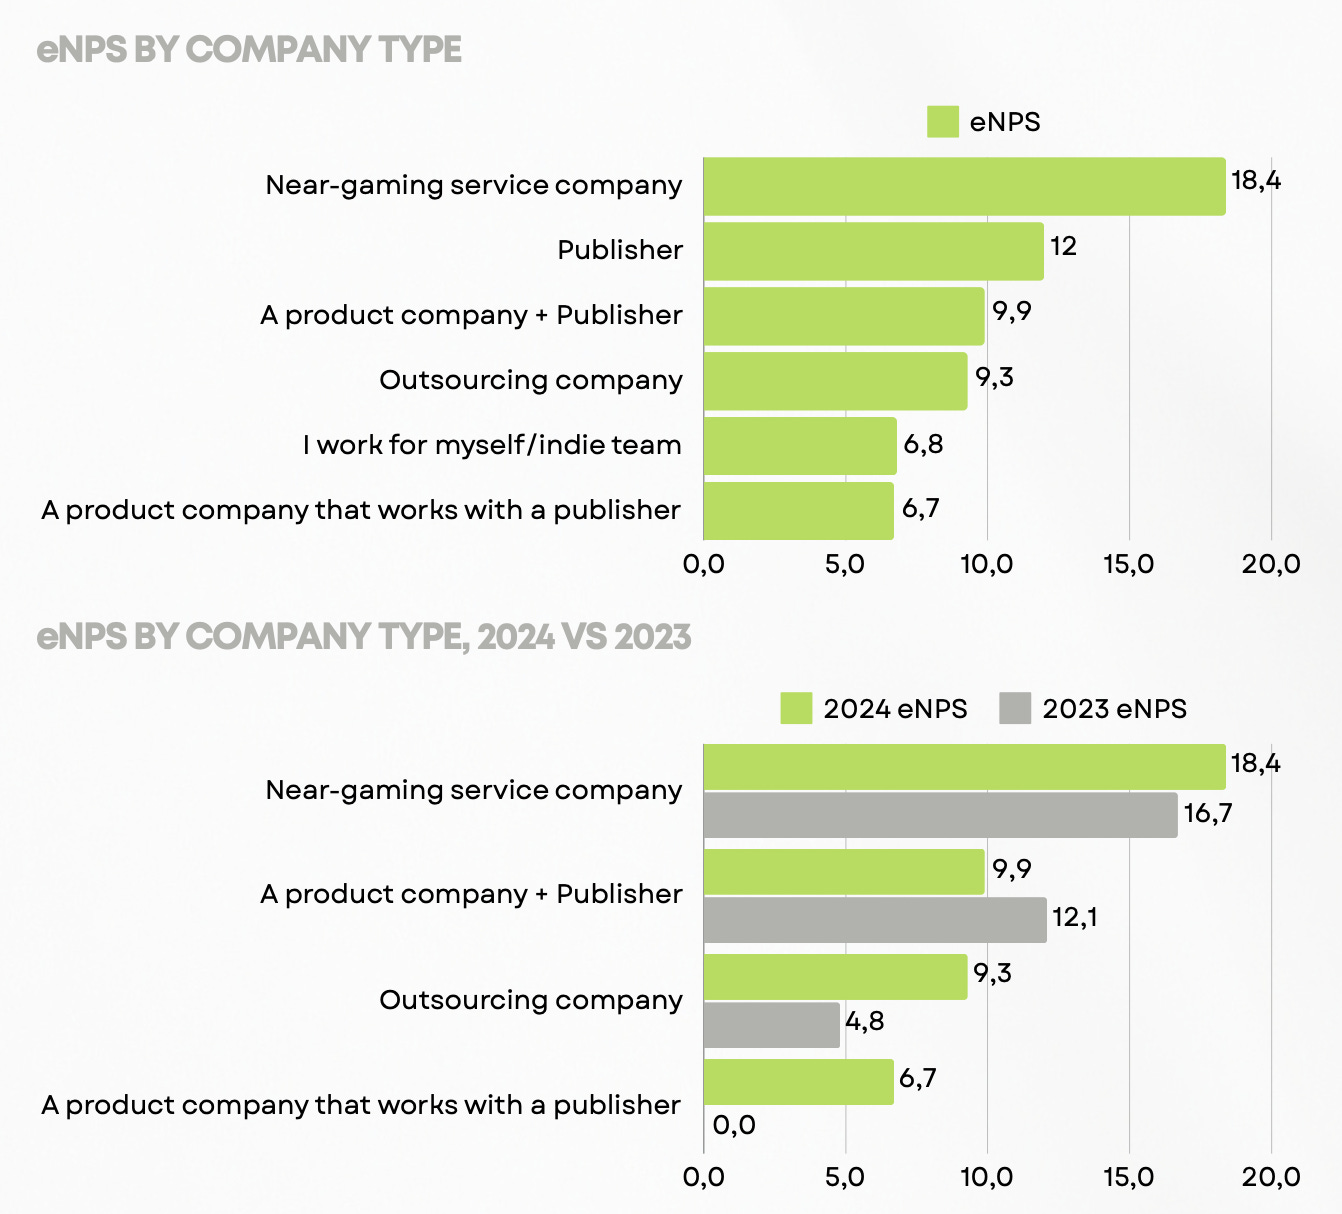
❗️Satisfaction with the workplace has decreased in product companies. This is likely due to the market crisis.
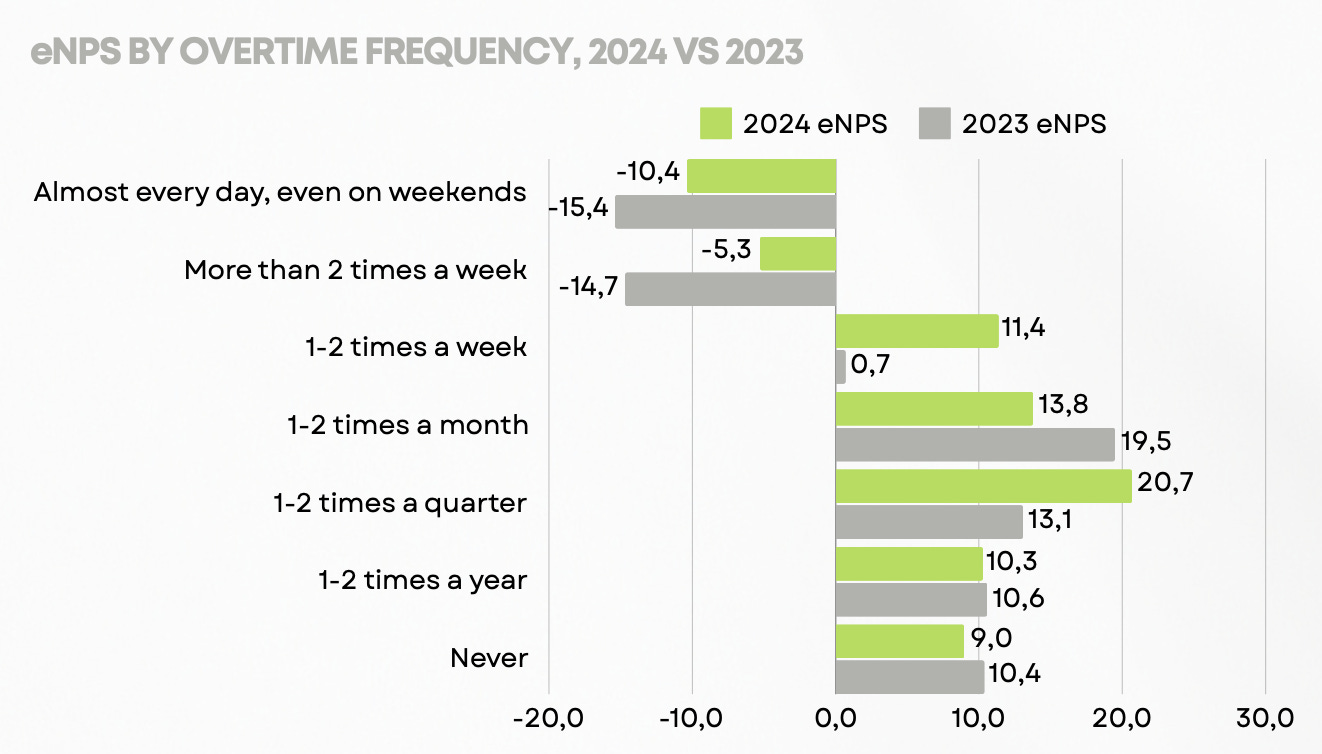
- People's attitudes towards overtime have changed. In 2024, they are more tolerant of overtime 1-2 times a week. This is the point after which workplace satisfaction significantly decreases.
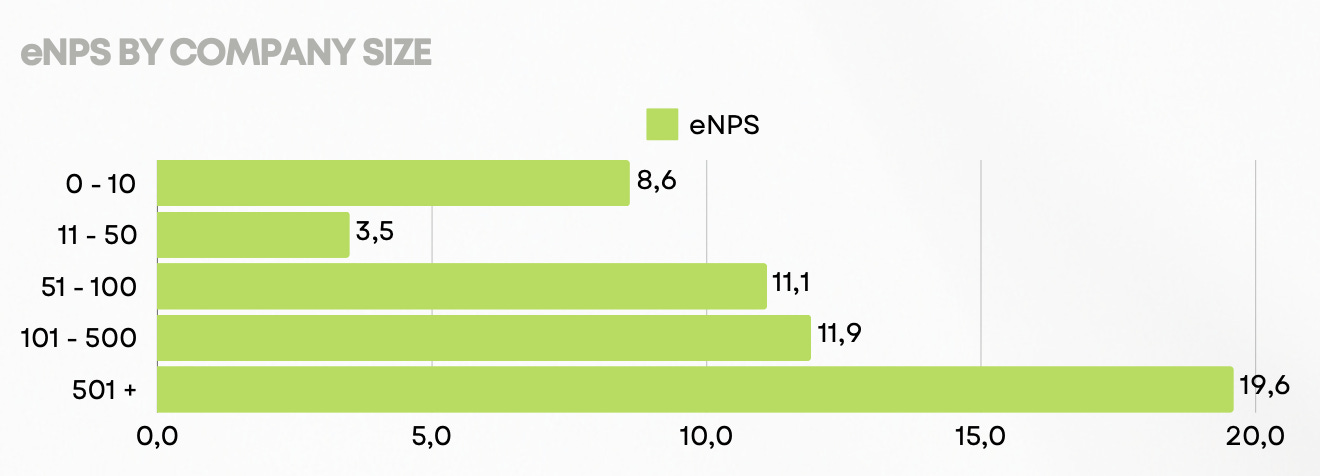
- Employees feel best in large companies with more than 500 people. The worst - in small teams of 11-50 people.
- Only remote or only office work format doesn't make people happier. But a hybrid format does.

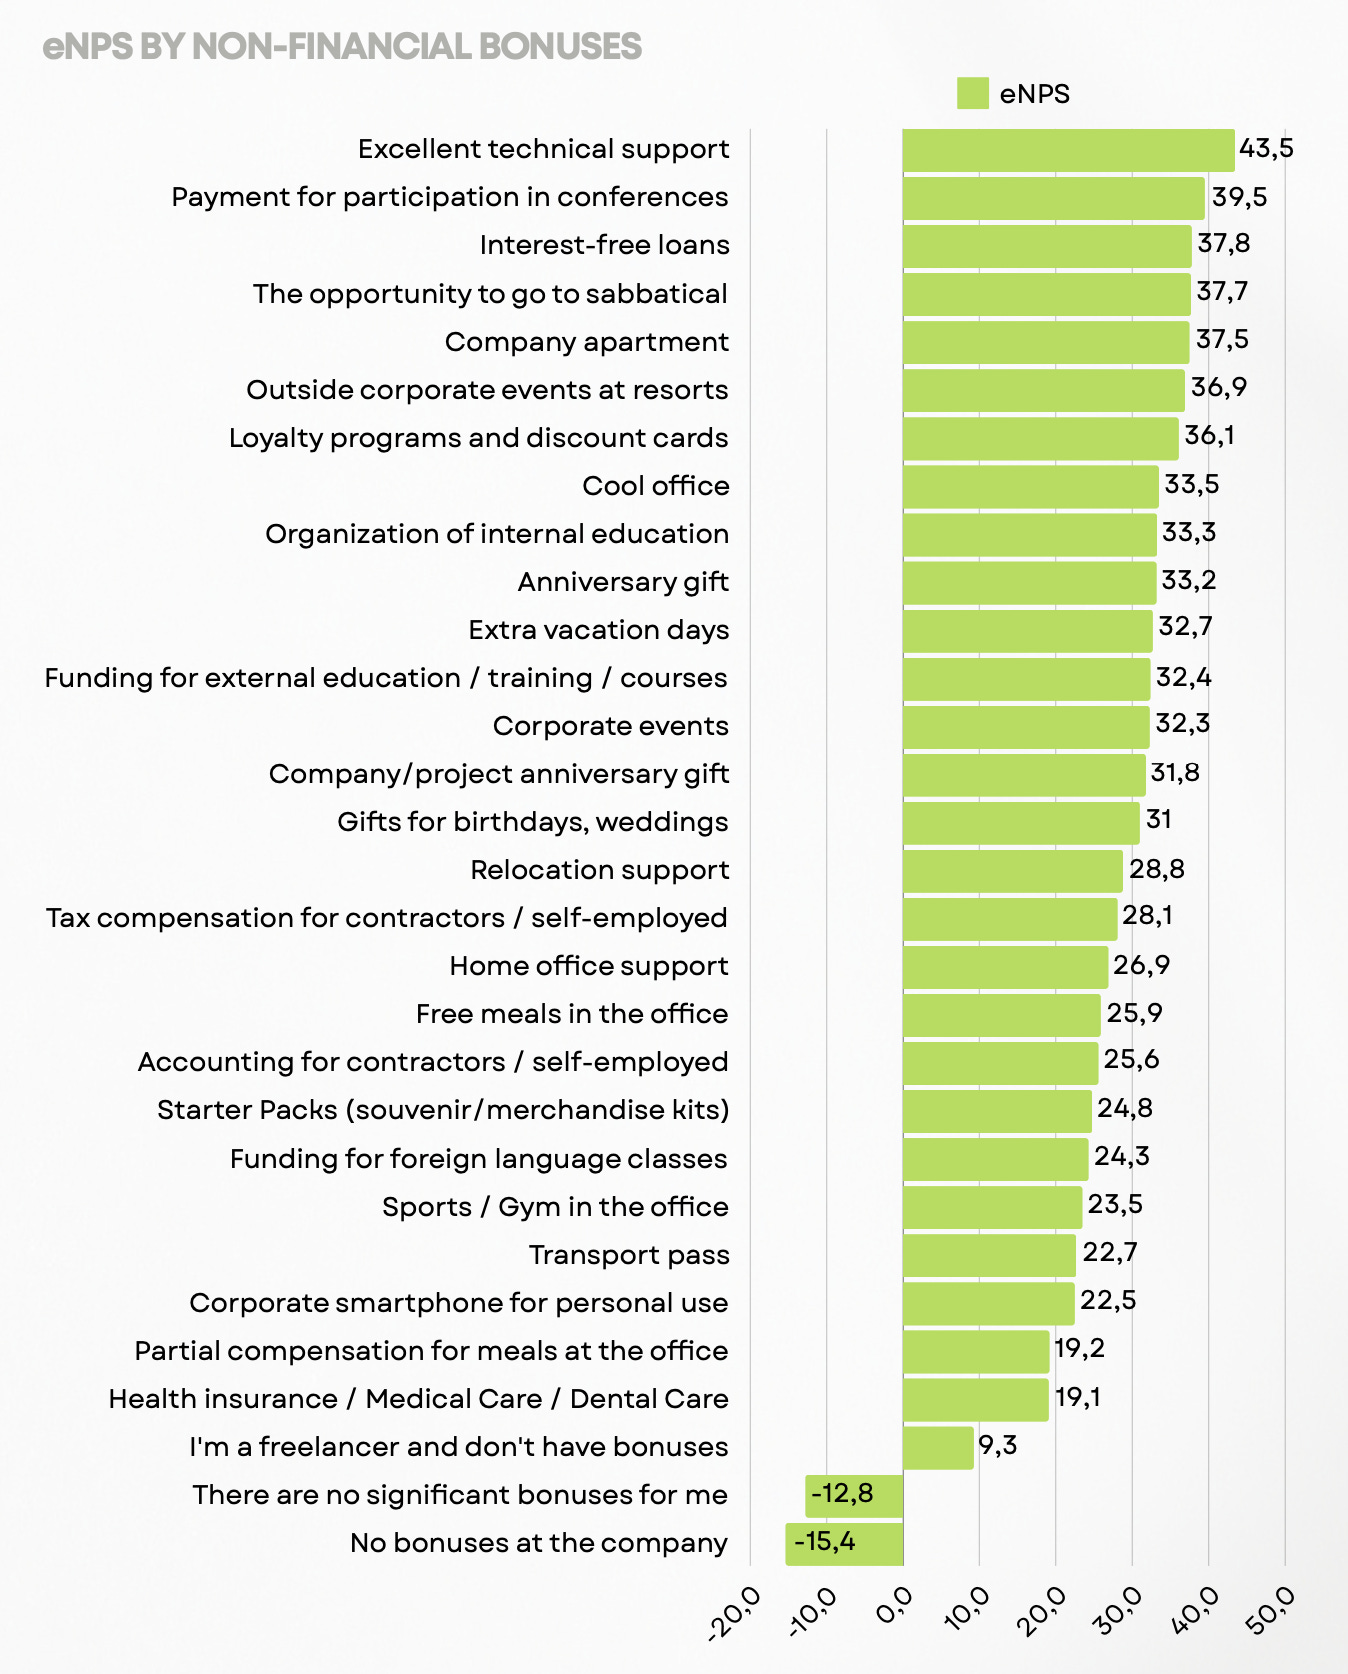
- When considering non-material bonuses that affect people's happiness, the leaders are - excellent technical support, payment for conference participation, interest-free loans, the possibility of taking a sabbatical, corporate apartments or flats.
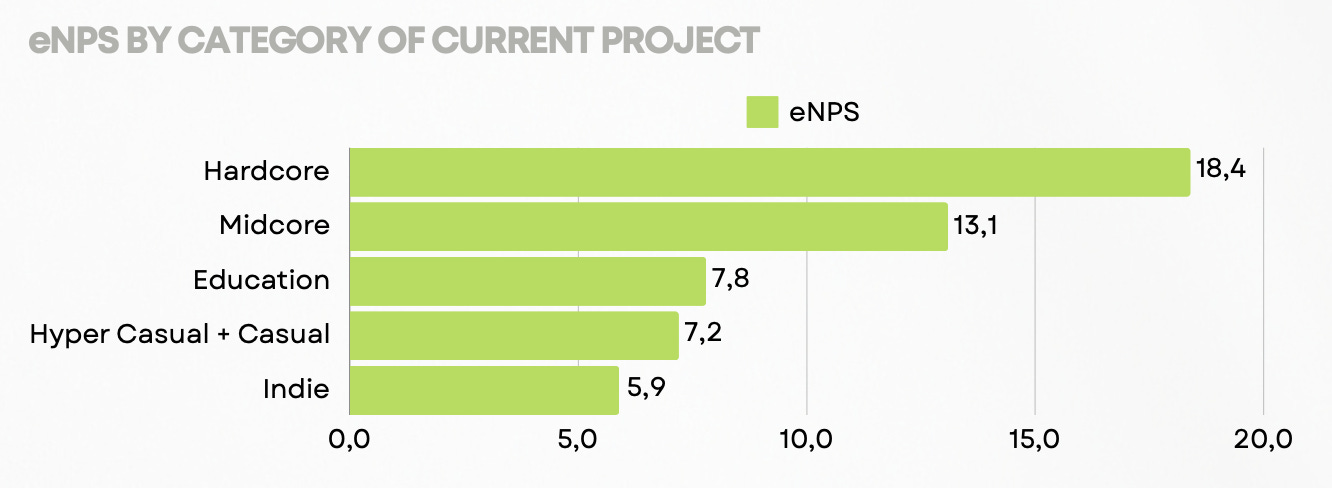
- The most satisfied employees are among those working on hardcore and midcore projects in large studios. The most dissatisfied are among indie developers.
- Employees who have their pet projects are less loyal and engaged with their employers.
Gender pay gap
- Women earn less than men on average. However, female programmers earn more than males, as do HR and recruitment specialists.
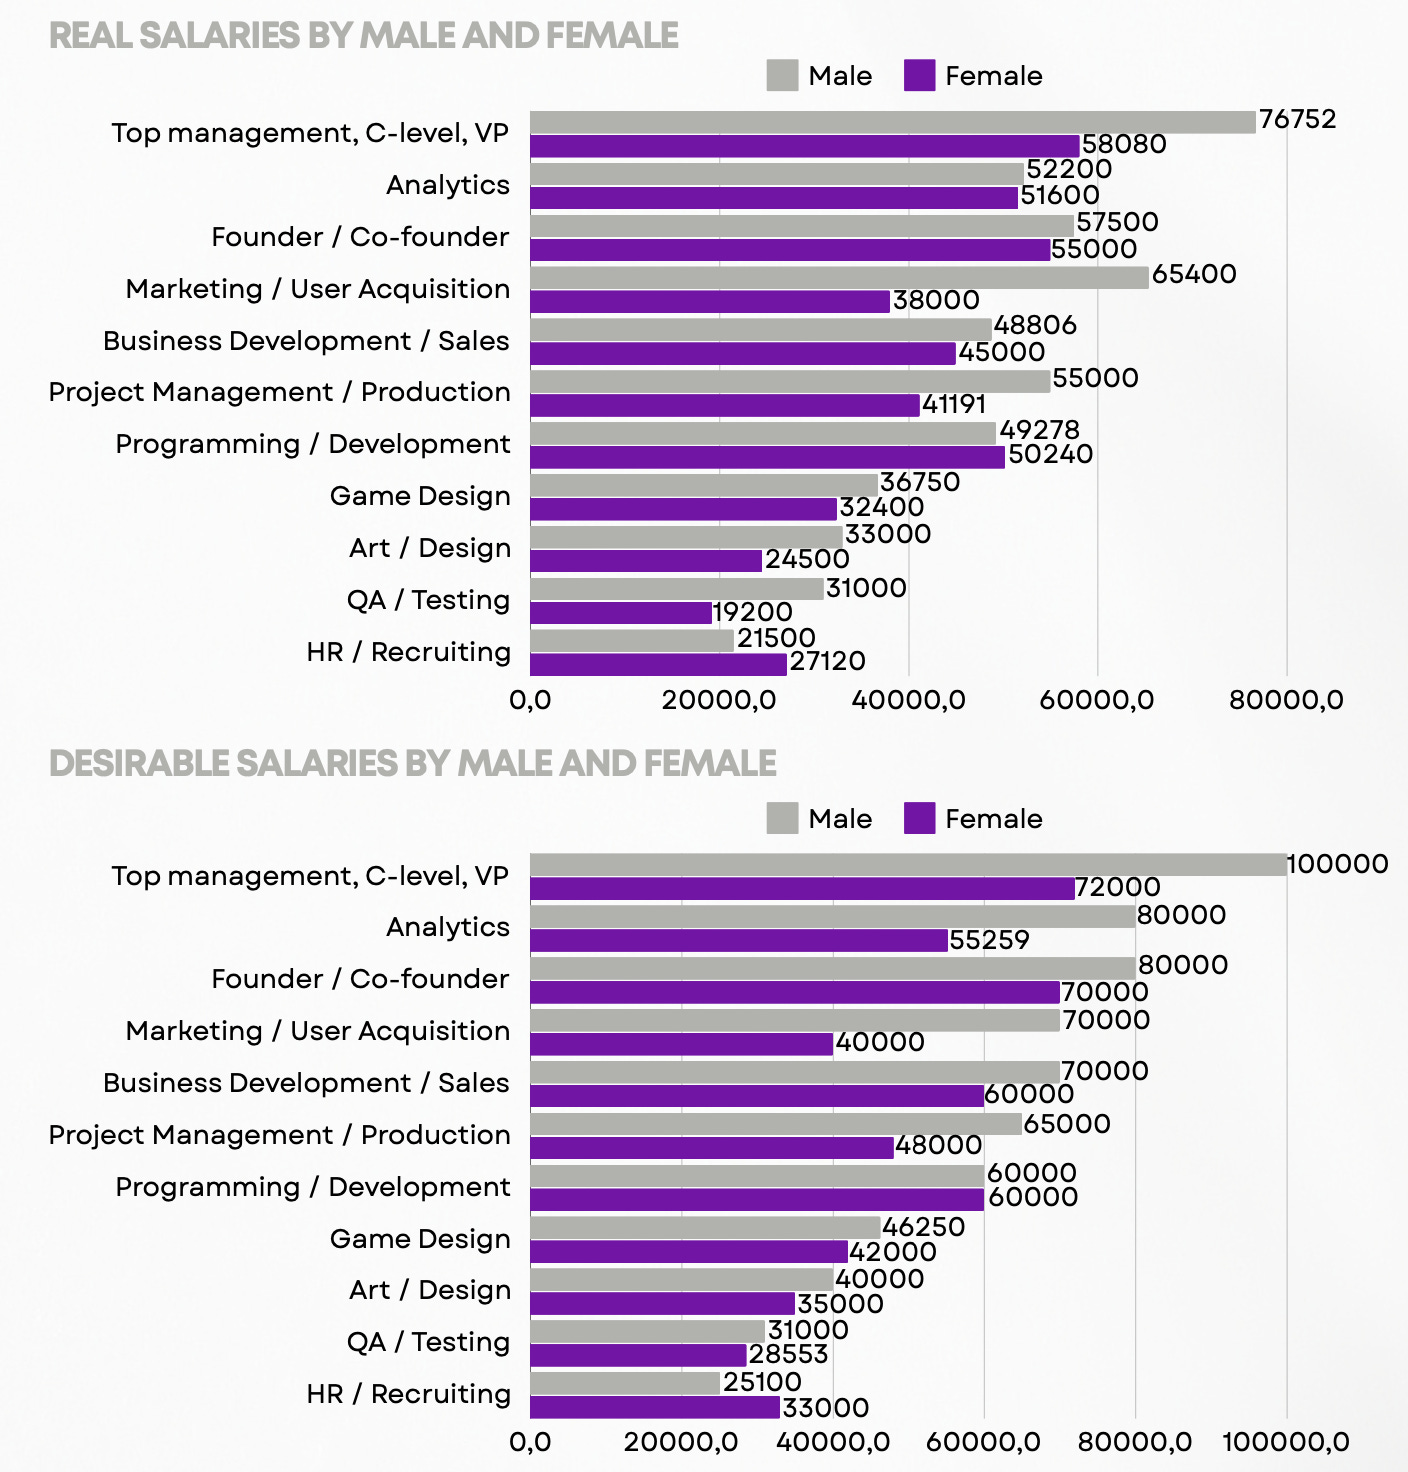
- Female, on average, wants a lower salary (7% higher than current) than male (54% higher than current).
Corporate work
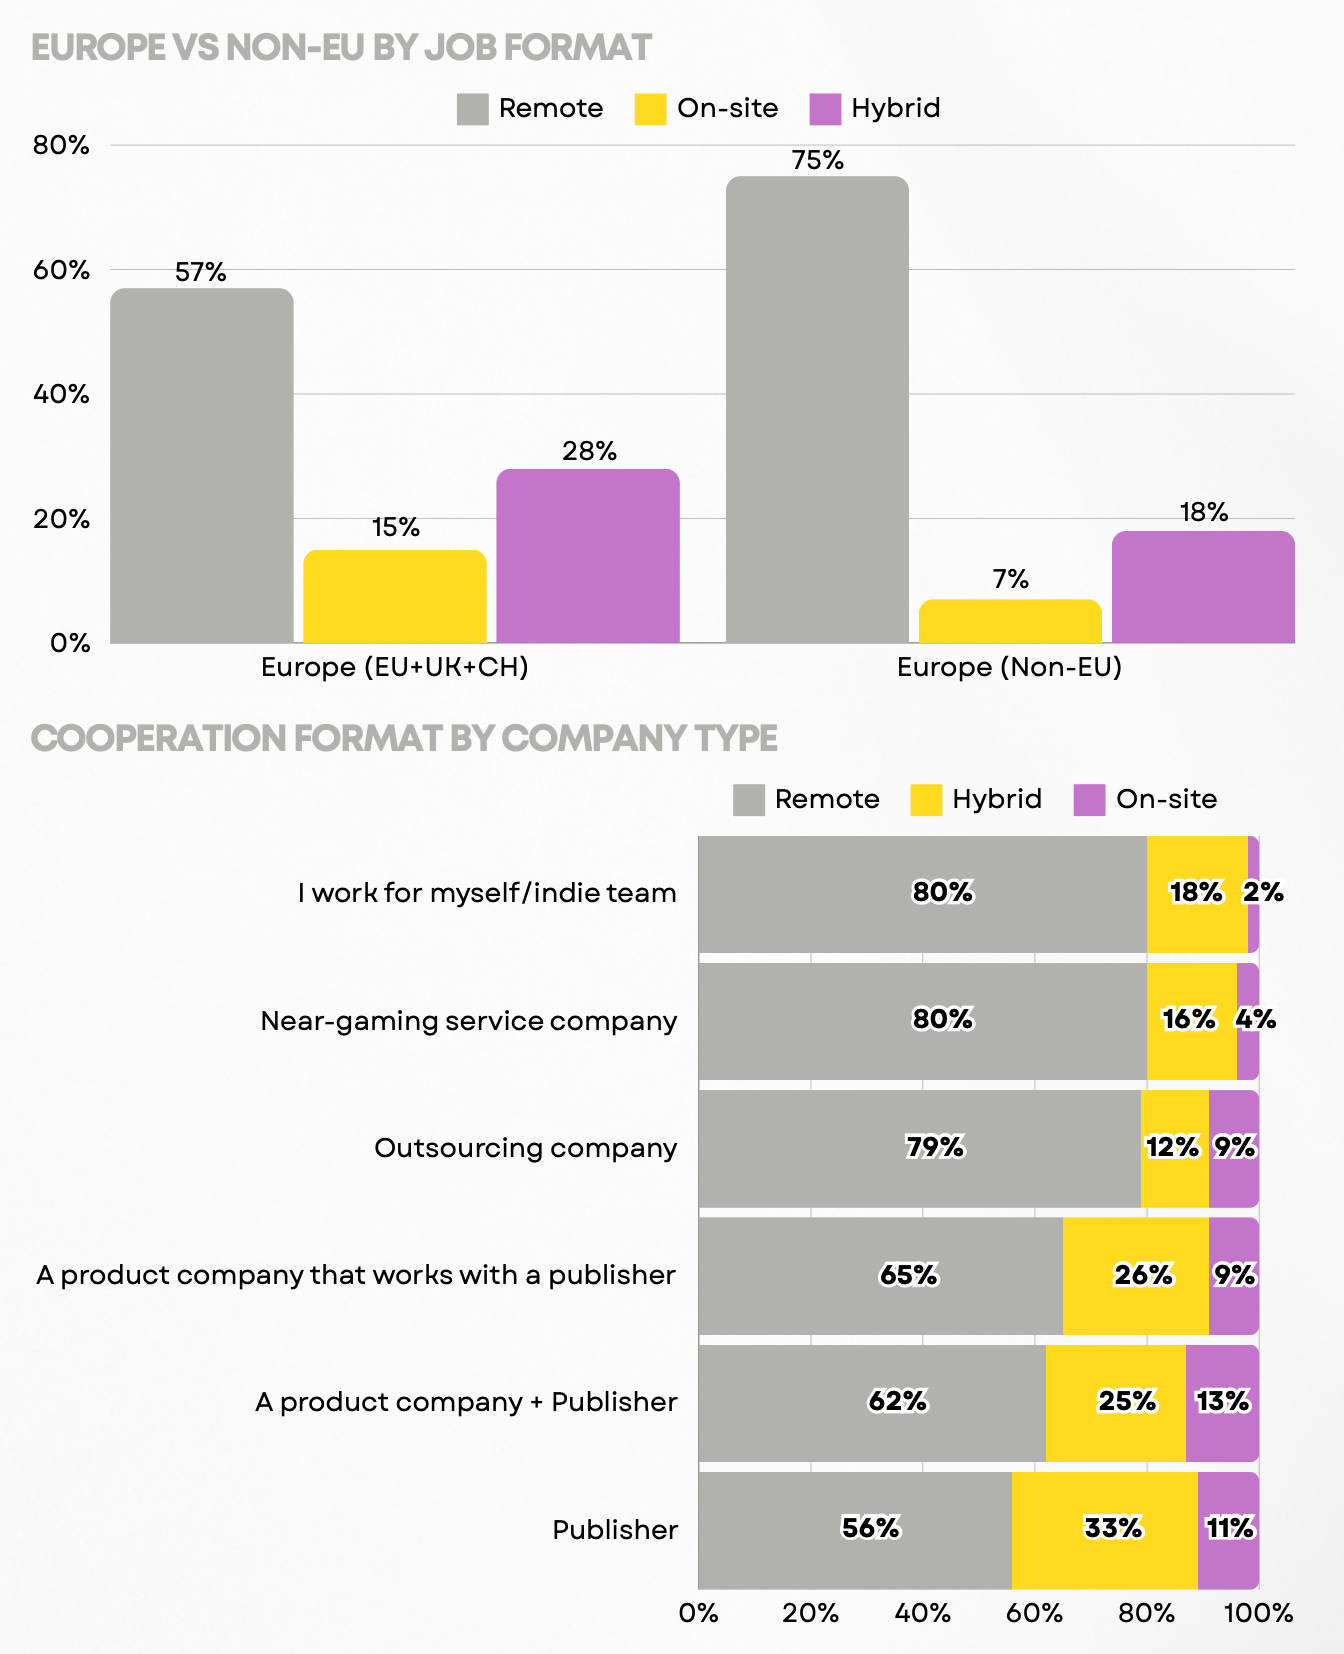
- 57% of EU companies and 75% of non-EU companies offer remote work options. Publishers and developers offer the least remote format.
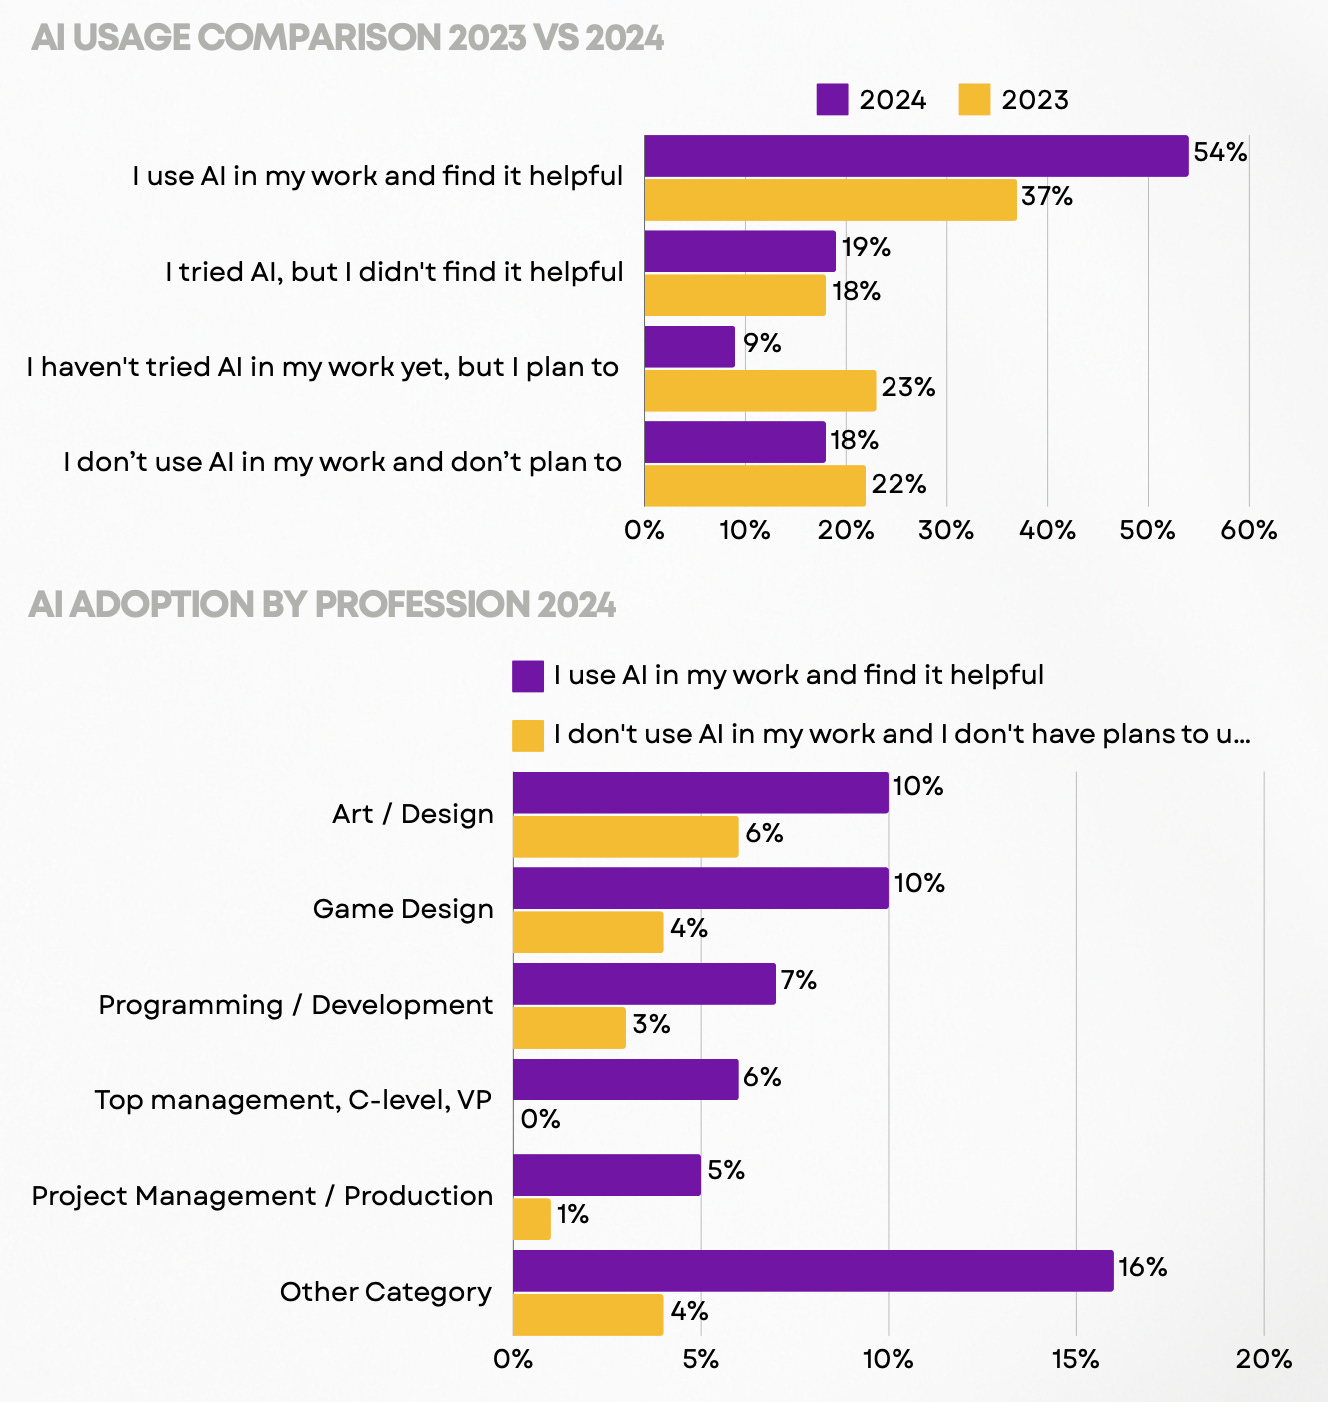
- Users' attitudes towards AI are changing significantly. The number of people who use AI at work and find it useful has increased. However, the percentage of people for whom AI is not useful has increased by 1% compared to 2023. Artists/designers and game designers use AI the most.
Job Changes and Layoffs
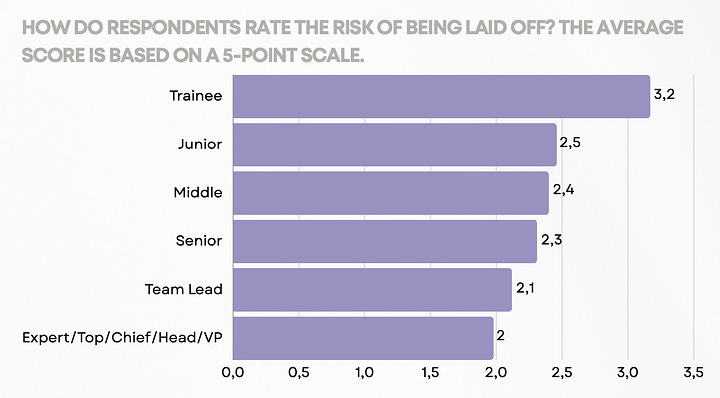
- The lower the classification level, the higher the probability of being laid off - according to employees themselves.
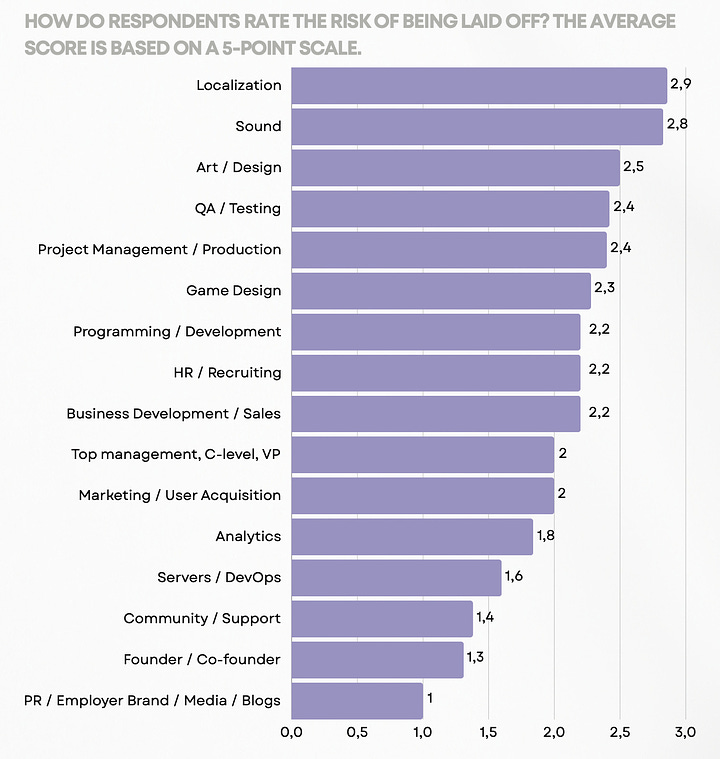
- Localization workers, sound specialists, artists, QA specialists, and project management representatives express the greatest concern about their future. People from PR and media worry the least.
- Men and women equally assess their risks of being laid off.

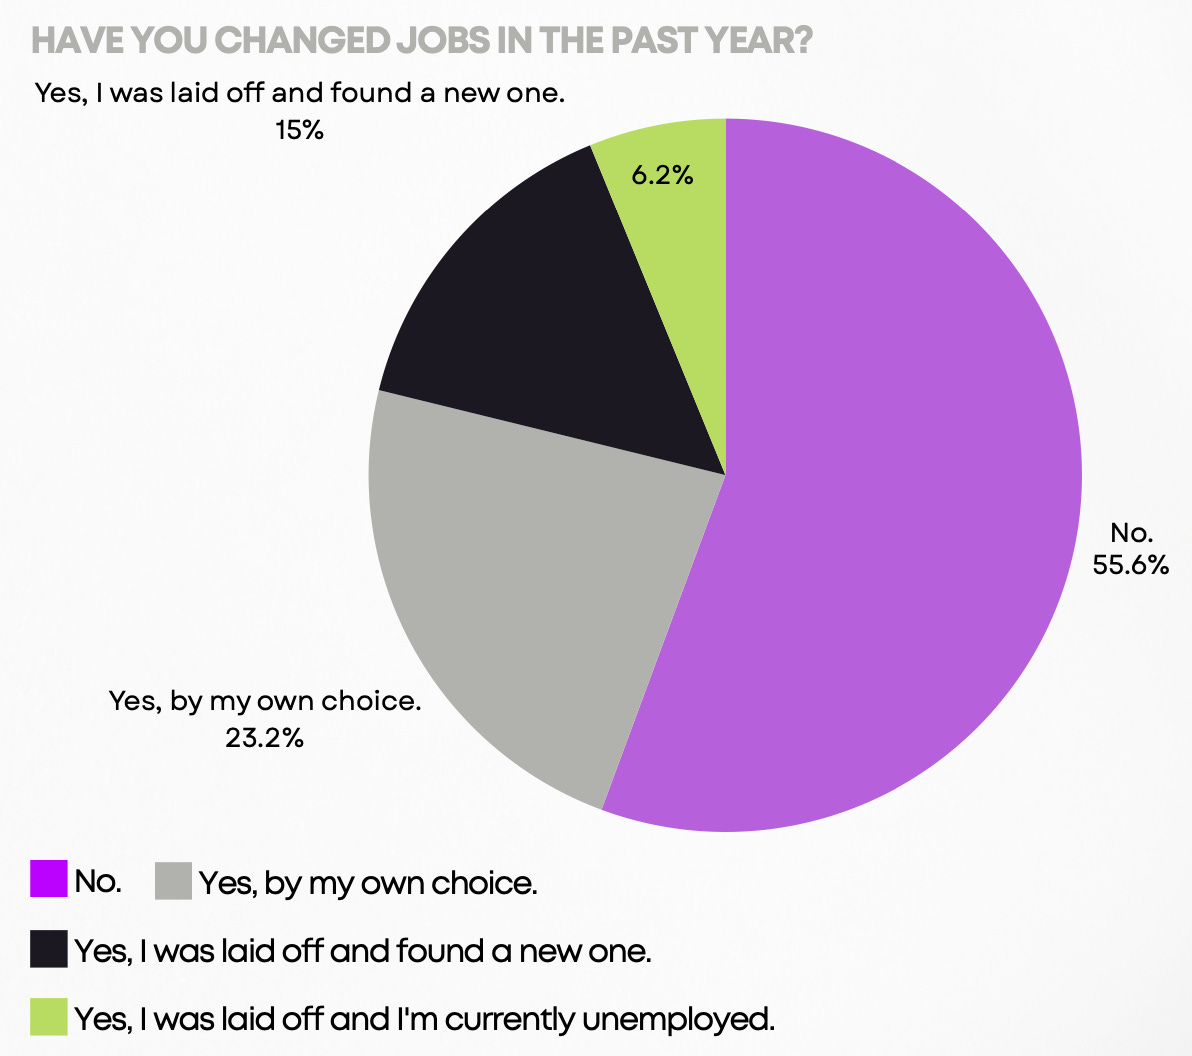
- 55.6% of respondents did not change jobs in the last year. 23.2% changed voluntarily. 15% were laid off and found a new place. 6.2% were laid off and haven't been able to find new work yet.
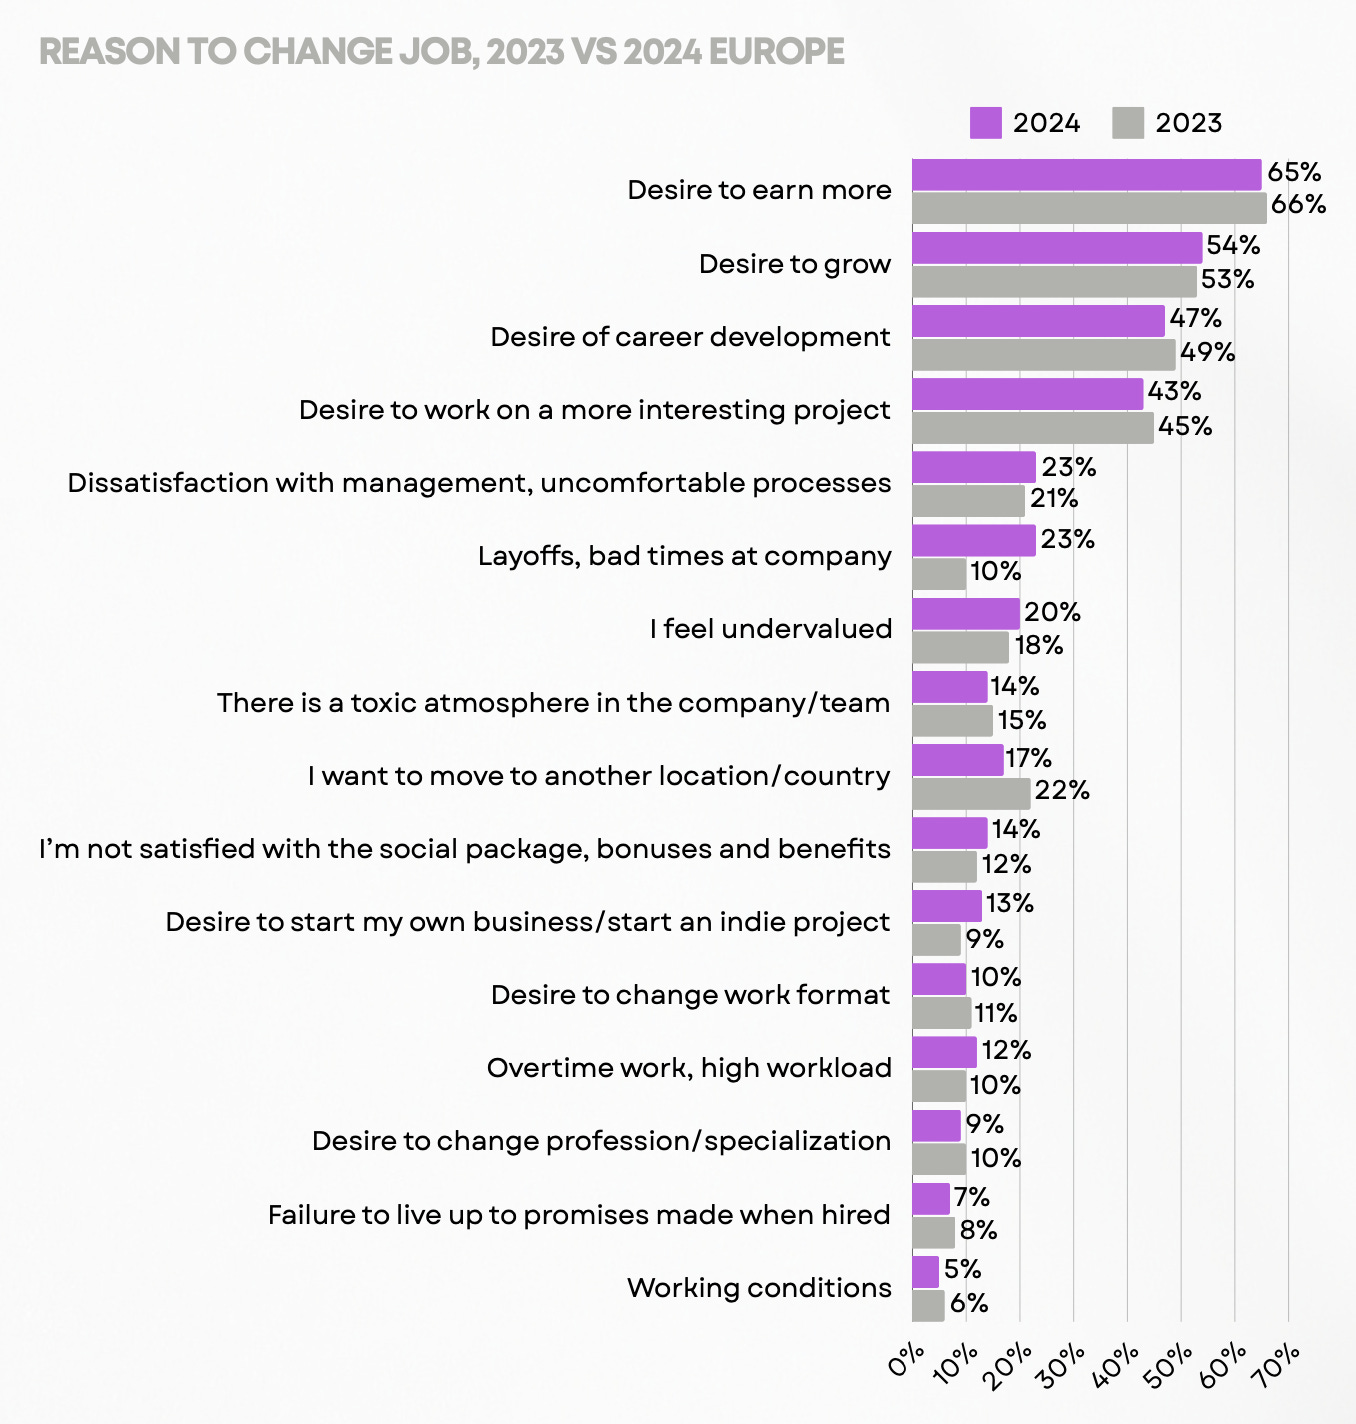
- The main reasons for changing jobs are - desire to earn more (65-66%), desire for professional growth (53-54%), desire for career growth (47-49%), desire to work on more interesting projects (43-45%).
- 55.2% look for work for up to 3 months; 24.4% - from 3 to 6 months; 12.3% - from 6 months to a year; 8.1% - more than 1 year.
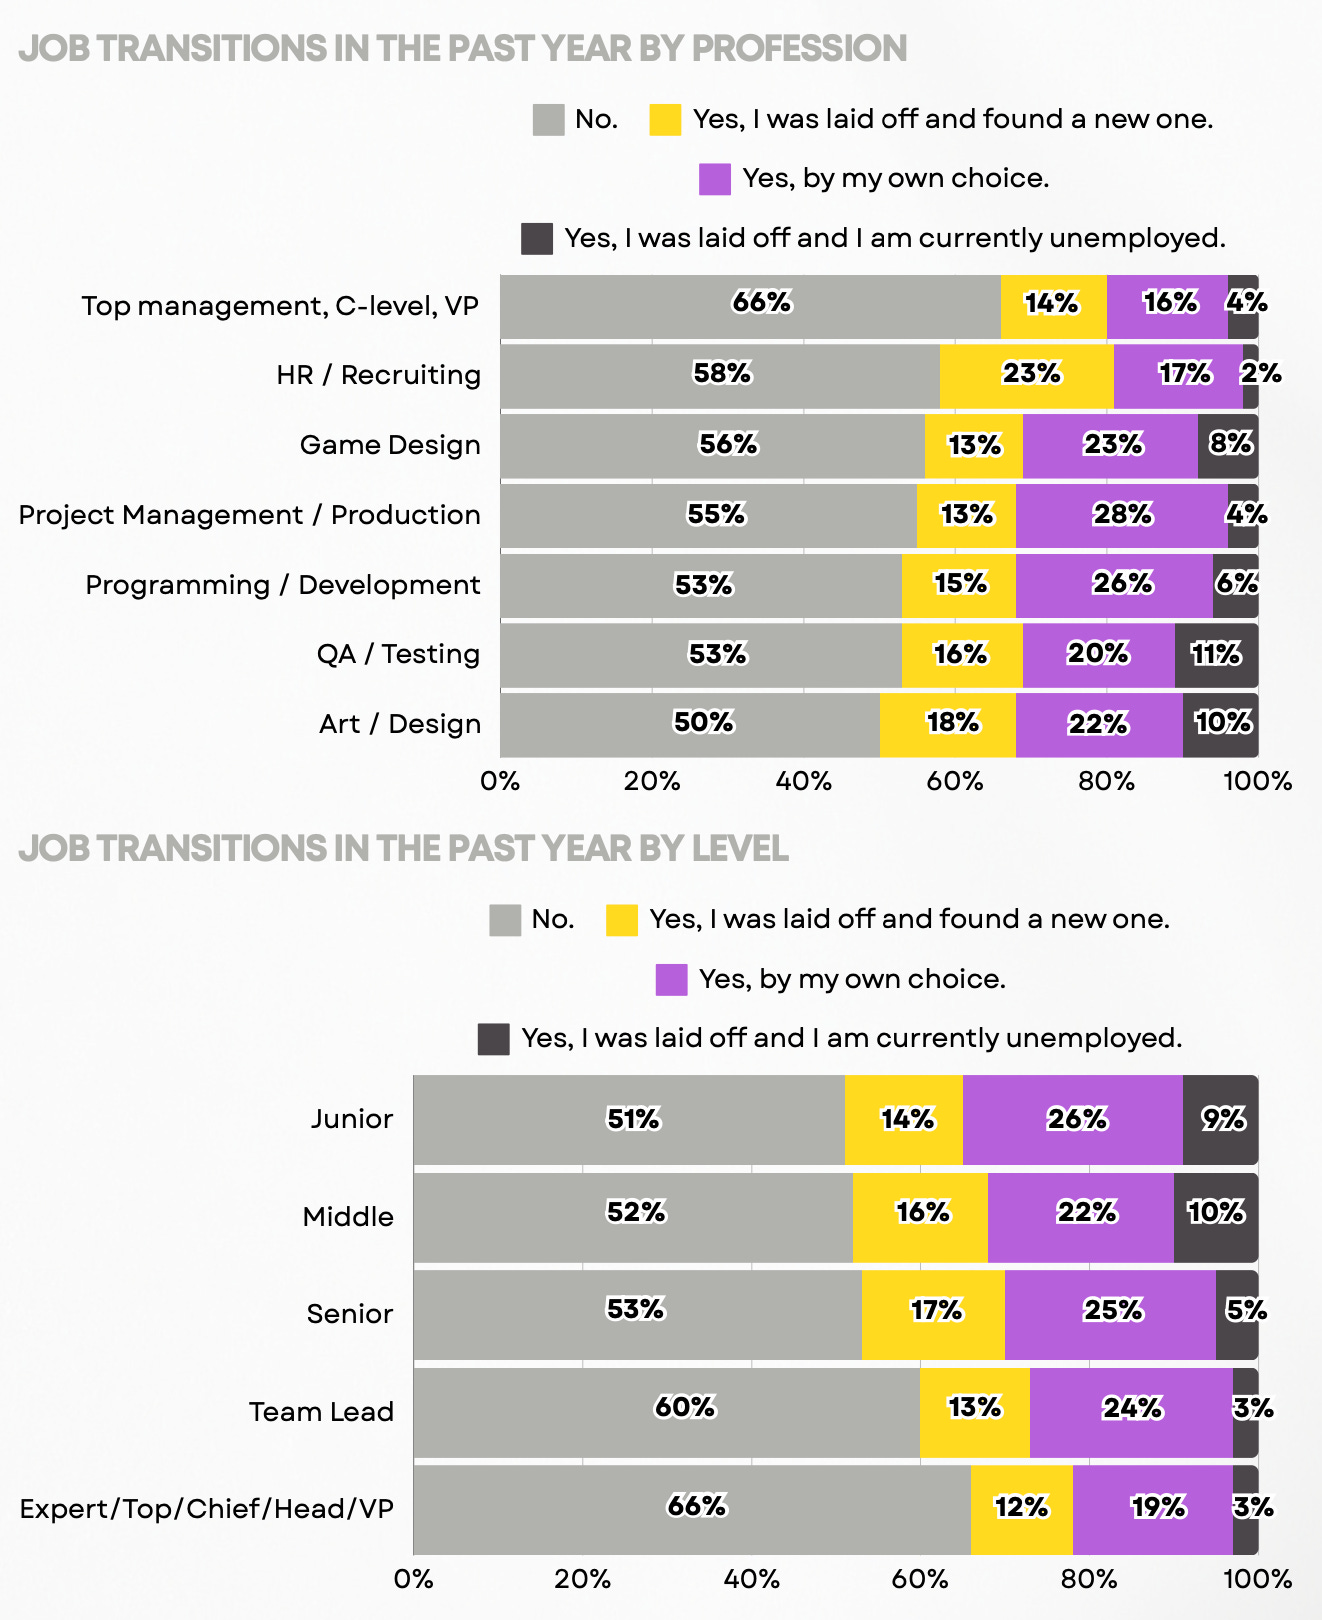
- Top managers and people from project/product management spend the least time job searching. QA specialists have the most difficulty.
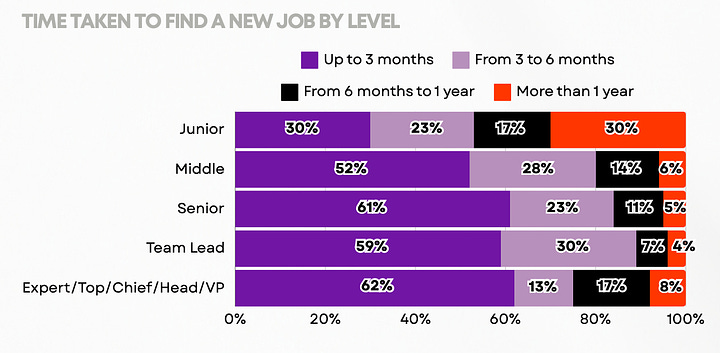
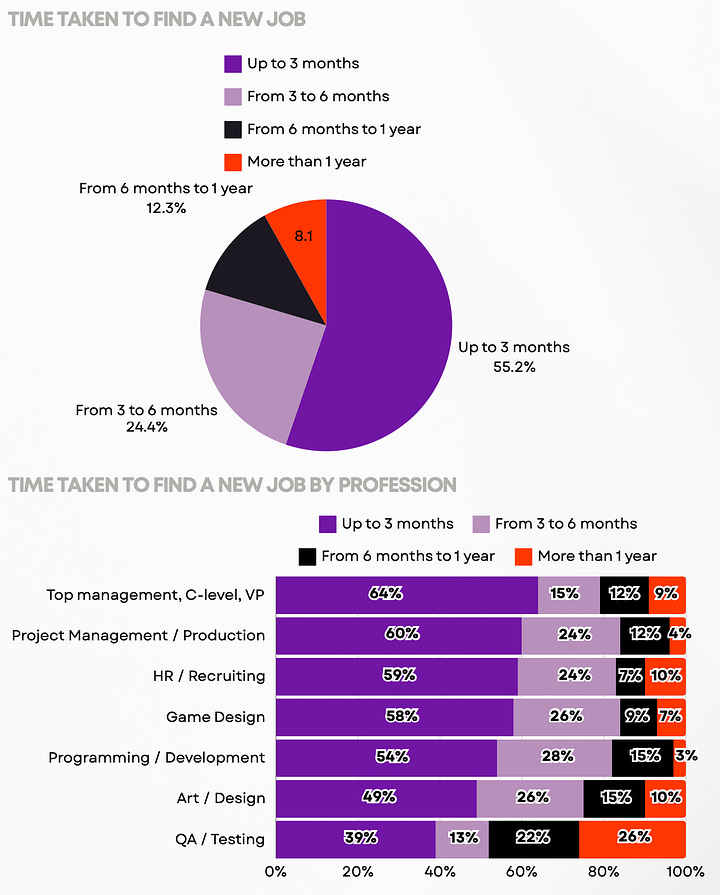
- Junior specialists take the longest to find a job.
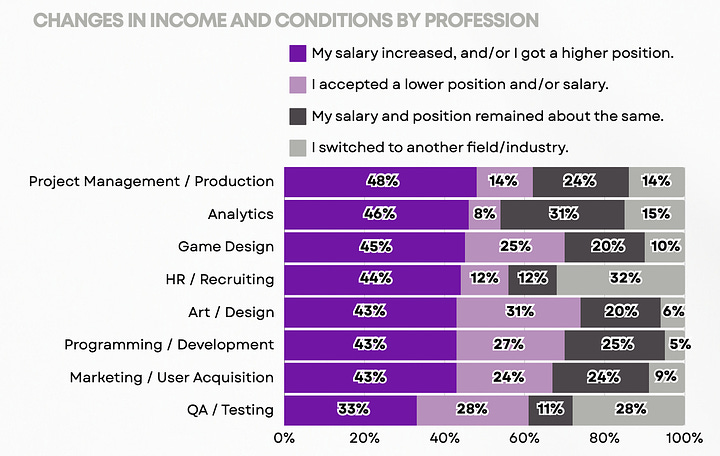
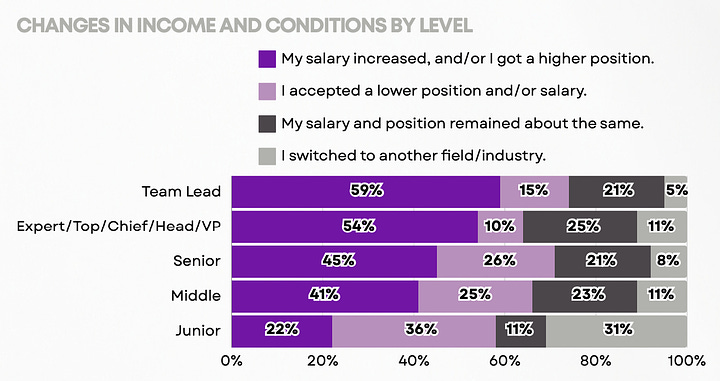
- A third of Junior specialists left the gaming industry after leaving or being laid off from their current jobs. Among Middle and higher specialists, no more than 11% did so. A quarter of Middle and Senior specialists agreed to a salary reduction.
Physical and Mental Health in the Gaming Industry
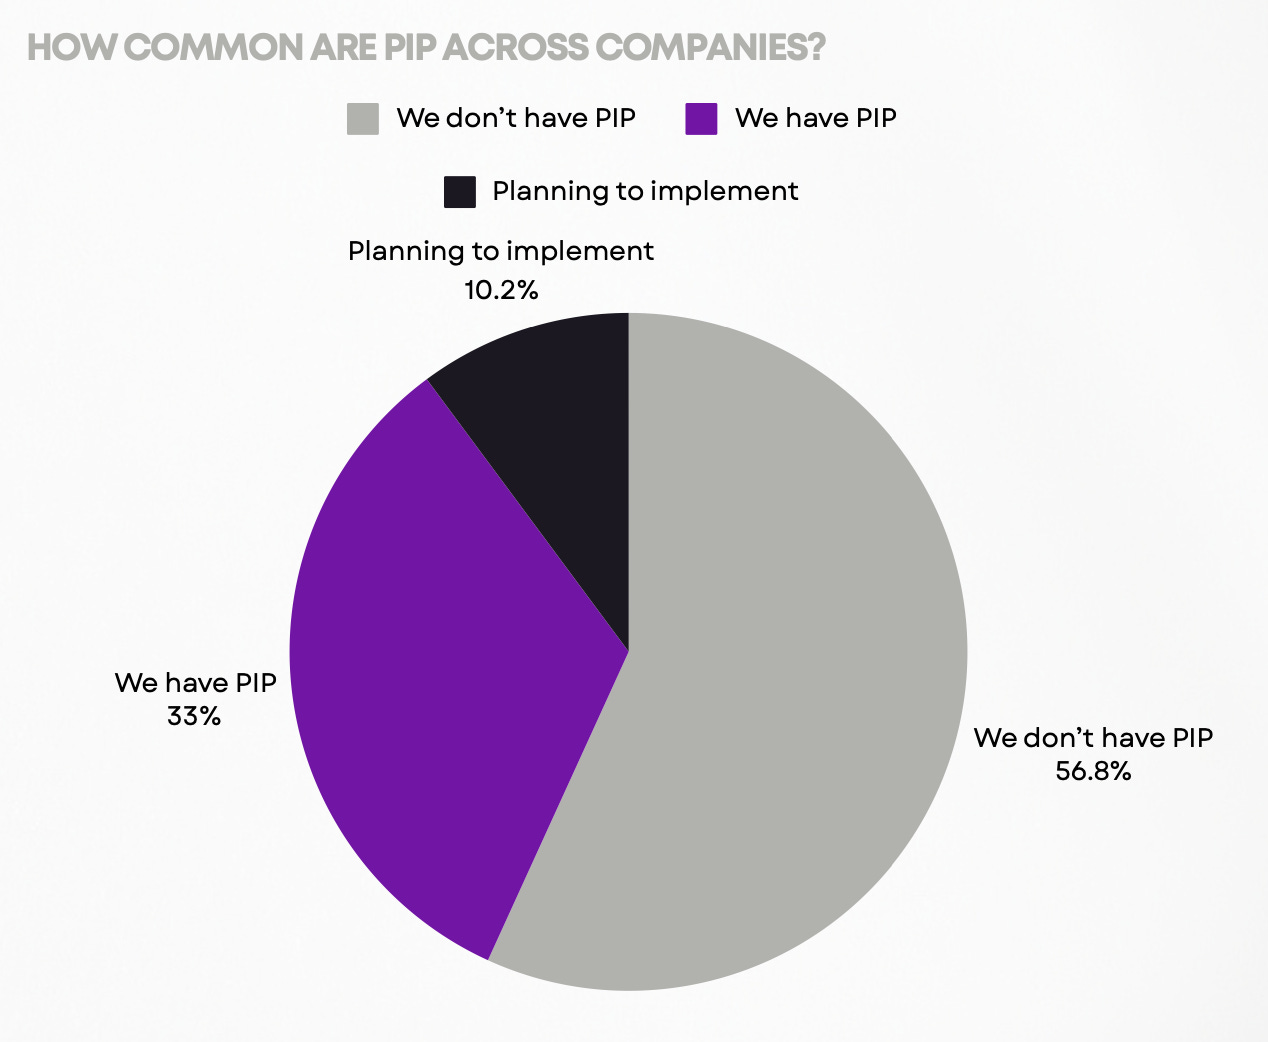
- 33% of gaming companies have employee development plans. 10.2% plan to integrate them.
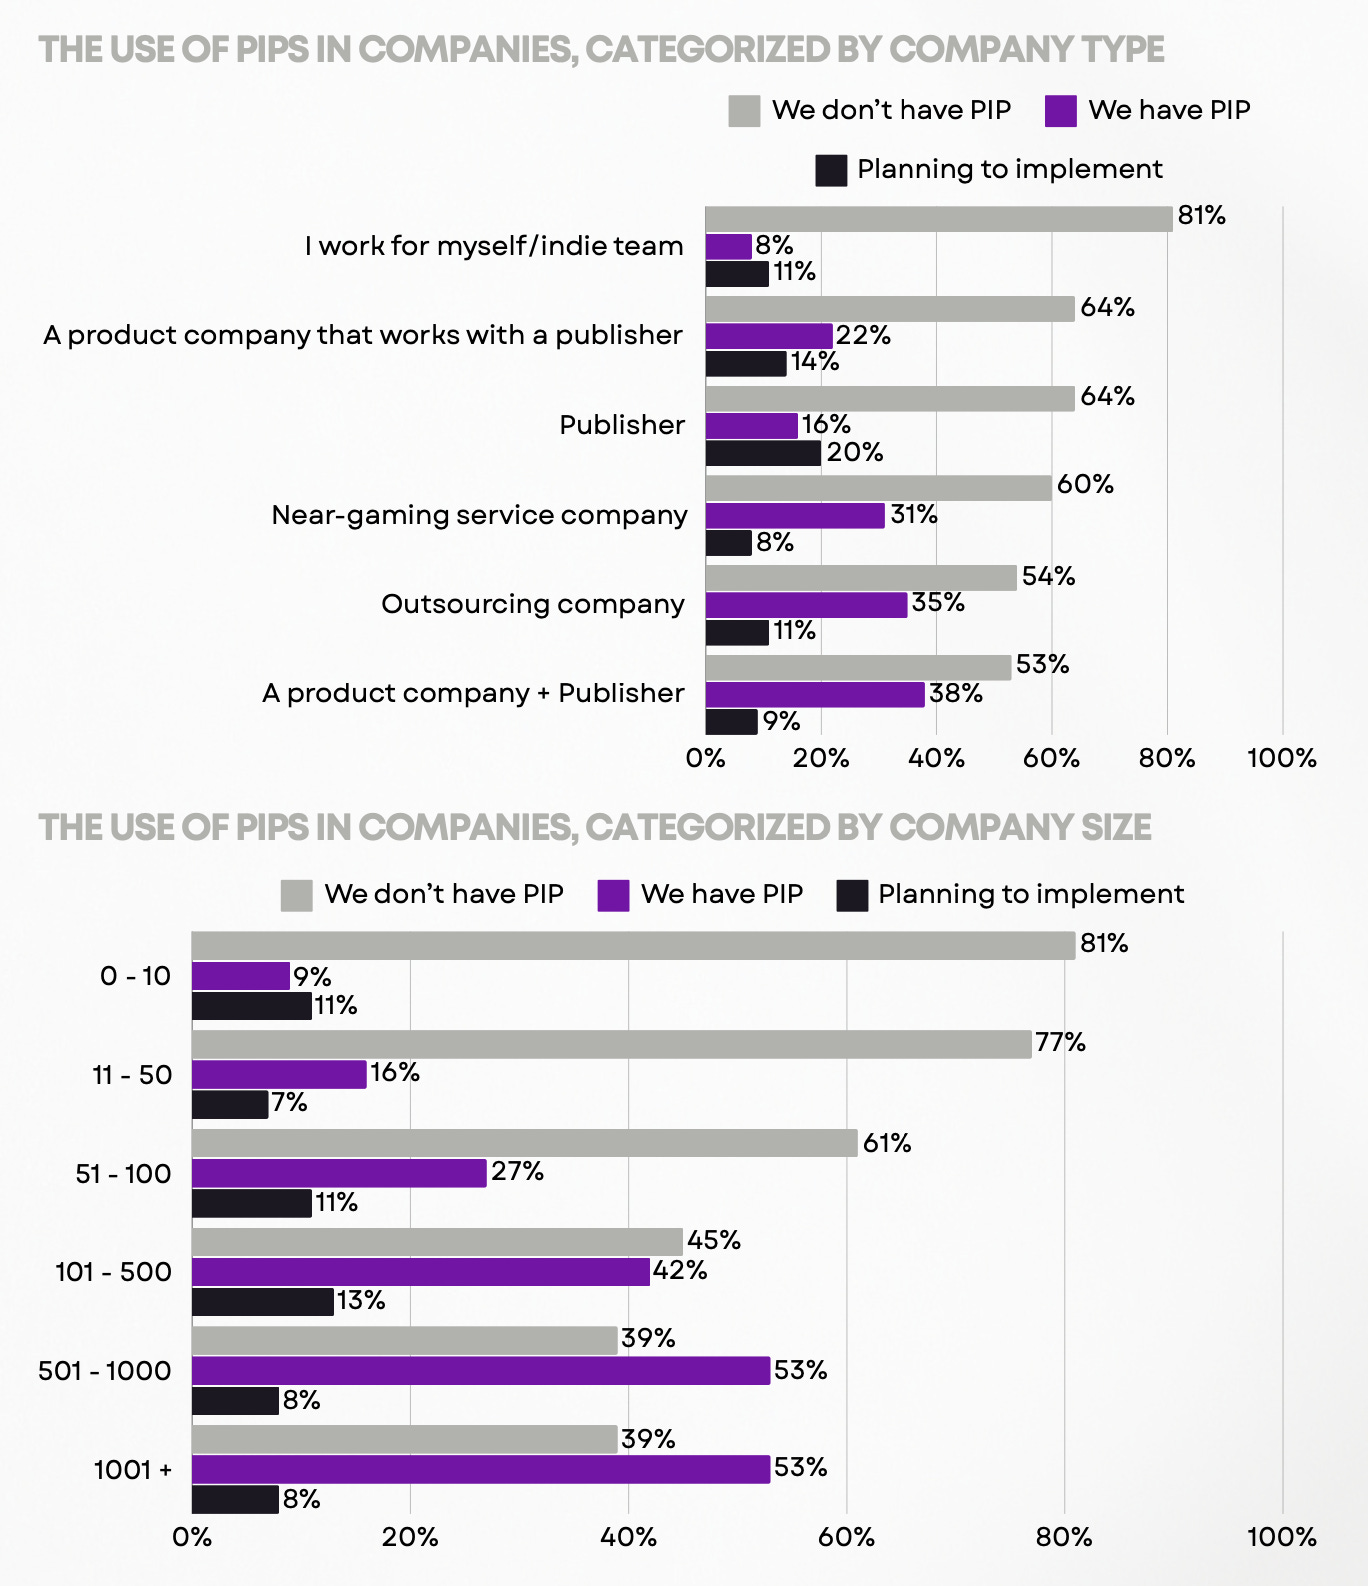
- Product companies, publishers, and non-gaming service companies have the most employee development programs. There is a direct correlation with company size (larger companies have programs).
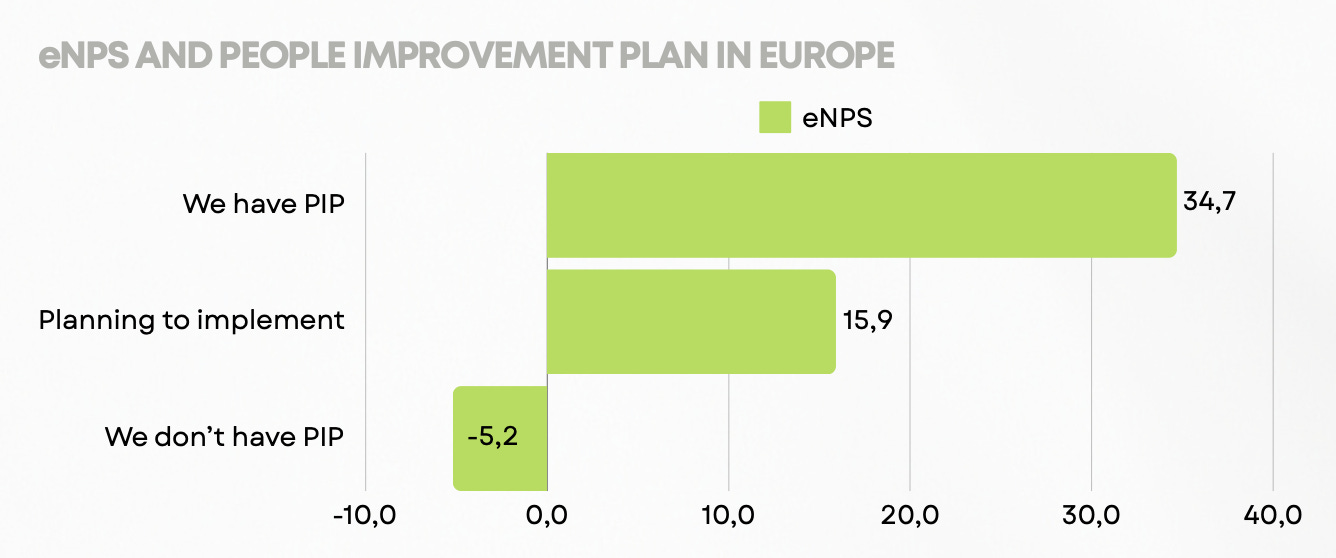
- In companies where employee development systems exist or are planned, employee loyalty and job satisfaction are higher.
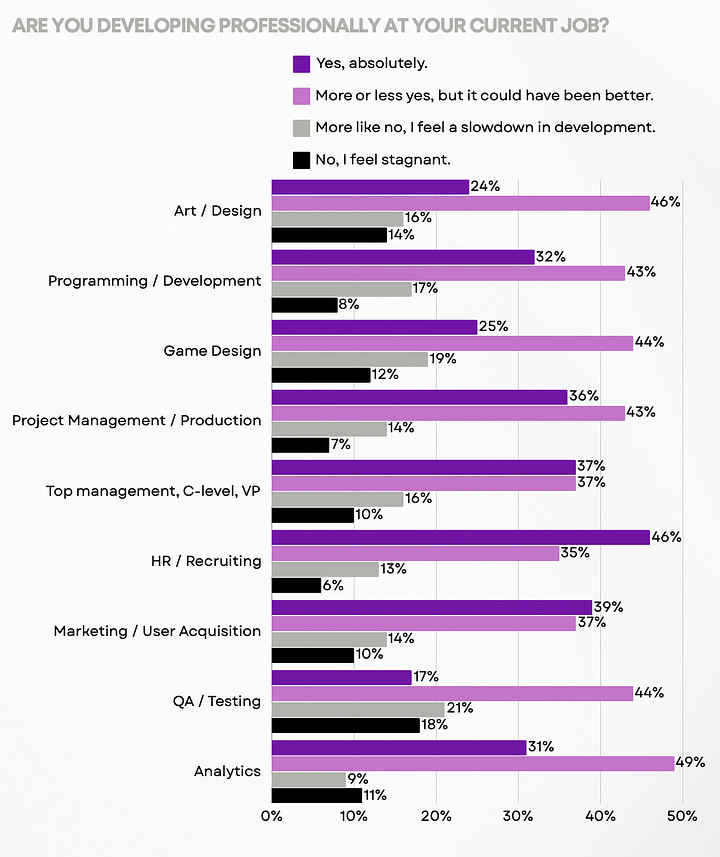
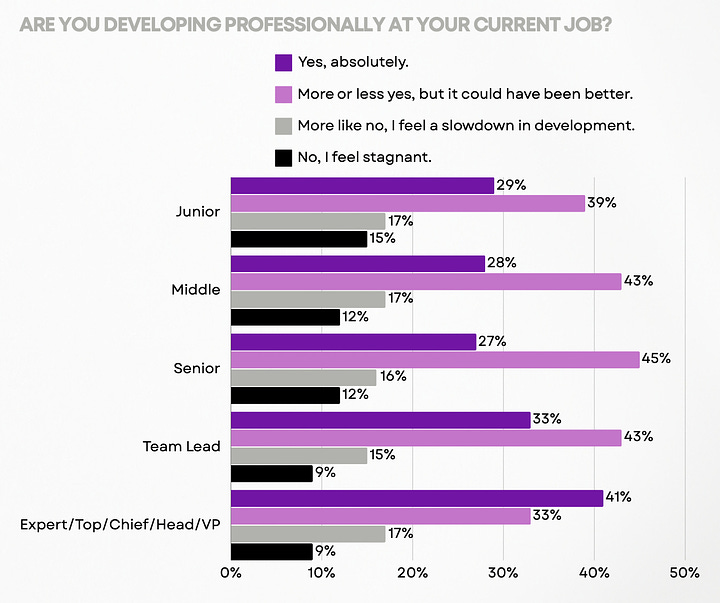
- Interestingly, top management representatives feel their development best. Juniors, more often than others, feel they are stagnating.
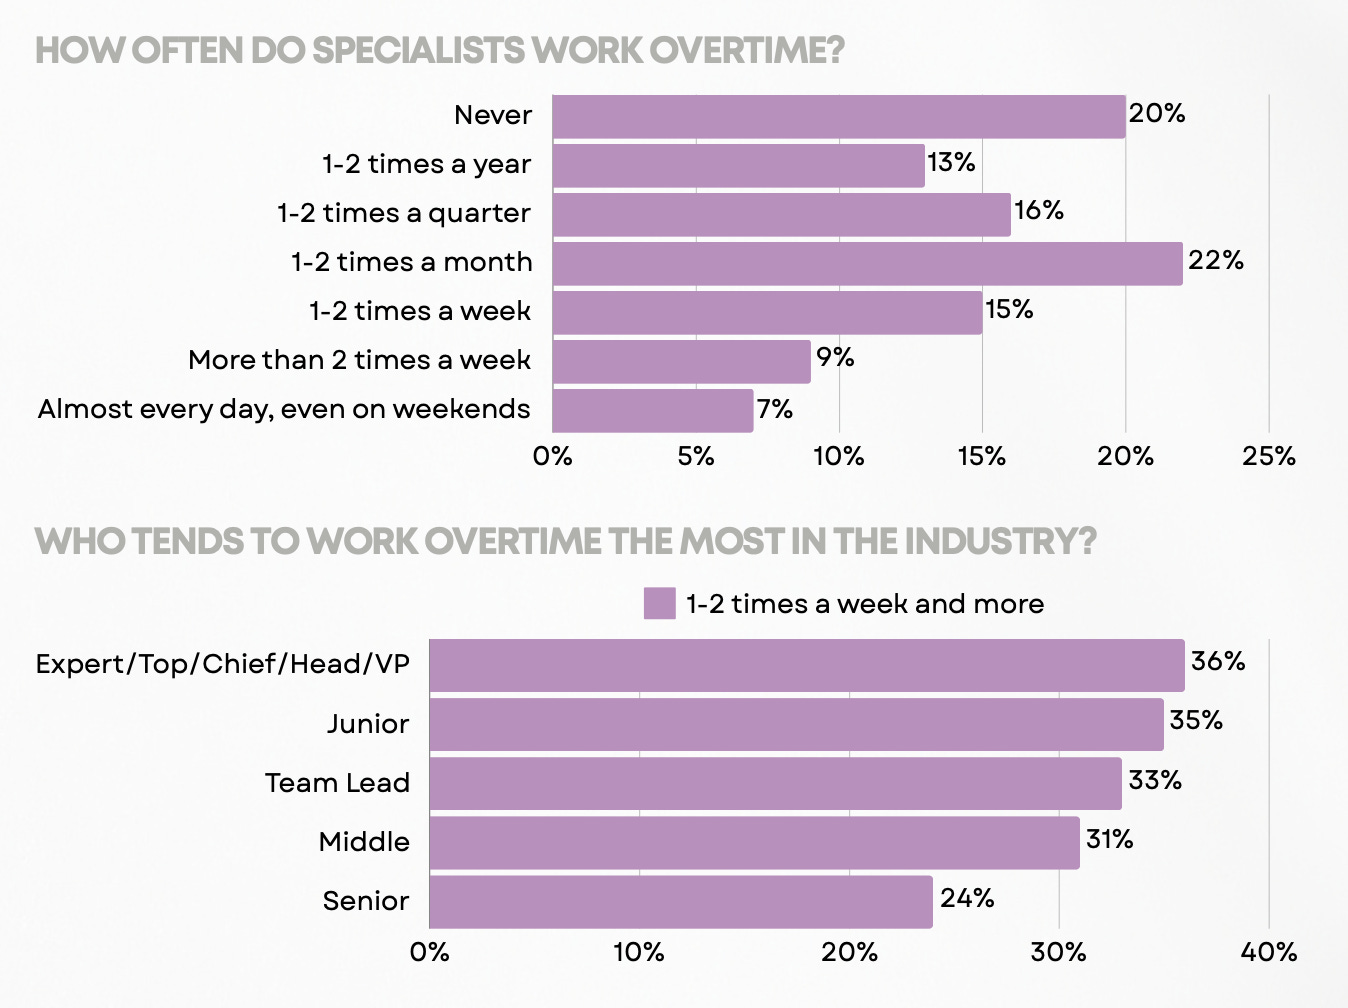
- 31% of workers work overtime more than once a week. Top management and Junior specialists have the most frequent overtime.
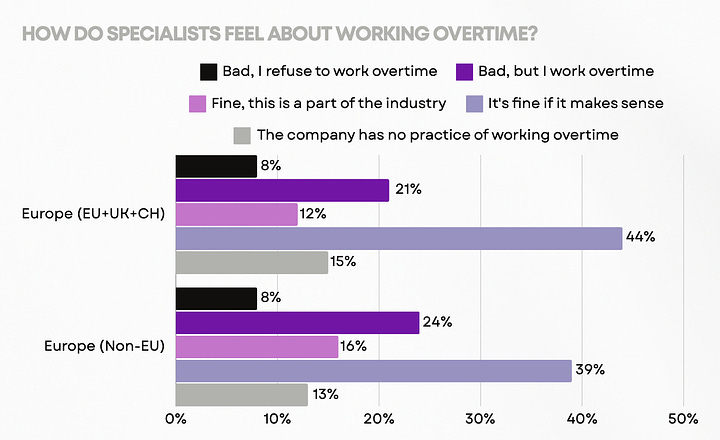
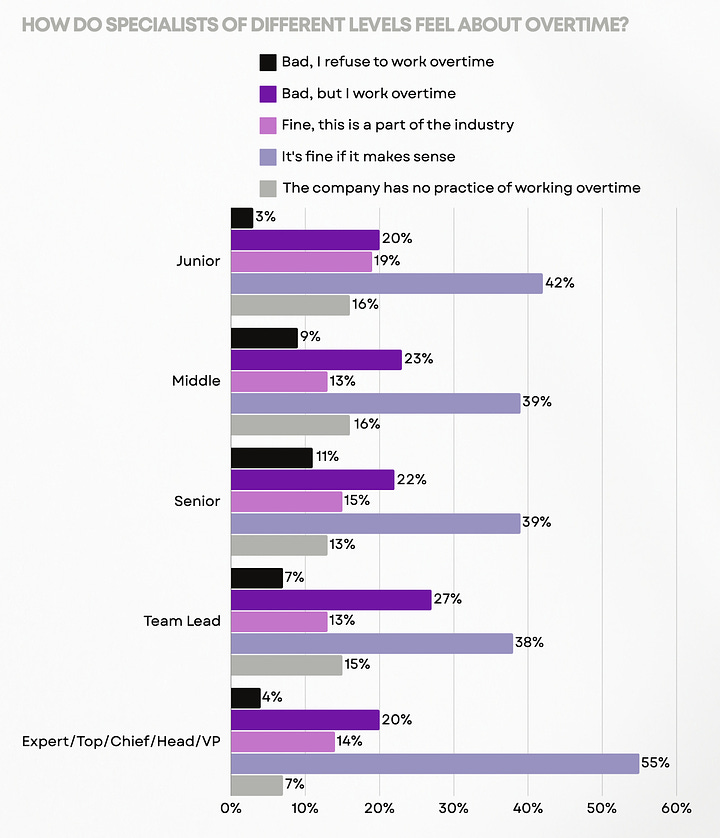
- More than a third of employees are okay with overtime if it makes sense. 8% refuse overtime.
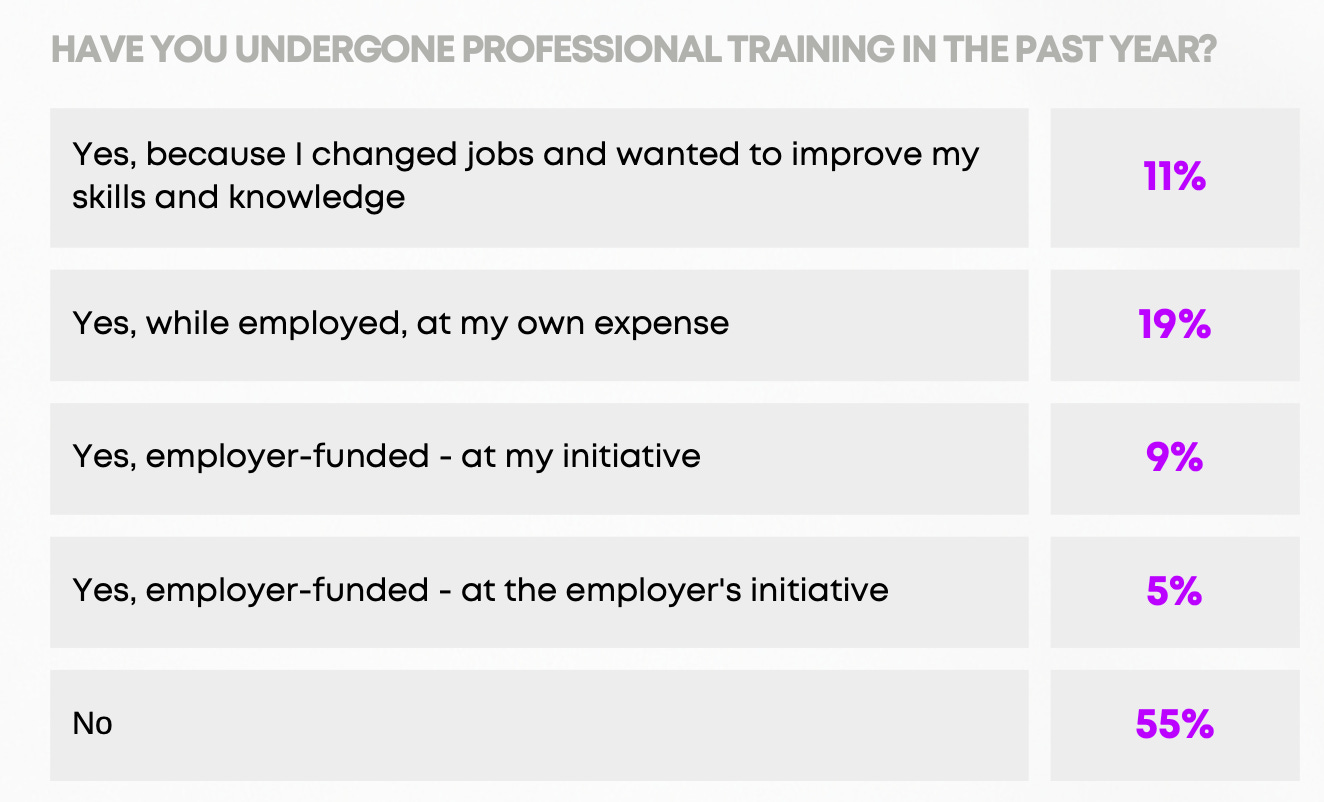
- 55% did not undergo any professional training in the last year. Only 14% of employees had their training paid for by companies.
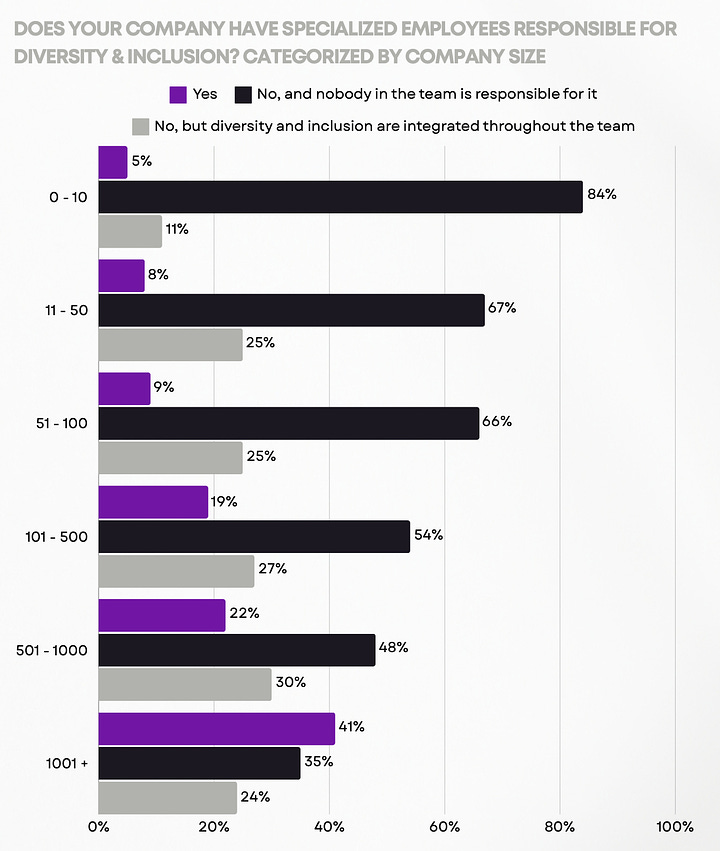
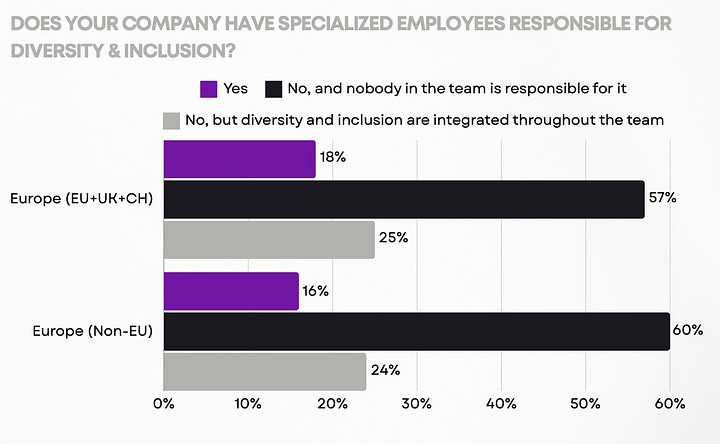
- Most companies don't have inclusivity specialists. More than half of the companies have no such plans.
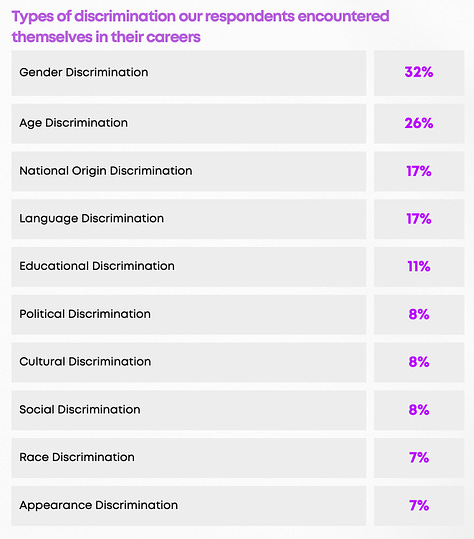
- 32% of employees have faced gender discrimination; 26% - age discrimination; 17% - discrimination based on place of birth; 17% - language discrimination.
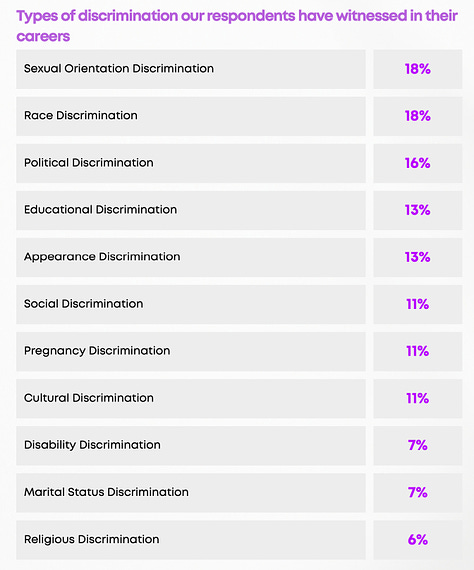
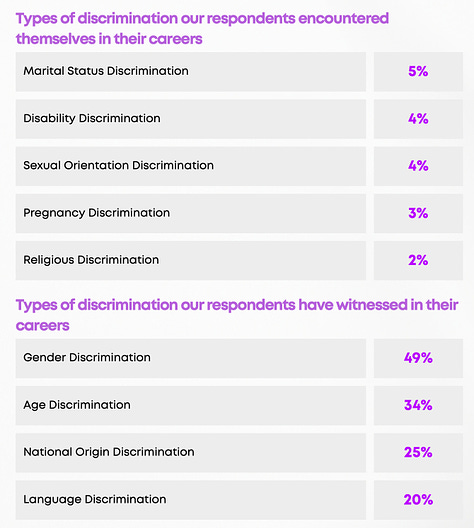
- However, half (49%) observed gender discrimination; 34% - age discrimination.
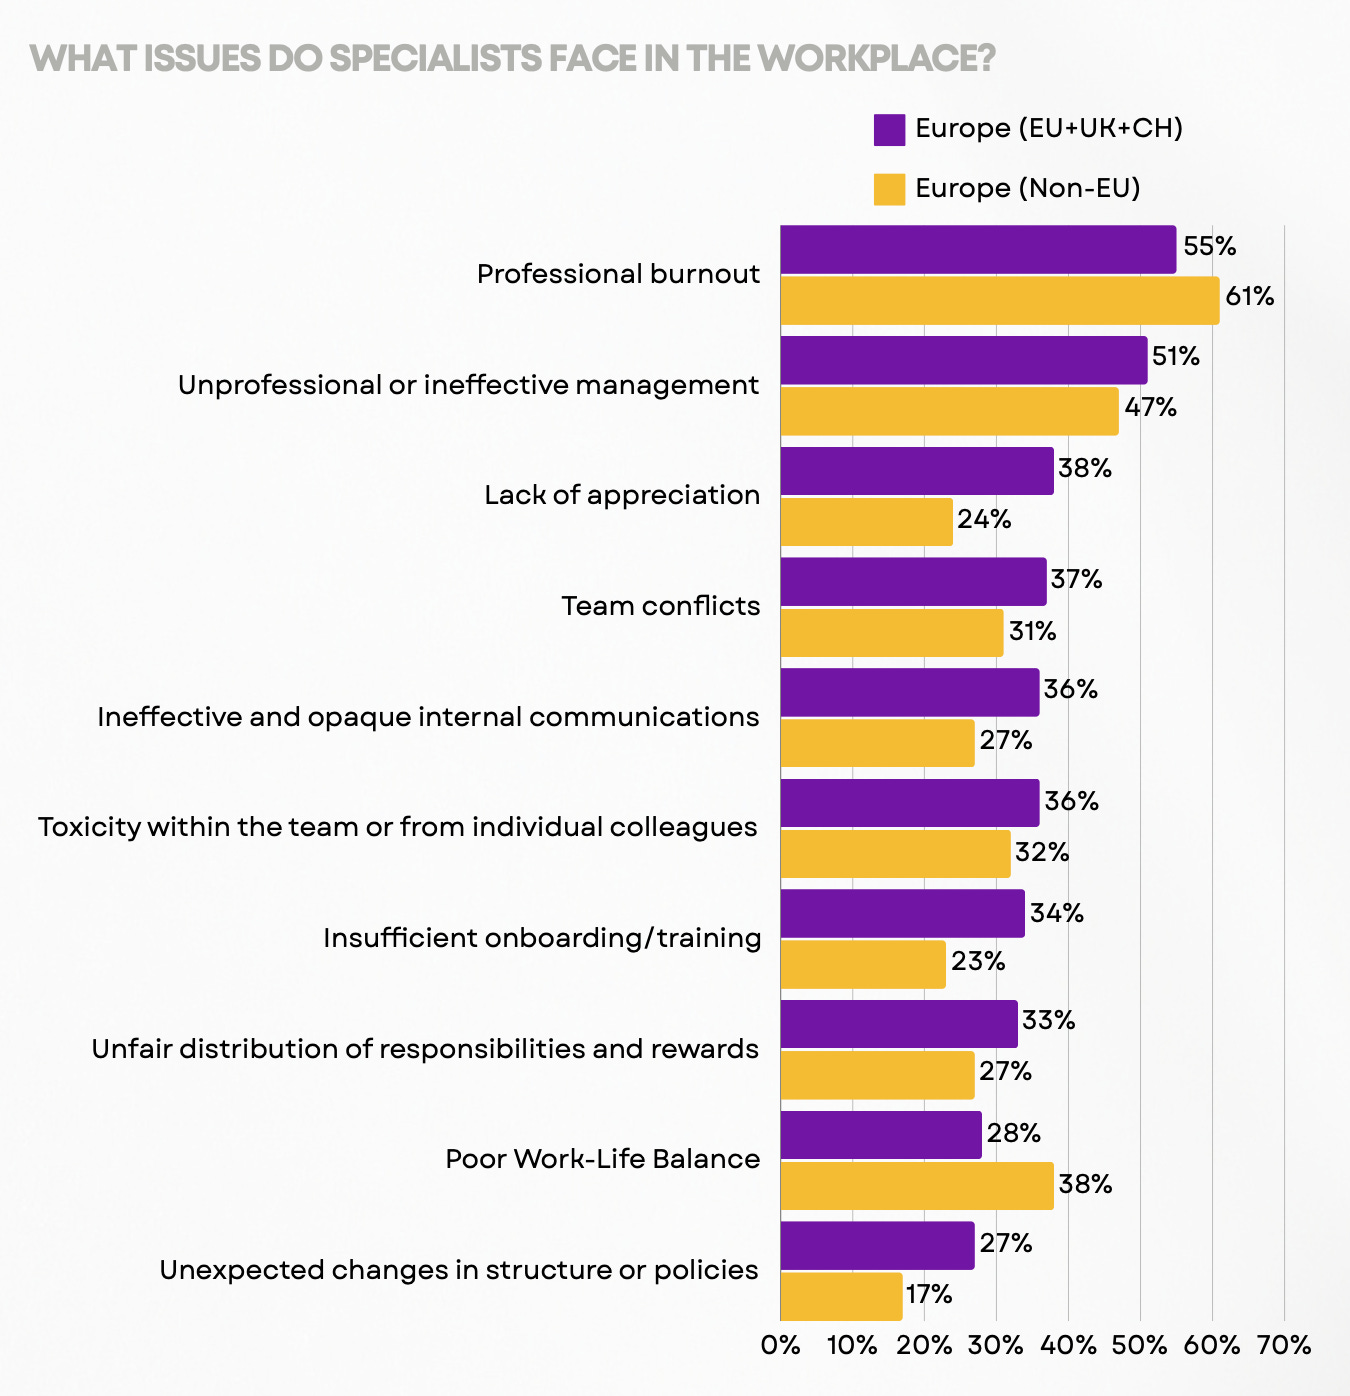
- The most important problems for employees in the workplace are burnout (more than half of employees noted this) and unprofessional or ineffective management (half of employees noted this as a problem).
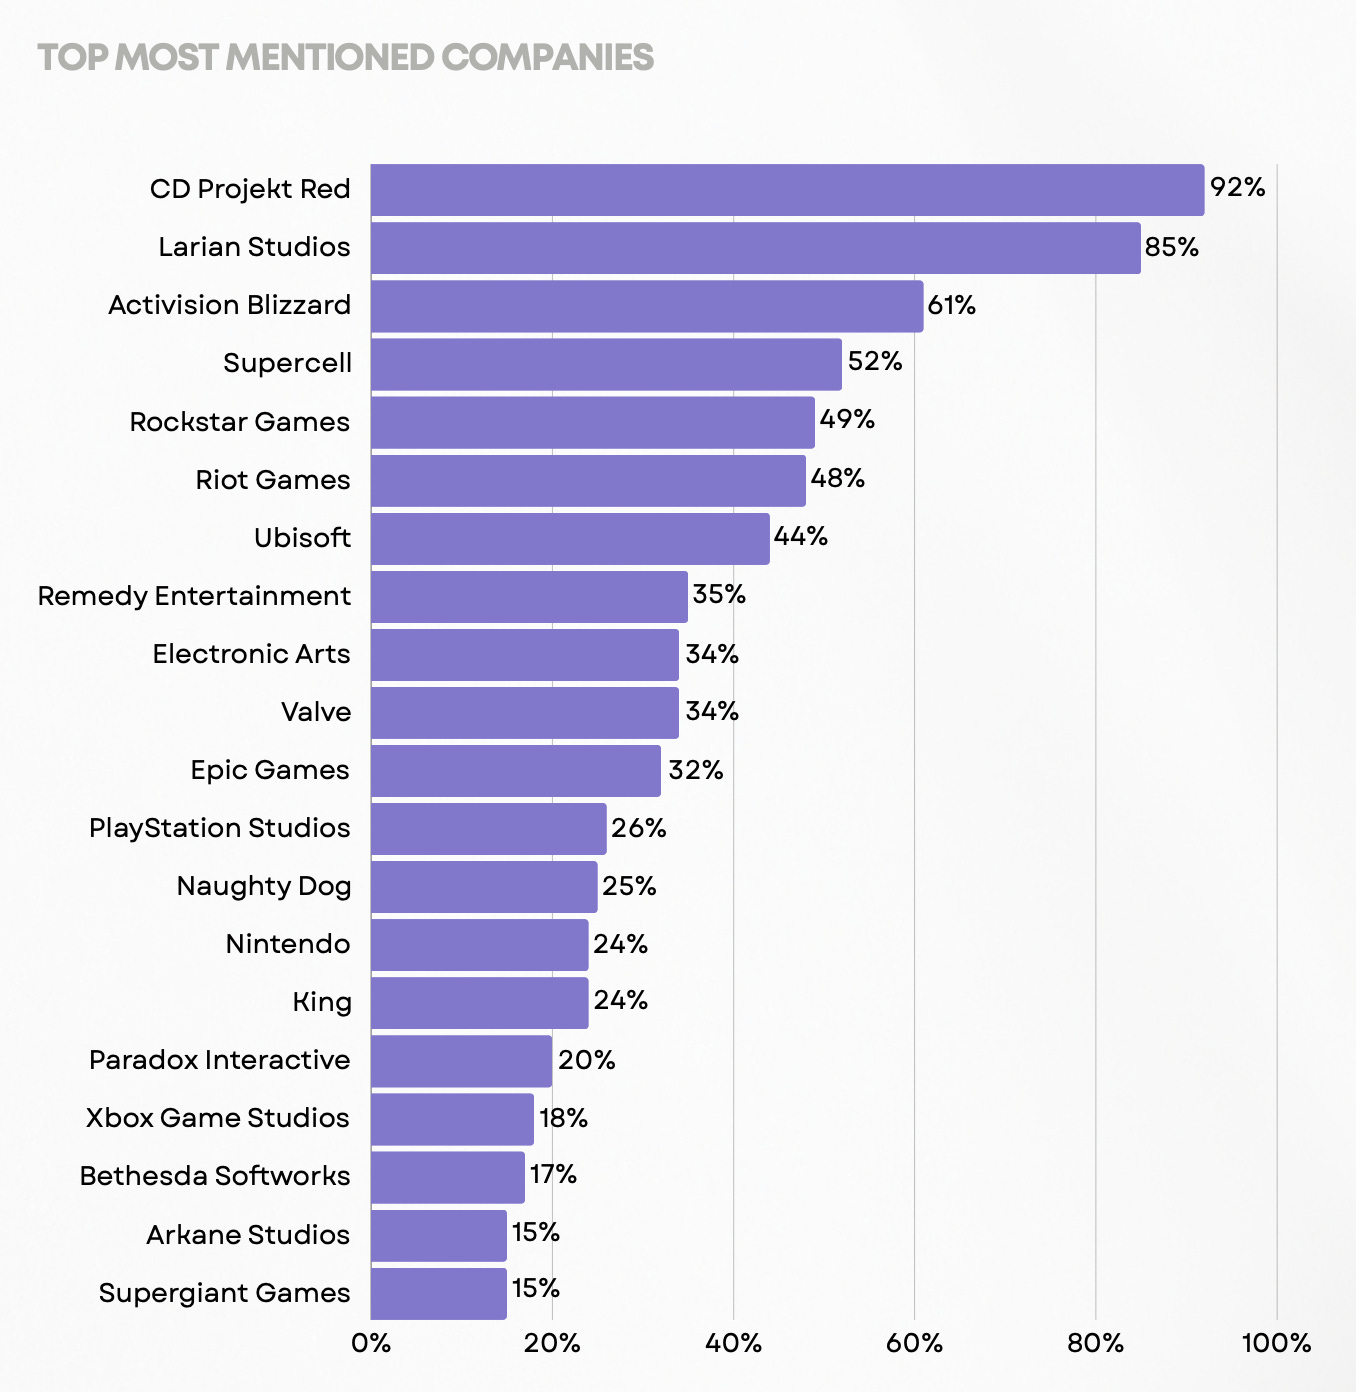
- 92% of respondents would like to work at CD Projekt RED, 85% - at Larian Studios.
TIGA: The UK Gaming Industry stays resilient and continues to grow
- Over the 12 months from April 2023 to May 2024, the UK gaming industry grew by 4.8% YoY.
- More than 28,500 people in the UK are professionally involved in game development. Of these, 3,625 are freelancers (their number has increased more than 3 times, apparently, companies are switching to contract work to optimize costs). Overall, the number of people employed in the UK gaming industry increased by 13.9%.
- The number of new jobs exceeded the number of layoffs. From April 2023 to May 2024, 3,932 full-time vacancies were opened. During the same period, 2,353 positions were cut.
- The number of game studios in the UK decreased from 1,801 in April 2023 to 1,757 in May 2024.
- 248 gaming companies decided to close during the survey period. This is 10.4% of all gaming companies in the country - a record (anti-record?).
- In the period from April 2023 to May 2024, 166 startups were launched. In the previous year, there were 251 such companies.
- Companies owned by foreign shareholders employ 62% of all workers in the UK industry.
WKO: Austrian Gaming Industry in 2024

- There are about 150 gaming companies operating in the country. This is 71.3% more than in 2018.
- In 2023, the revenue of Austrian gaming companies amounted to €188.7 million.
- Gaming companies have created around 2,260 jobs in the country.
- Most employees in gaming companies in the country are between 25 and 34 years old. 80% of them have completed university education.
- The main platforms for Austrian developers are PC and mobile devices.
- One-third of local gaming companies have applied for government support.
Lumikai & Google: Indian Gaming Market to Grow to $9.2B by 2029
Overall market state
- India's gaming market is estimated to reach $3.8 billion in 2024, accounting for 30% of the entire "new media" market, which includes video/OTT, social media, animation, and VFX services, and audio.
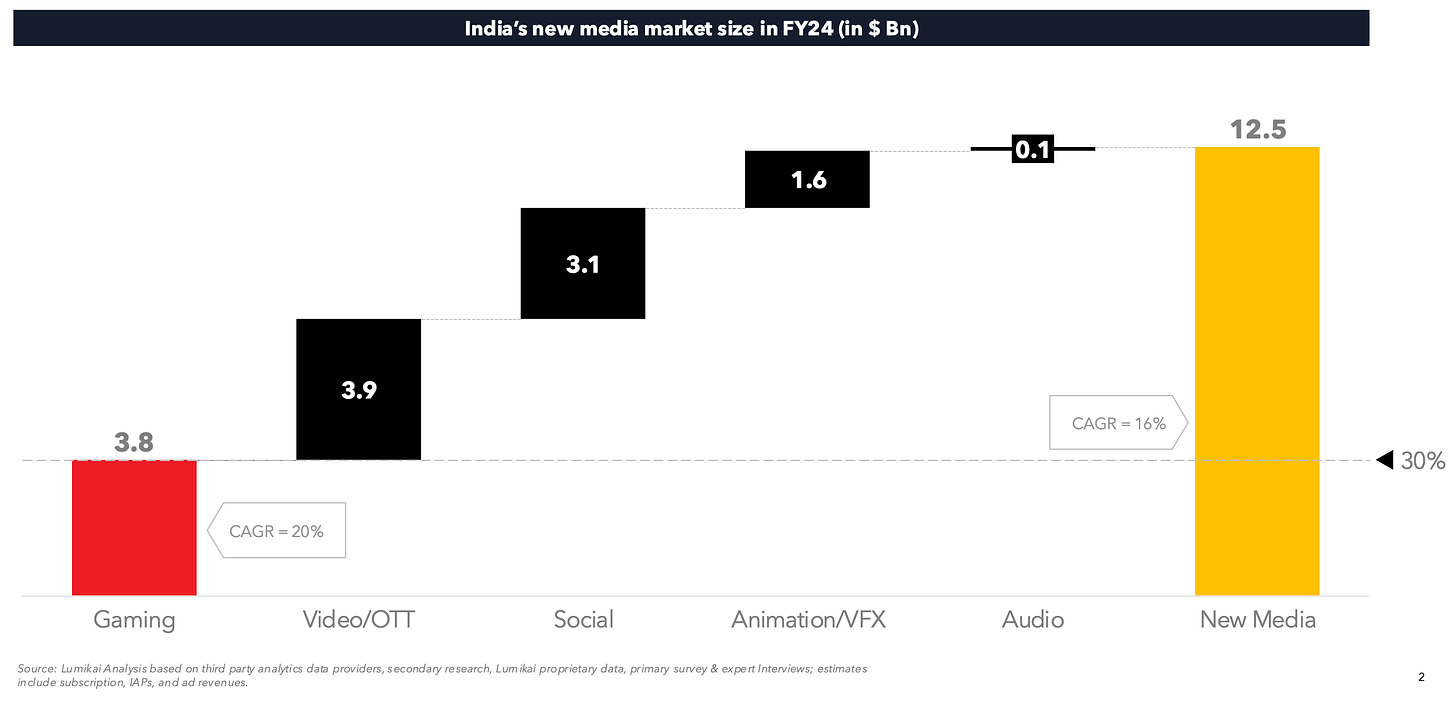
- It's important to note that as of 2024, 63% of India's gaming market consists of Real-Money Gaming.
- By the 2029 fiscal year, the Indian market is expected to reach $9.2 billion, showing a 20% 5-year compound annual growth rate (CAGR). In-game purchases will grow the fastest (44% CAGR), followed by advertising (15% CAGR). The RMG segment's growth will slow down to 8% per year.
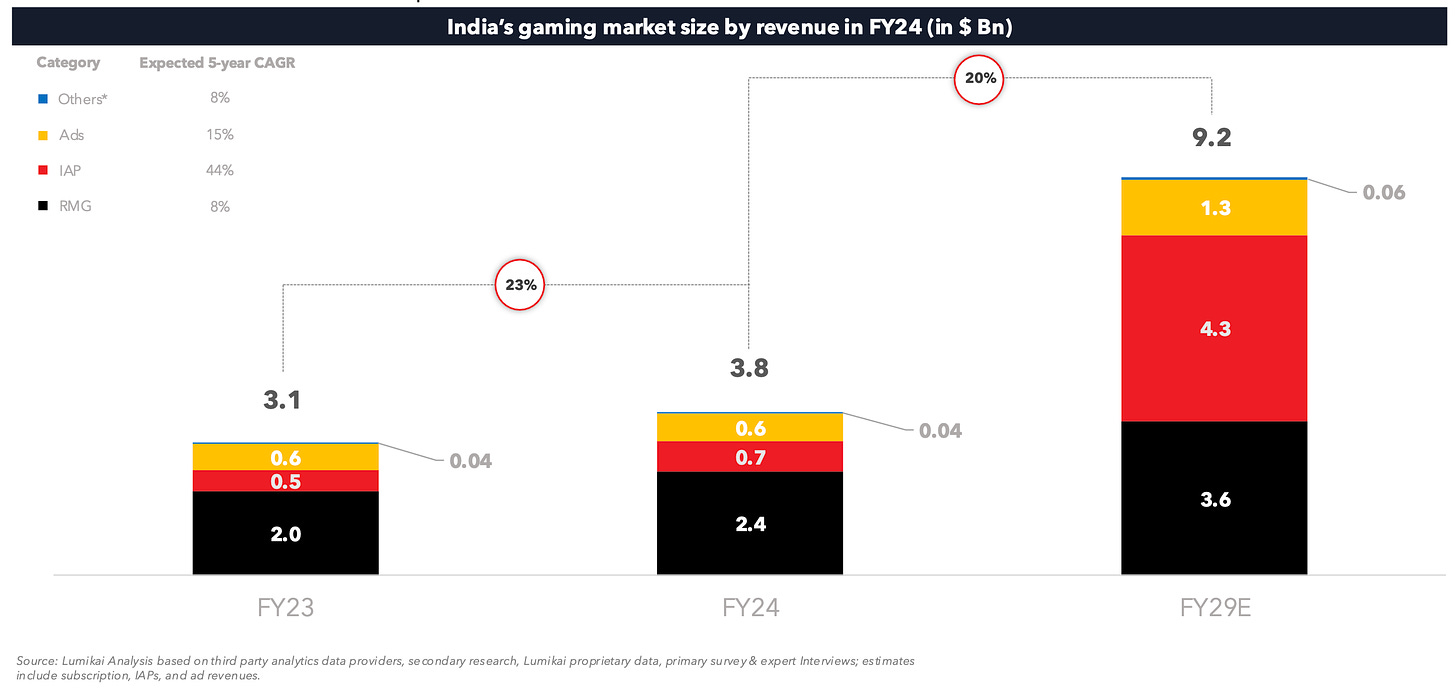
- By 2029, the size of the traditional gaming market in India is expected to be almost twice the size of the RMG segment.
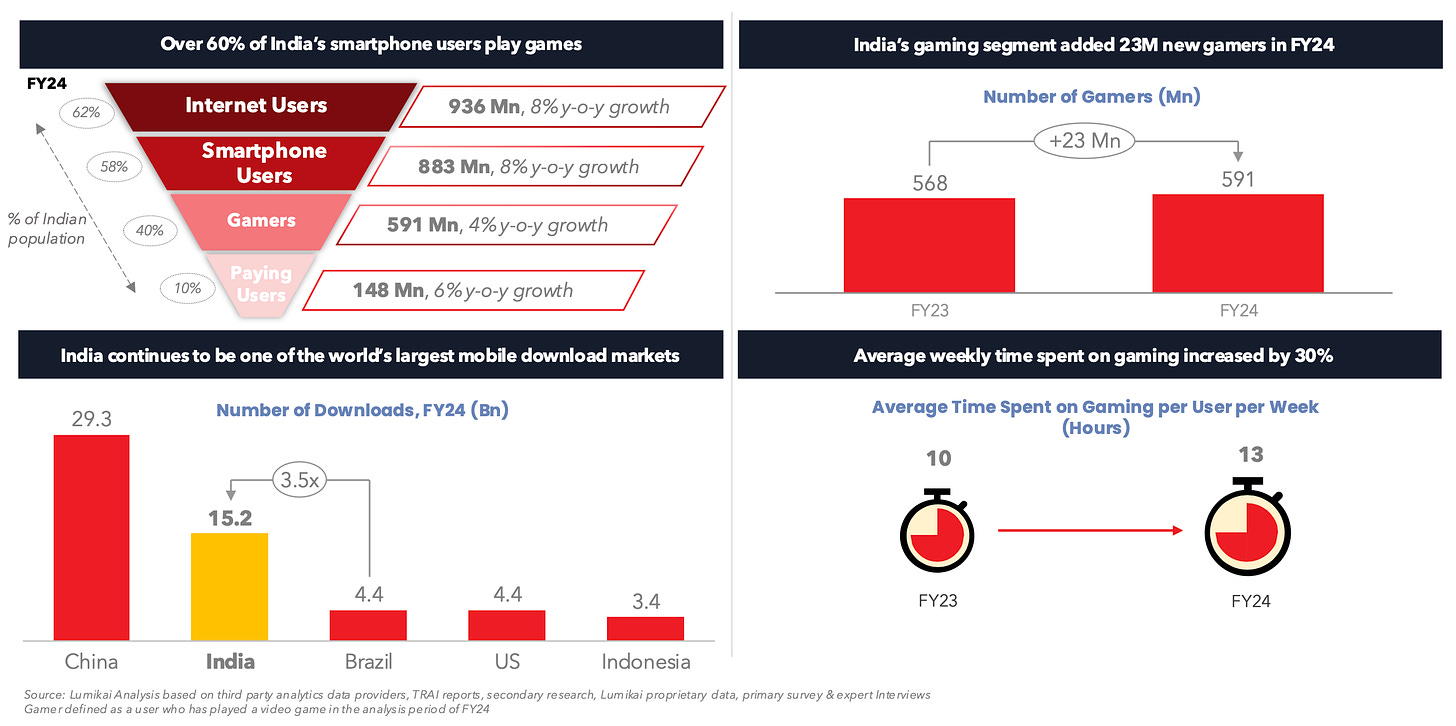
- In 2024, India will have 591 million gamers. This is the second-largest market in the world for game downloads, 3.5 times larger than the USA and Brazil. The average weekly gaming time increased from 10 hours in 2023 to 13 in 2024.
Revenue
- Revenue from IAP (In-App Purchases) in mid-core games grew by 53% year-over-year. The biggest growth was seen in Battlegrounds Mobile India, Garena Free Fire Max, and Clash of Clans, speaking of midcore.
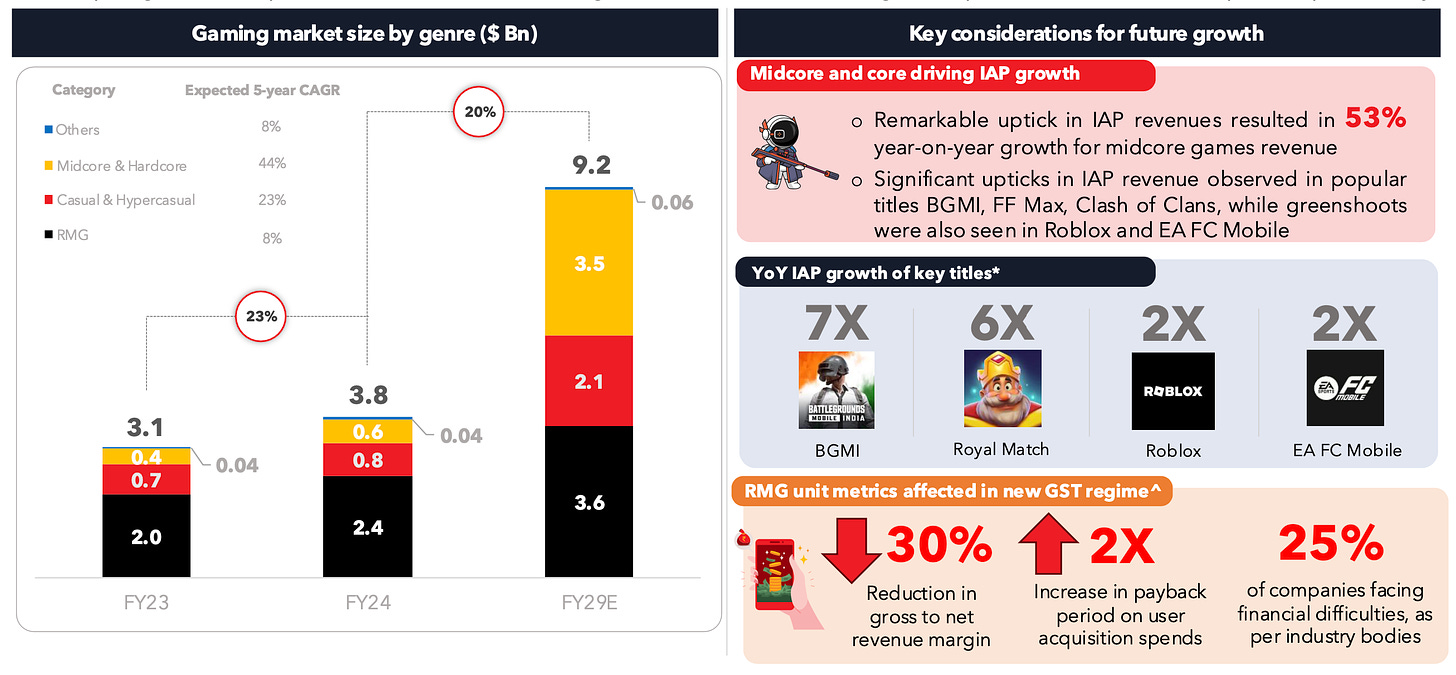
- IAP revenue for casual and hypercasual games grew by 10%.
- Changes in RMG game regulations in India led to a 50% decrease in profitability and a 30% decrease in margins. 25% of companies in the segment reported financial difficulties. Despite this, the segment grew by 20% in 2024.
- In 2024, the annual ARPPU of an Indian gamer was $22 - 15% more than in 2023.
- The number of paying players reached 148 million, which is 25% of the total number of players. More than 60% of RMG players also pay in mid-core games.
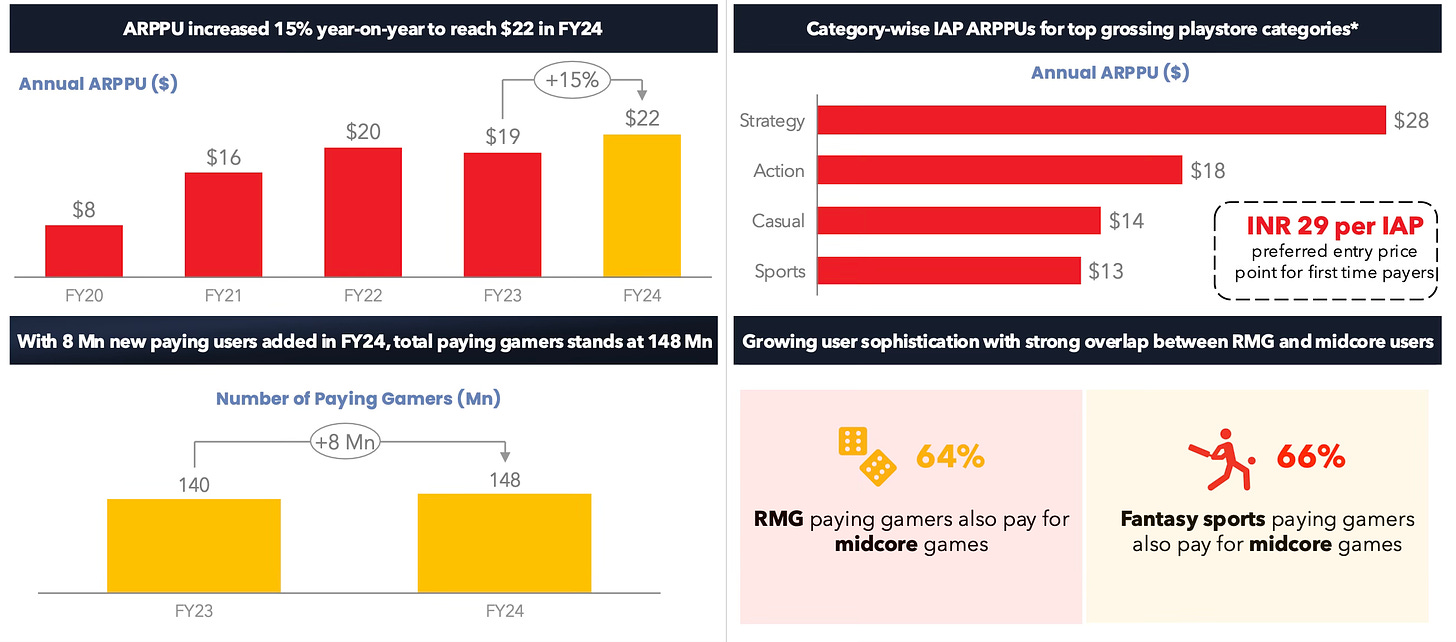
❗️The report does not specify whether these figures include the RMG segment.
Player Profile
- 56% of players are male; 44% are female (up from 41% last year).
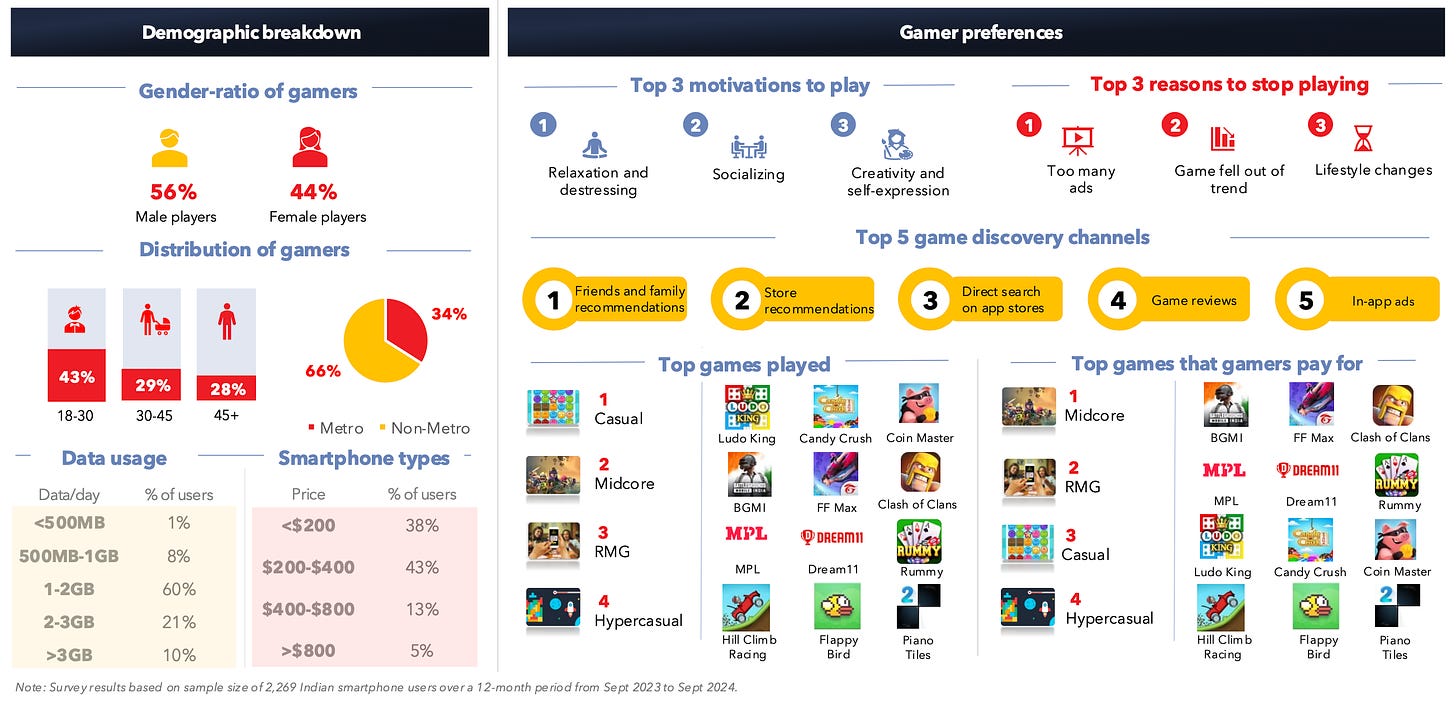
- 43% of players are aged 18 to 30; 29% are 30 to 45; 28% are over 45.
- 66% of players live outside large metropolitan areas.
- The vast majority (81% of players) have smartphones costing no more than $400. 90% of the audience uses no more than 3GB of mobile data per month.
- People played 20% more casual games in 2024. 25% of users noted that they started spending more money.
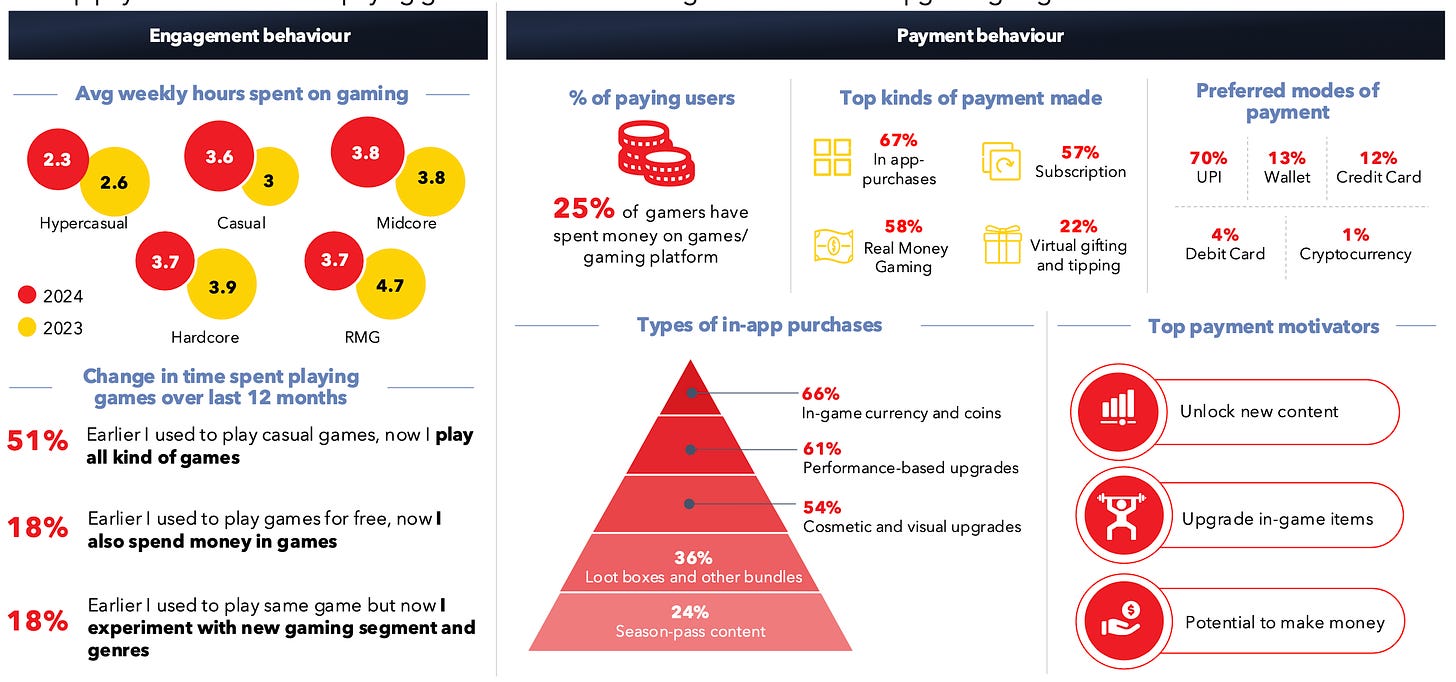
- 83% of users use UPI and digital wallets for payments. Bank card penetration is 16%.
- The highest percentage of paying users is in the western part of India. The most active players are in the south.
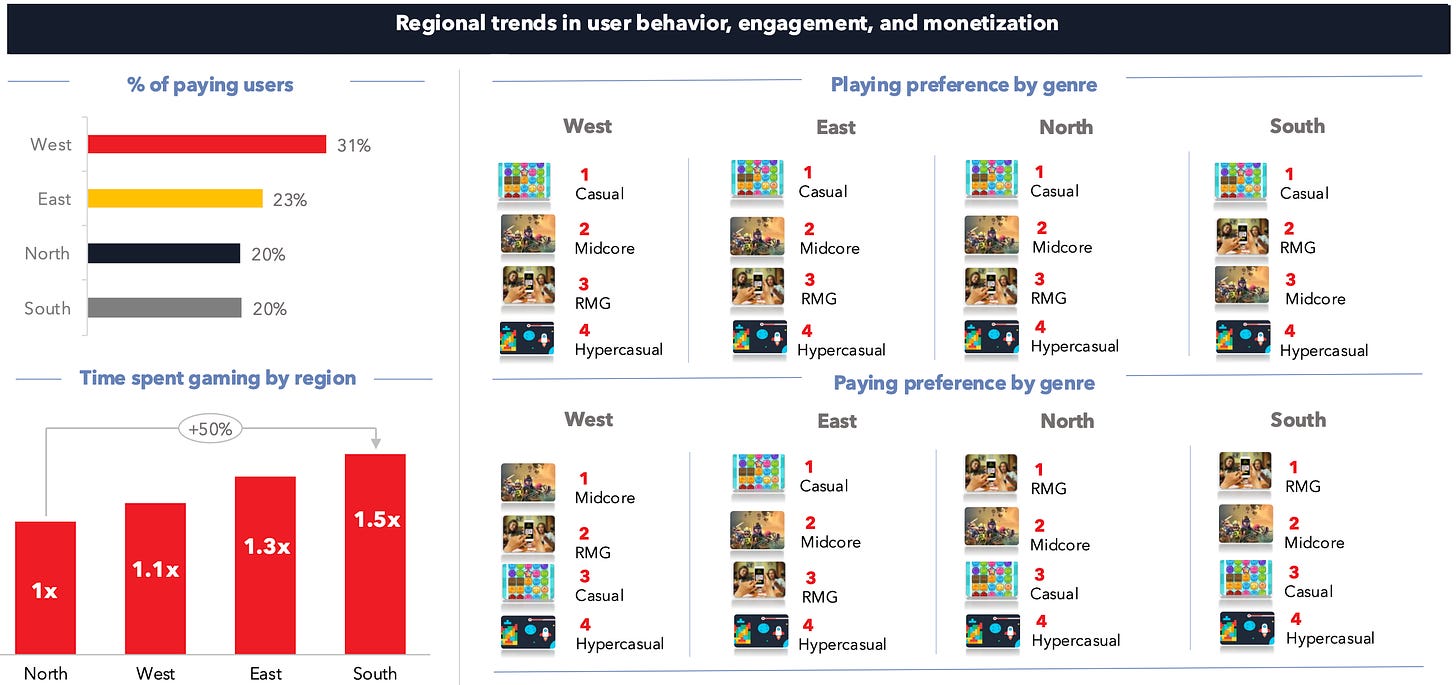
- 47% of users are willing to encounter ads to avoid paying for a subscription.
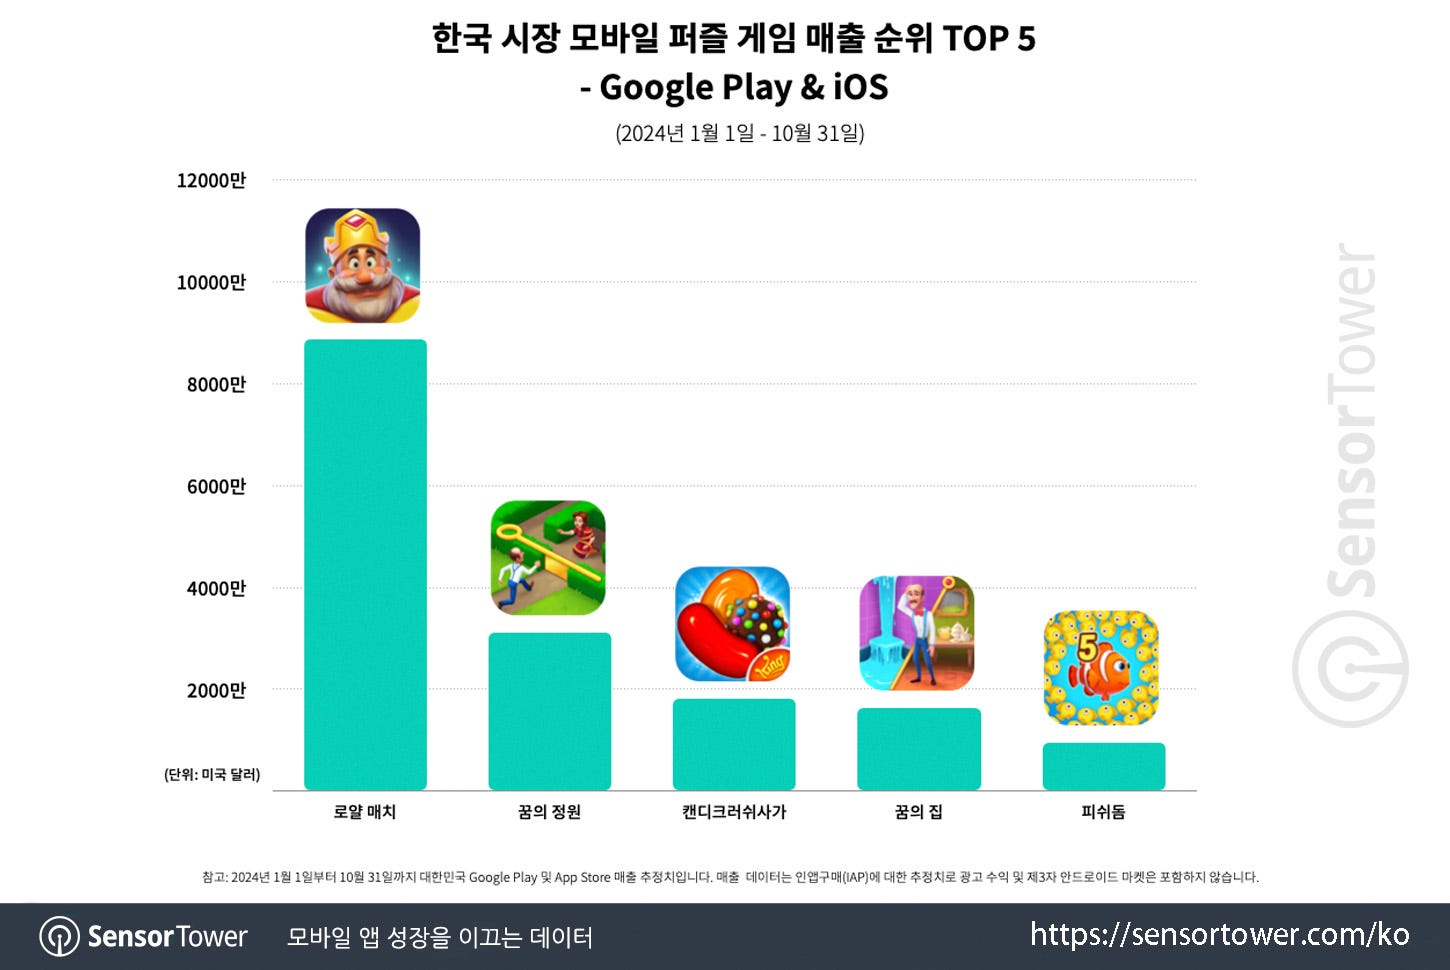
Sensor Tower: Popularity of Puzzles is growing in the South Korean Market

- As of 2024, the share of puzzles in total downloads reached 23%, while the revenue share was 7.5%. This is the highest in the last 7 years.
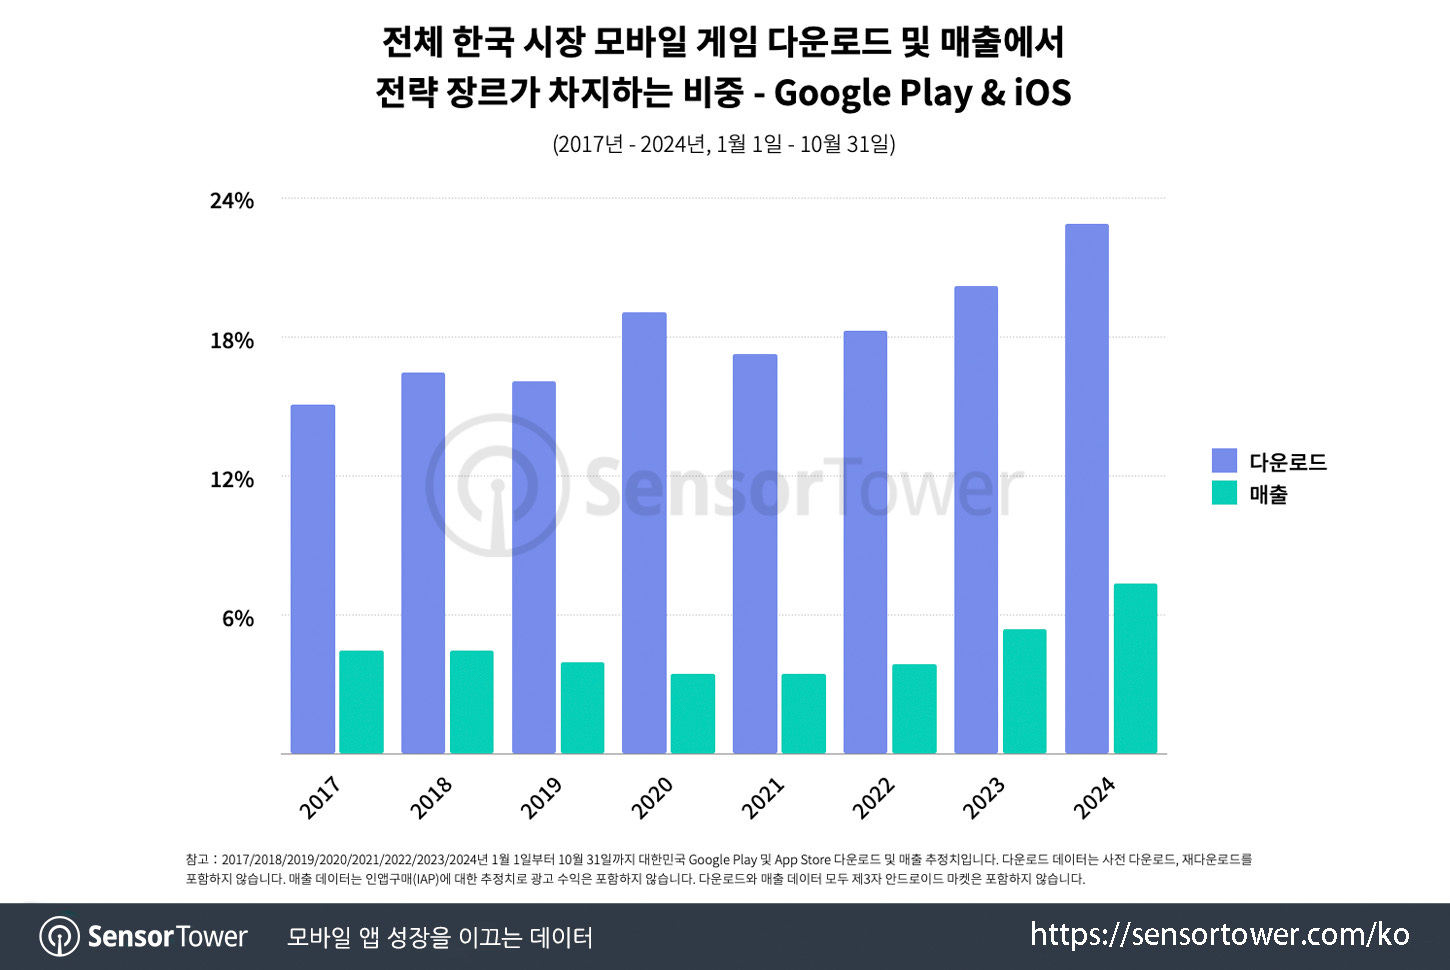
- In terms of downloads, puzzles are the largest genre in South Korea. In terms of revenue, puzzles are in third place, behind RPGs and strategy games.
- The top 5 by downloads in 2024 are Block Blast!; Royal Match; Melon Maker: Fruit Game; Wood Nuts & Bolts Puzzle and Sudoku. Melon Maker: Fruit Game is the first Korean game since 2020 to make it into the top.
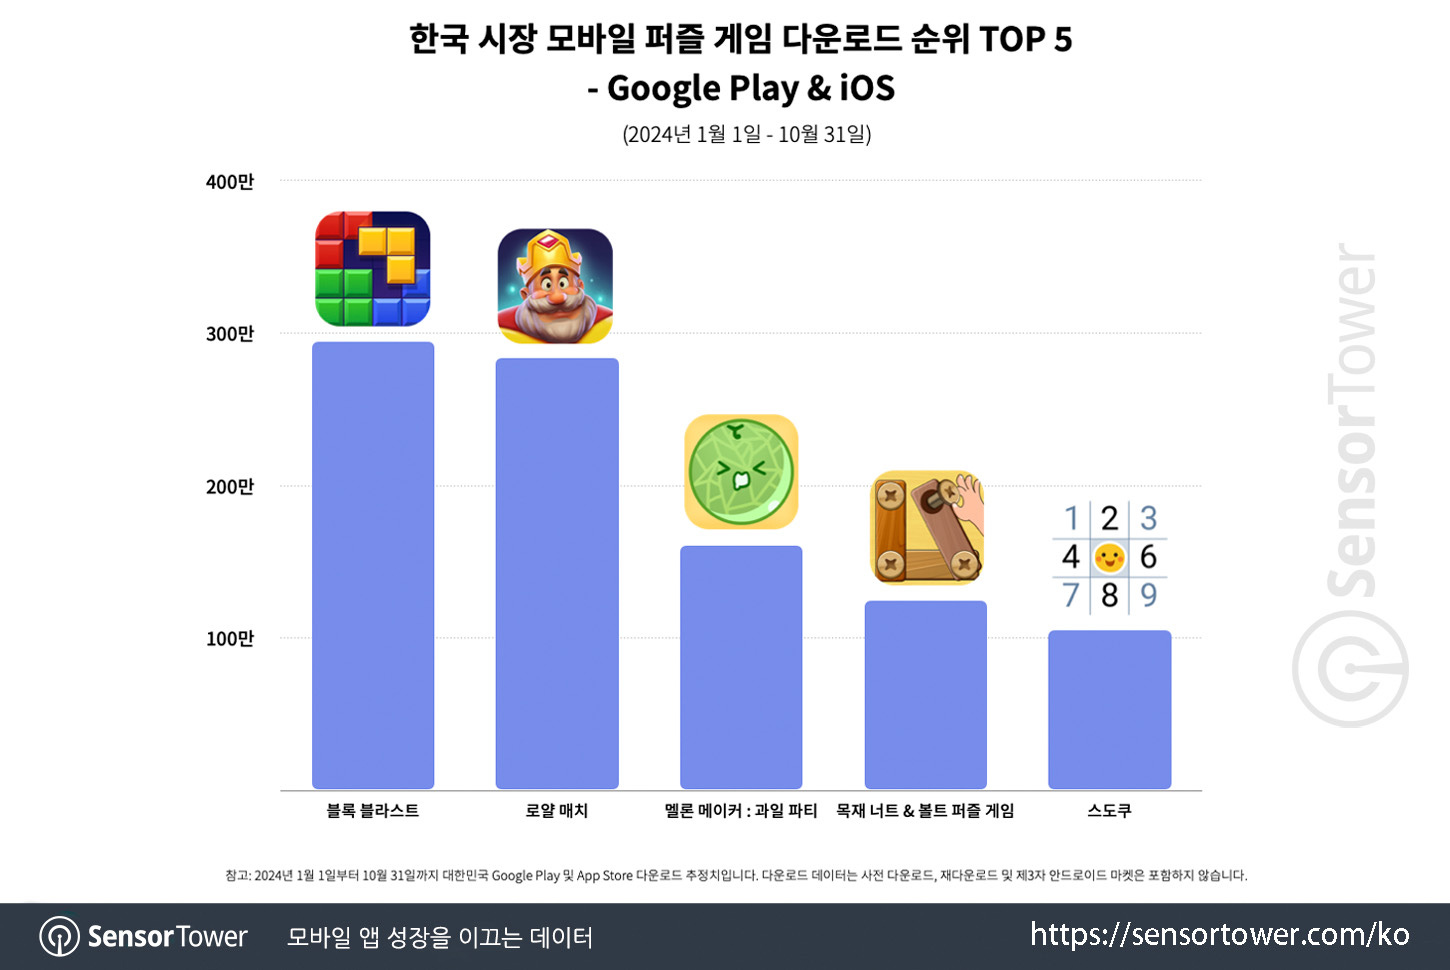
- The revenue leader is Royal Match. In 2024, the game earned around $90 million in the country. South Korea is the 5th market by revenue for the project and 12th by downloads.
ESA: 76% of American children want gifts related to video games for the Holidays
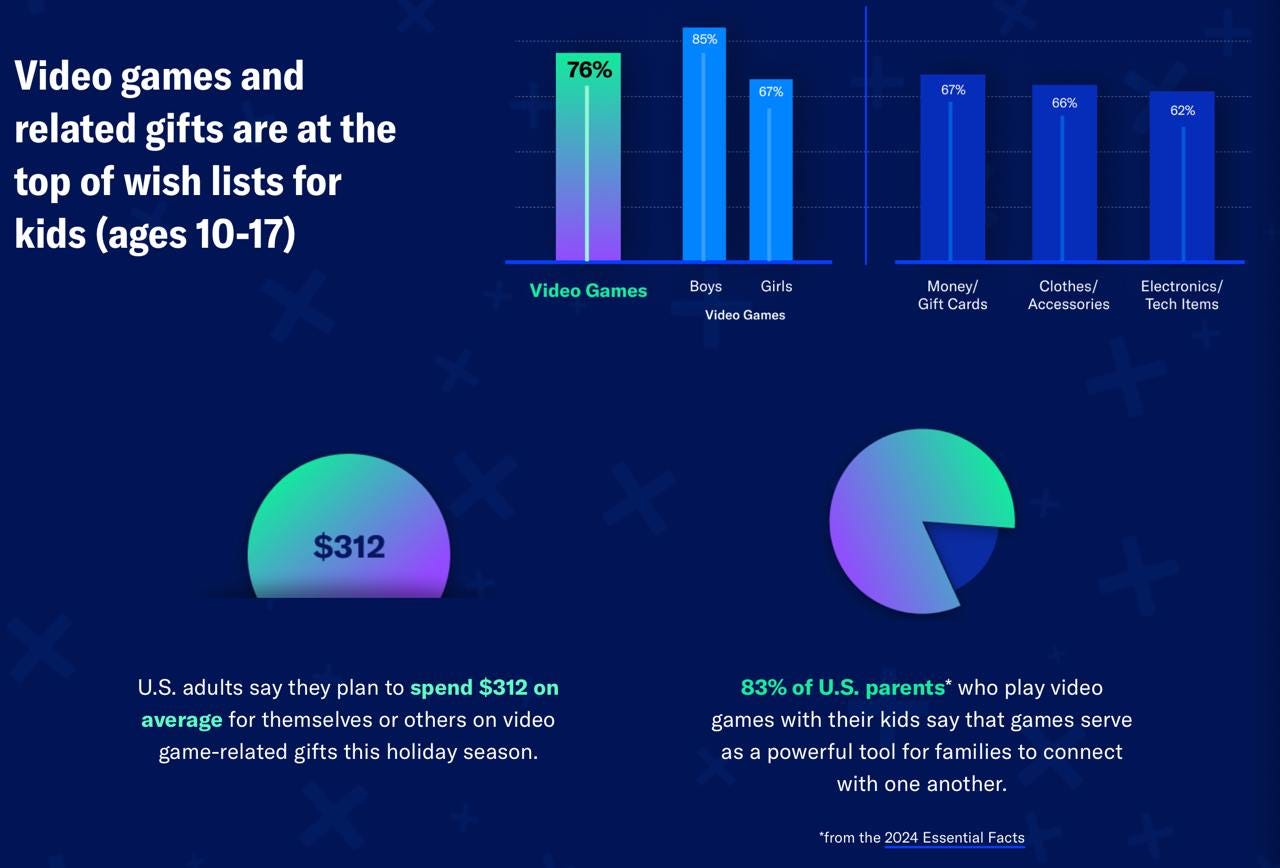
- Among those who want gifts related to video games, there are more boys (85%) than girls (67%). Additionally, children and teenagers want money (67%), clothing (66%), and gadgets (62%) as gifts.
- American adults plan to spend $312 on gifts related to video games this year.

- Children aged 10 to 17 want gaming consoles (47%), service subscriptions (43%), gaming equipment (41%), console games (41%), and in-game currency (38%) as gifts.
GSD & GfK: Game sales in Europe increased in October 2024
The analytical platforms only report actual sales figures obtained directly from partners. The mobile segment is also not taken into account.
Game Sales
- 18.5 million games were sold in Europe in October. This is 12.4% more than last year.
- This is largely because Call of Duty: Black Ops 6 was released in October this year. Last year, Call of Duty: Modern Warfare 3 was released in November. The series traditionally has a significant impact on sales.
- CoD: Black Ops 6 sold 5% better in Europe in the first two weeks compared to CoD: Modern Warfare 3. However, compared to CoD: MW2, released in 2022, Black Ops 6 started 28% worse.
❗️This year, Call of Duty became available on Game Pass at launch. This affects numbers.
- If we consider Black Ops 6 sales only on PlayStation consoles, where Game Pass is not available, the game's sales are 26% better than Modern Warfare 3 and 2% better than Modern Warfare 2.
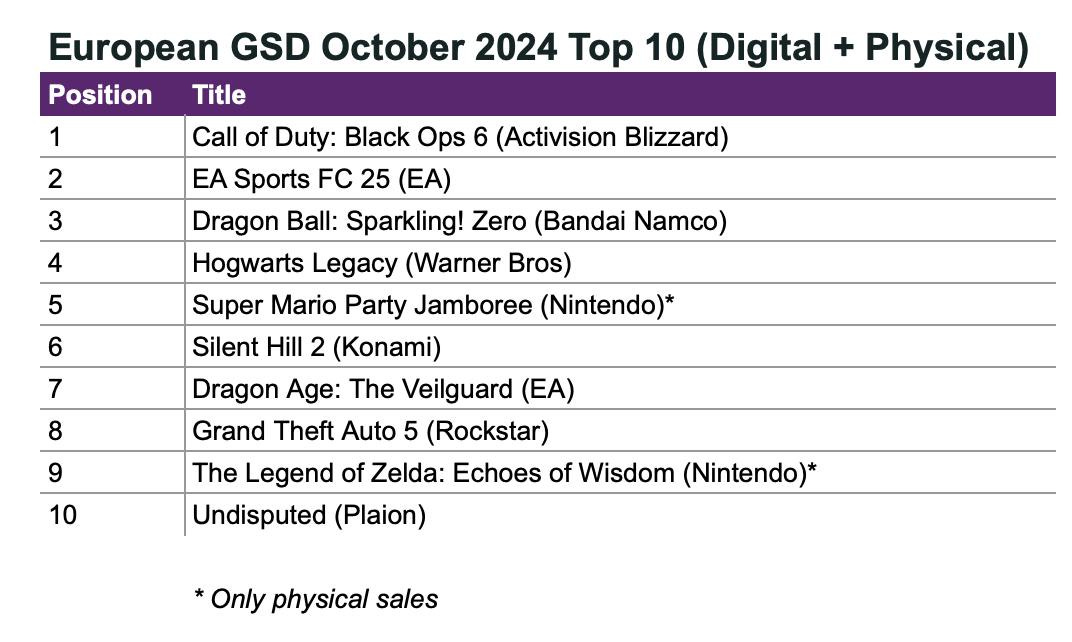
- EA Sports FC 25 is in second place. The game's sales are 2% lower than its predecessor in the same month.
- Dragon Ball: Sparking! Zero is in third place. In its first month, the game sold twice as well in Europe as the previous series project - Dragon Ball Z: Kakarot.
- Silent Hill 2 is in 6th place in sales. The game had a good start, but initial sales are 57% worse than the Resident Evil 4 remake and 31% worse than the Dead Space remake.
- Dragon Age: Veilguard started in 7th place. Initial sales are 18% worse than Dragon's Dogma 2 and 21% worse than Final Fantasy VII: Rebirth.
- In 11th place is Metaphor: Refantazio - the game sold 32% worse than Persona 5 in its first month. Which, however, is not so bad for a new IP.
Hardware and Accessories Sales
- 422 thousand consoles were sold in October 2024 in Europe. This is 26% lower than in 2023.
- PS5 sales fell by 29% YoY; Nintendo Switch - by 10%; Xbox Series S|X - by 49%.
- Taking the first 10 months of 2024, console sales are 28% worse than the previous year.
- 1.4 million accessories were sold in Europe in October. This is 13% less than last year.
Circana: The US gaming market returned to growth in October 2024
Market status
- Overall market revenue increased by 10% compared to October 2023. Games and gaming content sales grew by 12%, and accessory sales increased by 15%. However, gaming hardware sales were 23% lower than last year's figures.
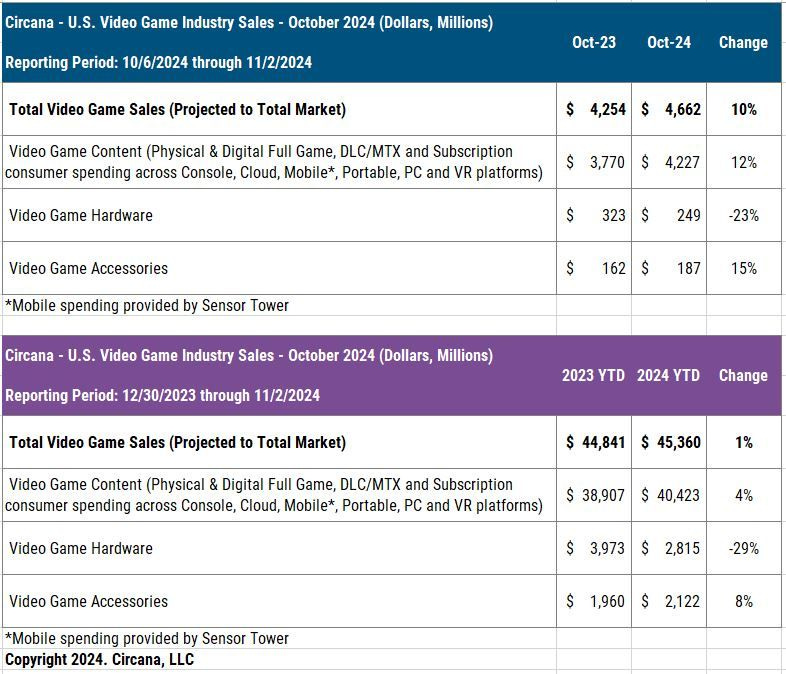
- Considering the growth in gaming content sales, spending on console games saw the most significant increase, rising by 27% year-over-year (YoY).
- In dollar terms, the best-selling accessory in October was the PlayStation Portal.
- Sales of the Nintendo Switch fell by 38% compared to October last year; PS5 sales dropped by 20% YoY; and Xbox Series S|X lost 18%. Nevertheless, the PS5 remains the best-selling system both in terms of units and dollar value.
- Spending on gaming subscriptions in the country rose by 16%, with most of the growth attributed to Game Pass subscriptions.
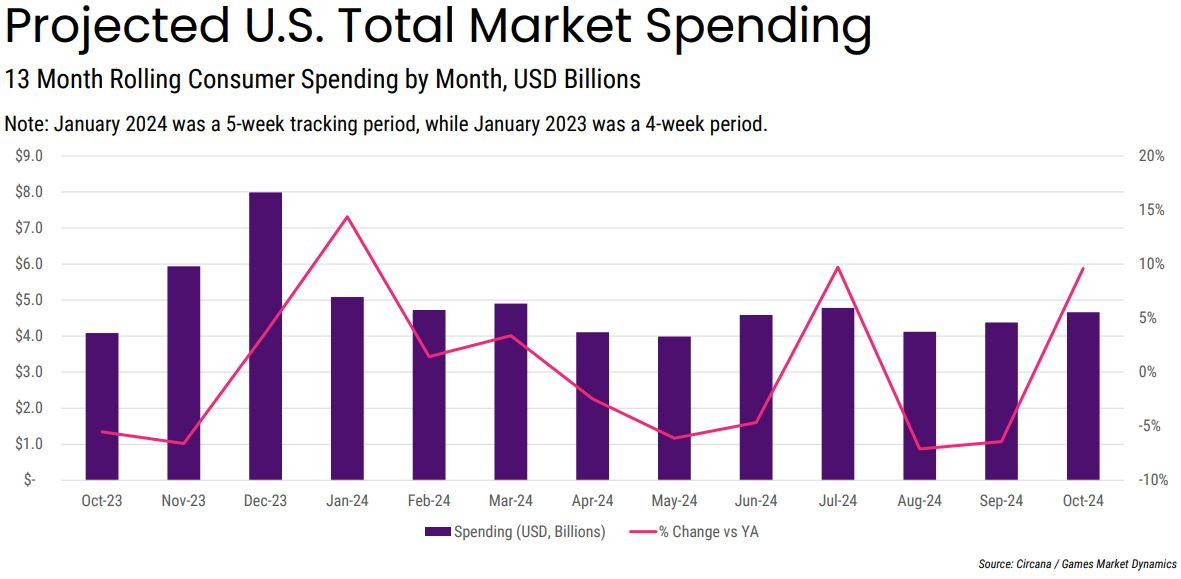
- For the first ten months of 2024, the American market showed results of 1% better than the same period in 2023.
Game Sales
- The growth in game sales is largely attributed to the launch of Call of Duty: Black Ops 6. Last year’s installment was released in November, so we can expect a decline next month. The game topped the October chart and immediately became the third best-selling game of the year. Sales of Call of Duty: Black Ops 6 in dollar terms for the first two weeks were 23% higher than last year’s Call of Duty: Modern Warfare III.
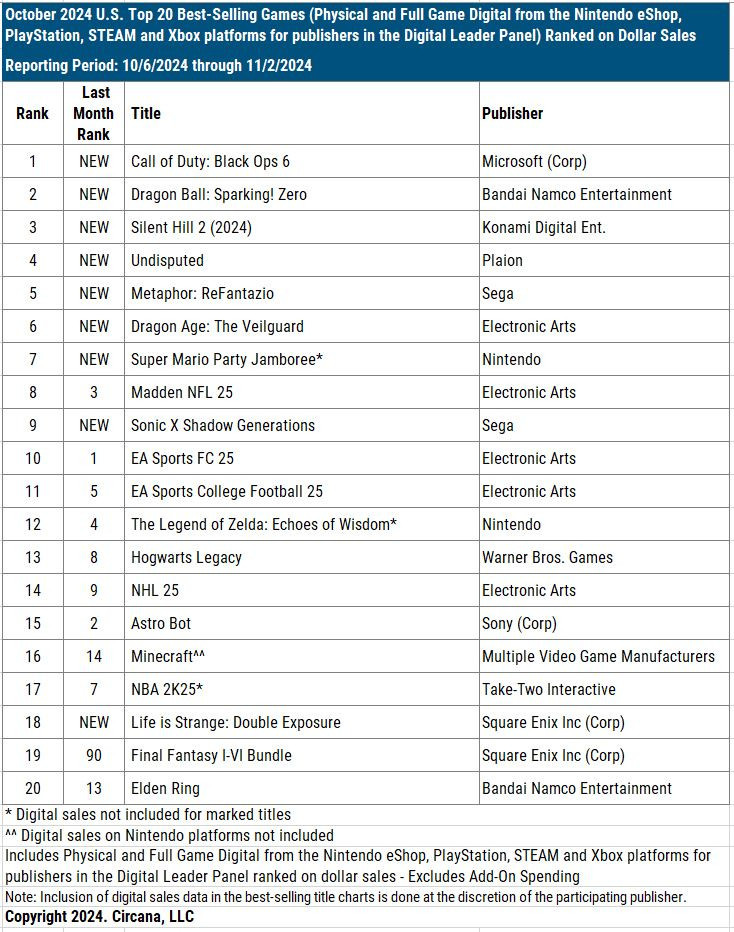
- 82% of all console sales for Call of Duty: Black Ops 6 were on PlayStation.
- Dragon Ball: Sparking! Zero ranked second in October sales and fourth for sales in 2024. After a month of sales in the U.S., it is the best-selling Dragon Ball game in dollar terms on the market. Among all games released by Bandai Namco Entertainment, it trails only Elden Ring and Dark Souls III.
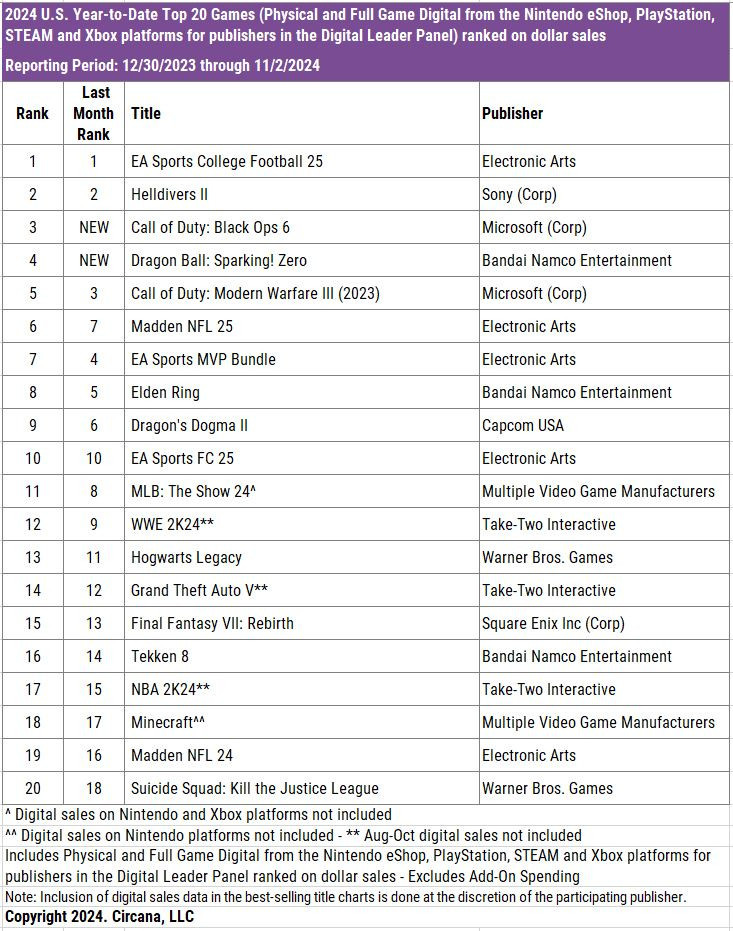
- The remake of Silent Hill 2 placed third in October sales. It shows the second-best sales results in series history, behind only the original Silent Hill 2.
- MONOPOLY GO!, Royal Match, and Roblox remain leaders in the U.S. mobile market. However, revenue for MONOPOLY GO! in the U.S. fell by 20% in October, and results compared to May-June this year are 50% worse.
Platform Rankings
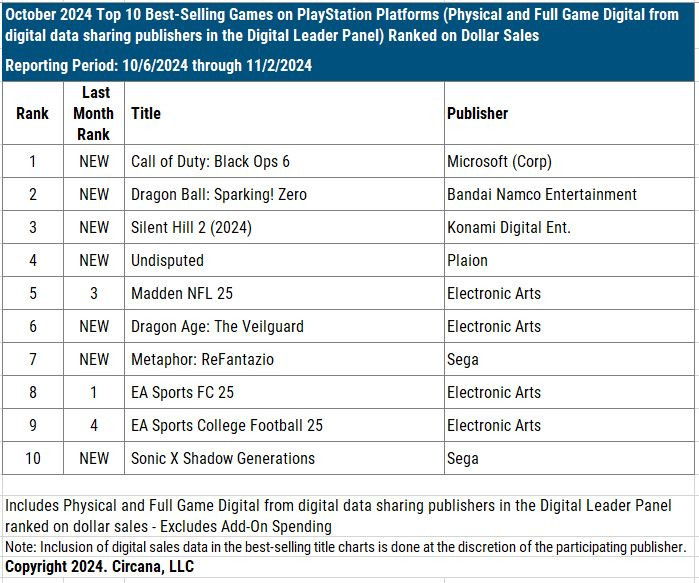
In October on PlayStation, there were seven new releases on the sales chart. Among those not named are Undisputed (4th place), Dragon Age: The Veilguard (6th place), Metaphor: ReFantazio (7th place), and Sonic X Shadow Generations (10th place).
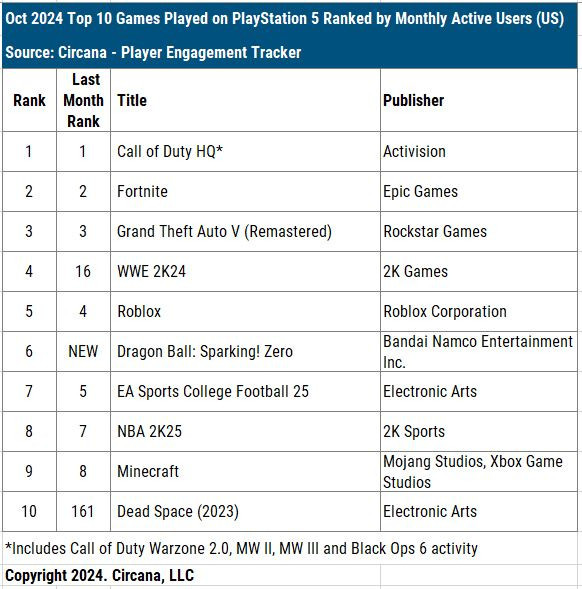
- In terms of Monthly Active Users (MAU) on PlayStation consoles, there were three notable changes: WWE 2K24 reached 4th place; Dragon Ball: Sparking! Zero appeared at 6th place; and the remake of Dead Space entered at 10th place.
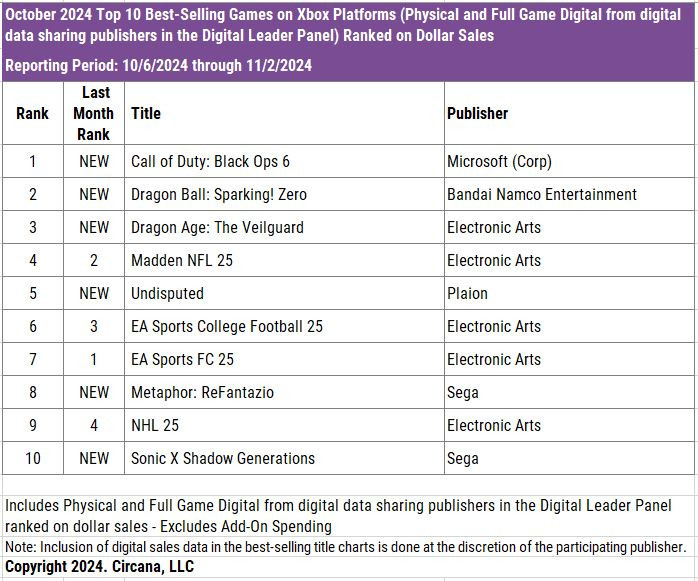
- On Xbox Series S|X, a similar situation exists, except that there is no Silent Hill 2 on their chart, because there is an exclusivity deal with Sony.
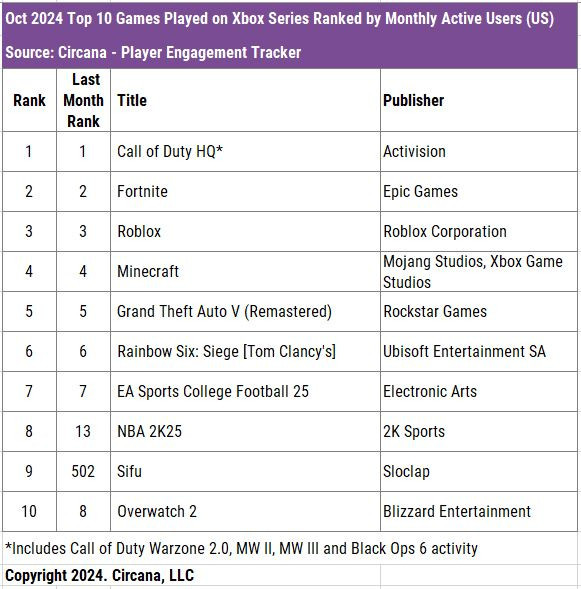
- The MAU ranking on Xbox saw little change from last month. Sifu reached 9th place due to its inclusion in a subscription service.
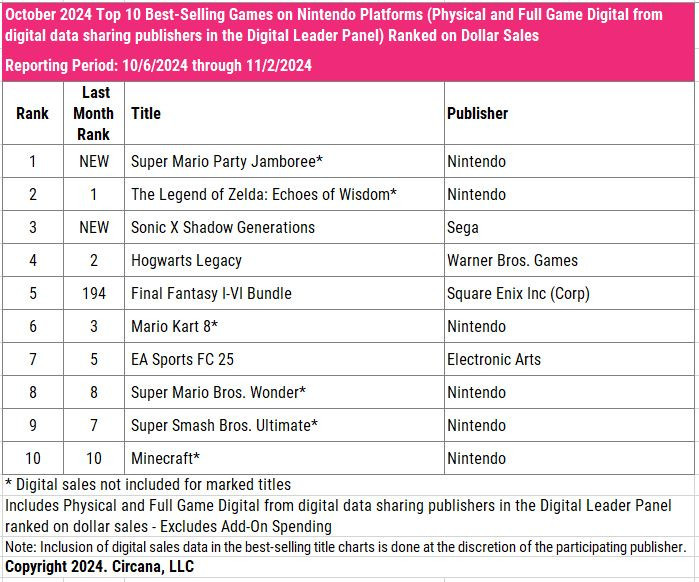
- On Nintendo Switch, there are two new entries: Super Mario Party Jamboree and Sonic X Shadow Generations.
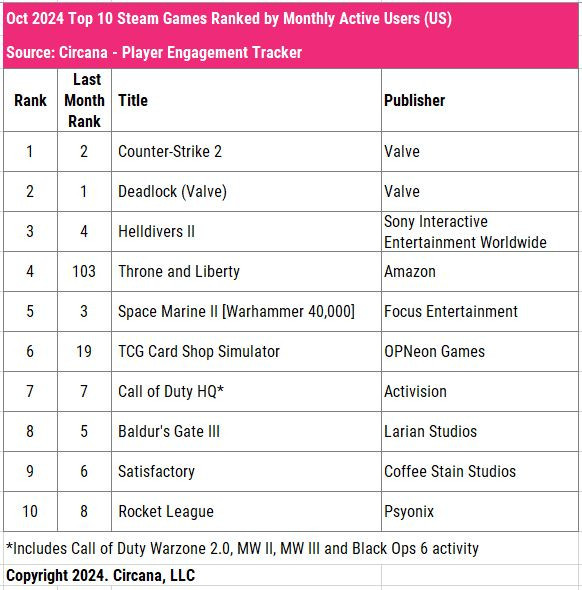
- There are few changes in Steam's MAU ranking. The top spots are held by Counter-Strike 2, Deadlock, and Helldivers II. Throne and Liberty climbed to 4th place; TCG Card Shop Simulator reached 6th place.
Games & Numbers (November 13 - November 26; 2024)
PC/Console Games
- Over 15 million people have played Helldivers II since its release. Sony reported that 12 million copies were sold in May in 3 months. Given that the game hasn’t appeared in subscription services, 15 million players equals 15 million copies sold.
- Call of Duty: Black Ops 6 is the largest entry in the series in history by number of players, hours played, and matches played in the first 30 days after release. The game’s appearance in subscription services contributed to this.
- Starfield’s audience exceeds 15 million people. In June, Todd Howard reported 14 million users.
- More than 6 million people have played Sea of Stars. This figure doesn’t reflect sales as the game was available through subscription services.
- Farming Simulator 25 was purchased more than 2 million times in its first week.
- Alan Wake 2 sales have reached 1.8 million copies.
- S.T.A.L.K.E.R. 2 was purchased more than a million times in two days after release. This is considering that the game appeared in Game Pass at launch.
- Wartales by Shiro Games has surpassed 1 million copies sold on Steam alone. The game is also available on consoles, but sales there are not reported.
- CD Projekt RED revealed that The Witcher III: Wild Hunt has sold more than a million copies in South Korea. The game’s total sales have long exceeded 50 million copies.
- Frostpunk 2 has sold over half a million copies in less than a month after the release. Sales leaders are China (24.2%), USA (18.5%), and Germany (7.2%). 48.7% of sales were for Deluxe editions.
- Slay the Princess has sold over half a million copies. It took just over a year to reach this mark. The game was made by two people, a married couple.
- Baldur’s Gate III in 2024 performed better in some metrics than in 2023, according to Michael Douse, Publishing Director at Larian Studios. The average daily peak online grew by 3% compared to 2023; the average DAU increased by 20%; and the number of Steam Deck users increased by 61%.
- Dying Light: The Beast has good prospects. In less than 3 months after its announcement, the game has collected over a million wishlists. This is better than all other games in the series.
Mobile Games
- Pokemon TCG Pocket has already earned more than $120.8 million since its release, according to AppMagic. It took 3 weeks to reach the first $100 million. The largest market is Japan (42% of revenue), followed by the USA (28% of revenue).
- Final Fantasy VII: Ever Crisis has surpassed $100 million in revenue, according to AppMagic (the service calculates Net Revenue, after taxes and commissions). However, the game’s trend is rather downward.
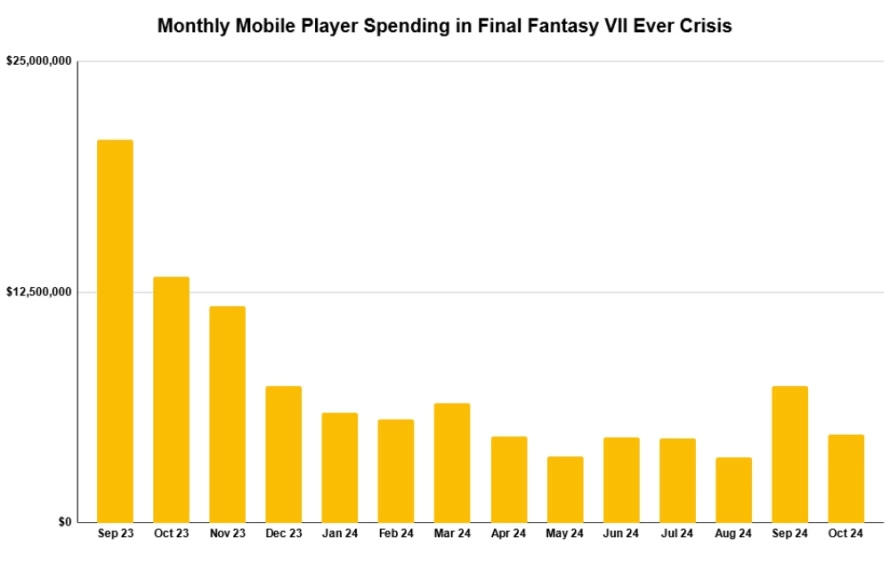
- Solo Leveling: Arise has achieved a similar result. The game, released on May 8 this year, has surpassed $100 million in Net Revenue on mobile devices. Additionally, the game is available on PC. Netmarble reported that the game has been downloaded more than 50 million times across all platforms.

Dataspelsbranschen: The Swedish Gaming Industry in 2024
The company publishes its reports at the end of the year, covering the full data from the previous year. Thus, this year’s report contains data for the completed 2023 year.
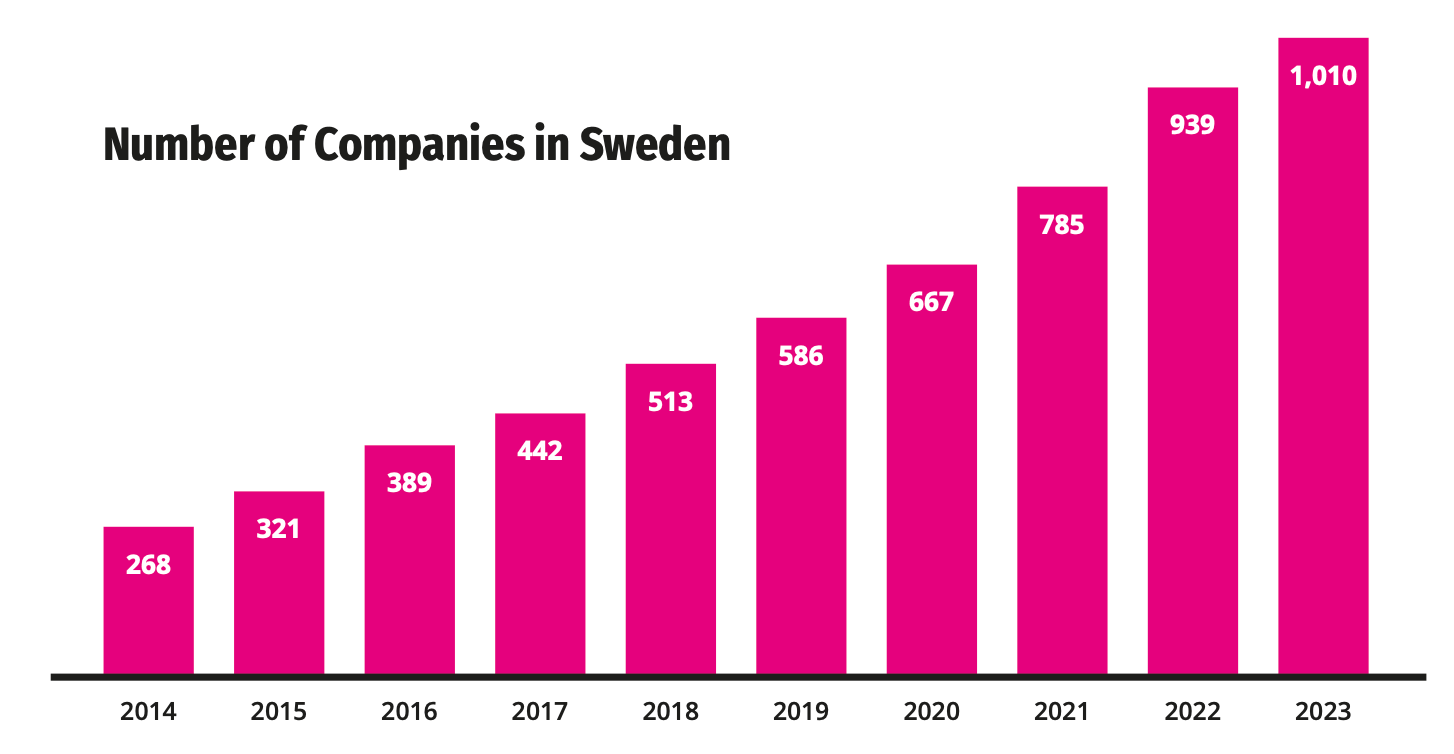
- By the end of 2023, 1010 gaming companies were operating in Sweden - 8% more than in 2022. And almost twice as many as in 2019.
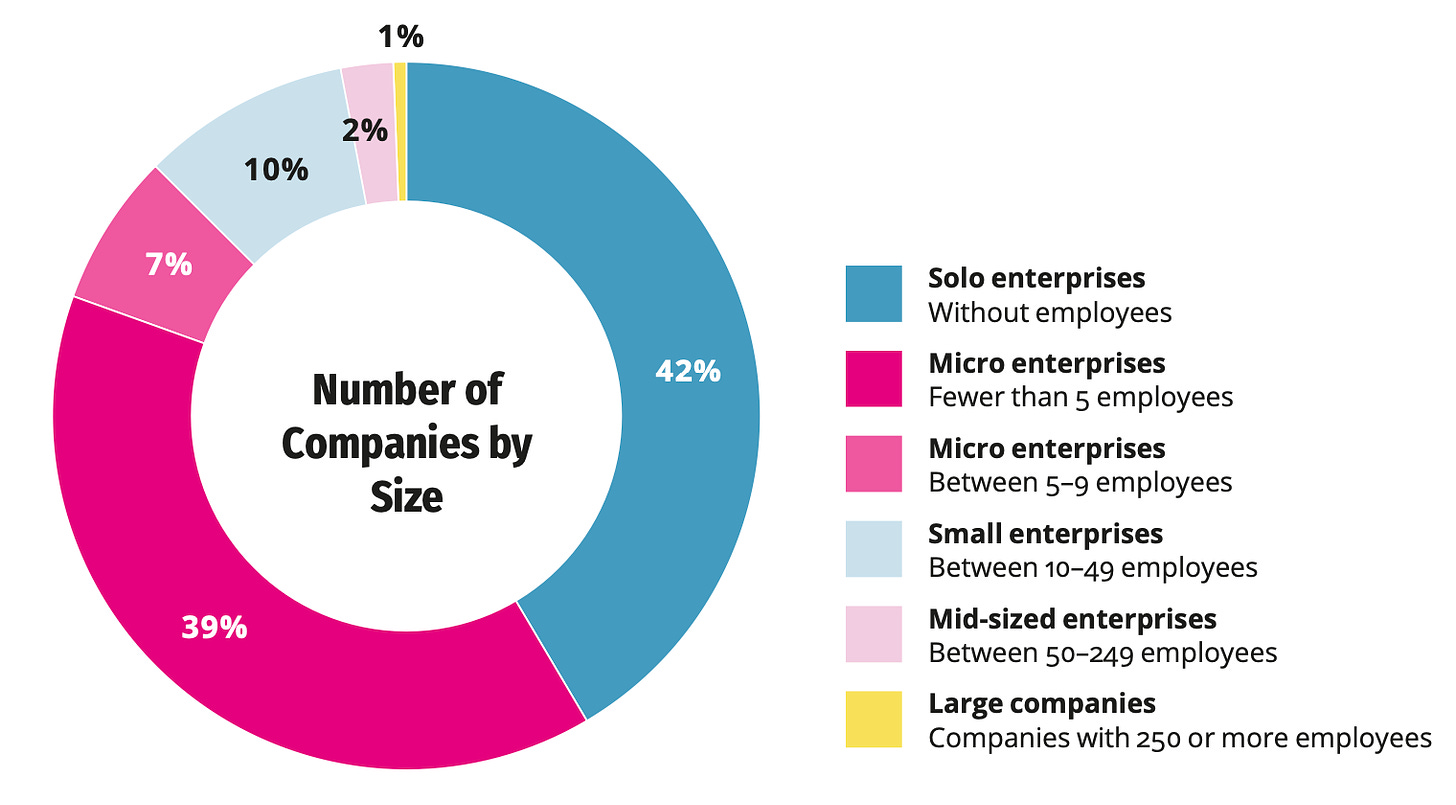
- 81% of Swedish companies have fewer than 5 employees. Only 3% of studios have more than 50 employees.
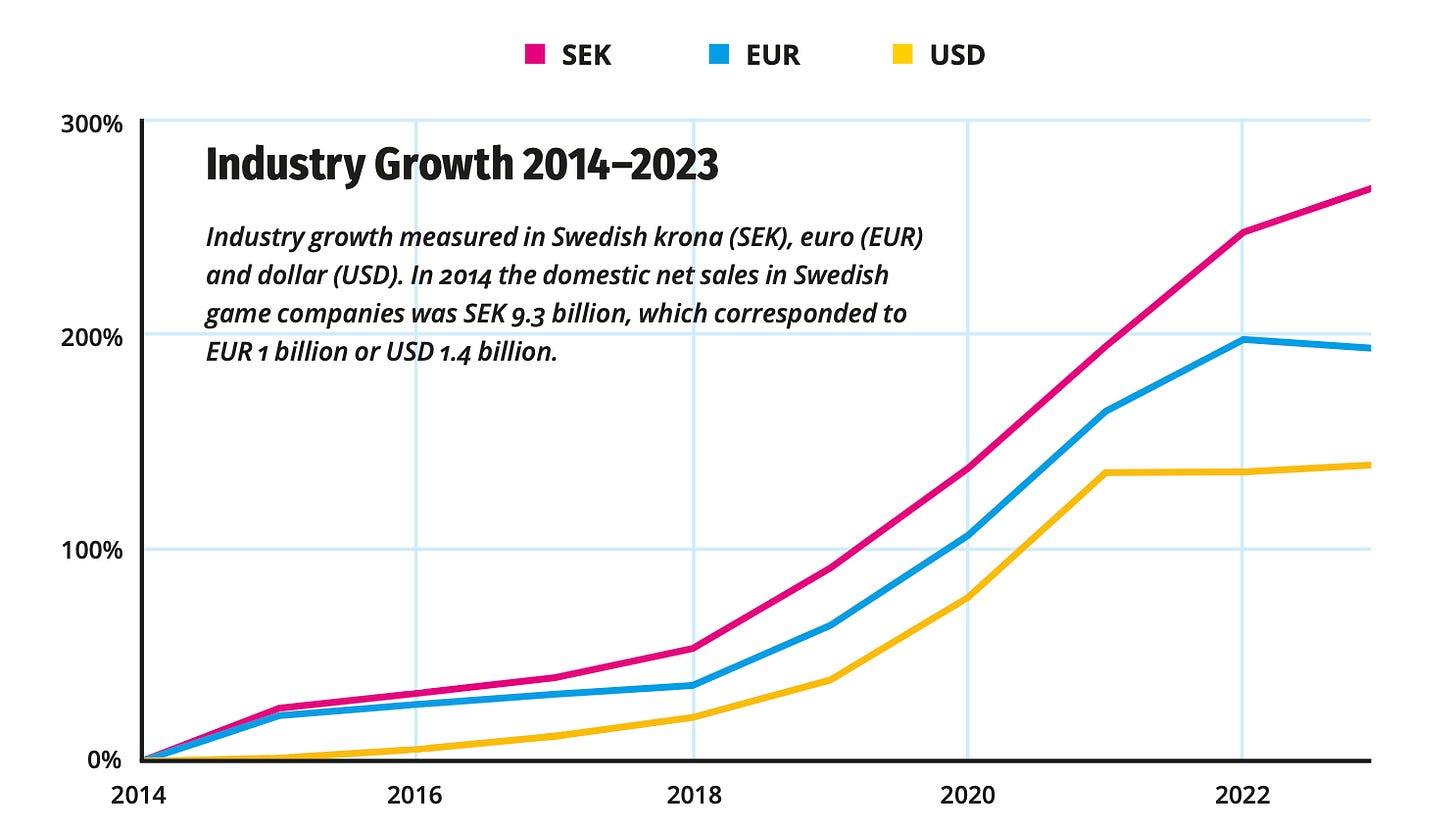
- Sales of local companies in 2023 grew by 6% in local currency; 1.5% in USD; but fell by 1.5% in EUR. Their total revenue amounted to €3.11 billion.
- The net income of Swedish gaming companies decreased to €98 million.
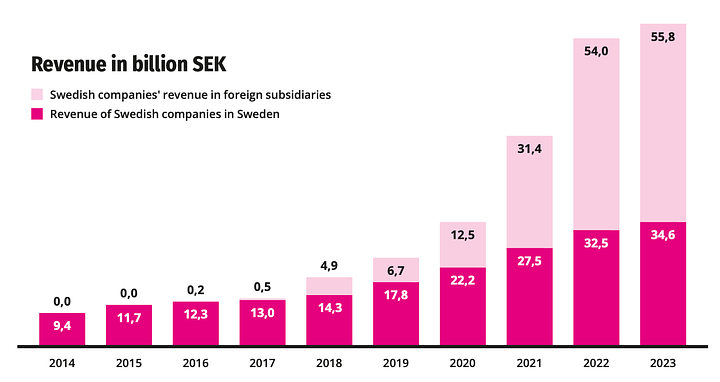
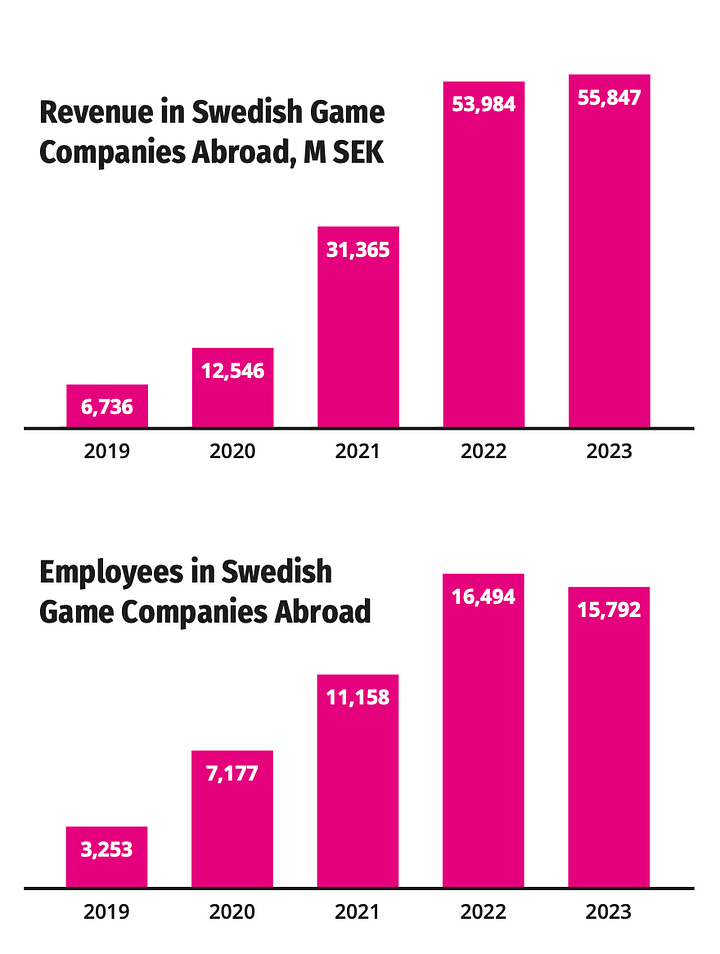
- Swedish companies, and their foreign subsidiaries, earned around €7.95 billion in 2023. This is 4.5% more than in 2022.
- The revenue of 23 public Swedish companies amounted to €5.6 billion in 2023.
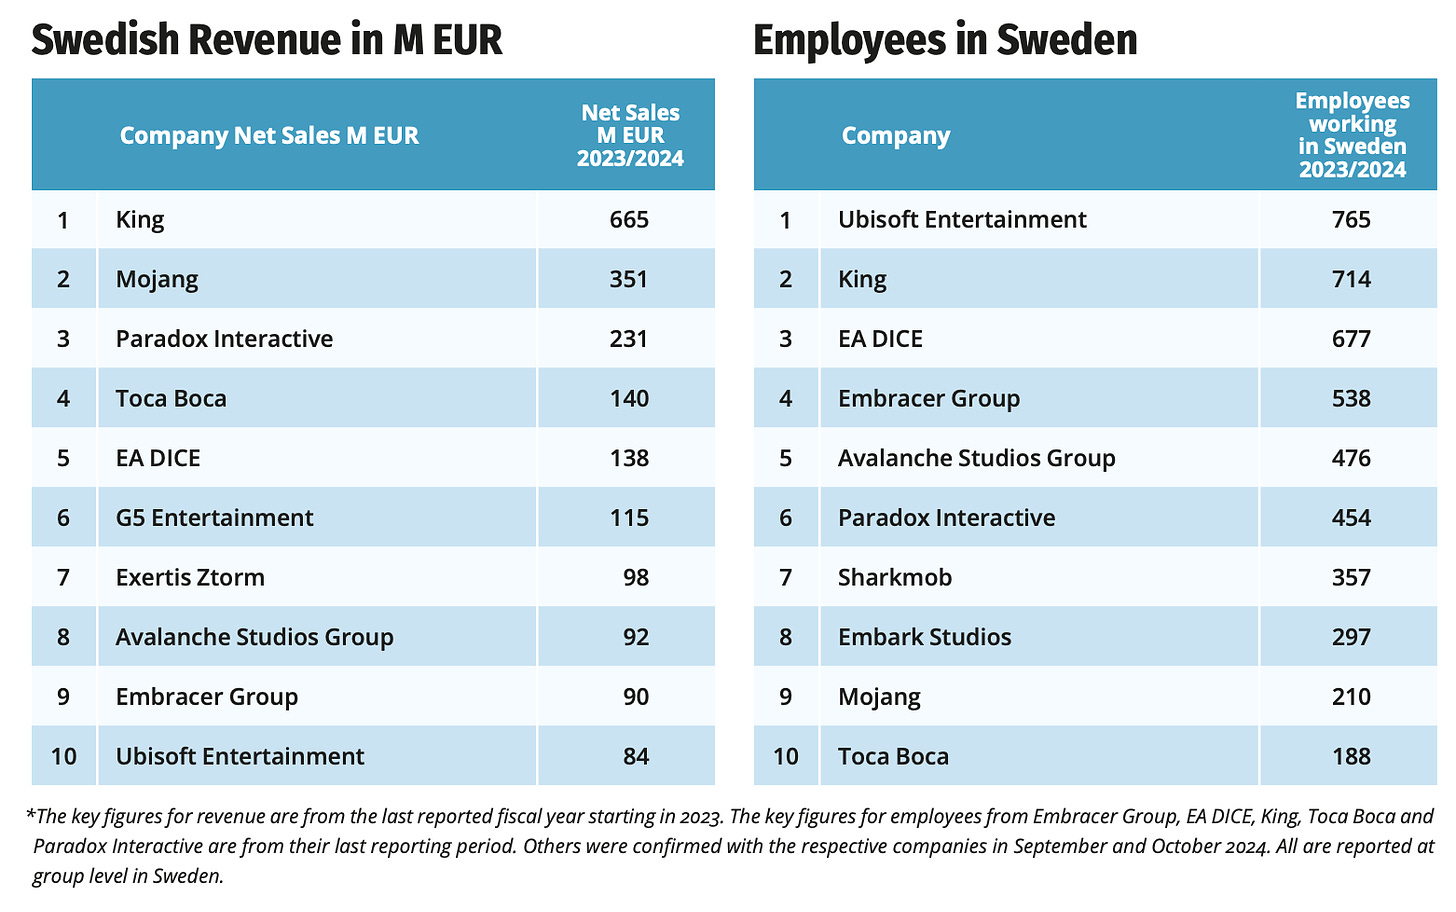
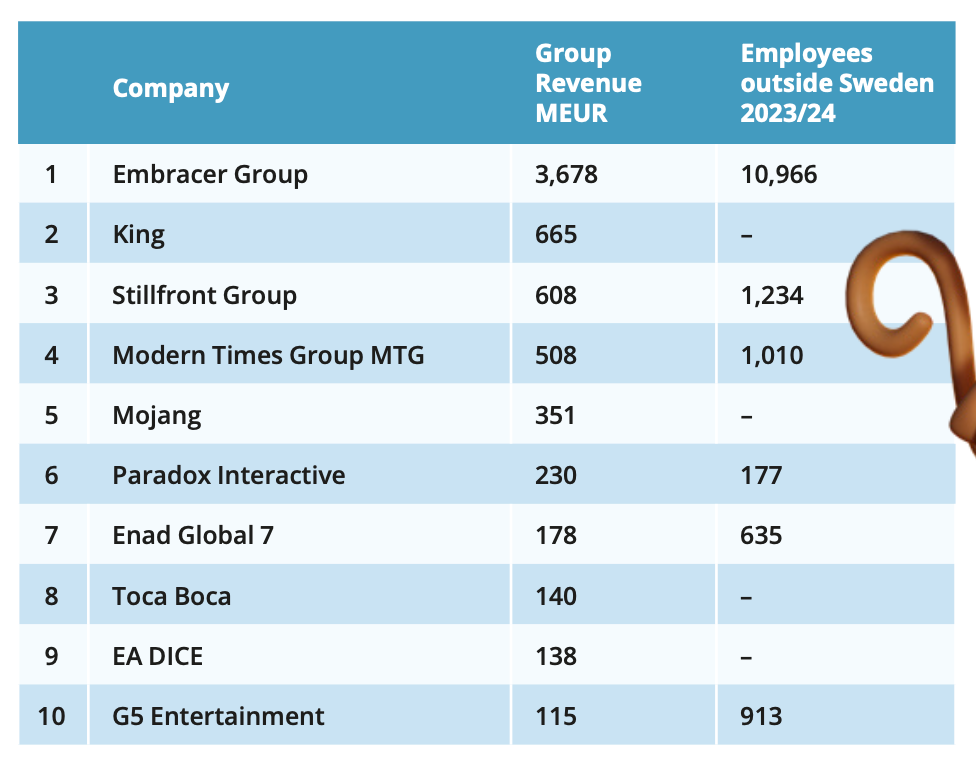
- King, Mojang, and Paradox Interactive are the country’s largest companies by revenue. The largest amount of employees has Ubisoft, King, and EA DICE. Financial results are for 2023, so Arrowhead Studios is not on the list.
- The largest Swedish companies with foreign subsidiaries are Embracer Group, King and Stillfront Group.
- Game of the Year according to local industry representatives is Helldivers II.
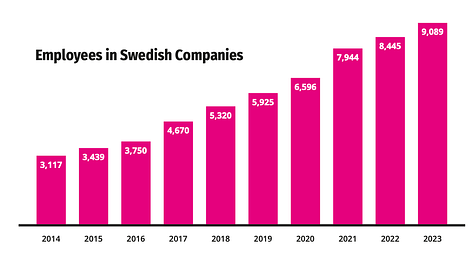
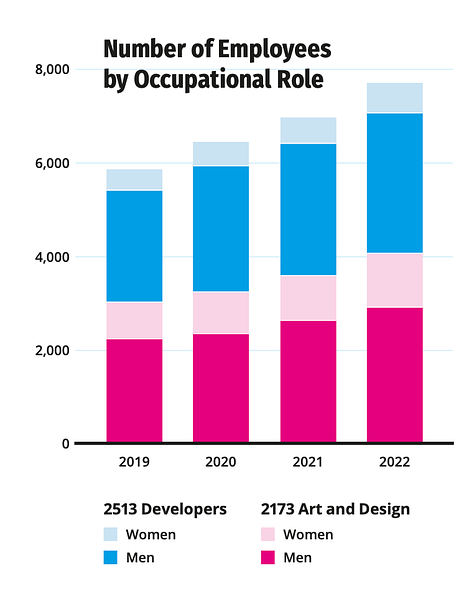
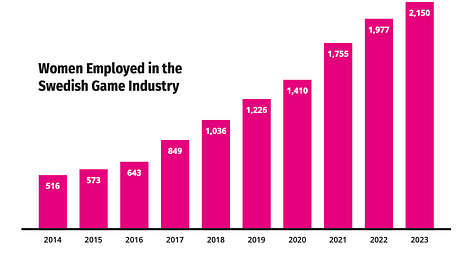
- The number of women in the Swedish gaming industry increased to 23.7%. 9,089 people work in the country - 8% more than in 2022.
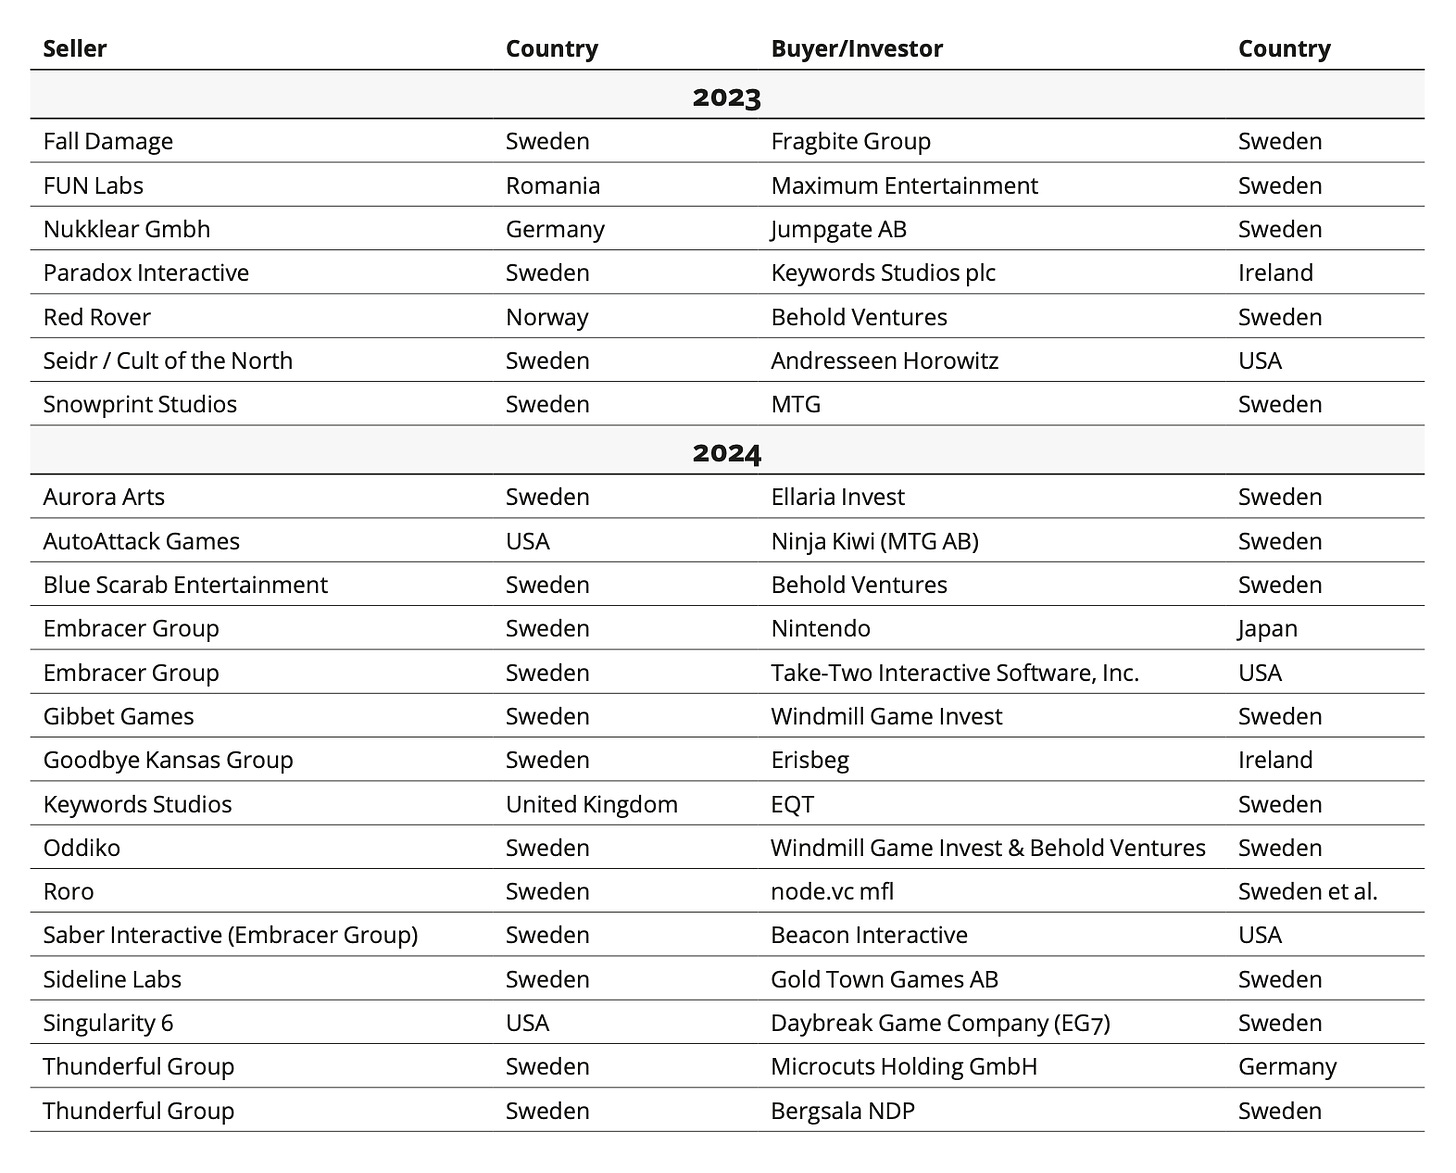
- In 2023, there were 7 investment deals in the Swedish gaming industry. However, for the first half of 2024, 16 transactions have already been publicly announced. If we consider all deals, Swedish companies were sellers in 12 cases and buyers in 11 cases.
- Swedish gaming companies paid over €470 million in taxes for the 2023 fiscal year.
Game7 Research & Naavik: Web3 Games in 2024
The companies studied over 2,500 games; 1,500 rounds and more than 100 blockchain ecosystems; using closed and open sources. Data was collected from September 30, 2023, to September 30, 2024.
Web3 Gaming Ecosystem
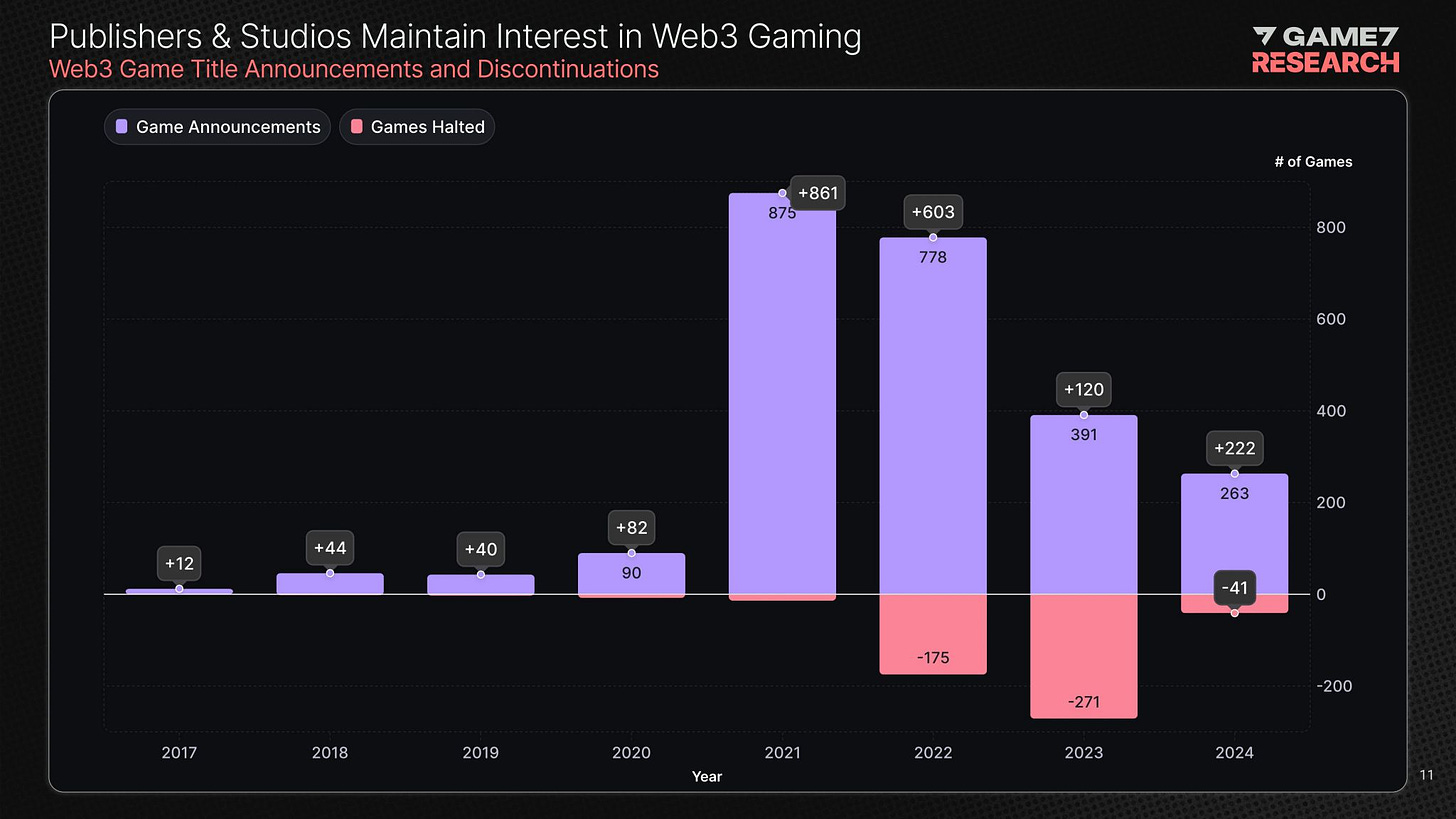
- The number of announced games in 2024 decreased by 36%. At the same time, the number of closed projects also reduced - by 84% at once.
- The report authors note the growing popularity of the Play-to-Airdrop (P2A) model, where players must participate in playtests or reach leaderboards to receive rewards.
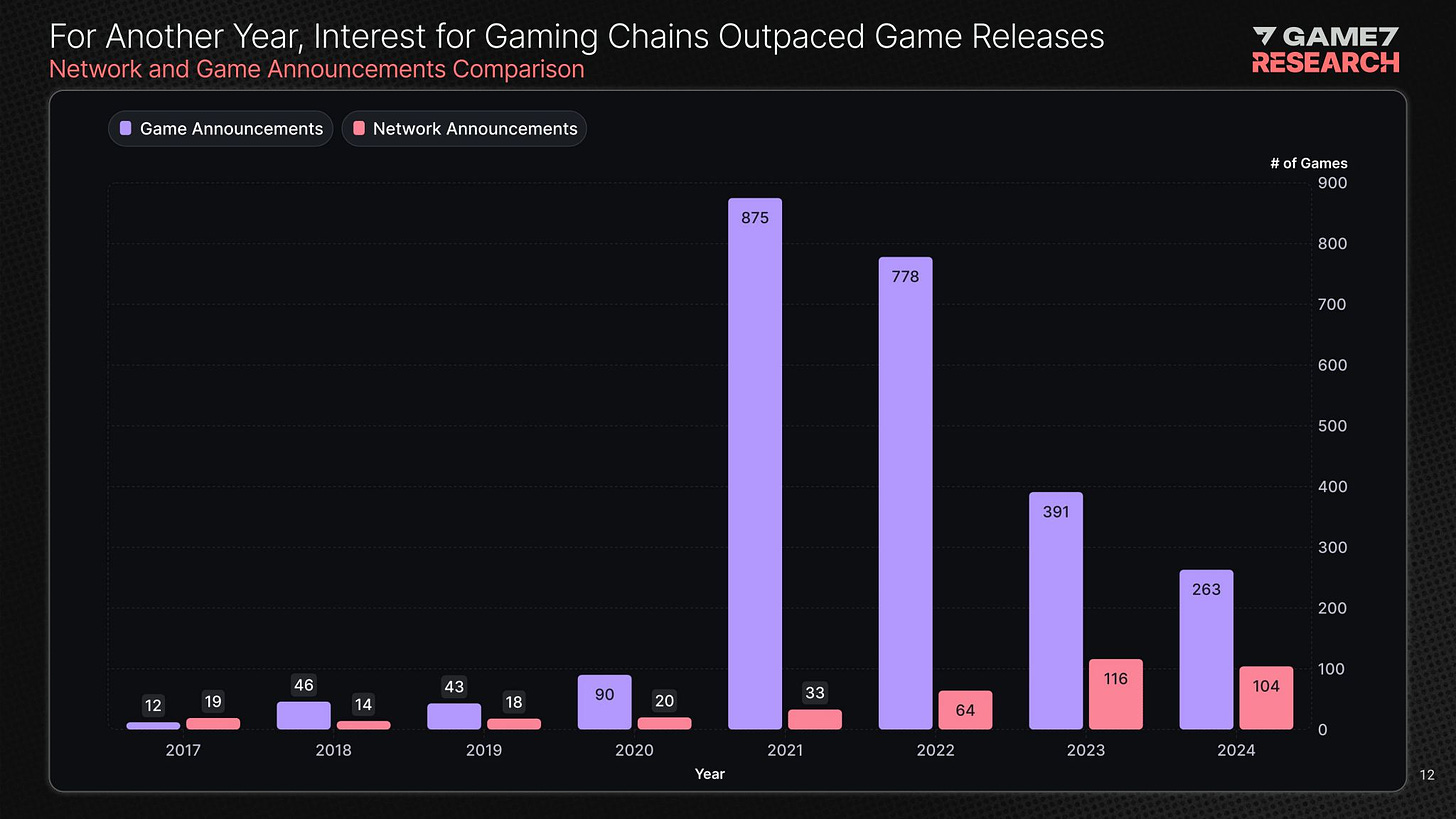
- Market players continue to be more interested in launching their networks than launching their games, based on the dynamics. This is likely related to the desire to control and scale business. And, of course, with the possibility of earnings.
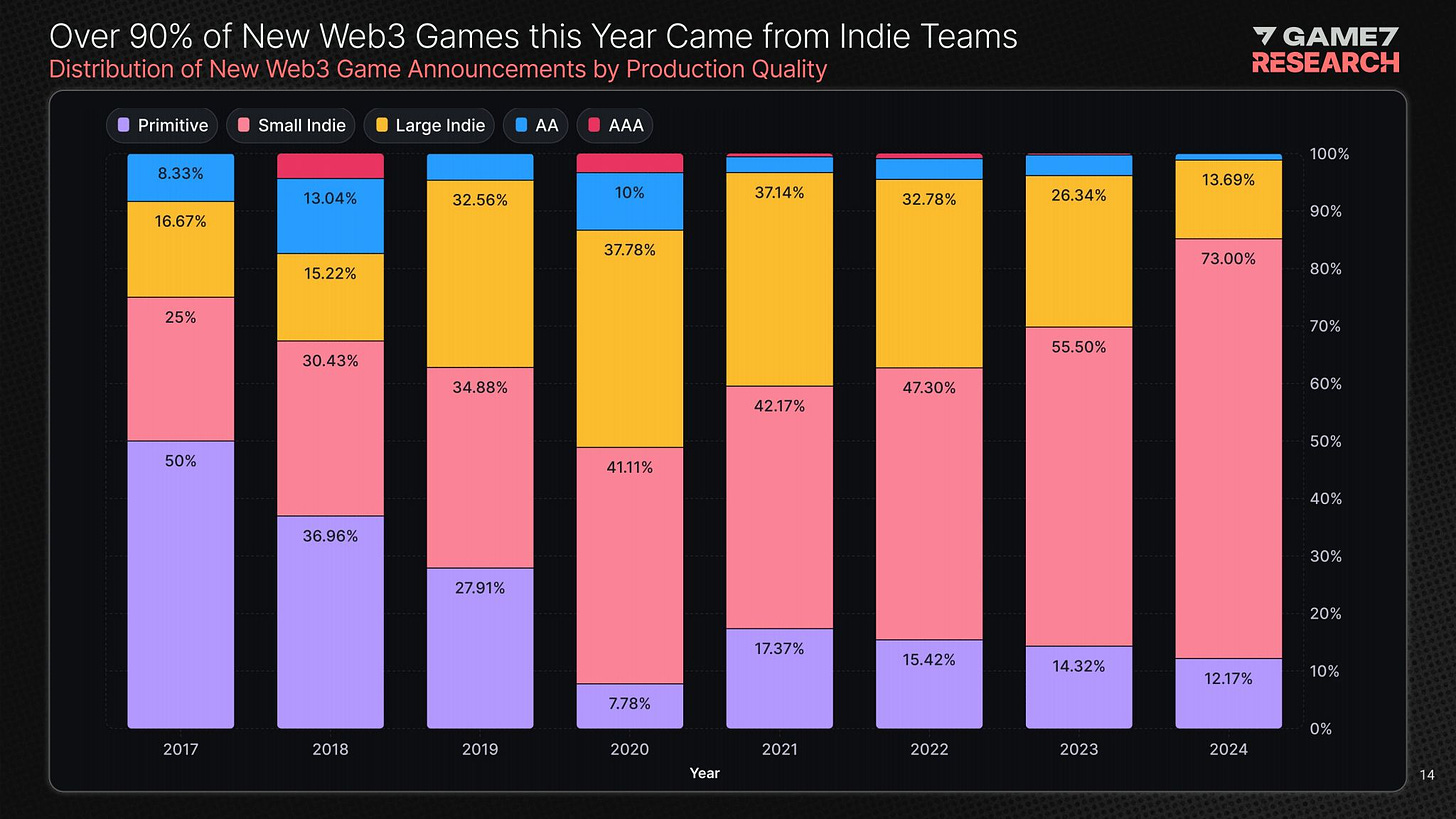
- 98.86% of all Web3 games are indie, according to Game7 Research classification. Primitive - projects at the "concept verification" stage. Small indie - games made by small teams without external funding. Large indie - games that received up to $10M in funding. AA - games with budgets from $10 to $25M. AAA - games with budgets from $25M.
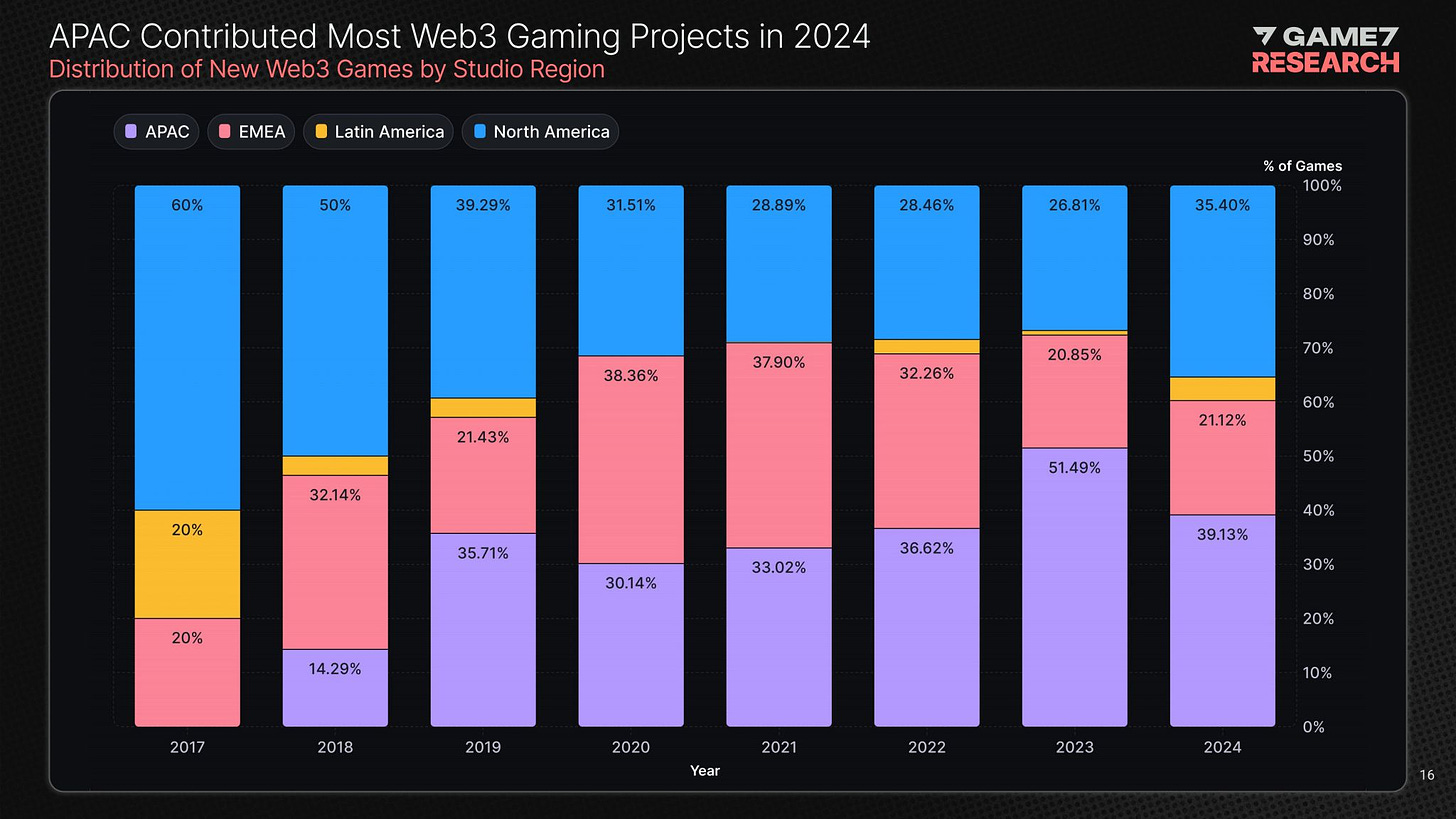
- In 2024, there were more developers from North America; the number of Web3 project creators from Latin America increased. At the same time, the share of APAC developers decreased significantly.
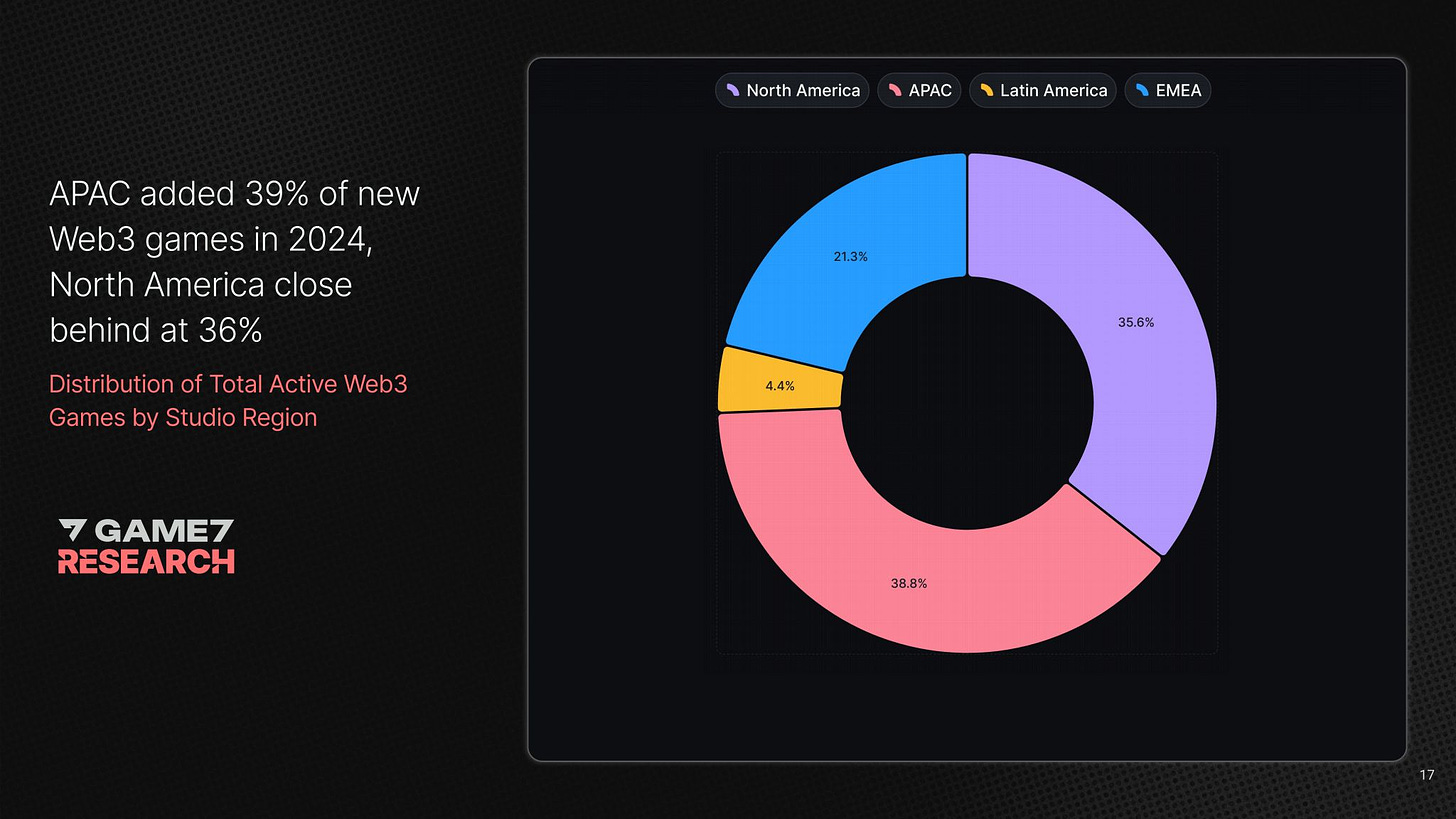
- However, if we consider all active Web3 studios, most of them are located in the APAC region (38.8% of all developers). North America is in second place (35.6%).
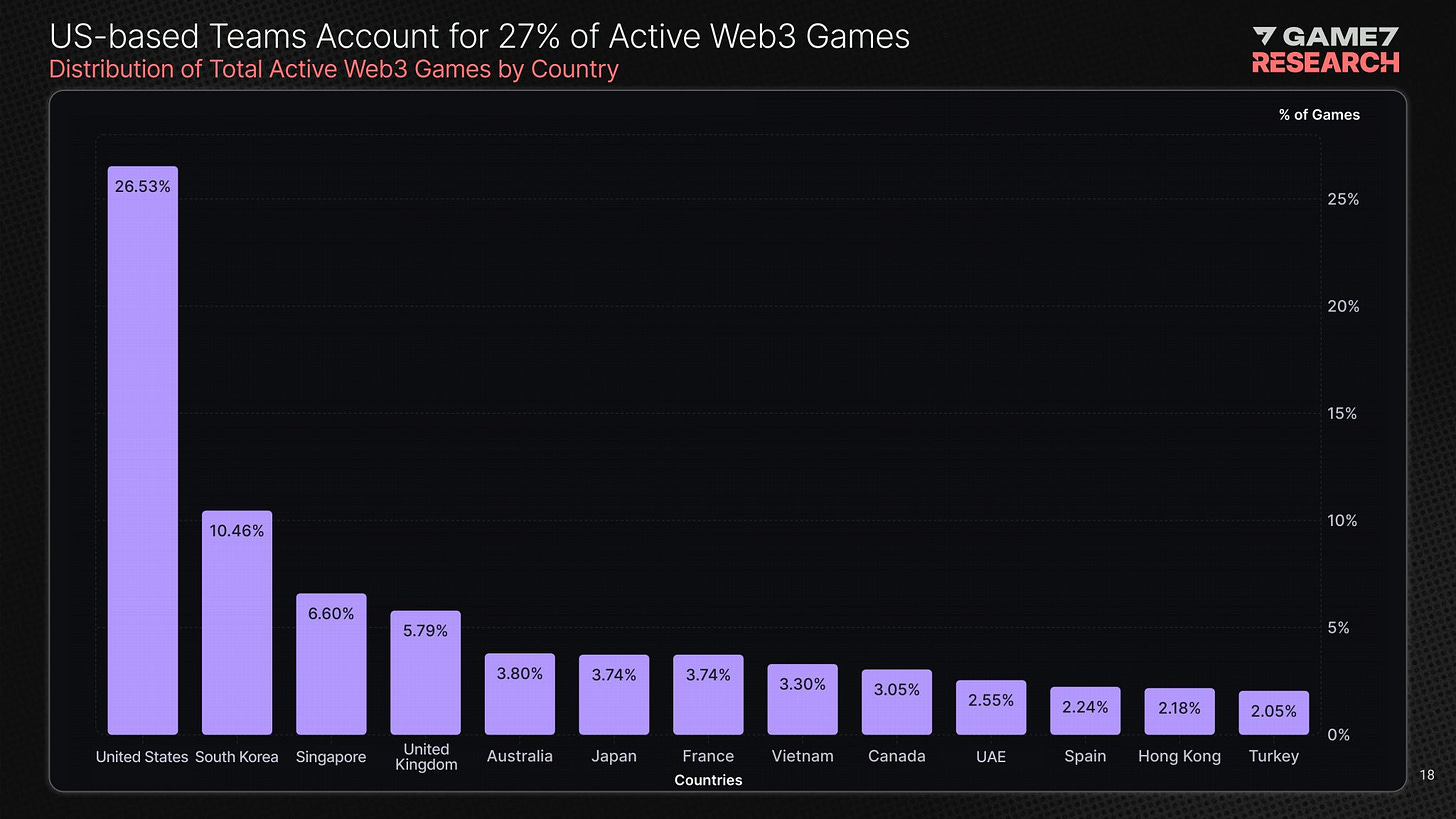
- If we look at active games, most of their developers (26.53%) are based in the USA. The country leads by a large margin.
- Regarding genres, there's a noticeable increase in interest in casual games (the share of announced projects has doubled over 4 years). The number of Simulation games has increased.
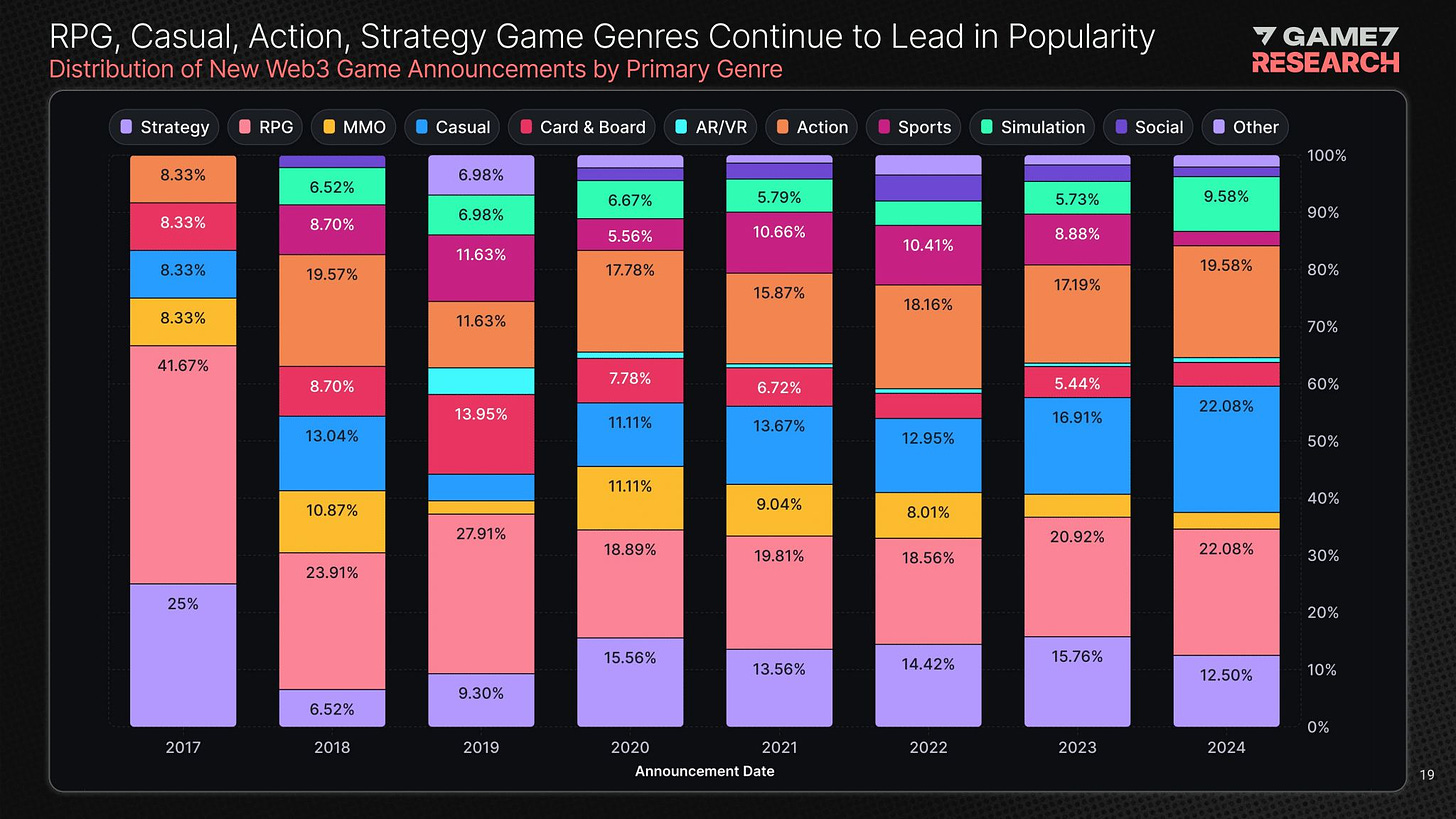
❗️I've heard the opinion that the Web3 market is now returning to simpler games to reach as wide an audience as possible.
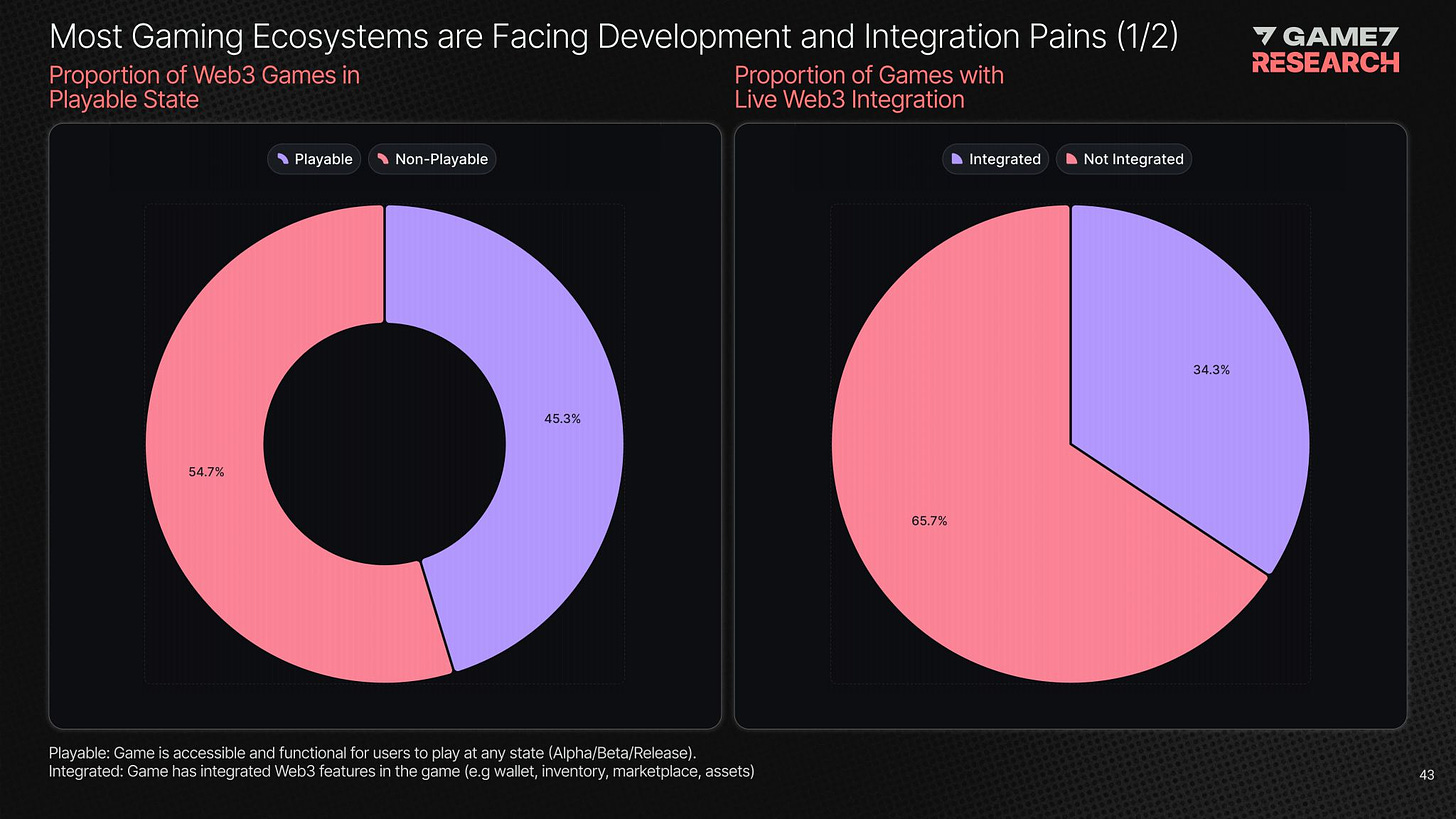
- Only 45.3% of announced Web3 games are currently playable. 65.7% of all announced projects still don't have Web3 integration.
Platforms and Distribution
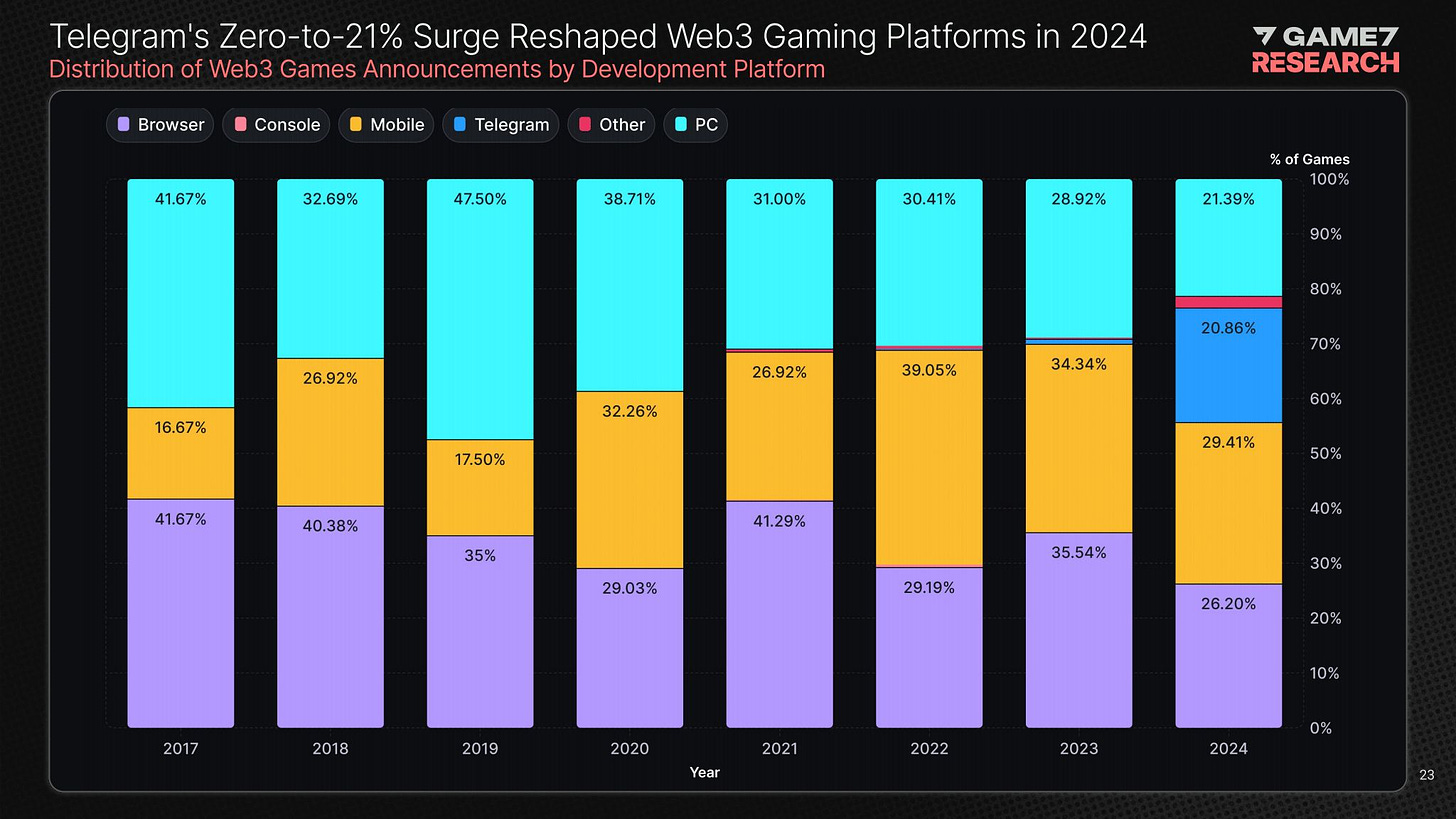
- Telegram is the breakthrough of 2024 in terms of platforms. In 2024, it took a 20.86% share. Many developers are using Telegram to bypass platform restrictions.
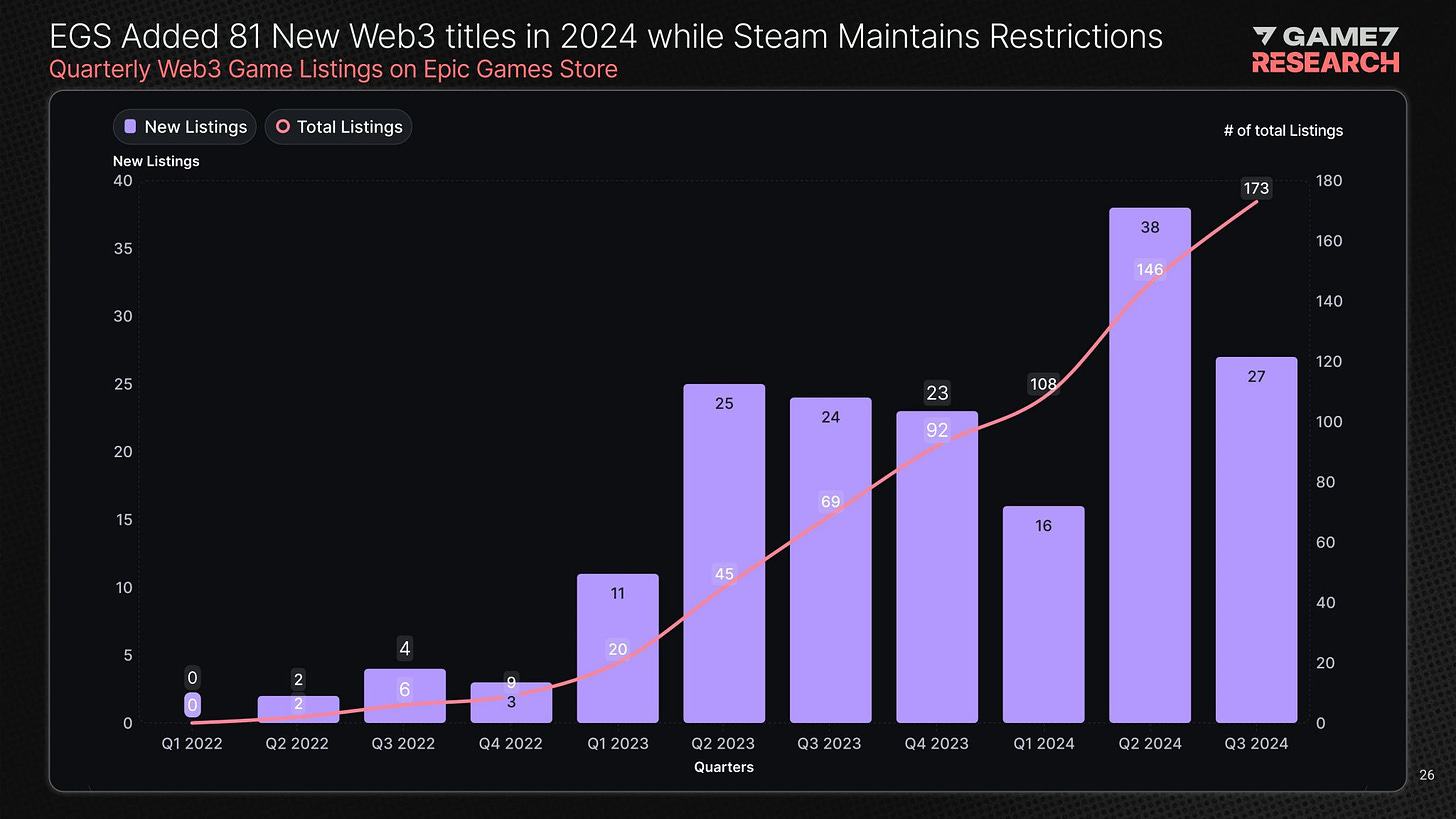
- In the Epic Games Store, 81 new Web3 games were added in 2024. Industry representatives also have hopes for the launch of the mobile EGS.
- The recent launch of Off the Grid demonstrated that Web3 projects can be launched on consoles, despite the non-native integration of Web3 elements.
Blockchain Technologies
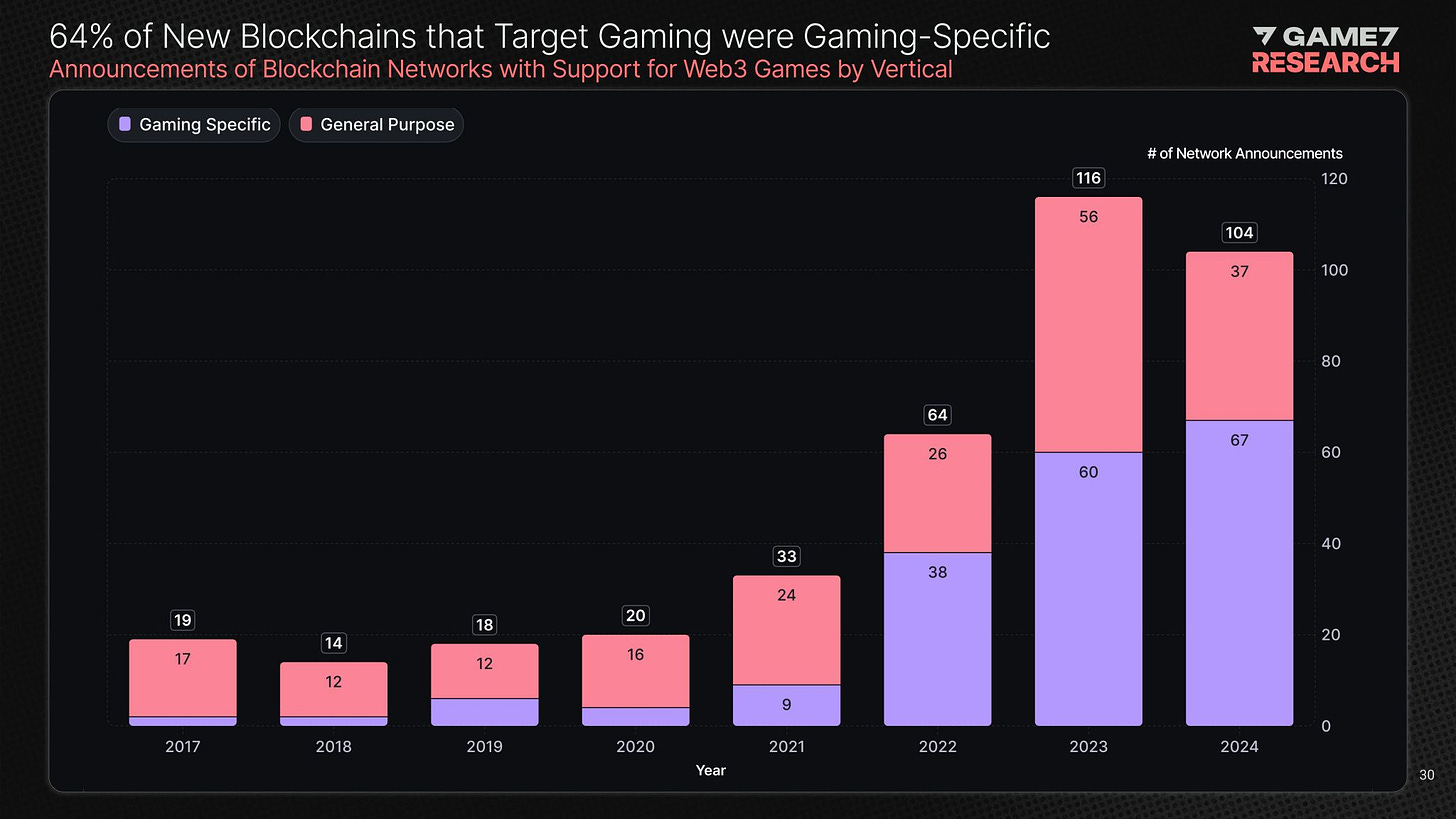
- In 2024, 104 new blockchain networks were launched. 67 of them are focused on games.
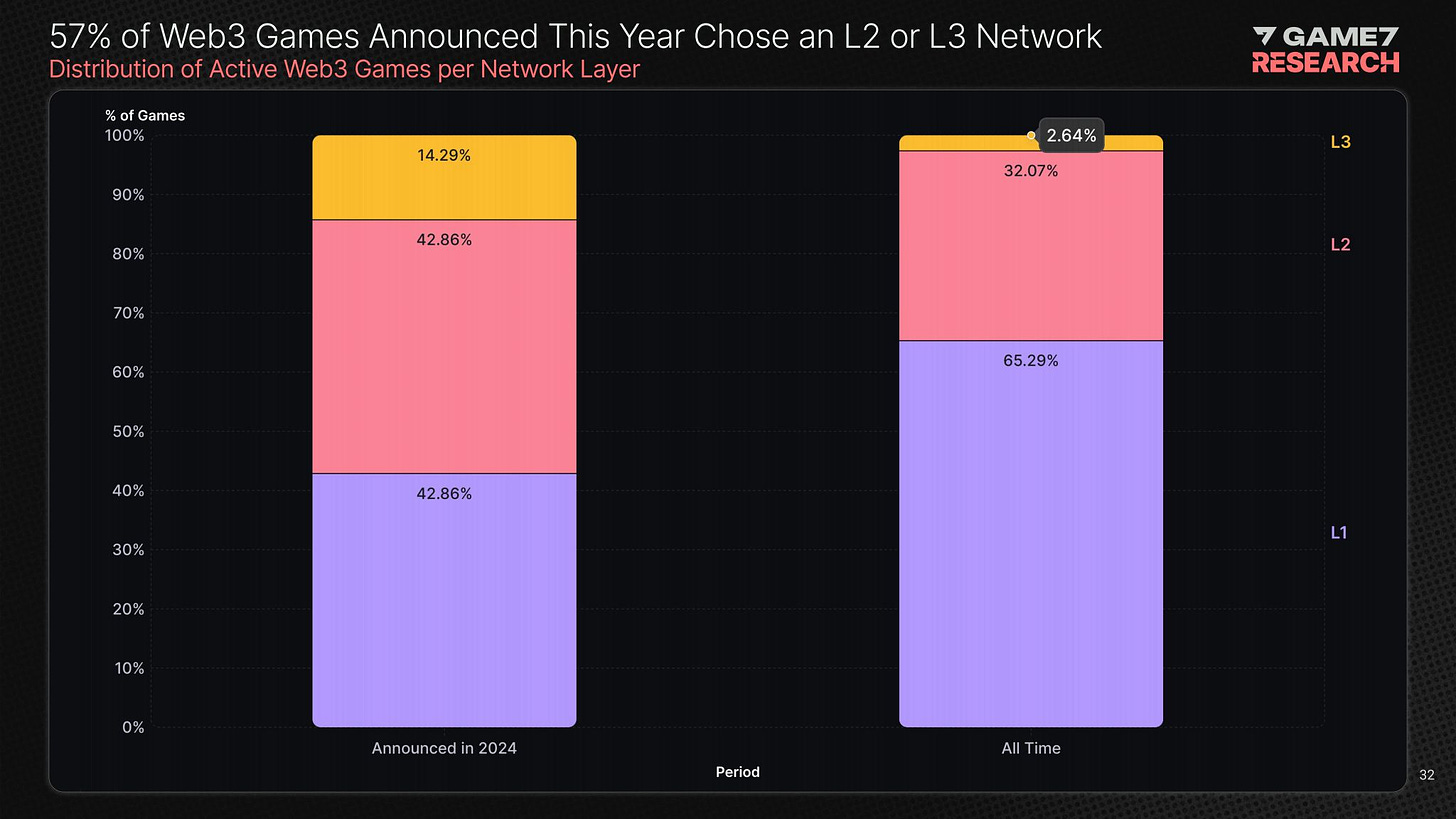
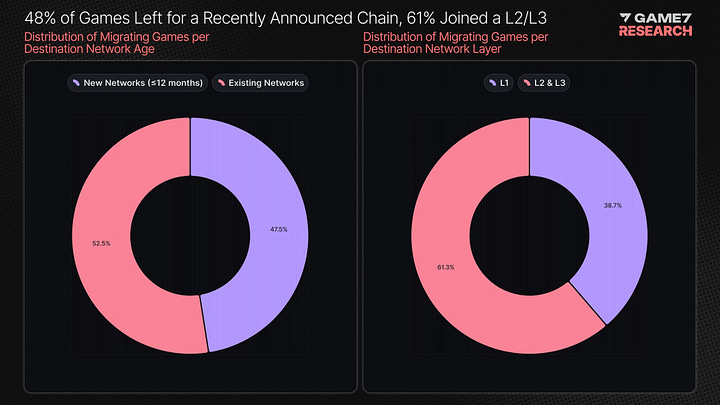
- The majority of launched networks are Layer 2 (35%) and Layer 3 (41.67%).
- 57% of Web3 games announced this year chose to use Layer 2 (42.86%) or Layer 3 (14.29%) networks.
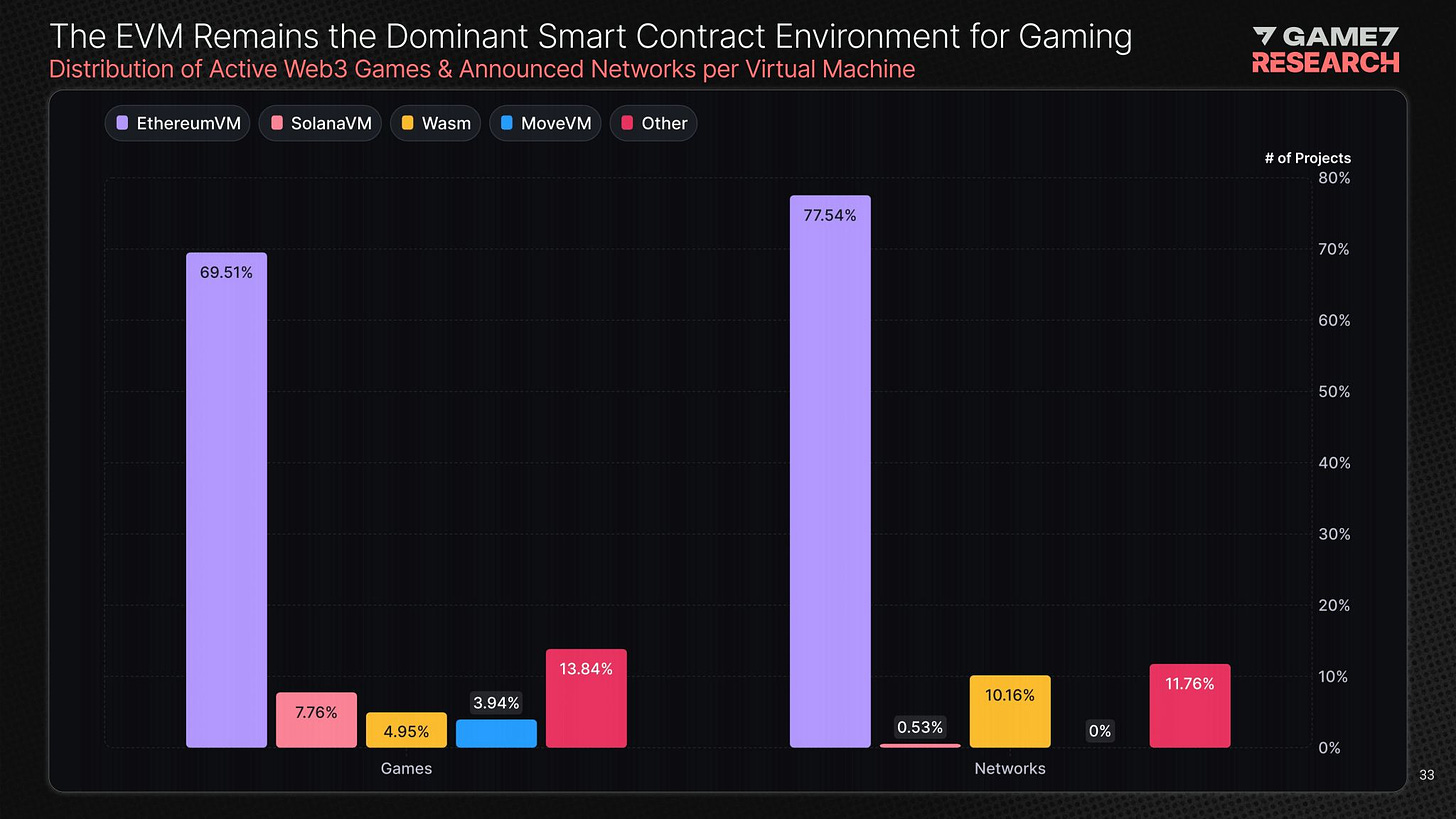
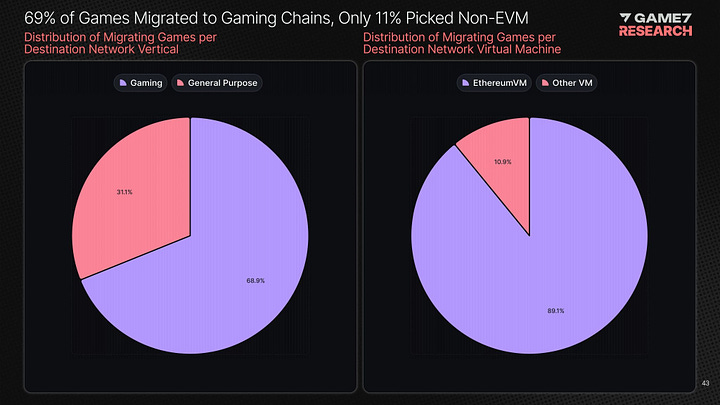
- EthereumVM remains the foundation for smart contracts in the gaming environment - it's used by almost 70% of projects.
Blockchain Ecosystems
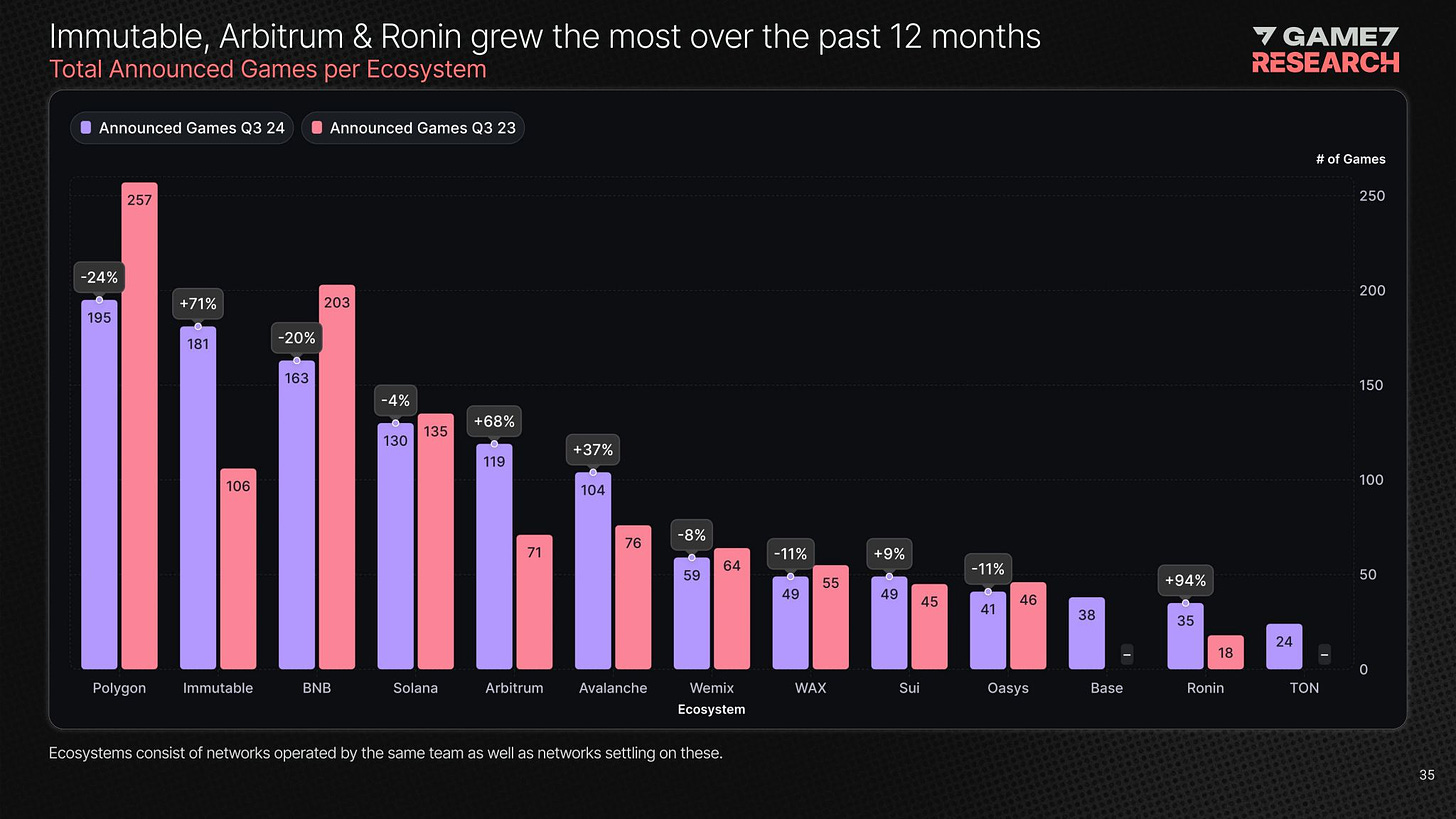
- Over the past year, Immutable, Arbitrum, and Ronin have grown the most.
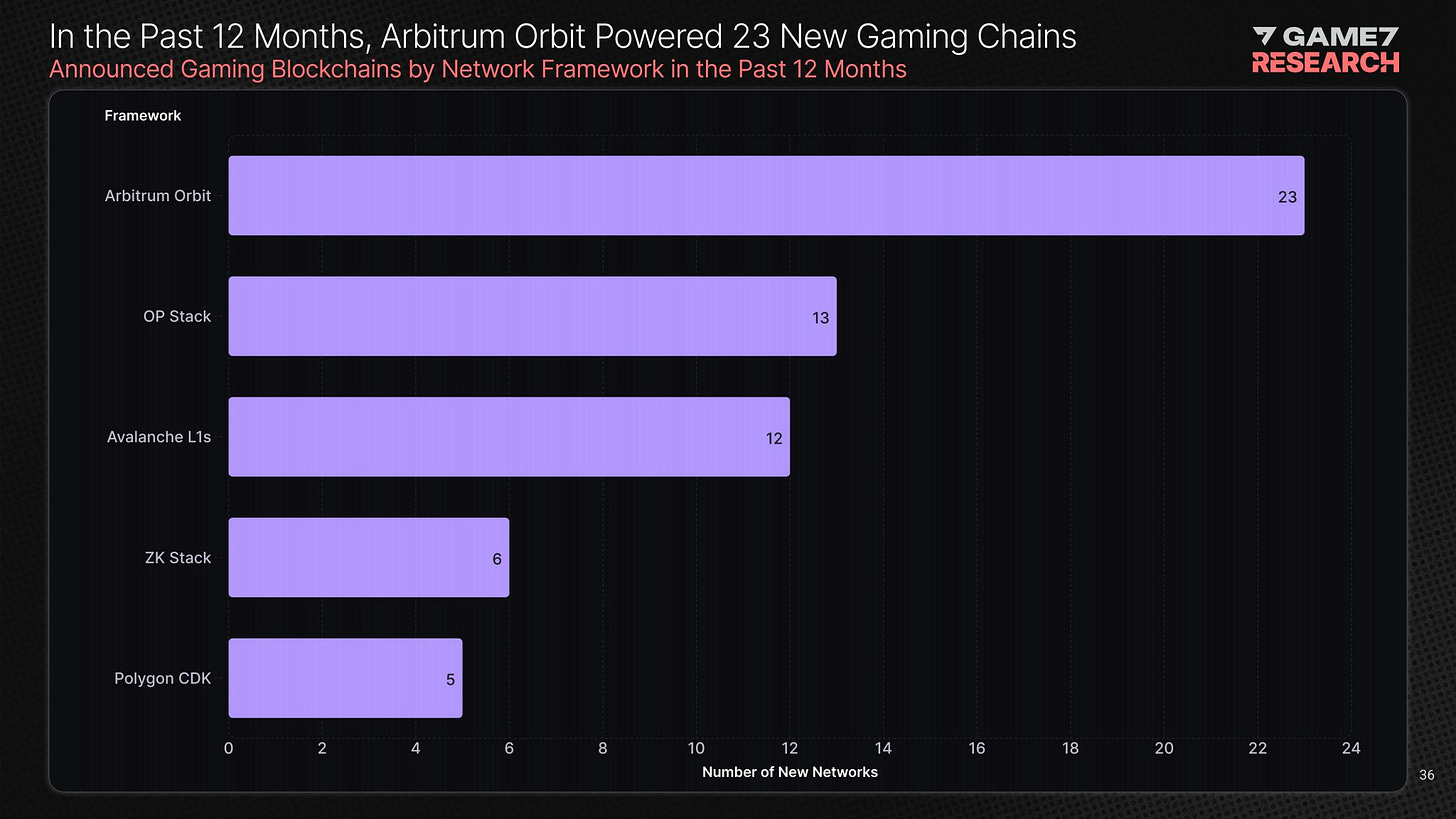
- 23 gaming blockchain networks of levels 2 or 3 were built on Arbitrum Orbit in 2024.
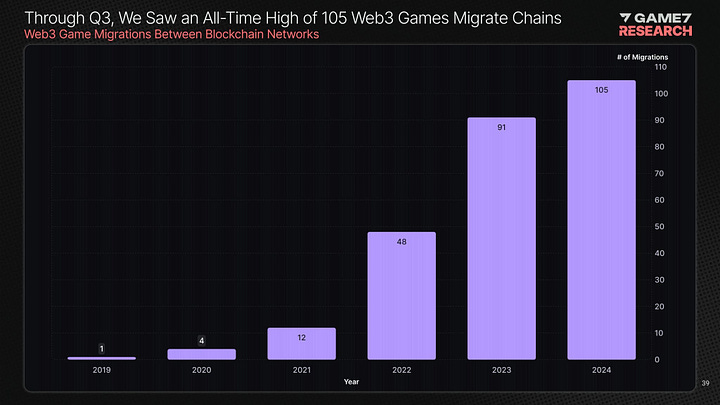
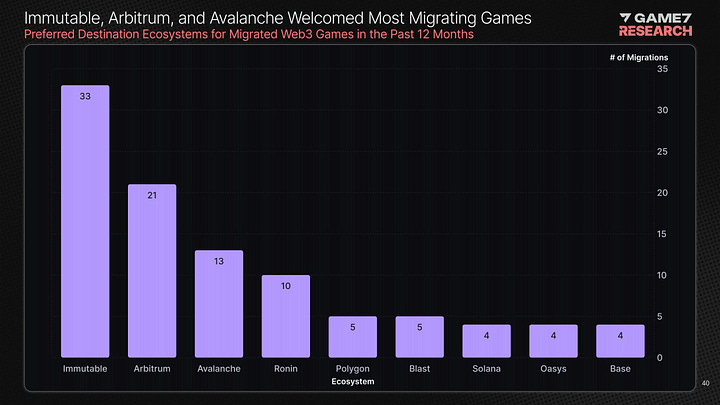
- It's evident that in 2023 and 2024, developers began actively migrating to new blockchains. In 2024, there were 105 migrations, with Immutable, Arbitrum, Avalanche leading.
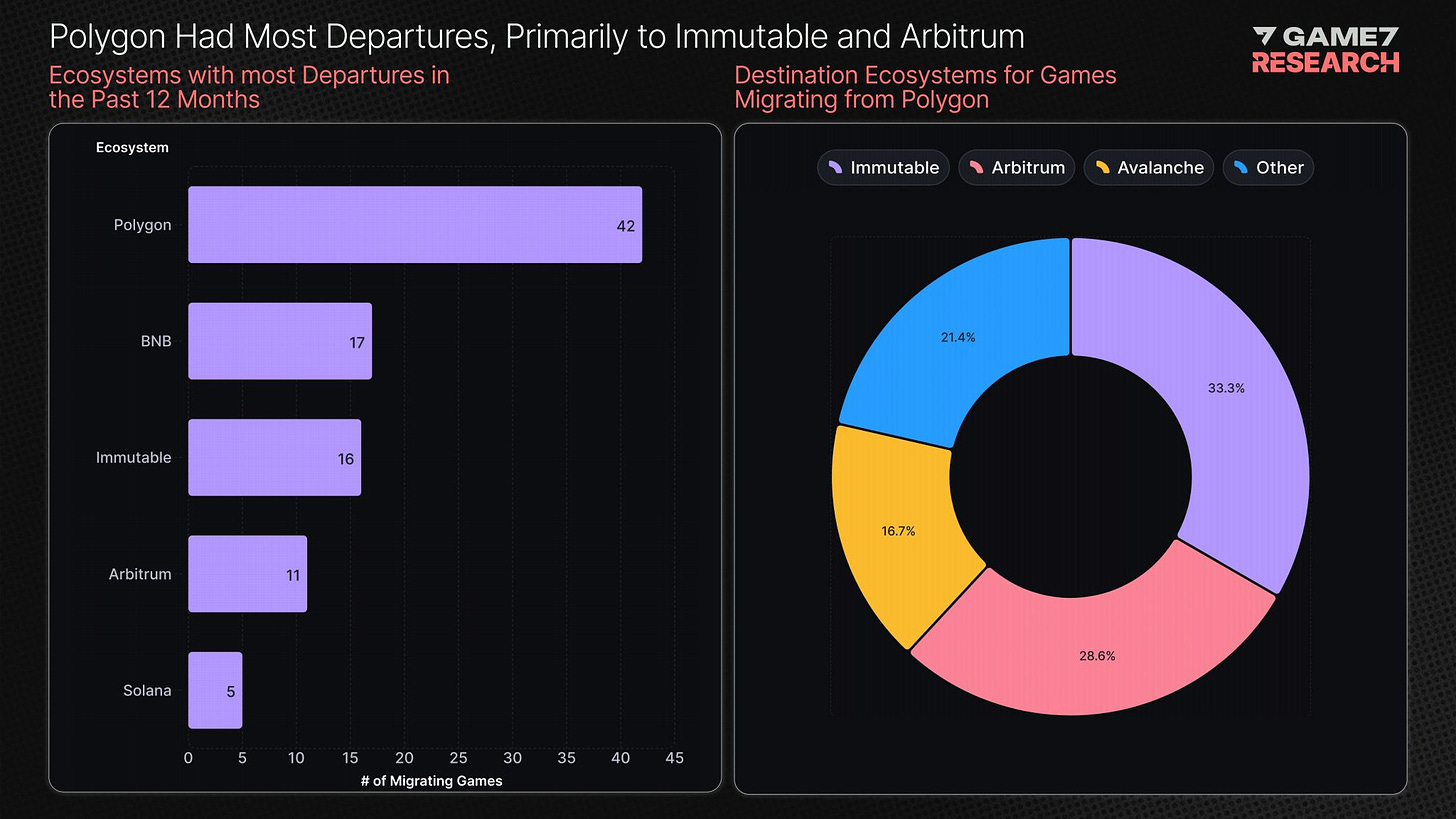
- The largest number of migrations came from Polygon (more than a third of the total).
- 48% of games switched to a new blockchain. 61% joined L2, L3 blockchains.
Funding and Tokens
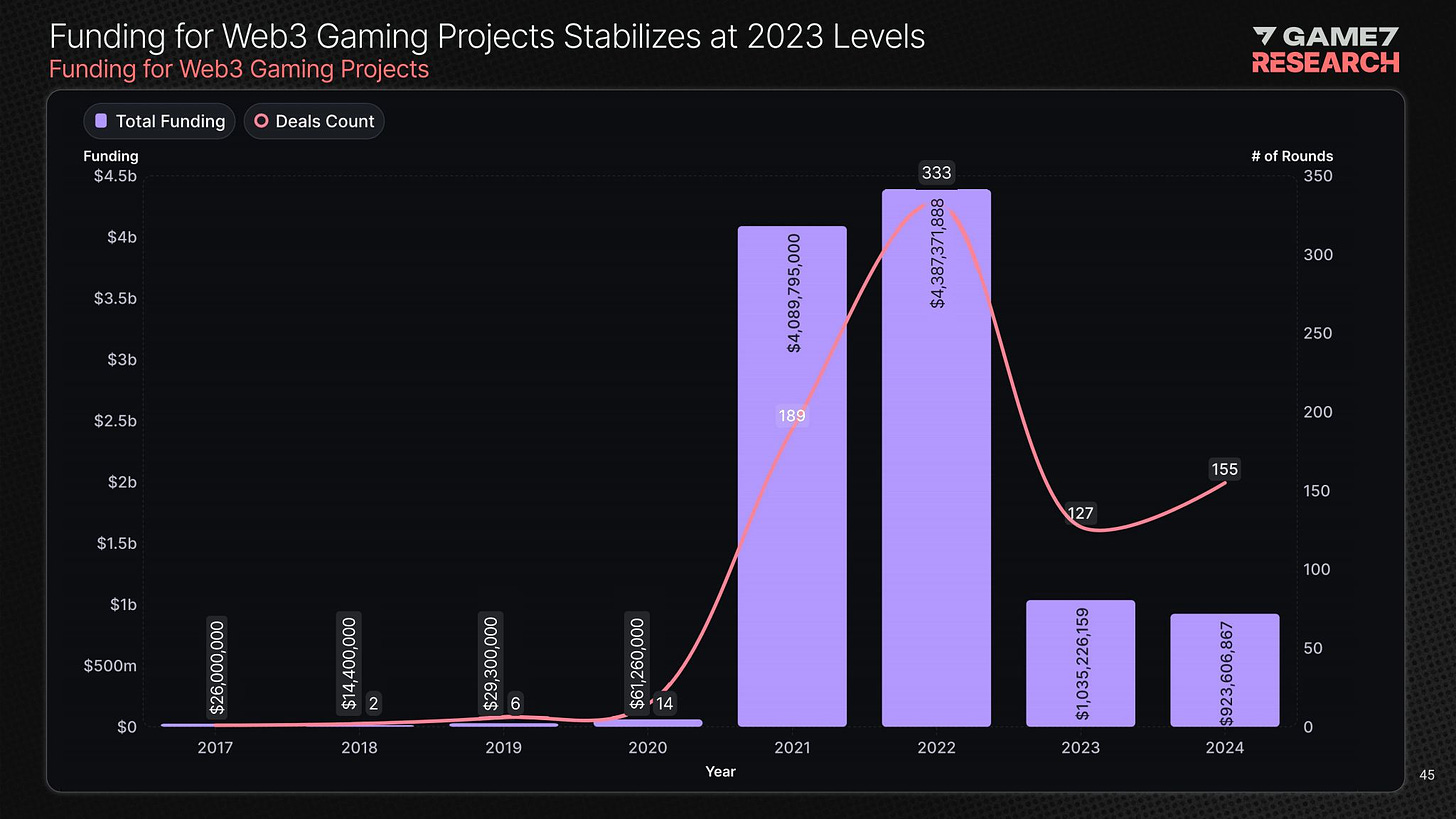
- Funding for Web3 gaming projects decreased significantly compared to 2021 and 2022. The number of deals in 2024 increased, but their volume decreased.
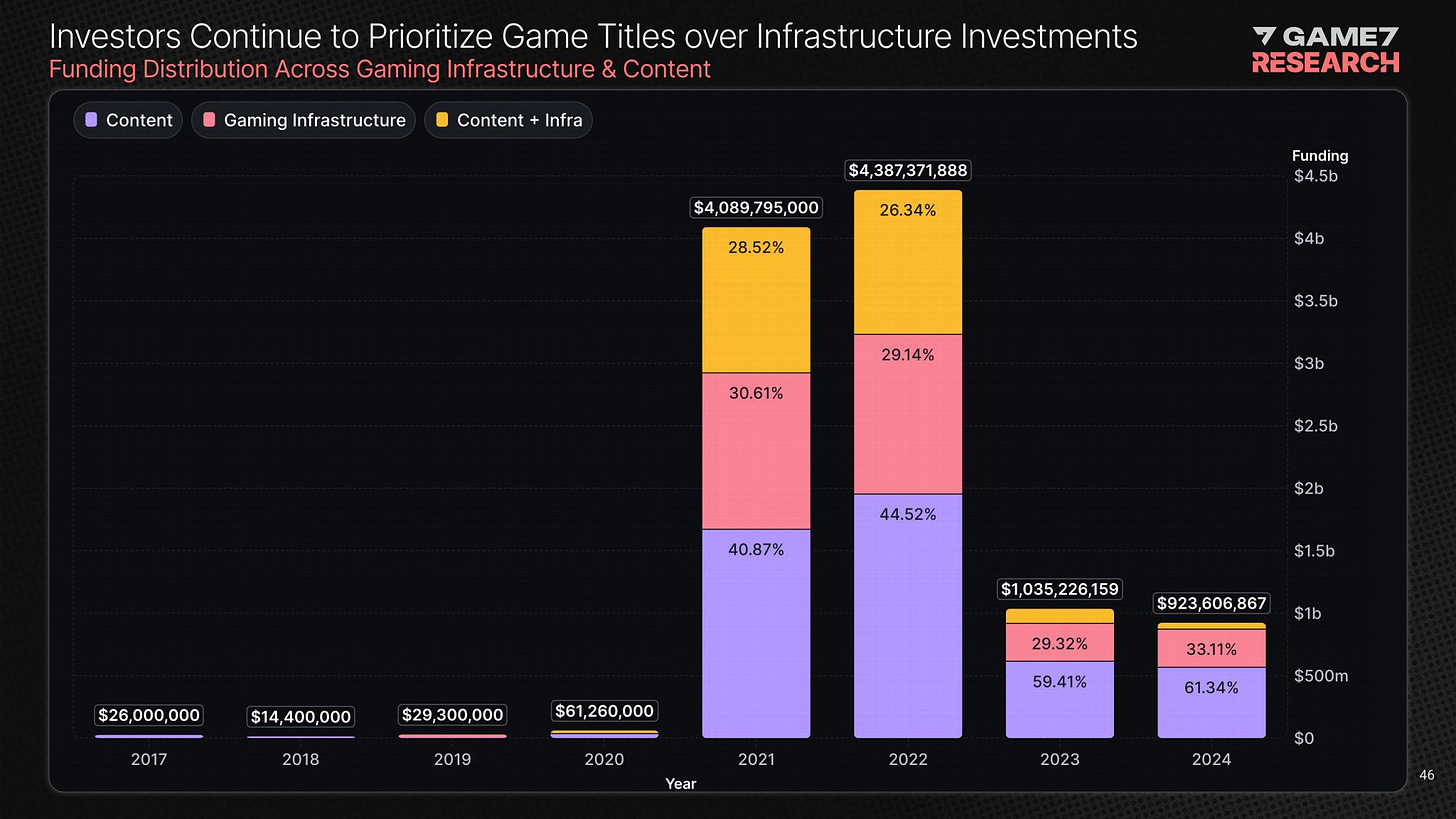
- Investors still prefer to invest in games - they account for 61.34% of all funds. 33.11% is spent on infrastructure.
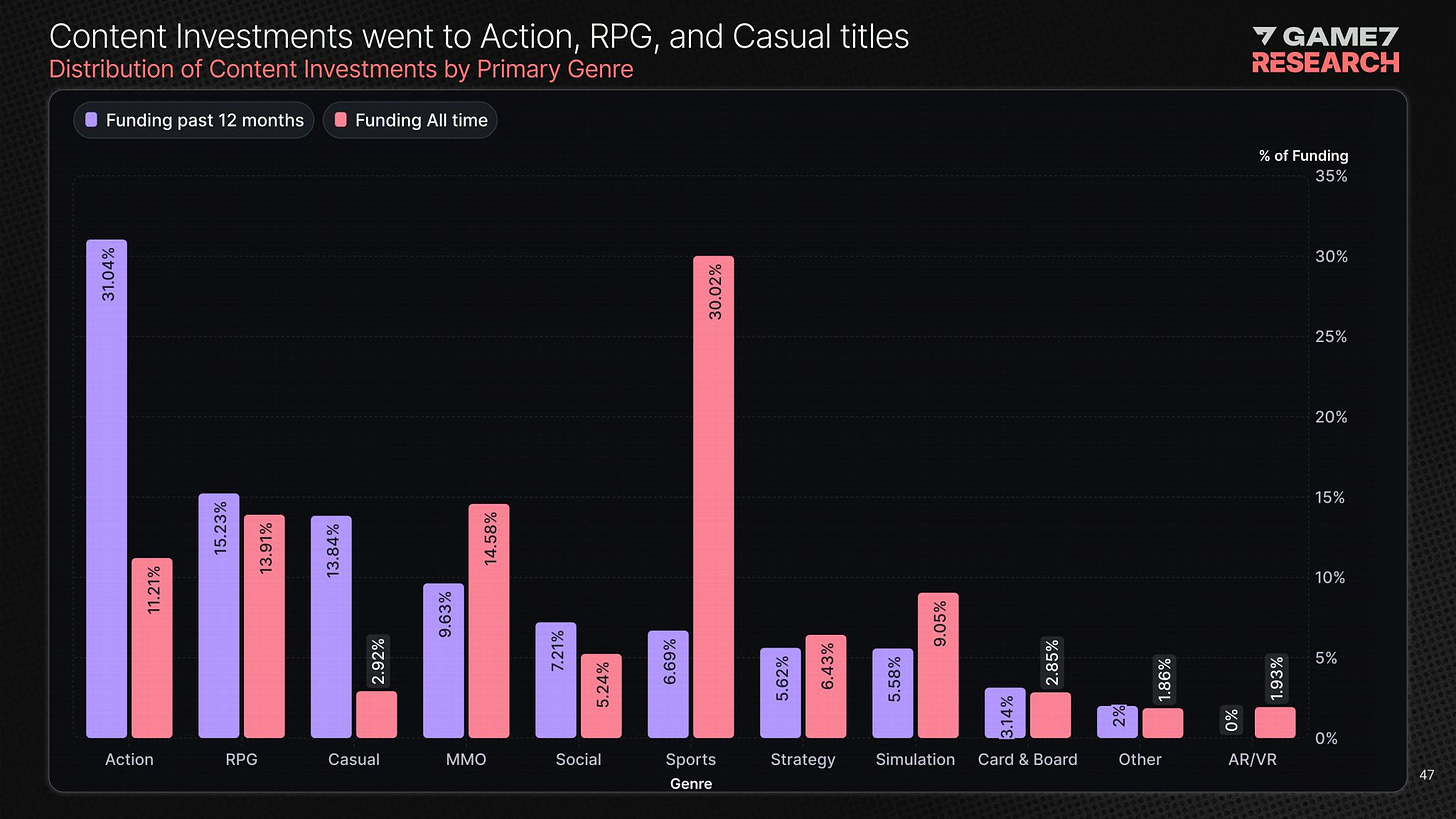
- Over the past 12 months, the most funds were invested in action games (31.04%), RPGs (15.23%), and casual games (13.84%). The graph shows a noticeable increase in the popularity of action games and casual projects.
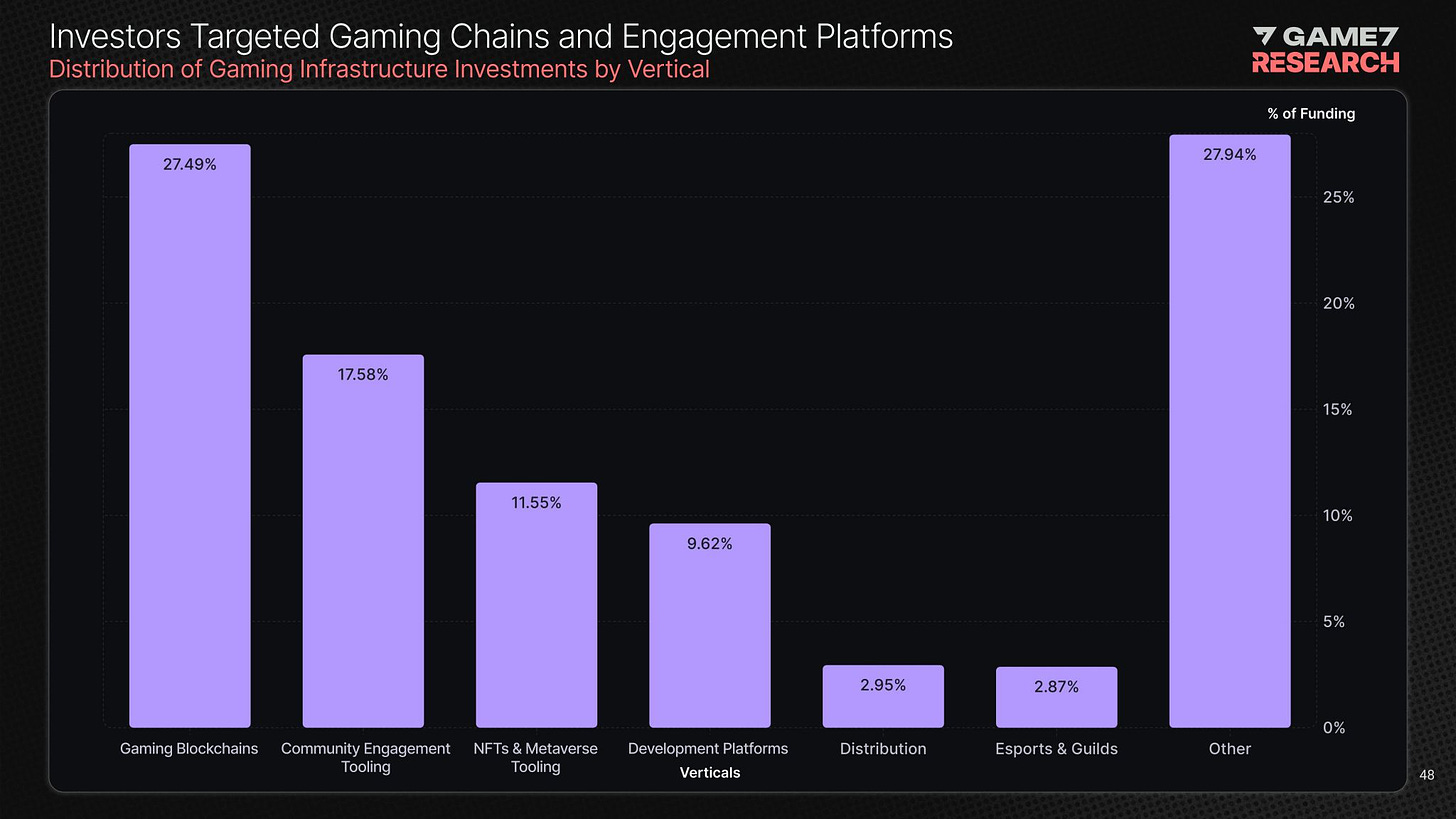
- When considering investments in ecosystem products, investors are most interested in gaming blockchains (27.49%). As well as user engagement tools (17.58%).
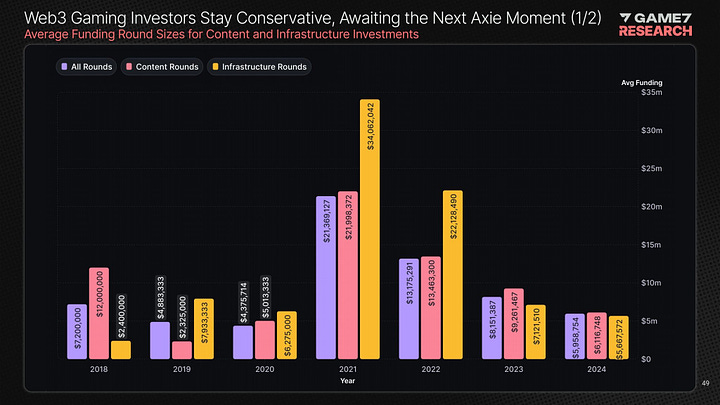
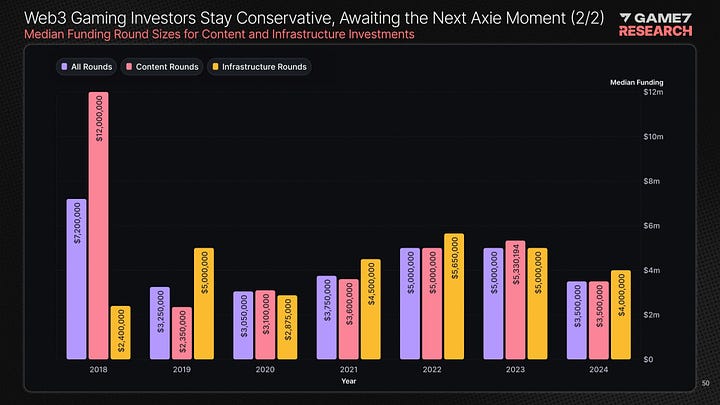
- Average and median round sizes continue to decline.
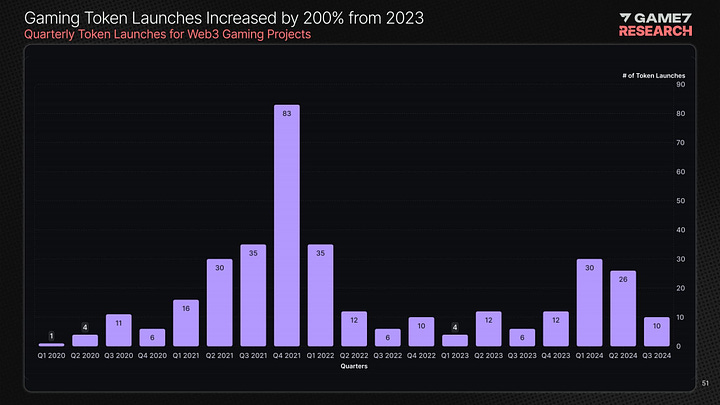
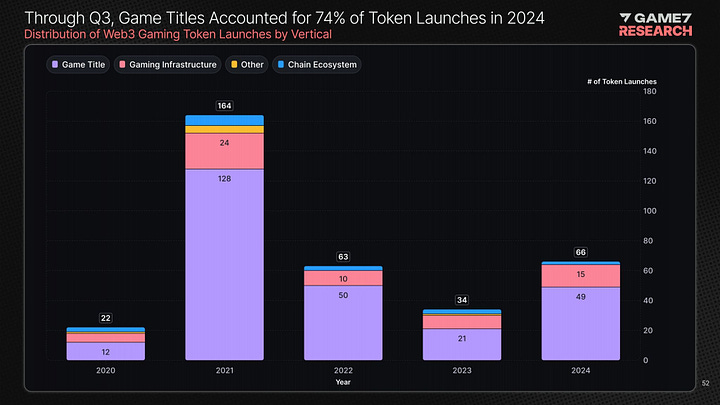
The number of tokens launched in the last 12 months increased by 200% compared to 2023. 74% of all launches occurred in Q3'24.
Stay tuned for more updates next month!
Meanwhile, you can check out our free demo to see how devtodev can help your game project succeed.


